Article

Assessment of the Impacts of Spatial Water Resource Variability on Energy Planning in the Ganges River Basin under Climate Change Scenarios

1
Integrated Sustainability Center, Institute for Global Environmental Strategies, Kanagawa 240-0115, Japan
2
Department of Atmospheric Science, School of Earth Sciences, Central University of Rajasthan, Rajasthan 305817, India
*
Authors to whom correspondence should be addressed.
Sustainability 2021, 13(13), 7273; https://doi.org/10.3390/su13137273
Submission received: 29 May 2021 / Revised: 22 June 2021 / Accepted: 24 June 2021 / Published: 29 June 2021

Abstract

:
Availability of water in the Ganges River basin has been recognized as a critical regional issue with a significant impact on drinking water supply, irrigation, as well as on industrial development, and ecosystem services in vast areas of South Asia. In addition, water availability is also strongly linked to energy security in the region. Hence, quantification of spatial availability of water resources is necessary to bolster reliable evaluation of the sustainability of future thermal power plants in the Ganges River basin. This study focuses on the risks facing existing and planned power plants regarding water availability, applying climate change scenarios at the sub-basin and district level up to 2050. For this purpose, this study develops an integrated assessment approach to quantify the water-energy nexus in four selected sub-basins of the Ganges, namely, Chambal, Damodar, Gandak, and Yamuna. The results of simulations using Soil and Water Assessment Tools (SWAT) showed that future water availability will increase significantly in the Chambal, Damodar, and Gandak sub-basins during the wet season, and will negligibly increase in the dry season, except for the Yamuna sub-basin, which is likely to experience a decrease in available water in both wet and dry seasons under the Representative Concentration Pathway (RCP) 8.5 scenario. Changes in the water supply-demand ratio, due to climate change, indicated that water-related risks for future power plants would reduce in the Chambal and Damodar sub-basins, as there would be sufficient water in the future. For 19 out of 23 districts in the Chambal sub-basin, climate change will have a moderate-positive to high-positive impact on reducing the water risk for power plants by 2050. In contrast, existing and future power plants in the Yamuna and Gandak sub-basins will face increasing water risks. The proposed new thermal power installations, particularly in the Gandak sub-basin, are likely to face serious water shortages, which will adversely affect the stability of their operations. These results will stimulate and guide future research work to optimize the water-energy nexus, and will inform development and planning organizations, energy planning organizations, as well as investors, concerning the spatial distribution of water risks for future power plants so that more accurate decisions can be made on the location of future power plants.

1. Introduction

Home to 600 million people, the Ganges is the most populous river basin in the world [1]. The Ganges River basin (GRB) is a strategically important river basin for all riparian countries, including Bangladesh, India, and Nepal, as more than 40% of people directly or indirectly relying on the water of this river for drinking, agriculture, energy generation purposes [2]. For instance, this river basin accounts for 25% of India’s water resources, and more than 50% of irrigated areas in India are situated in this basin [1]. A vast amount of water is used for energy generation purposes. The Ganges River supplies water to several thermal power plants with more than 50 GW generation capacity [3]. Therefore, any changes in water availability in the Ganges will have paramount impacts on the development and wellbeing of the region.
Water resources in the GRB were once abundant, but are now under increasing stress, due to the growing demand. The Ganges is shown as water-stressed as per the Falkenmark water stress index with 1039 cubic meters of water per capita [4]. In this river basin, about 20% of people live without access to safe drinking water [5]. During the non-monsoon period, limited water resources hardly allow cropping to 1.3 times the net sown area [6]. Furthermore, climate change may exacerbate water stress, due to its impacts on hydrological dynamics in the GRB. Regional climate change model studies in the GRB predict an increase in annual mean temperature [7], and a rising trend of seasonal maximum and minimum temperatures [8]. This rise in temperature will lead to various dynamic changes, including a greater evapotranspiration loss [9], shrinking glaciers [10,11], and increased rainfall that will lead to more water flow, but with greater variability [12].
GRB is one of the hotspots of economic development in the region. It accounted for USD 700 billion of the GDP of India [1]. The river basin caters to a 40% share of the total electricity generation capacity in the region [3]. However, per capita energy consumption in riparian countries comes to 310 kWh in Bangladesh, 805 kWh in India, and 139 kWh in Nepal, which are far below the world average of 3130 kWh [13]. This leaves room for a step-up of the growth of the electricity sector in India for decades to come. Nevertheless, the electricity fuel mix in the region is dominated by coal and gas-based thermal power that accounted for 73% of the total electricity generation capacity [14,15]. Given conventional cooling technology, thermal power plants (TPP) require a large amount of water for cooling purposes. With the availability of indigenous coal and gas resources in India and Bangladesh, it is envisaged that future power generation will rely heavily on thermal sources. However, the sustainability of thermal power generation will be seriously affected by the climate-induced variability of water resources [16]. For example, drought events between 2013 and 2016 forced a shutdown of 14 major power plants, due to scarcity of cooling water, which incurred at least USD1.4 billion in potential revenue loss [17]. It implied that water availability for thermal power generation is in jeopardy, and this situation poses a serious operational risk for power plants in this river basin.
There are ample studies in the region covering the issues of direct use of water in agriculture, human habitat, and in other sectors. There are also certain studies in the field of energy use for water withdrawal focusing on pumping efficiency improvement, etc. However, there is little systematic literature looking at quantifying the interactions between energy infrastructure and spatial water availability under the impacts of climate change. In this context, the study narrates how water scarcity can be a major threat to energy security in the sub-basins of the Ganges River. To the best of our knowledge, this is a pioneer study of the GRB that deals with the water-energy nexus, particularly dealing with the water risks of existing and planned power plants, while considering the plausible climate change impacts on spatial water availability. The study aimed to assist informed decision-making related to power plant planning in the Ganges sub-basin in India, considering the impacts from spatial water resource distribution and long-term climate change.

2. Materials and Methods
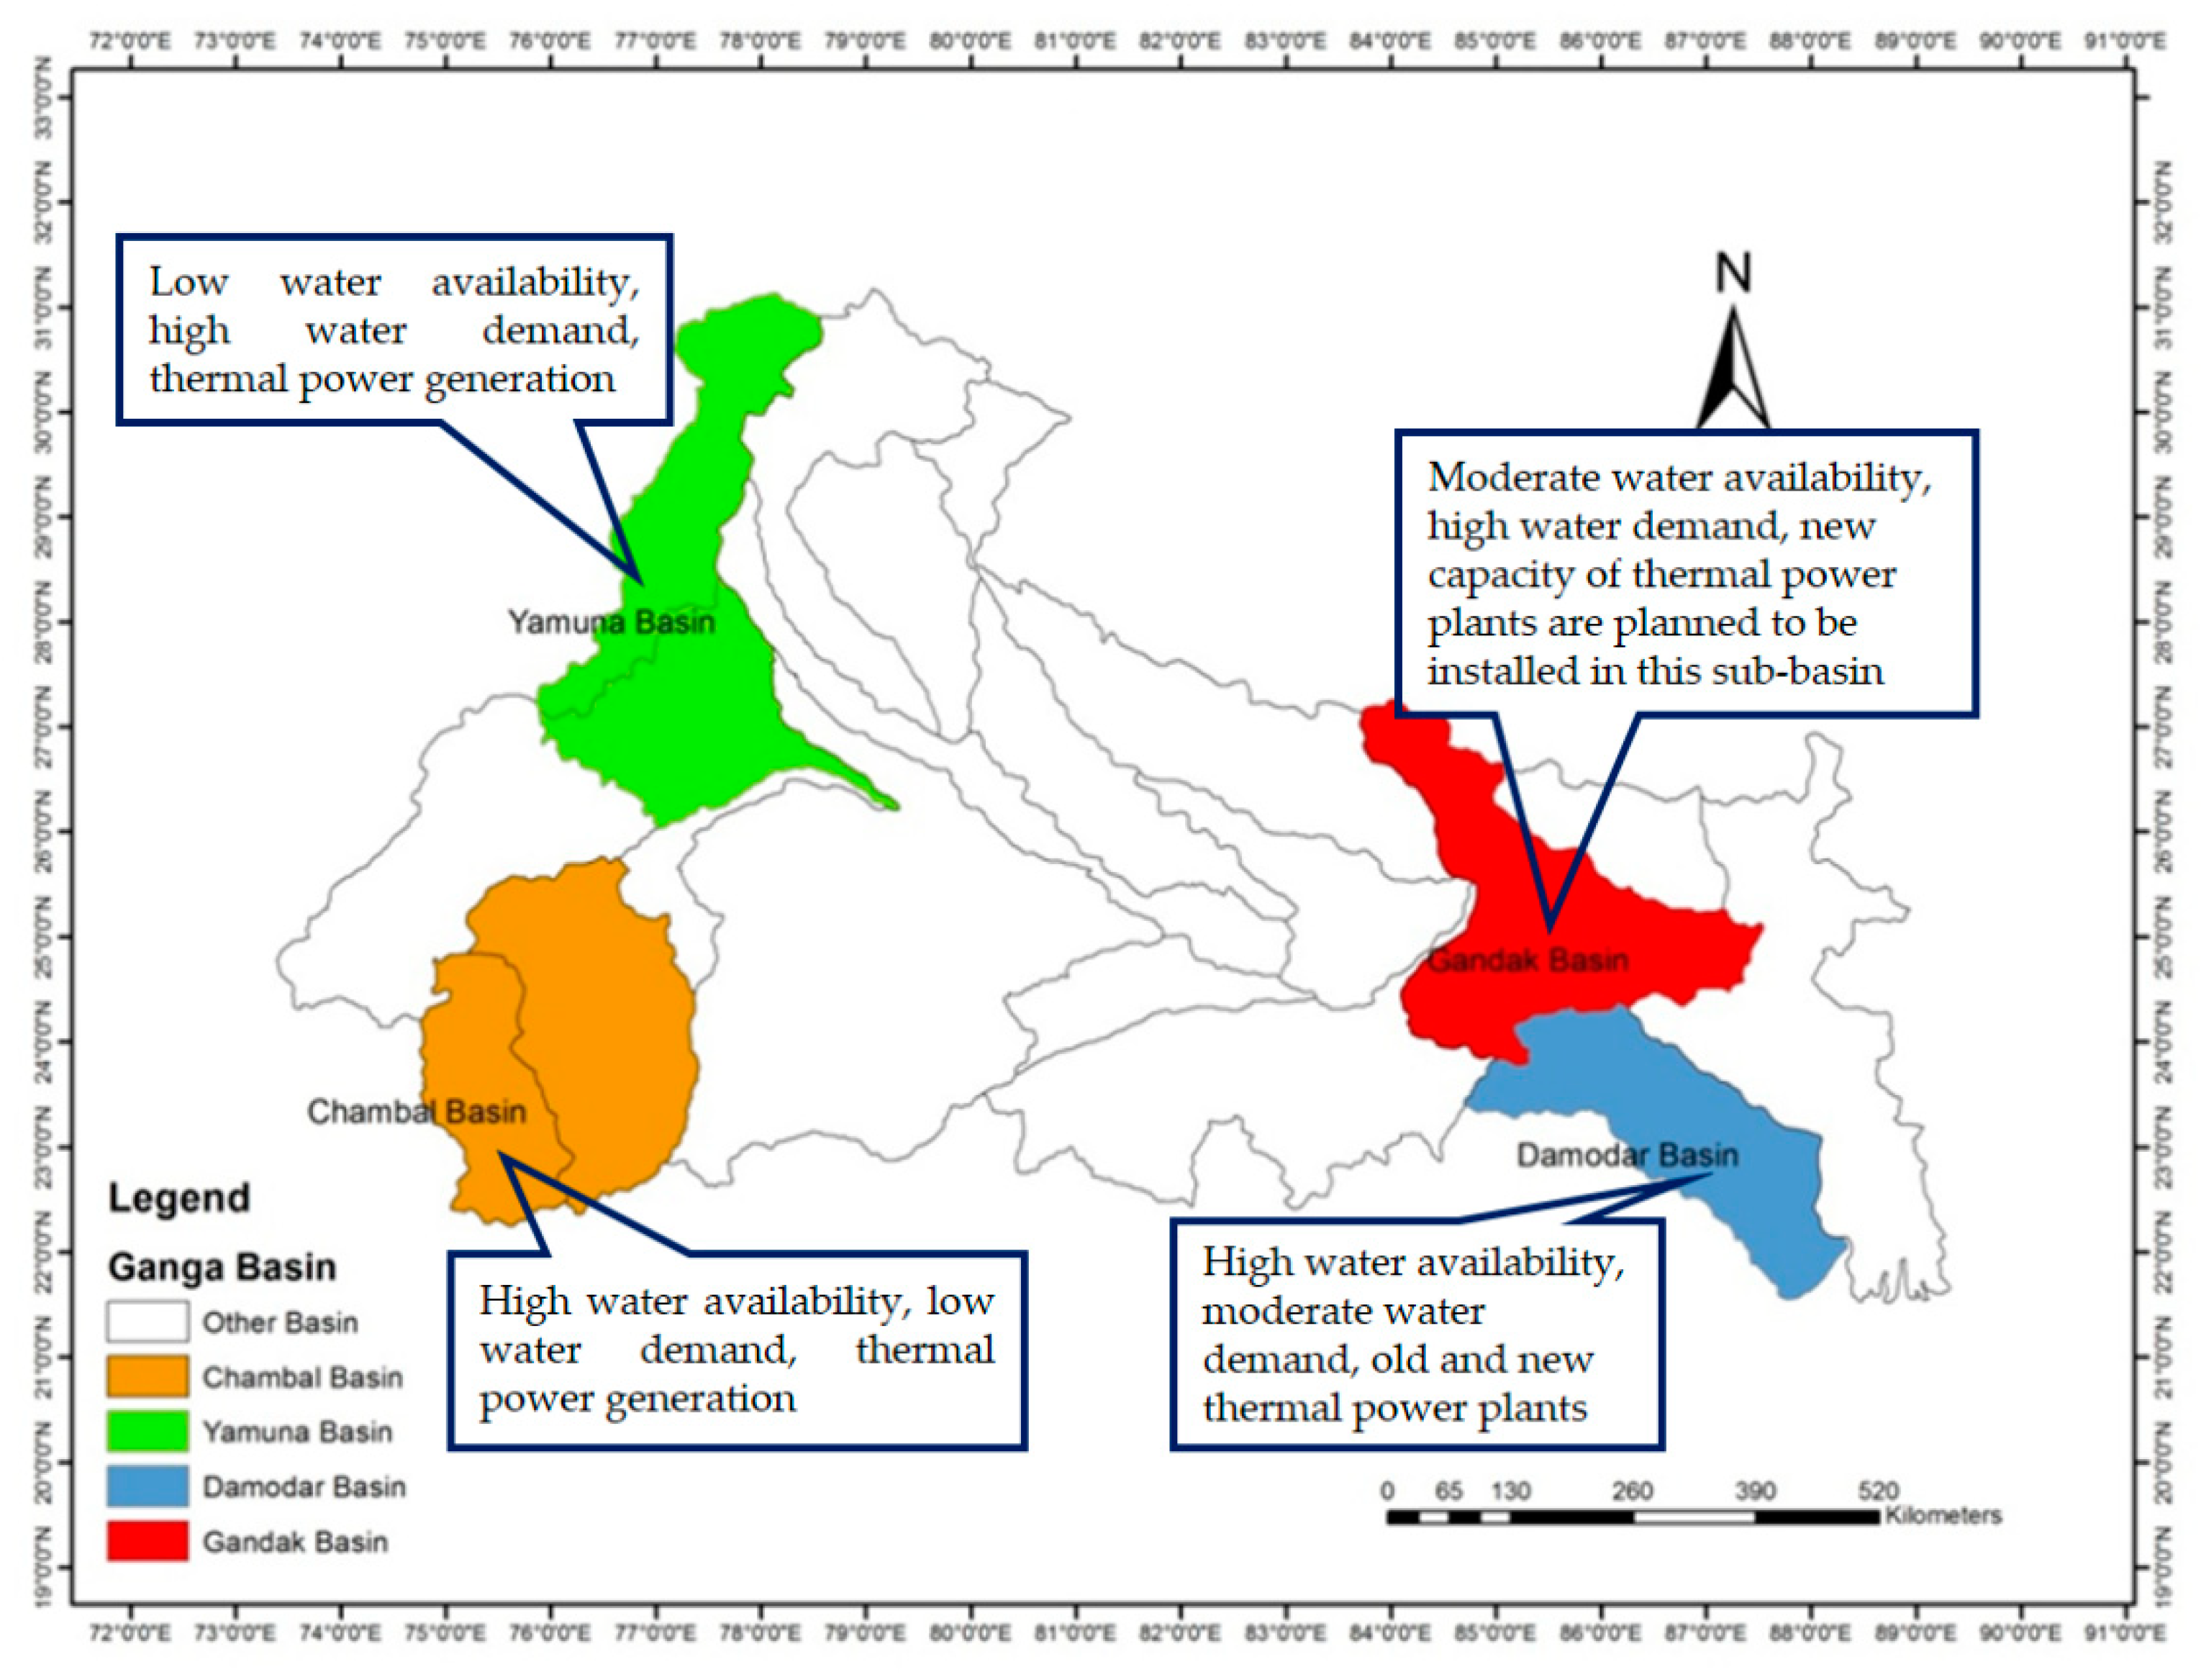
2.1. Study Area

For this study, we selected four sub-basins of the Ganga River basin in India, namely, Yamuna, Chambal, Gandak, and Damodar. These sub-basins were choose based on the key features, including water supply, water demand and installed capacity of the existing thermal power plants, and the proposed location of the new thermal power plants. Figure 1 shows the location and characteristics of the selected sub-basins.

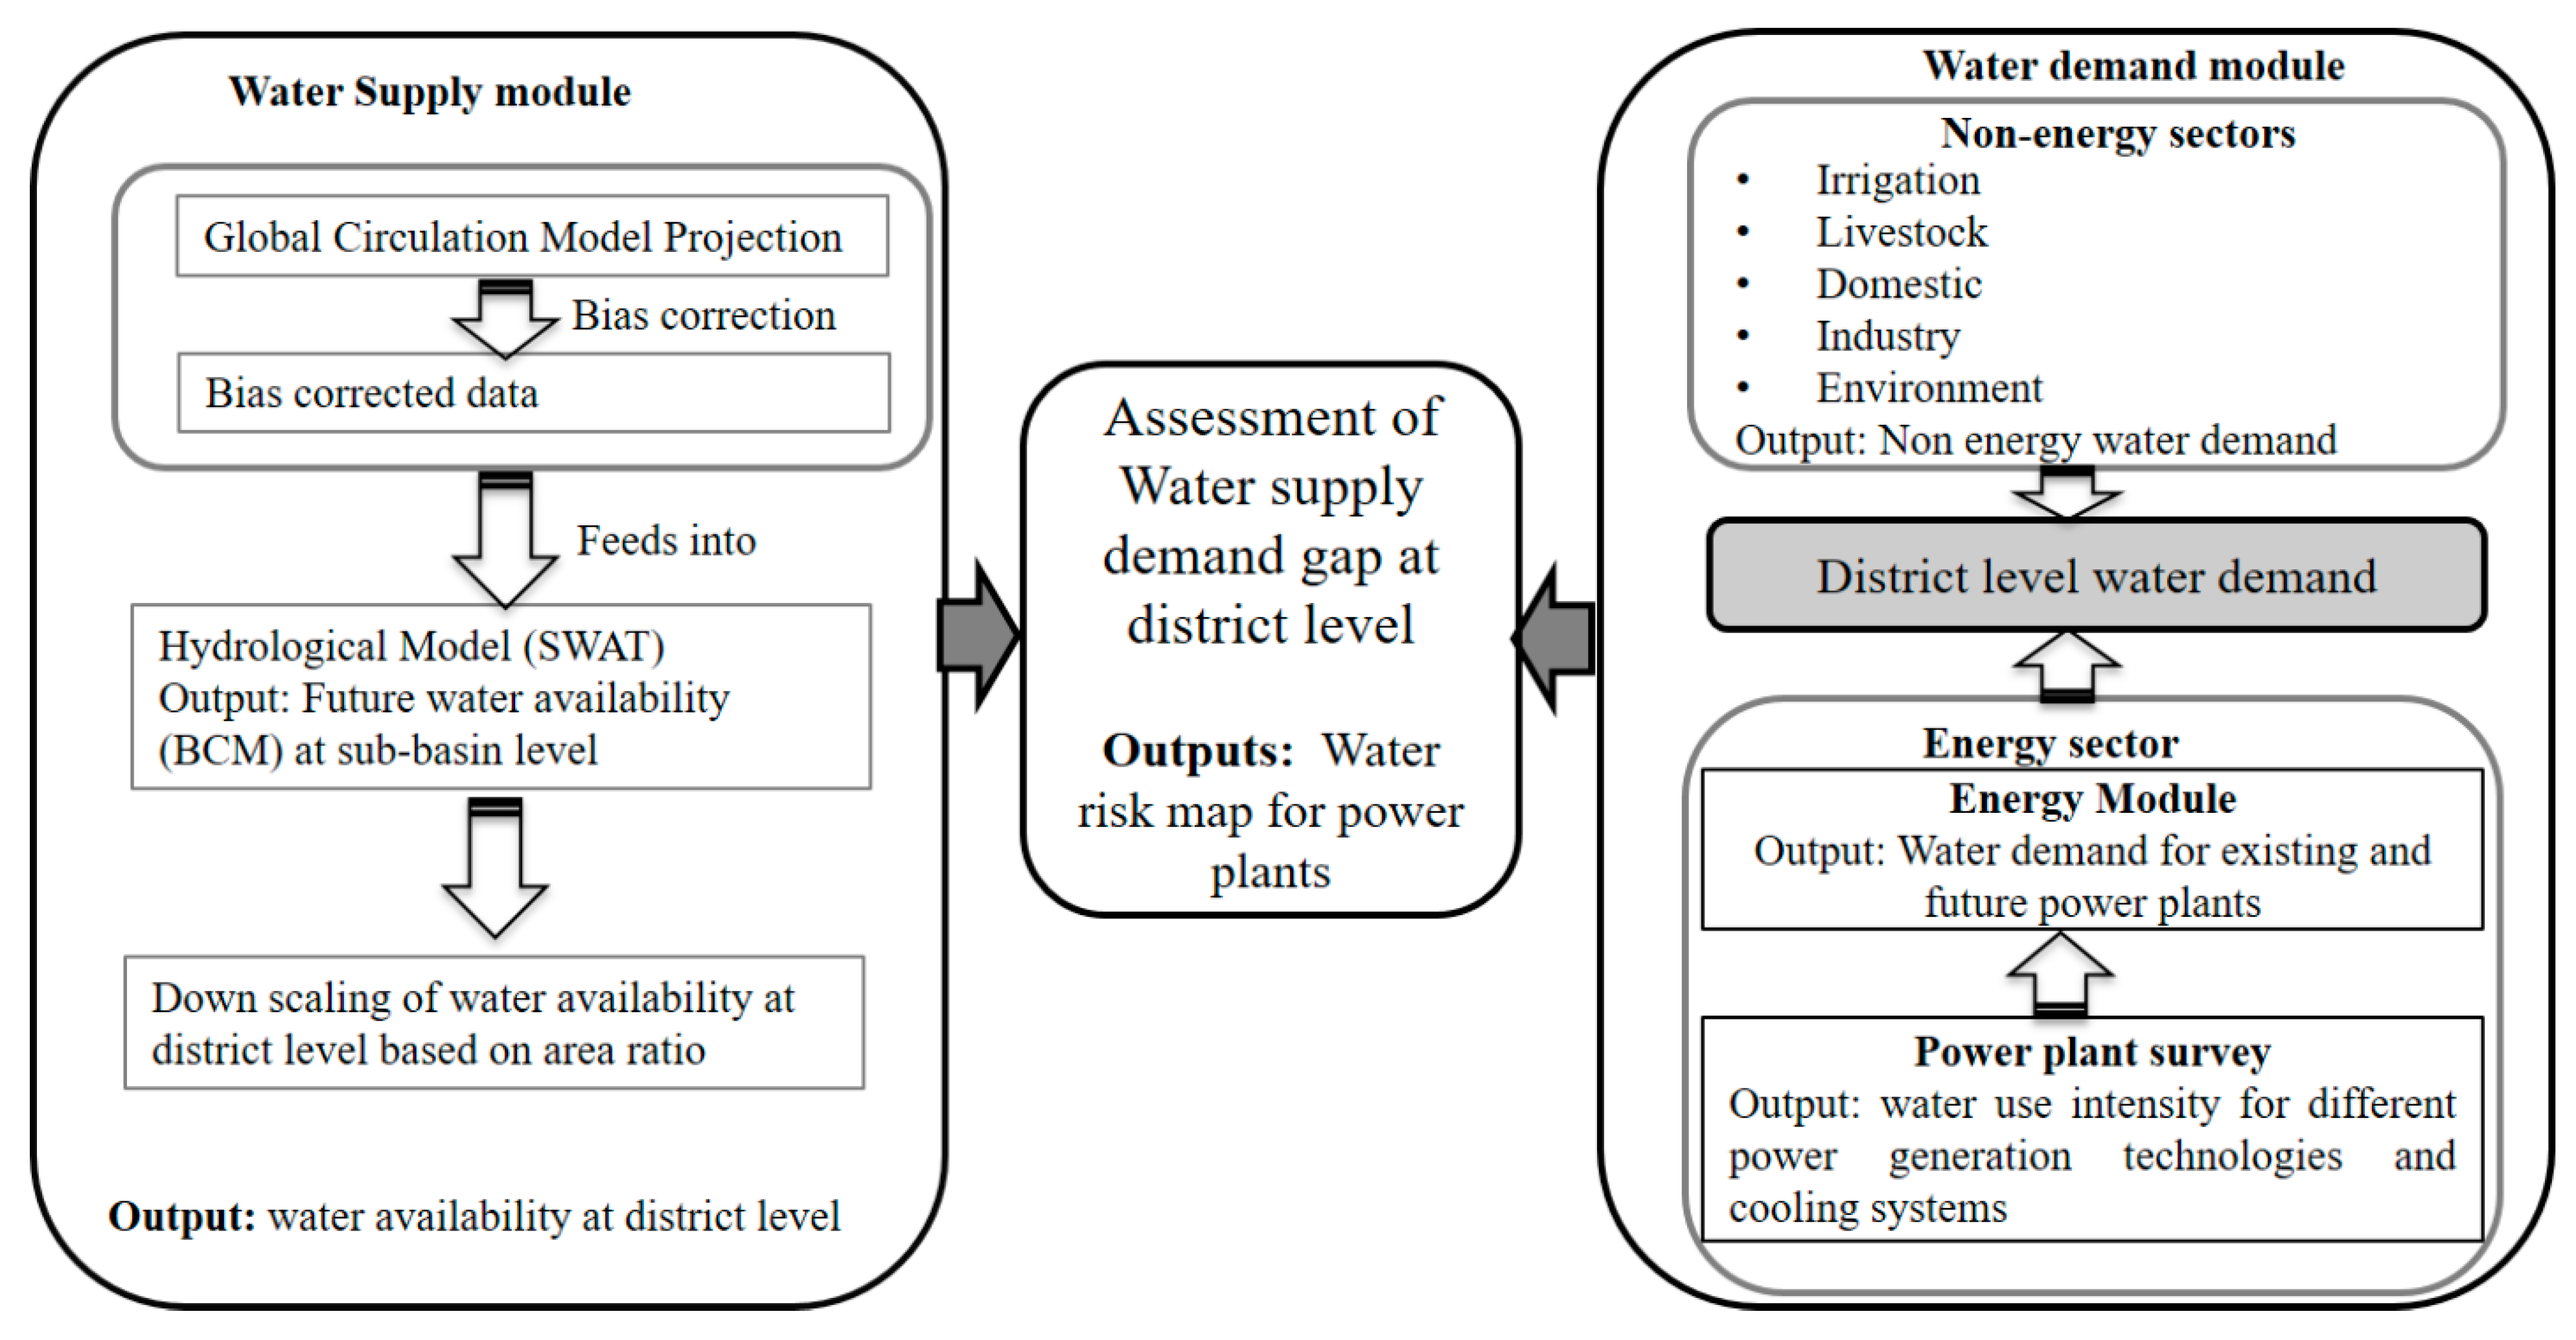
2.2. Methodological Framework

In this study, we took an integrated methodological approach that consists of the hydrological modeling of the spatial distribution of water availability, water demand assessment for non-energy sectors, collected water use intensity data for power generation through a field survey of 20 thermal power plants for estimation of water demand of energy generation in India. The overall framework is furnished in Figure 2.

2.3. Water Resource Variability Assessment

To classify the water resource availability, we used the Soil and Water Assessment Tool (SWAT) for assessing future water resource distribution at the sub-basin level. The advantages of using SWAT include; (i) it is suitable for ungauged water catchment and does not need calibration; and (ii) it simulates future water yield based on the physical data [16,18,19,20,21]. In the SWAT model, basins are considered as an agglomeration of multiple sub-watersheds. The sub-watersheds are further split into hydrologic response units (HRUs) characterized by similar land use, slope, and soil type, etc. For each HRU, the net hydrological balance is simulated based on precipitation, evapotranspiration, soil water, lateral sub-surface flow, and water yield [21,22].
The hydrological cycle is simulated by the SWAT model based on water balance Equation (1):
S W t = S W 0 + i = 1 t ( P d a y Q s E a W s e e p Q g w )
where SWt is the final soil water content after t days (in mm); SW0 is the initial soil water content (in mm) on day i; Pday is the amount of precipitation on day i (in mm); Qs is the amount of surface runoff on day i (in mm); Ea is the amount of evapotranspiration on day i (in mm); Wseep is the amount of percolation and bypass flow exiting the soil profile bottom on day i (in mm); Qgw is the amount of return flow on day i (in mm); t is the time (days).
Essential data, including the Digital Elevation Model (DEM), soil map, land use and land cover data, meteorological data, and climate model projections of temperature, and precipitation, were collected from various sources. For DEM, Shuttle Radar Topography Mission (SRTM) 90 m resolution was used [23]. Land use and land cover data from National Remote Sensing Centre (NRSC) and soil data were taken Food and Agriculture Organization (FAO) (available at http://www.fao.org/soils-portal/soil-survey/soil-maps-and-databases/harmonized-world-soil-database-v12/en/). Weather data, including precipitation of 0.5-degree grid data, the temperature of 1-degree grid data, relative humidity, solar radiation, wind grid weather data were taken from Global Weather Data for SWAT (available at http://globalweather.tamu.edu/).
A bias-correction technique based on the delta change method was employed to correct the bias of precipitation and temperature projections derived from the Global Circulation Model (GCM), consequently, minimize the uncertainty in future water availability projection. This bias-corrected projection was used to generate different climate change scenarios on water availability using the SWAT model. We used two climate scenarios, namely, the RCP 4.5 and RCP 8.5. To assess the climate change impacts on spatial water availability, the RCP 4.5 and RCP 8.5 climate scenarios from the MRI-CGCM3 model were used (available at http://pcmdi9.llnl.gov/). MRI-CGCM3 is selected considering its good performance at the basin scale for India [24]. MRI-CGCM3 is developed by the Meteorological Research Institute based on the earlier MRI-CGCM2 model. The simulation of the SWAT model provided water yield at the HRU level. The SWAT model simulated water yield of relevant HRU is used as a representative value for the districts located at the respective HRU. Then water yield was multiplied by the area of the district to estimate the water availability of each district.

2.4. Estimation of Water Demand

District level water demand for major water users was estimated, including domestic sector, irrigation, livestock, industrial use, environment water, and energy use for present and future scenarios, as mentioned below.

2.4.1. Water Demand for Domestic Use

Water demand for domestic use was calculated by multiplying the population of each district. As water use patterns in urban and rural significantly vary, domestic water demand for urban and rural populations calculated separately, and their cumulative sum represents water demand for domestic use of the respective district. For the present study, per capita, water demand of 150 L per capita per day (lpcd) and 70 lpcd was considered for urban and rural areas, respectively [25]. District-level population data is taken from the census (2001 and 2011). The following are the equations used for estimation of urban and rural domestic water demand:
Drural = Prural × 70 lpcd
where Drural denotes the water demand for the rural segment, and Prural is the population in the rural area.
Durban = Purban × 150 lpcd
where Durban denotes the water demand for the urban segment, and Purban is the population in the urban area.

2.4.2. Water Demand for Irrigation

For estimating water demand for irrigation, major cereal crops are identified for each of the four sub-basins. The reference evapotranspiration of each major crop, ET0 (in mm/day), is estimated based on which the evapotranspiration of each major crop, ETc, the amount of water demand of the crop under standard conditions, is calculated by Equation (4) as follows:
ETc = ET0 × Kc
where Kc is the crop coefficient suggested by FAO for the main crop in each of the sub-basins.
Effective precipitation, Reffective, rainfall available for crop growth, is estimated based on the FAO/AGLW formula see Equation (5) by which total rainfall, Rtotal, is corrected by taking account of the losses (as a percentage of total rainfall), due to runoff and percolation [26].
Reffective = 60% × Rtotal − 10, if Rtotal < = 70 mm
Reffective = 80% × Rtotal − 25, if Rtotal > 70 mm
Irrigation water demand is calculated by Equation (6).
Dirrigation = ETcReffective
To estimate the total irrigation water requirement at the district level, national reference values were utilized [27]. To calculate the base year (2010) water demand, a reference factor of 1.45 was used, which was multiplied by the cereal irrigation water demand of 2010. Similarly, for calculating future irrigation water demand, different we used different multiplication factors (e.g., 1.003 for the 2020s, 1.007 for the 2030s, 1.168 for the 2040s, and 1.329 for the 2050s).

2.4.3. Water Demand for Livestock

We calculated the livestock water demand by multiplying the livestock population by the water use rate per head for different types of animals. Data on the district-level population of the livestock is collected from the census (2007 and 2012). It is, however, impossible to estimate the decadal growth for future livestock as the regular fluctuation are not known. Hence, we considered an increase of 10% in water demand on a decadal basis.

2.4.4. Water Demand for Industry

Water demand for the industrial sector was estimated as a percentage of urban and rural domestic water use, as recommended by the Central Pollution Control Board of India (1989).
Dindustry = Drural × frural + Durban × furban
In which Dindustry denotes industrial water demand, Drural is the rural domestic water demand, and Durban is the urban domestic water demand, see Equations (2) and (3), and frural represents rural water use factors, which is considered 25%, and furban represents urban water use factors is considered 5% in this study.

2.4.5. Environmental Water Requirement

Environmental water requirement, i.e., the amount of water required to maintain ecological processes and biodiversity, is an important consideration for estimating future water demand. However, it is tough to estimate environmental water requirements, due to a lack of necessary data. In this study, environmental water requirement is estimated as 1.23% of the total water demand as recommended by the Central Water Commission (2015).

2.4.6. Energy Water Demand Estimation

To collect the water use intensity of different power generation technologies, including the different cooling systems, a power plant survey was conducted. During the power plant surveys, various information, including fuel types (fuel), installed capacity (Cinstall), power generation technologies (tech), cooling systems (cool), plant load factors (L), source of water, water use intensity (Ifuel, tech, cool), etc., were collected. Energy water demand (Denergy) is calculated using Equation (8):
Denergy = Cinstall × 24 × 365 × L × Ifuel, tech, cool
For estimation of future water demand from power generation, the study relied on the disclosed information of the total planned fuel mix by the Central Energy Authority (see Appendix A) and used Equation (8).

2.5. Water Risk Assessment for Future Power Generation

Based on the simulated future water resources and sectoral water demand at the district level for each sub-basin, the supply-demand ratio, defined as (supply-demand)/supply, is calculated for the present period (2010). Districts were classified into four classes of water risks based on the value of the supply-demand gap ratio, including highly water-stressed (<0.0), moderately water-stressed (0.0 to 0.5), no stress (0.5 to 1.0), and water surplus (>1.0). Then, future period changes in the supply-demand ratio in 2050 compared with the level in 2010 are calculated for each of the four sub-basins. The changes in the supply-demand ratio (in percentage) are classified into five levels to indicate the impact of climate change on future water risks under RCP 4.5 (see Table 1).

3. Results and Discussions

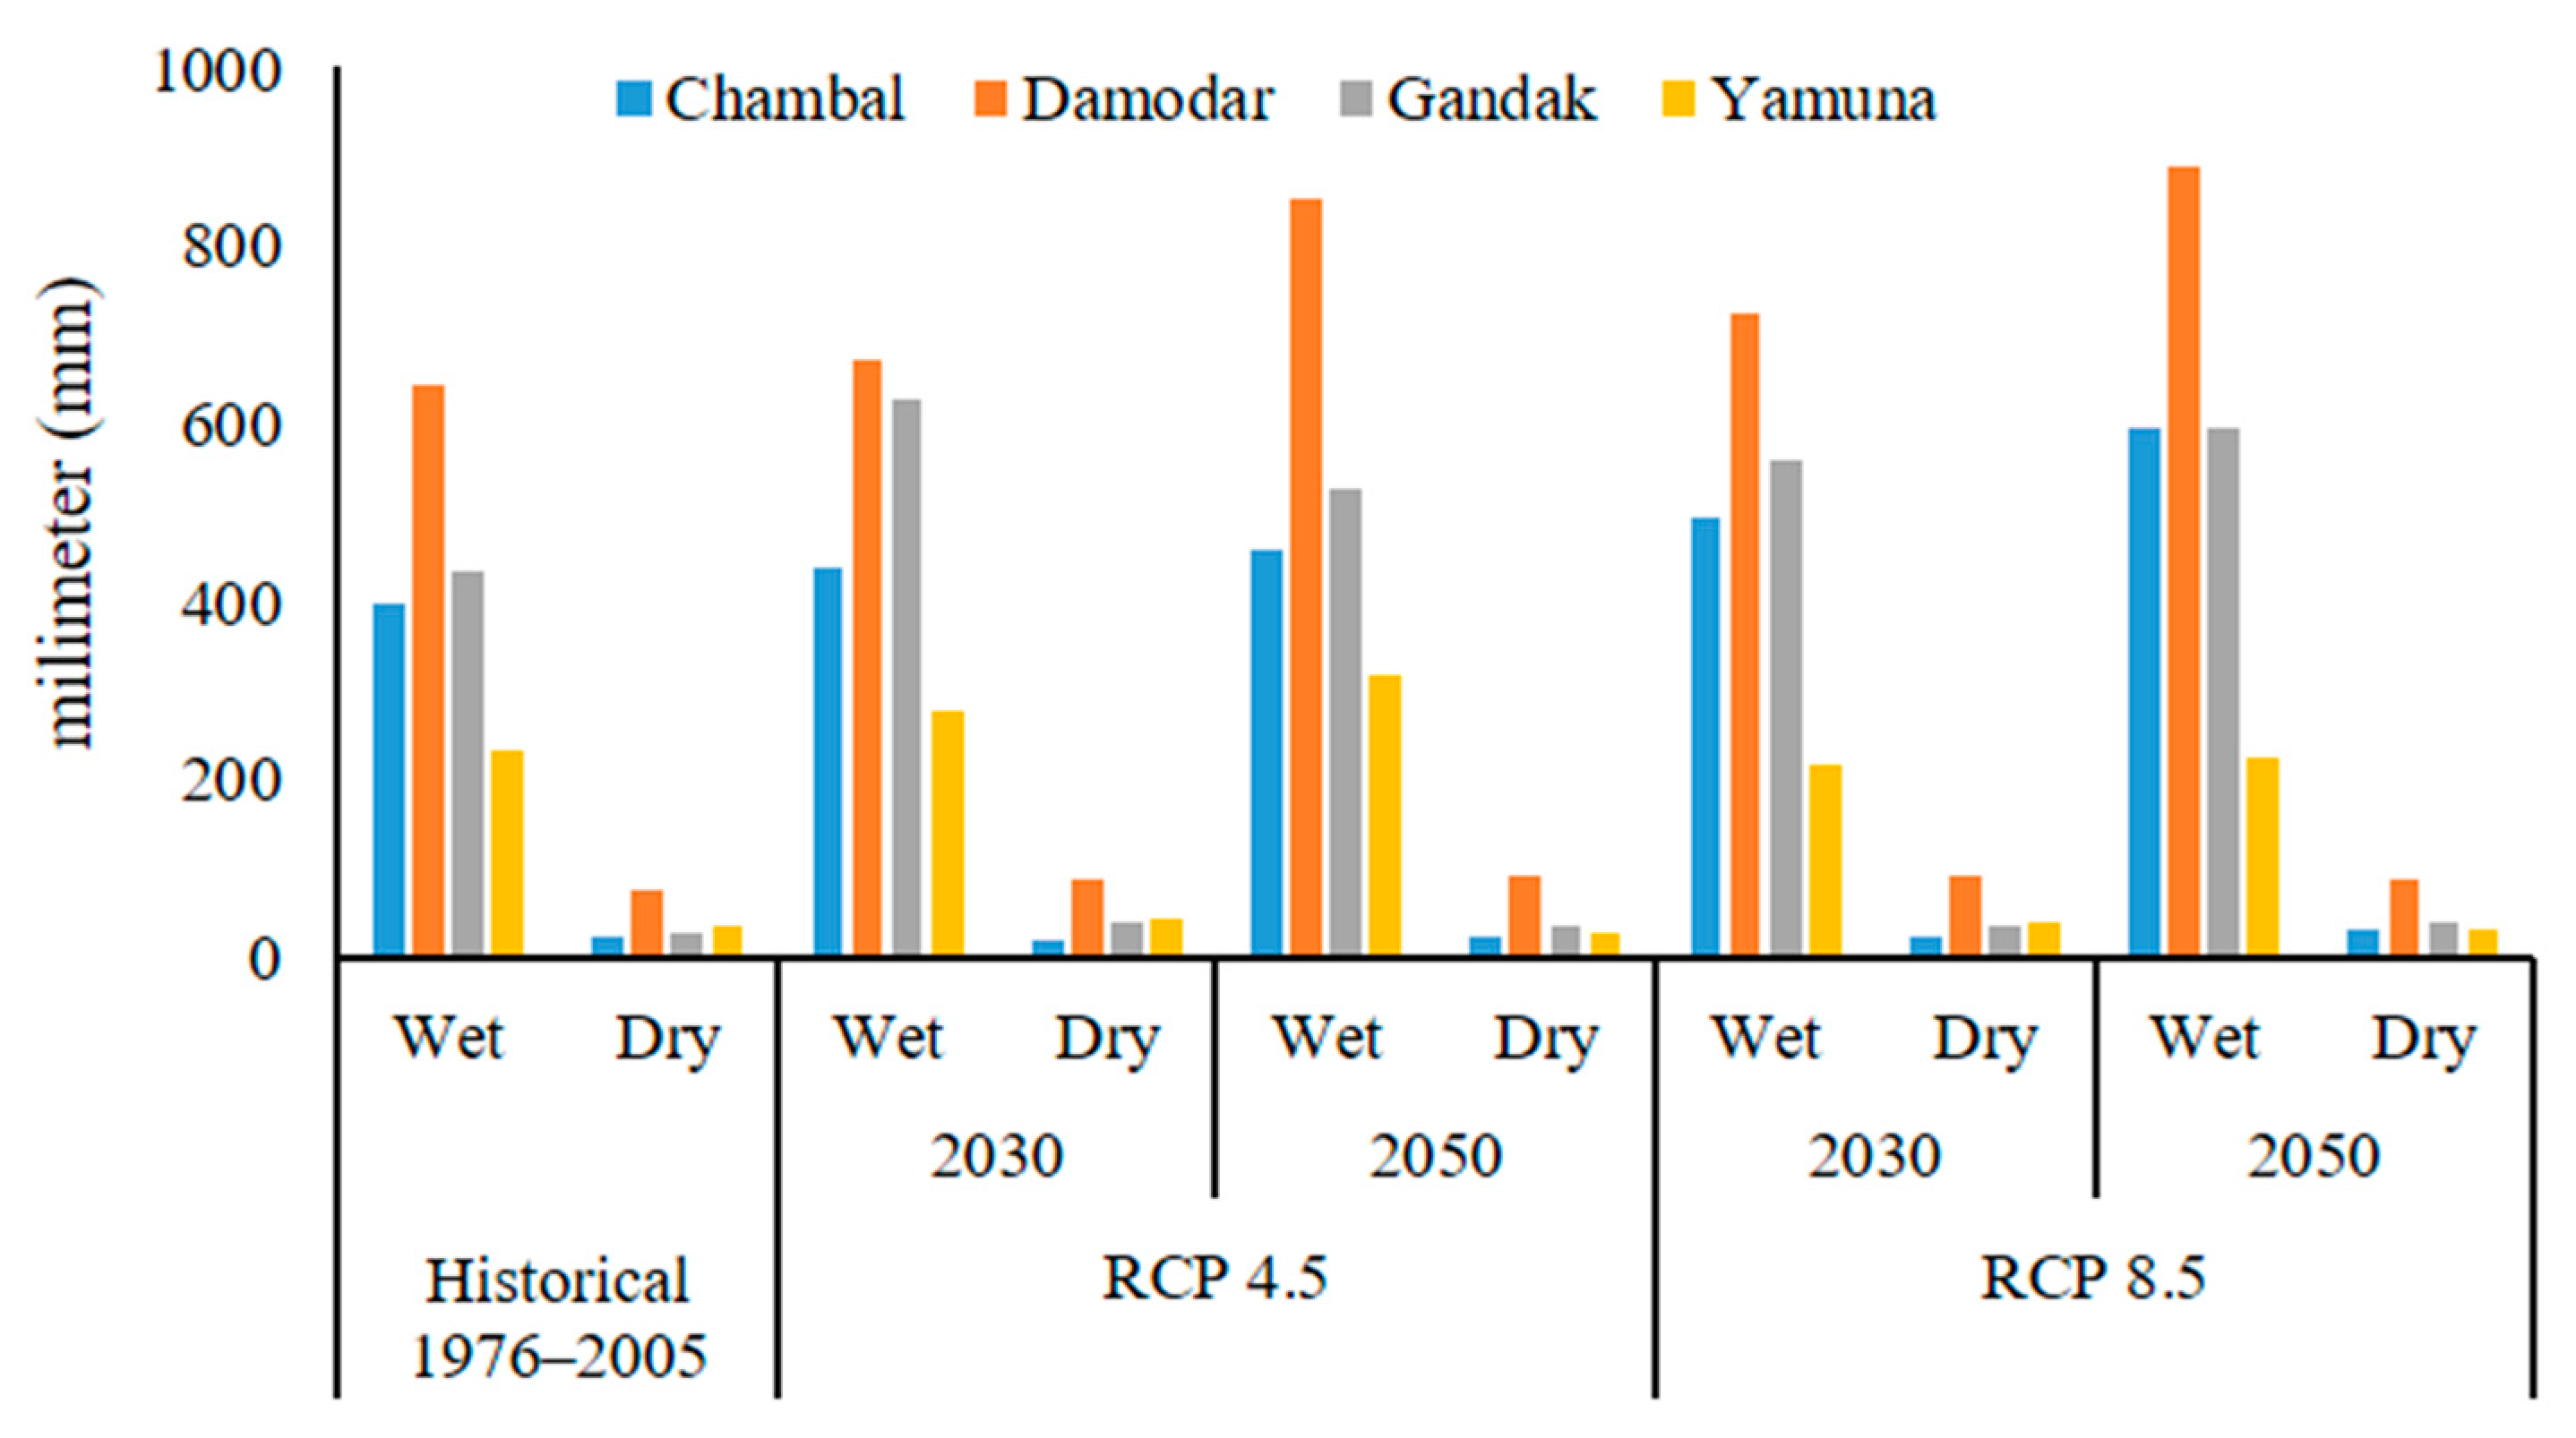
3.1. Climate Parameters under RCP 4.5 and RCP 8.5

As per climate model scenarios, it is projected that there will be an increase in precipitation in all the four sub-basins irrespective of RCP 4.5 and RCP 8.5 scenarios, as shown in Table 2. The model suggested that overall, four sub-basins will increase in precipitation in the future with a more positive change in the mid-future period and then a decrease in the positive trend far into the future. This is a good sign as it will improve water availability in the sub-basin. The projection also revealed that all sub-basins will receive more precipitation under the RCP 8.5 scenario than the RCP 4.5 scenario. The Chambal basin will have a 9% increase in precipitation in the far future period to a 17% increase in the mid-future period under the RCP4.5 scenario. This increase varies from 11% in the far future period to 31% in the midfuture period. In the case of Yamuna, an increase of precipitation by 19% in the near future and 14% in the mid-future is predicted under RCP 4.5. However, the model predicts a slight decrease in precipitation in the far future under RCP 4.5. Under the 8.5 RCP scenario, precipitation will increase from 4% in the near future to a 26% increase in the midfuture period.
It represents a positive change in water availability in the Yamuna sub-basin. In the Gandak sub-basin, there is also an increase in precipitation which varies between 6 to 23% under RCP 4.5, whereas between 13 to 34% under the RCP 8.5 scenario. All three future periods show an increase in precipitation. In the Damodar sub-basin, the percentage change in precipitation varies between 12 to 19% under RCP 4.5 scenario, whereas the increase is predicted to be between 13 to 26% under the RCP 8.5 scenario.
In all the four sub-basins, there is a projected increase in evapotranspiration (E), as presented in Table 2. In the Chambal sub-basin, there is a slight decrease in E in the near future, but it will increase in the mid-future and far-future under RCP 4.5. Under RCP 8.5, there will be an increase in E for all future periods. In the Yamuna sub-basin, E will increase under both RCP 4.5 and RCP 8.5 scenarios. Under the RCP 8.5 scenario ratio of E and P will increase in the far future period, which implies a reduction of water availability in the far future. In the Gandak sub-basin, the ratio of E and P will decrease under both the RCP 4.5 scenario and the RCP 8.5 scenario. Similar observations are made in the Damodar sub-basin as there is a decrease in E and P ratio f under both scenarios.

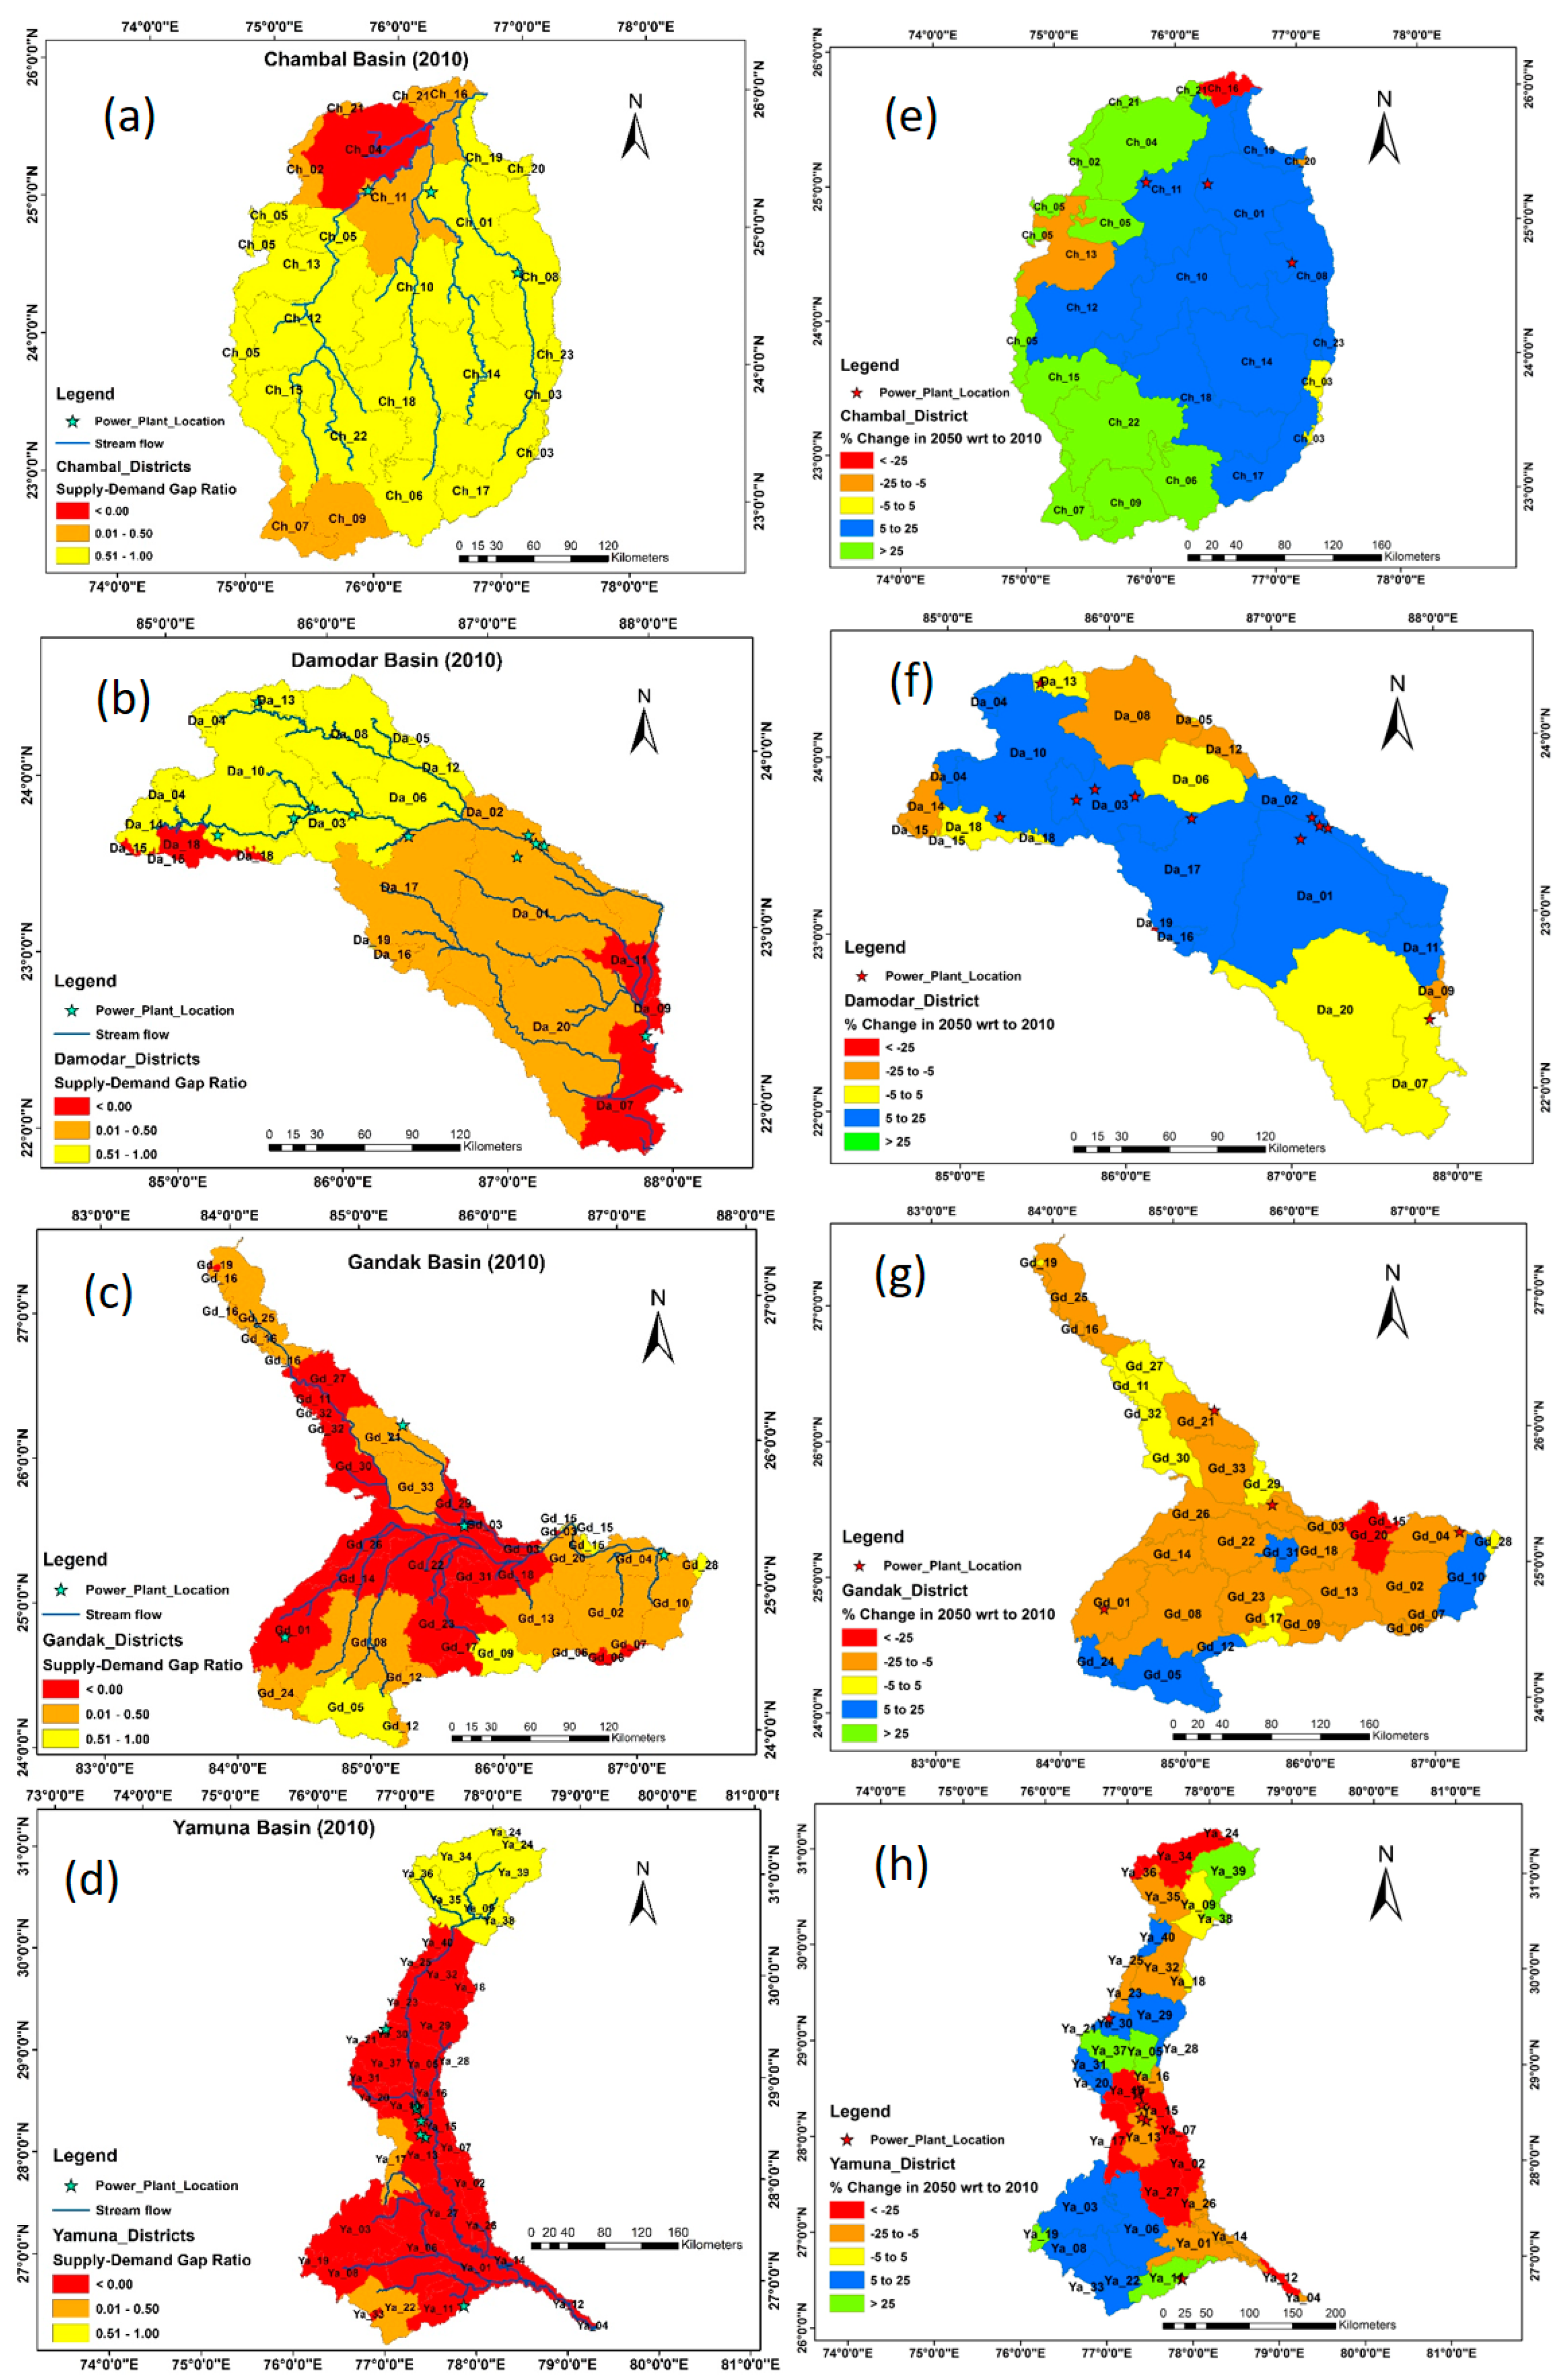
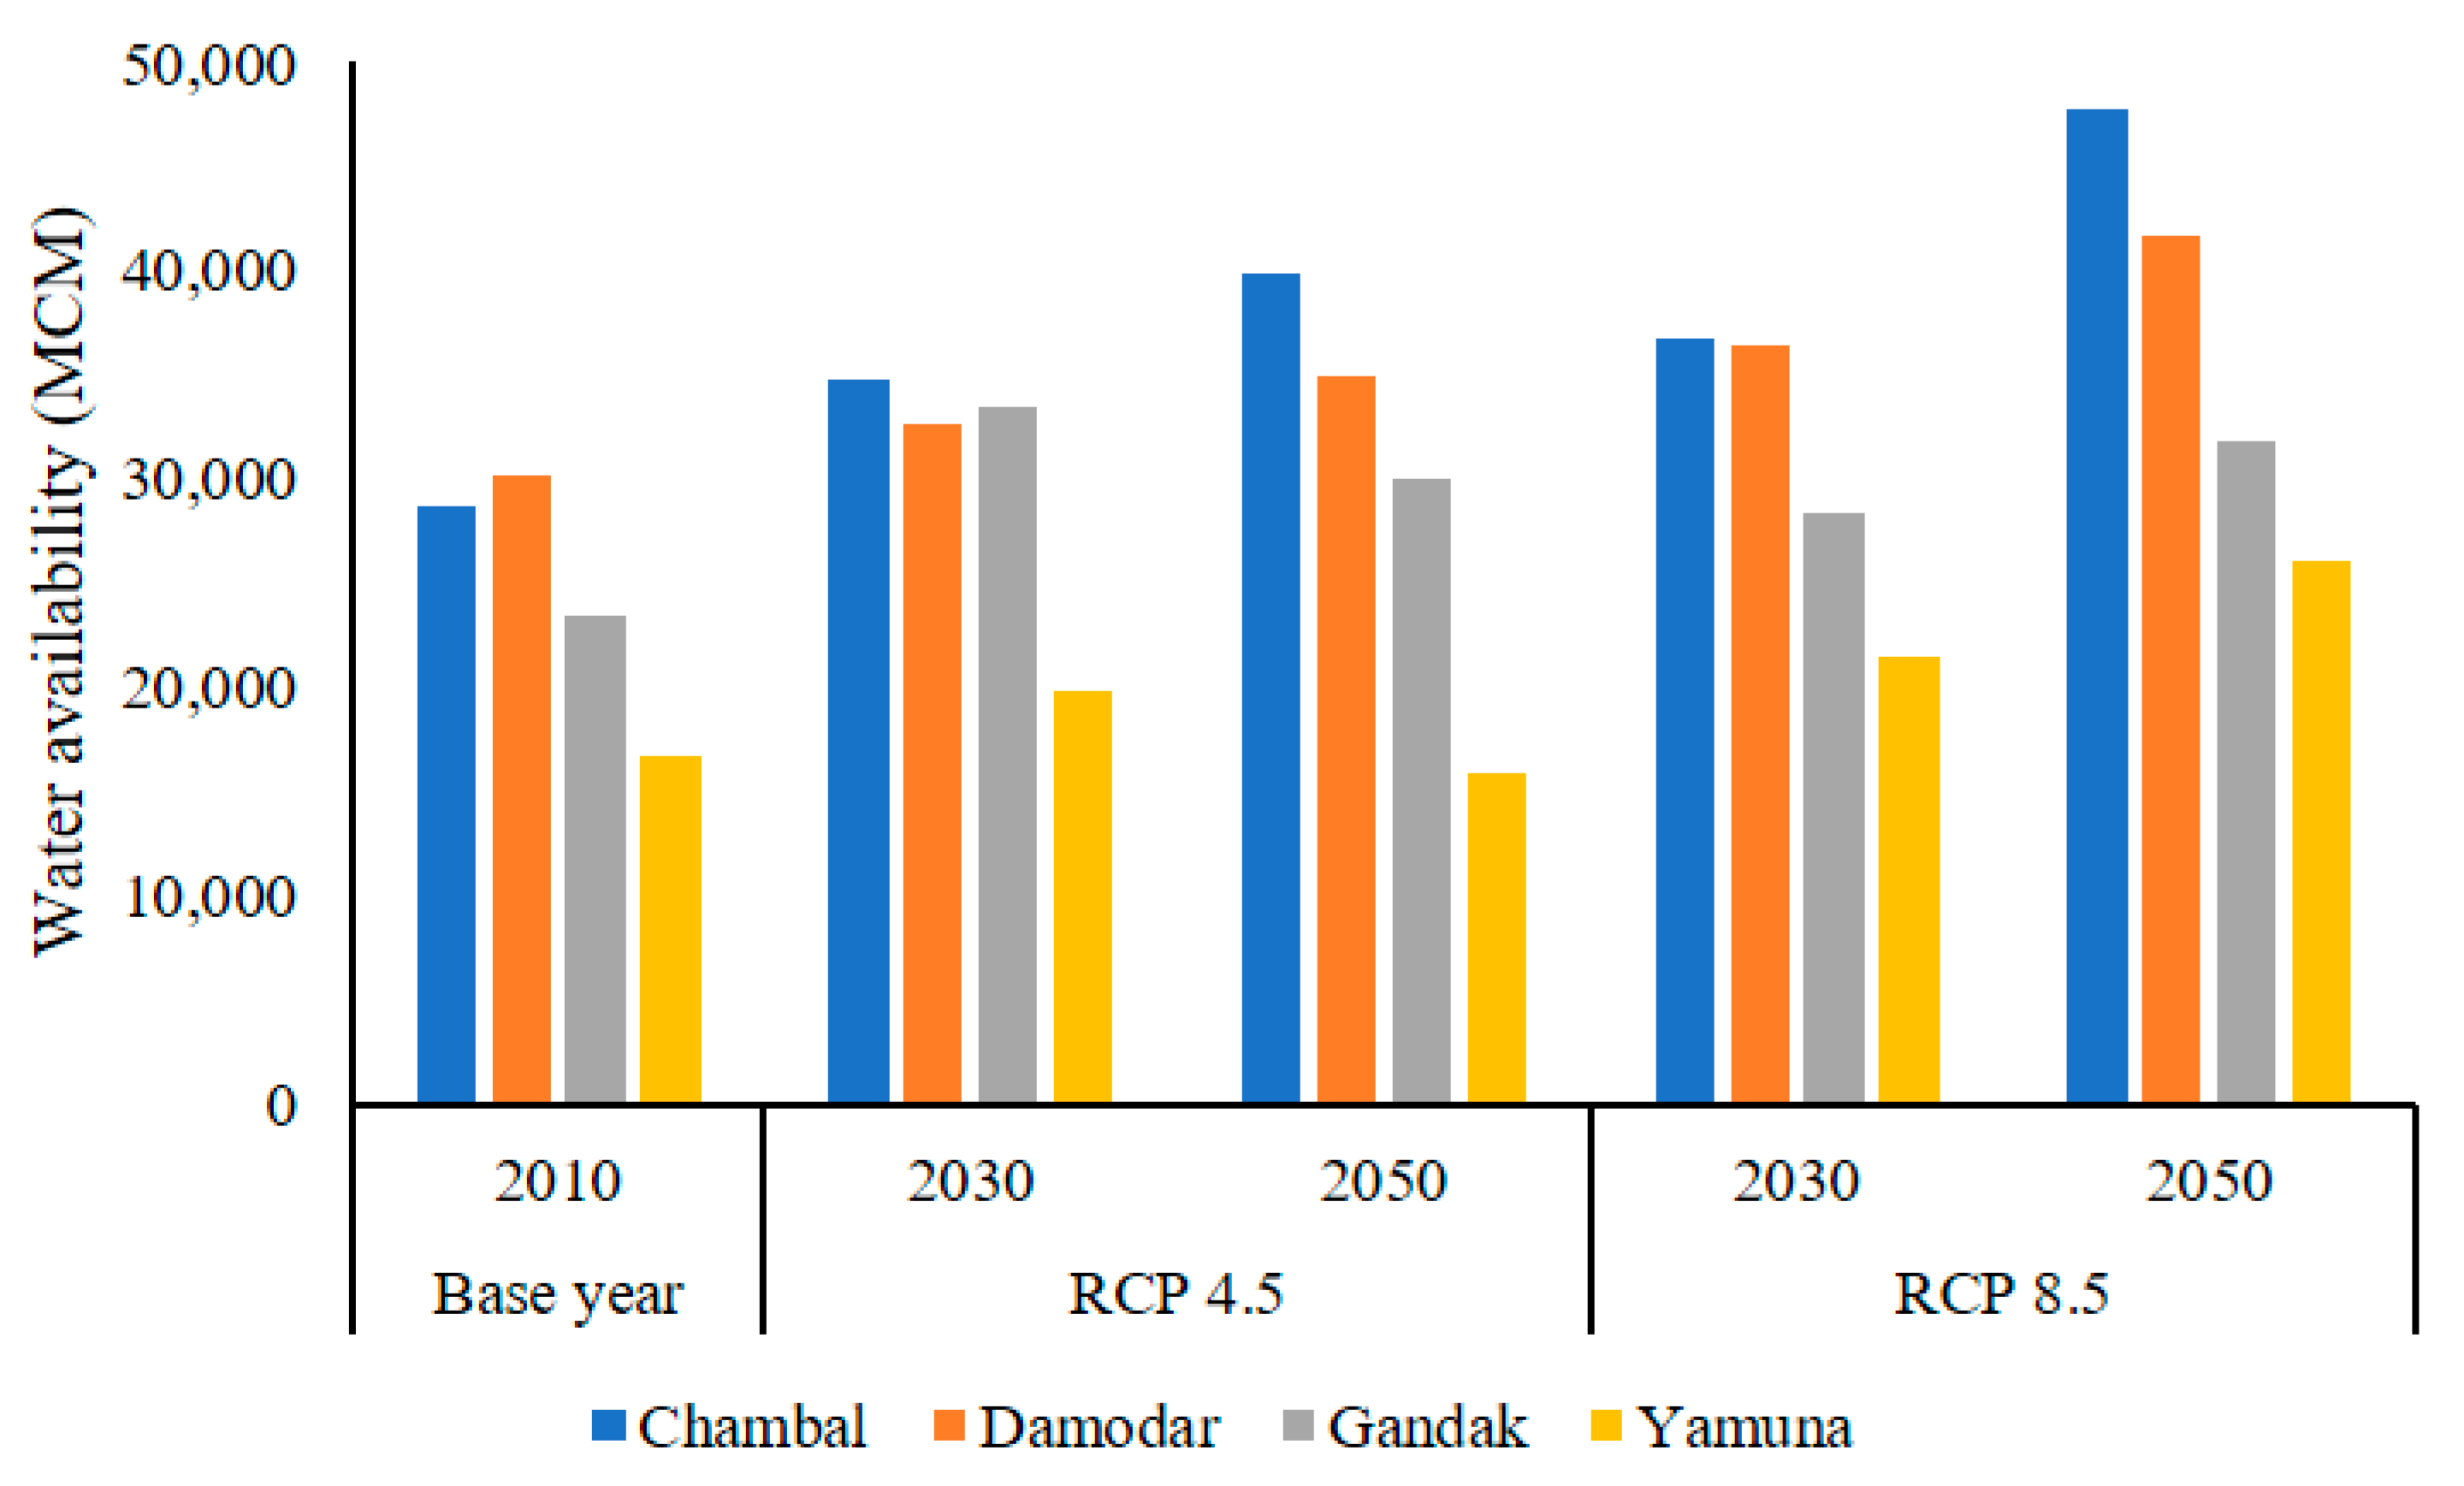
3.2. Water Availability Assessment under Climate Change Scenarios

Figure 3 presents the changes in the water yield in 2030 and 2050, respectively, as compared with the levels in the historical period (1976–2005) in four sub-basins under RCP 4.5 and RCP 8.5. Water yield is not evenly distributed throughout the year and will show significant seasonal variation, depending on the physical conditions, such as precipitation, evapotranspiration, and surface runoff, etc. Under RCP 4.5, all the sub-basins will show an increasing trend of water yield during the wet seasons in 2030 and 2050. Changes in the water yield in the wet season will vary from 8% in 2030 to 55% in 2050 in the Damodar sub-basin. Under RCP 8.5, Yamuna will face a negative change in the water yield in both 2030 and 2050, even during the wet season. In contrast, water yield will increase significantly in all other basins. The results show that RCP 8.5 will have more positive impacts on the water yield than RCP 4.5 in both the Chambal and Damodar sub-basins. The results imply that the total water yield will increase in Chambal, Damodar, and Gandak at all times, but with great seasonal variabilities. However, under the extreme climate scenario, water yield in the Yamuna will decrease.
A positive effect of climate change on the water yield will result in an increase of available water in the four sub-basins (Figure 4). The results show that under both RCP 4.5 and RCP 8.5, Chambal will have the largest among of available water ranging from 47,823 MCM (million cubic meter) in 2050 under RCP 8.5 to 34,701 MCM in 2030 under RCP 4.5. Among four sub-basins, Yamuna will have the lowest volume of available water. The results imply that the increasing amount of available water will positively support water-intensive development, including thermal power generation, in the Chambal sub-basin.

3.3. Water Demand Assessment

3.3.1. Water Demand of Non-Energy Sectors

Table 3 shows the water demand from five non-energy sectors in four sub-basins for the base period 2010 and the future period (2050). The results show that the future water demand from non-energy sectors will increase, due to population growth, industrial development, and irrigation requirements. Out of the four sub-basins, the Chambal sub-basin would have the least water demand, and the Yamuna sub-basin would have the most water demand in 2010. In all the four sub-basins, non-energy sectors water demand will increase significantly by 37% in Chambal, 34% in Damodar, 37% in Gandak, and 42% in Gandak in 2050. Although the rate of water demand increase will be high for domestic and industrial sectors, the share of irrigation water demand will dominate the total non-energy sector water demand followed by domestic water demand, which will continue until 2050. The Yamuna sub-basin will lead the highest water demand, including both irrigation water demand and the domestic water demand, among the four sub-basins, followed by the Gandak sub-basin.

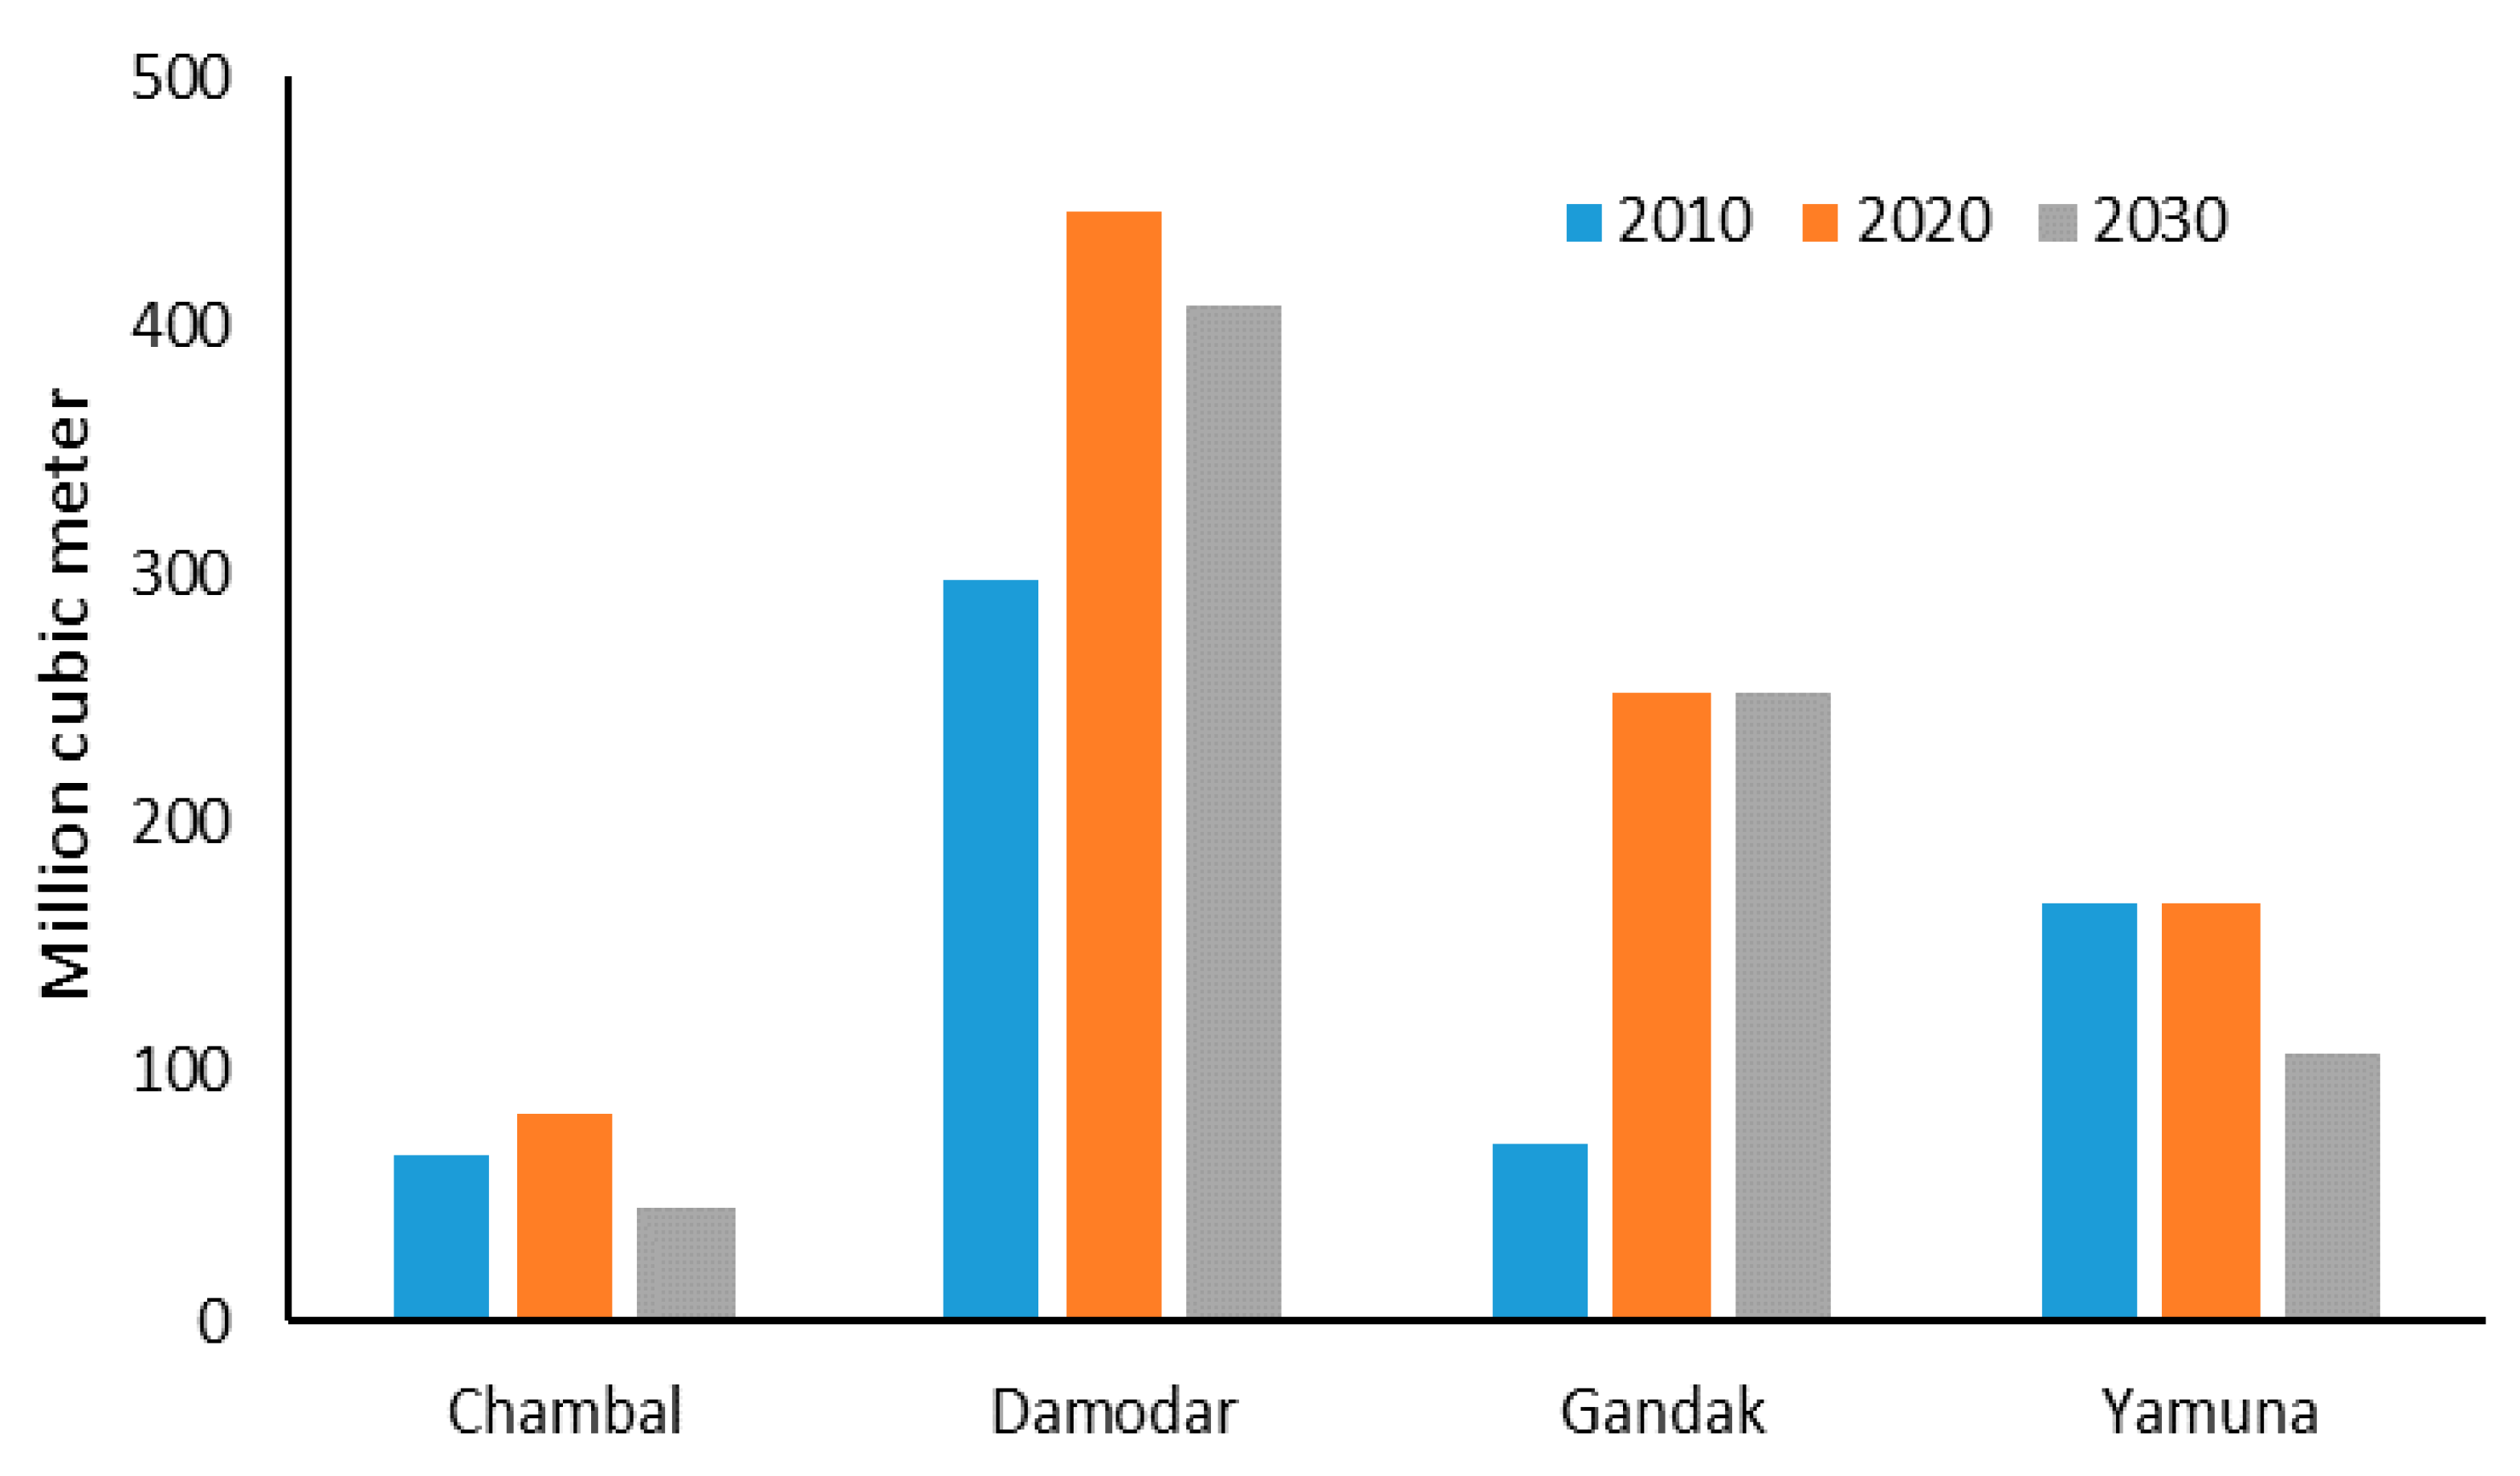
3.3.2. Water Demand of Energy Sector

A field survey was carried out to collect water use intensity data for existing power plants. Power plants were chosen based on the fuel types and technologies employed for the cooling systems, including open loop cooling systems, closed-loop cooling systems, and dry cooling systems. As such, it was observed that cooling technologies have major impacts on the energy sector’s water demand. It was observed that the water use intensity in thermal power generation varies from 3.3 m3/MWh with a closed-loop cooling system to 70 m3/MWh with an open-loop cooling system. Furthermore, the requirement for water is much higher in coal-based power plants than gas-based power plants. Apart from gas-based power plants, the results revealed that all the thermal power plants under our survey exceeded the upper limit for regulated water use intensity (2.5 m3/MWh) [28].
According to the CEA database, coal-based power plants dominate the majority of the existing installed thermal power capacity in four sub-basins (see Table A1). For example, 100% of the installed capacity is based on coal in the Damodar and Gandak sub-basin. As a result, energy-water demand is the highest in the Damodar sub-basin, followed by the Gandak sub-basin. Energy water demand will decrease in the Chambal and the Damodar sub-basins and will maintain a similar level in the Yamuna sub-basin; while it will substantially increase in the Gandak sub-basin. Among four sub-basins, the Damodar sub-basin has the largest thermal power capacity (17.9 GW). As a result, water demand for power generation is the highest among the four selected sub-basins. This situation will continue until 2030. In 2030, the water demand for thermal power generation will be more than 400 MCM (Figure 5). The Gandak sub-basin has the second-highest water demand for thermal power generation, and in 2030, the thermal power generation will require nearly 255 MCM of water. In contrast, estimates show that water demand for thermal power generation will reduce in the Chambal and Yamuna sub-basins by 2030.

3.4. Assessment of Water Risks to Future Power Plants

Water supply-demand balance was calculated by subtracting total water demand (non-energy and energy-related water use, as shown in Table 3 and Figure 5) from the amount of available water in the future (Figure 4). Water supply-demand balance analysis revealed that the Chambal and Damodar sub-basins will have surplus water for all the periods. The estimate shows the amount of water surplus in the Damodar sub-basin will decrease over time.
In 2010, the surplus water volume in the Damodar sub-basin was 8072 MCM, and the estimate predicts a reduction by 15% in 2050. Water deficit will become more serious in both the Yamuna and Gandak sub-basins. In the Yamuna sub-basin, the water deficit will increase by 86%.
In Figure 6, water risk maps for 2010 showed that only a small part of the Chambal sub-basin located in the upper part of the area would face high water stress (in red), and some parts would have moderate water stress (in orange). The majority of the sub-basin would have a water surplus (in yellow). In the case of the Damodar sub-basin, districts at the upper catchments would have a water surplus. However, districts at the lower catchment areas would face moderate to high water risk, and many of the existing power plants are located in this part of the Damodar sub-basin. It indicates exiting power plants might face water shortage for operation. In the case of the Gandak and Yamuna, most of the districts would have moderate to high water risks.
Future water risks were assessed based on the percentage change of the supply-demand ratios for 2050 compared with the levels in the base year (2010) to comprehend future changes in water availability. The classification of water risks is shown in Table 1.
The results of the changes in the water supply-demand ratios at the sub-basin level indicate that water risks will reduce in the Chambal and Damodar sub-basins which will have surplus water in the future. Figure 6 shows that out of 23 districts in the Chambal sub-basin, climate change will have moderate positive to high positive impacts on reducing the water risks in 19 districts in 2050. However, four districts, including Bhopal (Ch_03), Neemuch (Ch_13), Sawai Madhopur (Ch_16), and Shivpuri (Ch_20), will face increasing water risks. Similarly, water risks will be reduced in the Damodar sub-basin. The number of districts with moderate positive impacts on reducing the water risks from climate change will increase to 10 in 2050. The results revealed that water risks for the existing and future power plants would decrease in the Chambal and Damodar sub-basins. In contrast, the existing and future power plants in the Yamuna and Gandak sub-basins will face increasing water risks in the future. Districts that will receive moderate negative impacts will increase to 19 in 2050. In the Gandak and Yamuna sub-basin, all the existing power plants and future power plants are located in the districts with increasing water risks. Particularly in the Gandak sub-basin, there will be a number of planned thermal power installations whose operations will face severe water risks. Please see Table A2 for the list of districts.
Existing or planned thermal power plants that are located in areas with high water risks may face serious water shortages, which will impact the stability of their operations. Districts with moderate to high positive impacts on the water risks from climate change in the Chambal and Damodar sub-basins can be considered as the appropriate locations for new electricity generation projects in the future.

4. Conclusions

Given the importance of water resources in the GRB for drinking water supply, energy generation, irrigation, and maintaining ecosystem services in South Asia, this study assessed the spatial variability of water resources under different climate change scenarios and the potential risks to future energy supply, regarding water availability. The study was conducted for four selected sub-basins. An integrated assessment method was developed, combining a single climate model (MRI-CGCM3), hydrological model (SWAT), and water demand projections for both non-energy sectors (domestic sector, agriculture, livestock, industry, and the environment) and the energy sector (thermal power generation). To gather primary data on water use intensity, we conducted a survey of thermal power plants in the four sub-basins and used the survey data to estimate the water demand for power generation in the four selected areas. The power plant survey results revealed that the water use intensity in coal thermal power plants varies from 3.3 m3/MWh to 70 m3/MWh, depending on power generation technologies, cooling technologies, as well as the quality of coal. An assessment of water availability under RCP 4.5 and RCP 8.5 shows that future water availability will increase in three sub-basins during the wet season except for the Yamuna sub-basin under RCP 8.5. Likewise, water demand will also steadily increase in four sub-basins, dominated by irrigation requirements and followed by domestic use. For the water demand from energy, of four sub-basins, Gandak will have the highest water demand for cooling down the coal power plants, followed by Damodar and Yamuna. The lowest water demand for future energy generation will be in the Chambal sub-basin as there is no plan to install new thermal power plants, although more water will be available in Chambal in the future. In the Gandak sub-basin, there will be a number of planned new thermal power installations in the coming years. However, changes in the water supply-demand ratio in 2050 relative to 2010 demonstrated that out of 33 districts in Gandak, 22 districts would face moderate negative impacts from climate change, which will worsen the water risks for the existing and future power plants. Similarly, thermal power plants in the Yamuna sub-basin will also face high water risks. These results will inform development and planning organizations, energy planning organizations, as well as investors, with regard to the spatial distribution of water risks for future power plants. All entities may consider this information to plan the location of future power plants in the districts with high water availability, thereby mitigating any conflicts with other water users and minimizing the risks of losing out on revenue related to the forced shutdown, due to water scarcity.

Author Contributions

Conceptualization, investigation, visualization, methodology, writing—review and editing; formal analysis, software, B.K.M., D.S., X.Z. and R.D.; writing—original draft preparation, B.K.M., D.S. and X.Z.; validation, resources, supervision, project administration, funding acquisition, B.K.M., D.S., X.Z. and R.D. All authors have substantially contributed for the development of this manuscript. All authors have read and agreed to the published version of the manuscript.

Funding

This research was funded by the Asia-Pacific Network for Global Change Research (APN) with the project reference number: ARCP2015-13CMY-Zhou. The publication cost is funded by IGES Strategic Research Fund-2020.

Acknowledgments

This study has been conducted from the project ‘Assessment of Climate-Induced Long-term Water Availability in the Ganges Basin and Impacts on Energy Security in South Asia’ funded by the Asia-Pacific Network for Global Change Research (APN) with the project reference number: ARCP2015-13CMY-Zhou. We would like to extend our thanks to the research assistants Sawtantra Dubey and Aashis Sapkota, for their supports to this study. We are also thankful to those power plants, which provided relevant information and detailed data to support our field surveys. Authors are grateful to three anonymous reviewers who have immensely helped in improving the manuscript and Emma Fushimi, IGES Japan for her kind support in proof reading and edits.

Conflicts of Interest

The authors declare no conflict of interest. The funders had no role in the design of the study; in the collection, analyses, or interpretation of data; in the writing of the manuscript, or in the decision to publish the results.

Appendix A

Table A1. List of existing and future thermal power plants in four Sub-basins.
Power Plants in Sub-BasinsFuelCapacity (MW)Cooling
Technology
Operation
Status
Chambal
Kota Super Thermal Power StationCoal1240Wet-closed loopOperational
Chhabra Thermal Power PlantCoal2320Wet-closed loopOperational
Anta Thermal Power PlantGas419Wet-closed loopOperational
Damodar
Koderma Thermal Power StationCoal1000Wet-closed loopOperational
Patratu Thermal Power Station ICoal880Wet-closed loopOperational
Patratu Thermal Power Station IICoal4000Wet-closed loopPlanned
Bokaro B Thermal Power StationCoal500Wet-closed loopPlanned
Tenughat Thermal Power StationCoal420Wet-opened loopOperational
Mejia Thermal Power StationCoal2340Wet-closed loopOperational
Kolaghat Thermal Power StationCoal1260Wet-closed loopOperational
Durgapur Steel Thermal Power StationCoal1000Wet-closed loopOperational
Santaldih Thermal Power StationCoal500Wet-closed loopOperational
Chandwa Power Project Phase ICoal1080Wet-closed loopConstruction
Tori power plant Unit 1Coal1800Wet-closed loopConstruction
Raghunathpur Thermal Power Station phase ICoal1200Wet-closed loopConstruction
Gola power station Unit I and IICoal126Wet-closed loopOperational
Gandak
Kahalgaon Super Thermal Power StationCoal2340Wet-closed loopOperational
Nabinagar Super Thermal Power ProjectCoal1980Wet-closed loopConstruction
Kanti Thermal Power StationCoal610Wet-closed loopOperational
Banka Power Project Stage I (Unit 1 and 2)Coal2320Wet-closed loopConstruction
Barh I power stationCoal1980Wet-closed loopConstruction
Barauni power station Unit 8Coal250Wet-closed loopOperational
Yamuna
IPGCL-Gas Turbine Power StationGas270Wet-opened loopOperational
NTPC- Faridabad Thermal Power PlantGas430Wet-closed loopOperational
Panipat Thermal Power Station I and IICoal1360Wet-closed loopOperational
Panipat Thermal Power Station I and II Unit 9Coal800Wet-closed loopPlanned
Dholpur Thermal Power StationGas330Wet-closed loopOperational
Table A2. Name of districts in four sub-basins with district code.
ChambalDamodarGandakYamuna
District CodeDistrict NameDistrict CodeDistrict NameDistrict CodeDistrict NameDistrict CodeDistrictDistrict CodeDistrict
Ch_01BaranDa_01BankuraGd_01AurangabadYa_01Agra
Ch_02BhilwaraDa_02BarddhamanGd_02BankaYa_02AligarhYa_34Shimla
Ch_03BhopalDa_03BokaroGd_03BegusaraiYa_03AlwarYa_35Sirmaur
Ch_04BundiDa_04ChatraGd_04BhagalpurYa_04AuraiyaYa_36Solan
Ch_05ChittaurgarhDa_05DeogharGd_05ChatraYa_05BaghpatYa_37Sonepat
Ch_06DewasDa_06DhanbadGd_06DeogharYa_06BharatpurYa_38Tehri Garhwal
Ch_07DharDa_07East MidnaporeGd_07DumkaYa_07BulandshahrYa_39Uttarkashi
Ch_08GunaDa_08GiridihGd_08GayaYa_08DausaYa_40Yamuna Nagar
Ch_09IndoreDa_09HaoraGd_09GiridihYa_09Dehra Dun
Ch_10JhalawarDa_10HazaribagGd_10GoddaYa_10Delhi
Ch_11KotaDa_11HugliGd_11GopalganjYa_11Dhaulpur
Ch_12MandsaurDa_12JamtaraGd_12HazaribagYa_12Etawah
Ch_13NeemuchDa_13KodermaGd_13JamuiYa_13Faridabad
Ch_14RajgarhDa_14LateharGd_14JehanabadYa_14Firozabad
Ch_15RatlamDa_15LohardagaGd_15KhagariaYa_15Gautam Buddha Nagar
Ch_16Sawai MadhopurDa_16Purba SinghbhumGd_16KushinagarYa_16Ghaziabad
Ch_17SehoreDa_17PuruliyaGd_17KodermaYa_17Gurgaon
Ch_18ShajapurDa_18RanchiGd_18LakhisaraiYa_18Haridwar
Ch_19SheopurDa_19Saraikela KharsawanGd_19MaharajganjYa_19Jaipur
Ch_20ShivpuriDa_20West MidnaporeGd_20MungerYa_20Jhajjar
Ch_21Tonk Gd_21MuzaffarpurYa_21Jind
Ch_22Ujjain Gd_22NalandaYa_22Karauli
Ch_23Vidisha Gd_23NawadaYa_23Karnal
Gd_24PalamuYa_24Kinnaur
Gd_25Pashchim ChamparanYa_25Kurukshetra
Gd_26PatnaYa_26Mahamaya Ngar (Hathras)
Gd_27Purba ChamparanYa_27Mathura
Gd_28SahibganjYa_28Meerut
Gd_29SamastipurYa_29Muzaffarnagar
Gd_30SaranYa_30Panipat
Gd_31SheikhpuraYa_31Rohtak
Gd_32SiwanYa_32Saharanpur
Gd_33VaishaliYa_33Sawai Madhopur

References

  1. World Bank. The National Ganga River Basin Project; World Bank: Washington, DC, USA, 2015; Available online: http://www.worldbank.org/en/news/feature/2015/03/23/india-the-national-ganga-river-basin-project (accessed on 20 January 2021).
  2. Anand, J.; Gosain, A.K.; Khosa, R.; Srinivasan, R. Regional scale hydrologic modeling for prediction of water balance, analysis of trends in streamflow and variations in streamflow: The case study of the Ganga River basin. J. Hydrol. Reg. Stud. 2018, 36, 32–53. [Google Scholar] [CrossRef]
  3. Sinha, D. Reviving the Ganga, at the Cost of Its Ecology! 2014. Available online: http://www.indiatogether.org/articles/ganga-river-waterway-reviving-and-impact-on-ecology-environment/print (accessed on 20 January 2021).
  4. Gaur, A.; Amarasinghe, P. A river basin perspective of water resources and challenges 3. In India Infrastructure Report 2011; Oxford University Press: Oxford, UK, 2011. [Google Scholar]
  5. Rasul, G. Water for growth and development in the Ganges, Brahmaputra, and Meghna basins: An economic perspective. Int. J. River Basin Manag. 2015, 13, 387–400. [Google Scholar] [CrossRef] [Green Version]
  6. GoI (Government of India). Ganges Basin; Central Water Commission, Ministry of Water Resources: New Delhi, India, 2014. Available online: http://www.india-wris.nrsc.gov.in/ (accessed on 15 October 2020).
  7. Moors, E.J.; Groot, A.; Biemans, H.; Scheltinga, C.T.V.; Siderius, C.; Stoffel, M.; Huggel, C.; Wiltshire, A.; Mathison, C.; Ridley, J.; et al. Adaptation to changing water resources in the Ganges basin, northern India. Environ. Sci. Pol. 2011, 14, 758–769. [Google Scholar] [CrossRef]
  8. Shrestha, A.B.; Bajracharya, S.R.; Sharma, A.R.; Duo, C.; Kulkarni, A. Observed trends and changes in daily temperature and precipitation extremes over the Koshi river basin 1975–2010. Int. J. Climatol. 2017, 37, 1066–1083. [Google Scholar] [CrossRef] [Green Version]
  9. Jeuland, M. Economic implications of climate change for infrastructure planning in transboundary water systems: An example from the Blue Nile. Water Resour. Res. 2010, 46. [Google Scholar] [CrossRef] [Green Version]
  10. Maurer, J.M.; Schaefer, J.M.; Rupper, S.; Corley, A. Acceleration of ice loss across the Himalayas over the past 40 years. Sci. Adv. 2019, 5. [Google Scholar] [CrossRef] [PubMed] [Green Version]
  11. Dyurgerov, M.B.; Meier, M.F. Twentieth century climate change: Evidence from small glaciers. Proc. Natl. Acad. Sci. USA 2000, 97, 1406–1411. [Google Scholar] [CrossRef] [PubMed] [Green Version]
  12. Miller, J.D.; Immerzeel, W.W.; Rees, G. Climate Change Impacts on Glacier Hydrology and River Discharge in the Hindu Kush—Himalayas A Synthesis of the Scientific Basis. Mt. Res. Dev. 2012, 32, 461–467. [Google Scholar] [CrossRef] [Green Version]
  13. World Bank Database. Electric Power Consumption (kWh per Capita). Available online: https://data.worldbank.org/indicator/EG.USE.ELEC.KH.PC (accessed on 20 January 2021).
  14. CEA (Central Electricity Authority). All India Installed Capacity (in MW) of Power Stations. 2015. Available online: http://cea.nic.in/reports/monthly/installedcapacity/2015/installed_capacity03.pdf (accessed on 20 January 2021).
  15. GOB (Government of Bangladesh). Power System Master Plan 2016 Summary. 2016. Available online: https://powerdivision.portal.gov.bd/sites/default/files/files/powerdivision.portal.gov.bd/page/4f81bf4d_1180_4c53_b27c_8fa0eb11e2c1/(E)_FR_PSMP2016_Summary_revised.pdf (accessed on 15 November 2020).
  16. Gosain, A.K.; Rao, S.; Arora, A. Climate change impact assessment of water resources of India. Curr. Sci. 2011, 101, 356–371. [Google Scholar]
  17. Luo, T.; Krishnan, D.; Sen, S. Parched Power: Water Demands, Risks, and Opportunities for India’s Power Sector. Water Resources Institute. 2018. Available online: https://www.wri.org/publication/parched-power (accessed on 22 January 2021).
  18. Mishra, H.; Denis, D.M.; Suryavanshi, S.; Kumar, M.; Srivastava, S.K.; Denis, A.F.; Kumar, R. Hydrological simulation of a small ungauged agricultural watershed Semrakalwana of Northern India. Appl. Water Sci. 2017, 7, 2803. [Google Scholar] [CrossRef] [Green Version]
  19. Gosain, A.K.; Rao, S.; Srinivasan, R.; Reddy, N.G. Return-flow assessment for irrigation command in the Palleru river basin using SWAT model. Hydrol. Process. 2005, 19, 673–682. [Google Scholar] [CrossRef]
  20. Kalcic, M.M.; Chaubey, I.; Frankenberger, J. Defining Soil and Water Assessment Tool (SWAT) hydrologic response units (HRUs) by field boundaries. Int. J. Agric. Biol. Eng. 2015, 8, 1. [Google Scholar] [CrossRef]
  21. Arnold, J.G.; Srinivasan, R.; Muttiah, R.S.; Williams, J.R. Large area hydrologic modeling and assessment: Part I, model development. J. Am. Water Resour. Assoc. 1998, 34, 73–89. [Google Scholar] [CrossRef]
  22. Srinivasan, R.; Ramanarayanan, T.S.; Arnold, J.G.; Bednarz, S.T. Large area hydrological modeling and assessment. Part II: Model application. J. Am. Water Resour. Ass. 1998, 34, 91–101. [Google Scholar] [CrossRef]
  23. SRTM (Shuttle Radar Topography Mission). Global Digital Elevation Model. 2015. Available online: http://glcf.umd.edu/data/srtm/ (accessed on 5 June 2019).
  24. Raju, K.S.; Nagesh Kumar, D. Ranking of global climate models for India using multi criterion analysis. Clim. Res. 2014, 60, 103–117. [Google Scholar] [CrossRef]
  25. Van Rooijen, D.J.; Turral, H.; Biggs, T.W. Urban and industrial water use in the Krishna Basin, India. Irrig. Drain. 2009, 58, 406–428. [Google Scholar] [CrossRef]
  26. Smith, M. Manual for CROPWAT; Version 5.2; FAO: Rome, Italy, 1988; 45p. [Google Scholar]
  27. Amarasinghe, U.A.; McCornick, P.G.; Tushaar, S. India water demand scenarios to 2025 and 2050: A fresh look. In Strategic Analyses of the National River Linking Project (NRLP) of India, Series 1: India Water Future: Scenarios and Issues; Amarasinghe, U.A., Upali, A., Tushaar, S., Malik, R.P.S., Eds.; International Water Management Institute (IWMI): Colombo, Sri Lanka, 2009; pp. 67–83. [Google Scholar]
  28. MOEFCC (Ministry of Environment Forests and Climate Change). S.O. 682(E). In The Notification of the Government of India in the Ministry of Environment, Forest and Climate Change Vide Number S.O. 3305(E), Dated the 7th December, 2015. Gazette; Government of India: New Delhi, India, 2015. Available online: http://www.moef.gov.in/sites/default/files/Thermalplantgazettescan.pdf (accessed on 20 January 2021).
Figure 1. A map of the study areas with four selected sub-basins in India with the specific characteristics.
Sustainability 13 07273 g001
Figure 2. The methodological framework for assessing the impacts of spatial water resource variability on energy planning in the Ganges sub-basin in India under climate change scenarios.
Sustainability 13 07273 g002
Figure 3. Seasonal water yield in four sub-basins under climate change scenarios in 2030 and 2050.
Sustainability 13 07273 g003
Figure 4. Future water availability in four sub-basins under climate change scenarios.
Sustainability 13 07273 g004
Figure 5. Water demand for existing power plants in four sub-river basins.
Sustainability 13 07273 g005
Figure 6. Water risks in 2010 (ad) and the percent changes in the supply-demand ratio in 2050 in four sub-basins compared with 2010 (eh).
Sustainability 13 07273 g006
Table 1. Classification of the changes in the supply-demand ratio for assessing climate-induced water risk for future power plants.
Level of Changes in the Supply-Demand Ratio (%)ColourDescription of Level of Effect
More than 25GreenHigh positive
Between 5 to 25BlueModerate positive
5 to −5YellowNegligible/No change
Between −5 to −25BrownModerate negative
less than −25RedHigh negative
Table 2. Precipitation and evapotranspiration in four sub-basins under RCP 4.5 and RCP 8.5 scenarios (in mm).
ChambalYamunaGandakDamodar
PEPEPEPE
Historical85444374445210756081464712
RCP 4.5
Near Future (2011–2040)94042388851212536531652793
Mid Future (2041–2070)100653384749512336491743763
Far Future (2071–2100)93446874046511276241646780
RCP 8.5
Near Future (2011–2040)102449477547611756491661829
Mid Future (2041–2070)111950494151713186651829832
Far Future (2071–2100)94948286251513356611850849
Note: P denotes precipitation; E denotes evapotranspiration.
Table 3. Water demand changes from non-energy sectors in four sub-basins under climate change scenarios in 2050 compared to 2010 (in MCM).
Water DemandBase Period 2010Change in 2050
Chambal
Domestic725635
Industry113133
Livestock18988
Irrigation88952927
Environment12547
Total10,1123828
Damodar
Domestic925625
Industry123106
Livestock20093
Irrigation20,2816672
Environment27392
Total22,0997589
Gandak
Domestic13751441
Industry139163
Livestock218101
Irrigation22,6887464
Environment306116
Total24,7969285
Yamuna
Domestic22912728
Industry446621
Livestock333154
Irrigation23,4377711
Environment333140
Total26,94011,354
Publisher’s Note: MDPI stays neutral with regard to jurisdictional claims in published maps and institutional affiliations.

