
Impact of Passive Energy Efficiency Measures on Cooling Energy Demand in an Architectural Campus Building in Karachi, Pakistan


Abstract
:1. Introduction
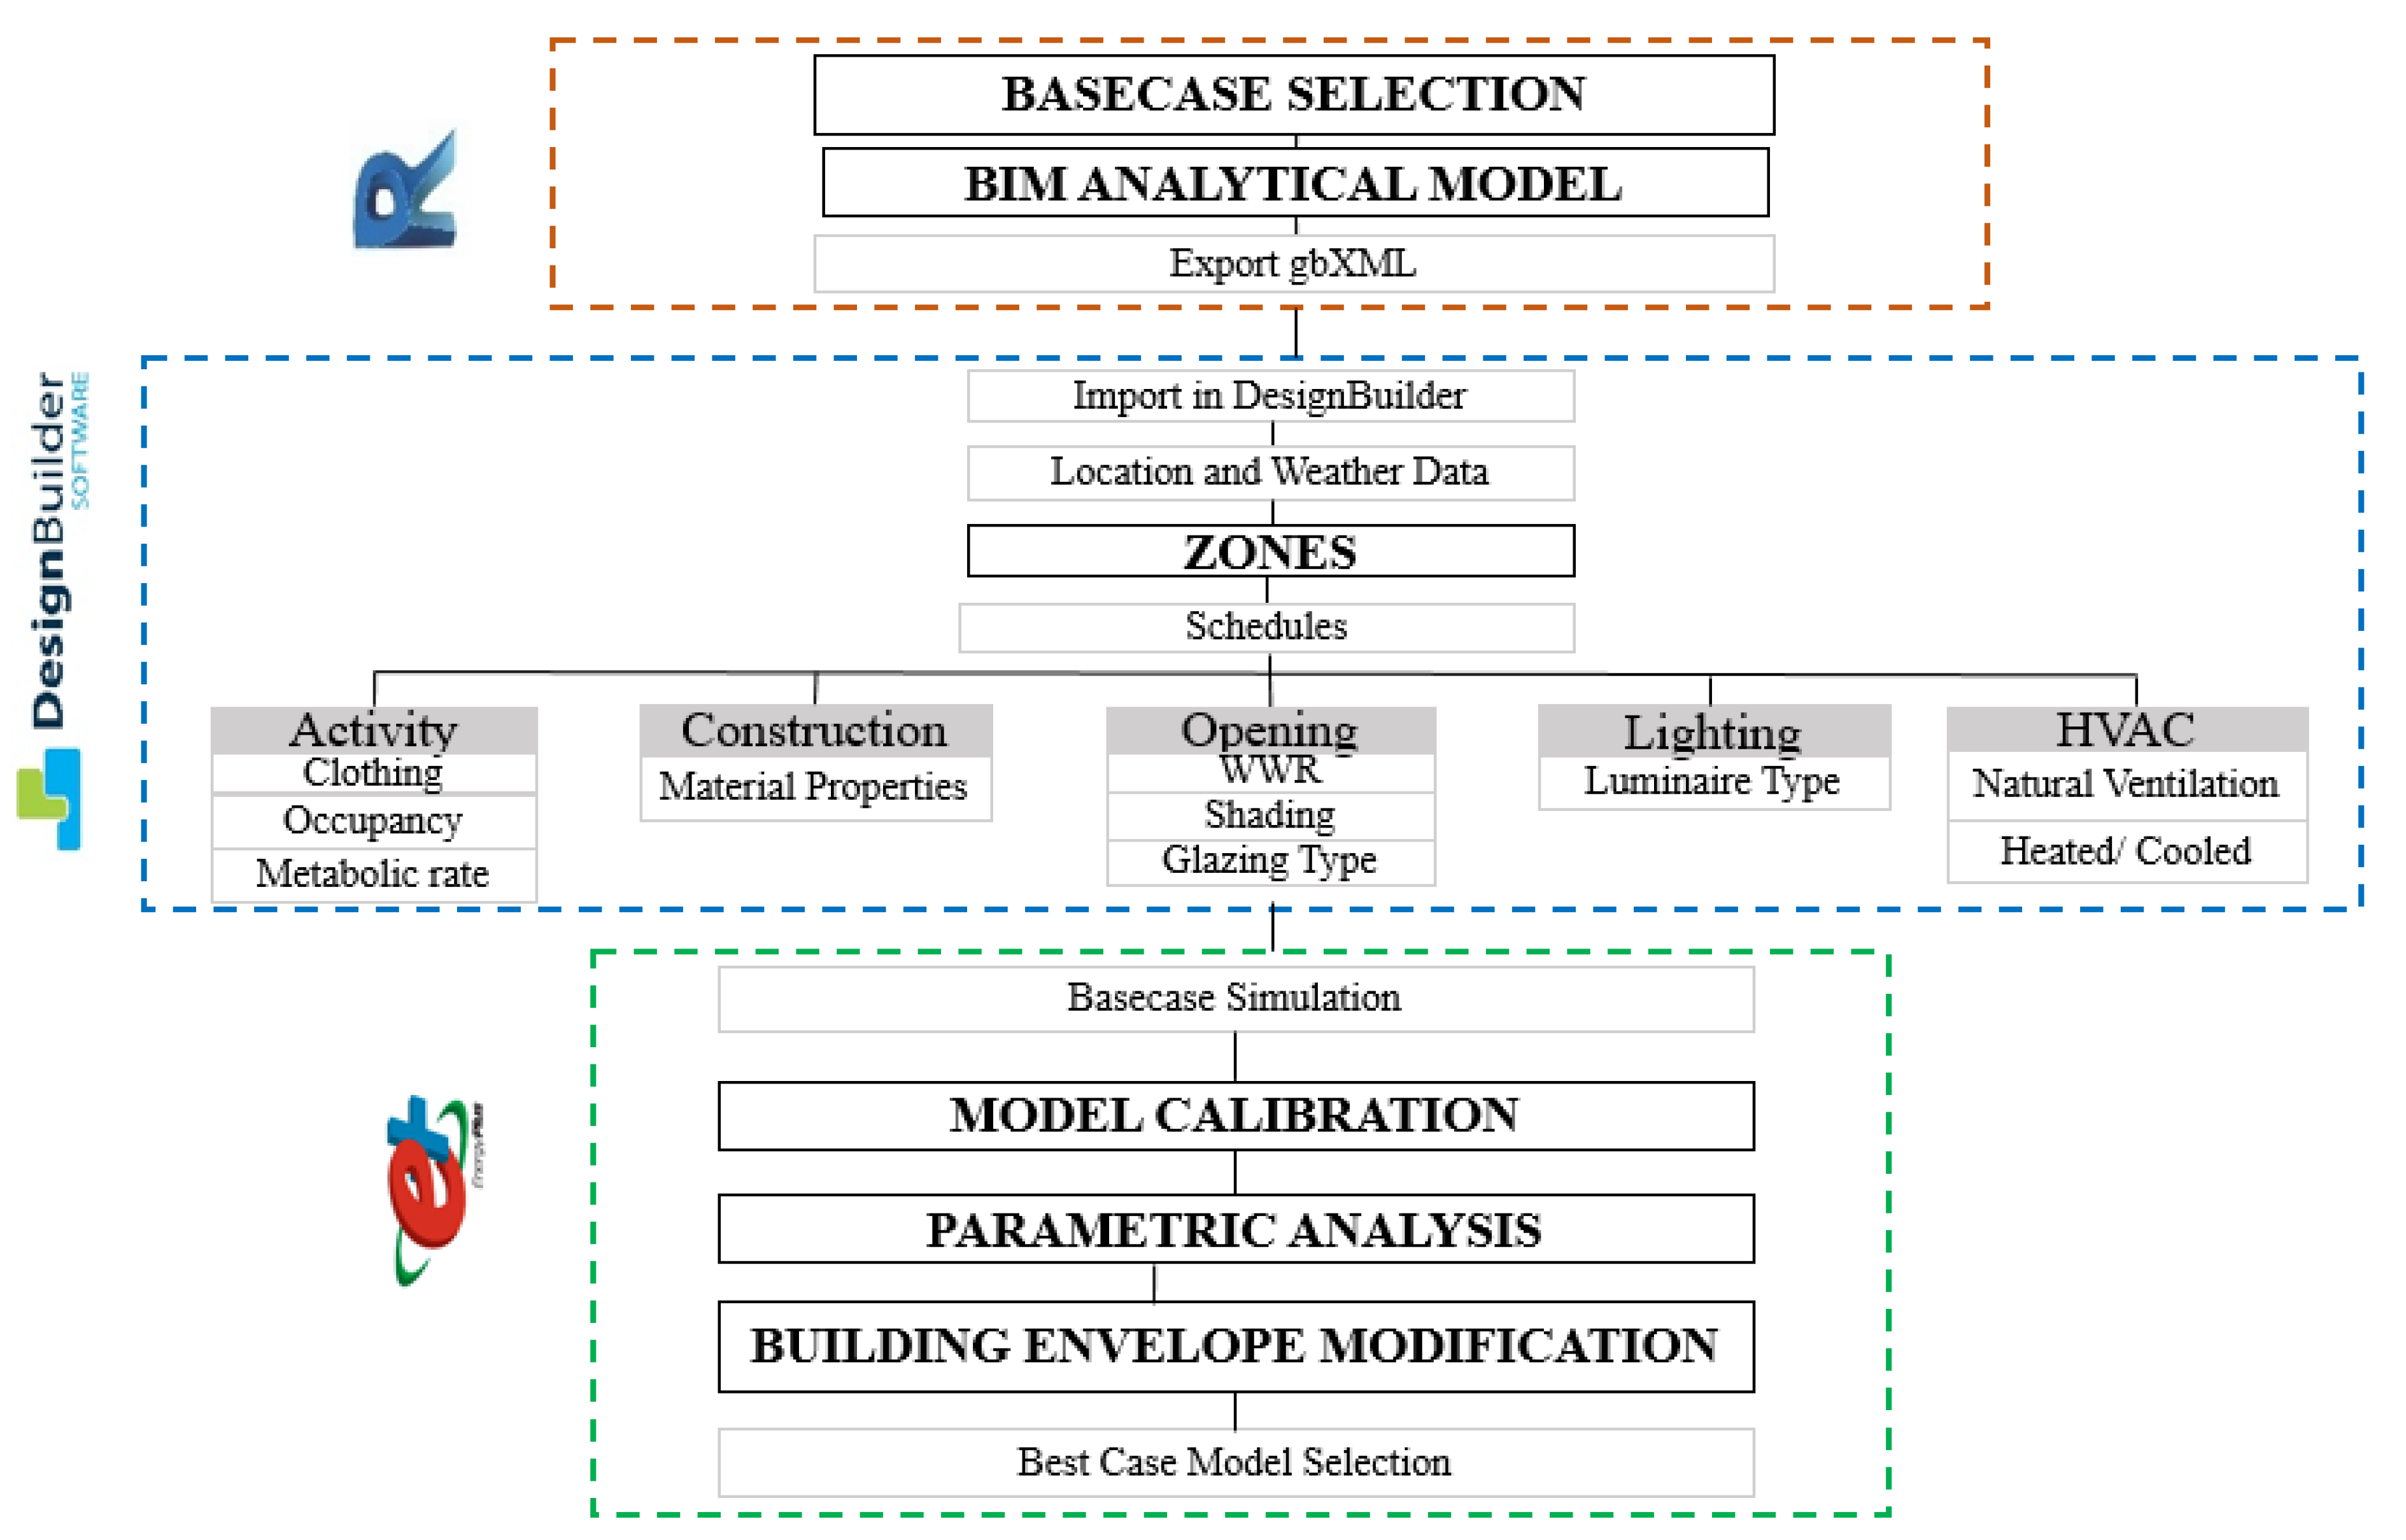
2. Materials and Methods
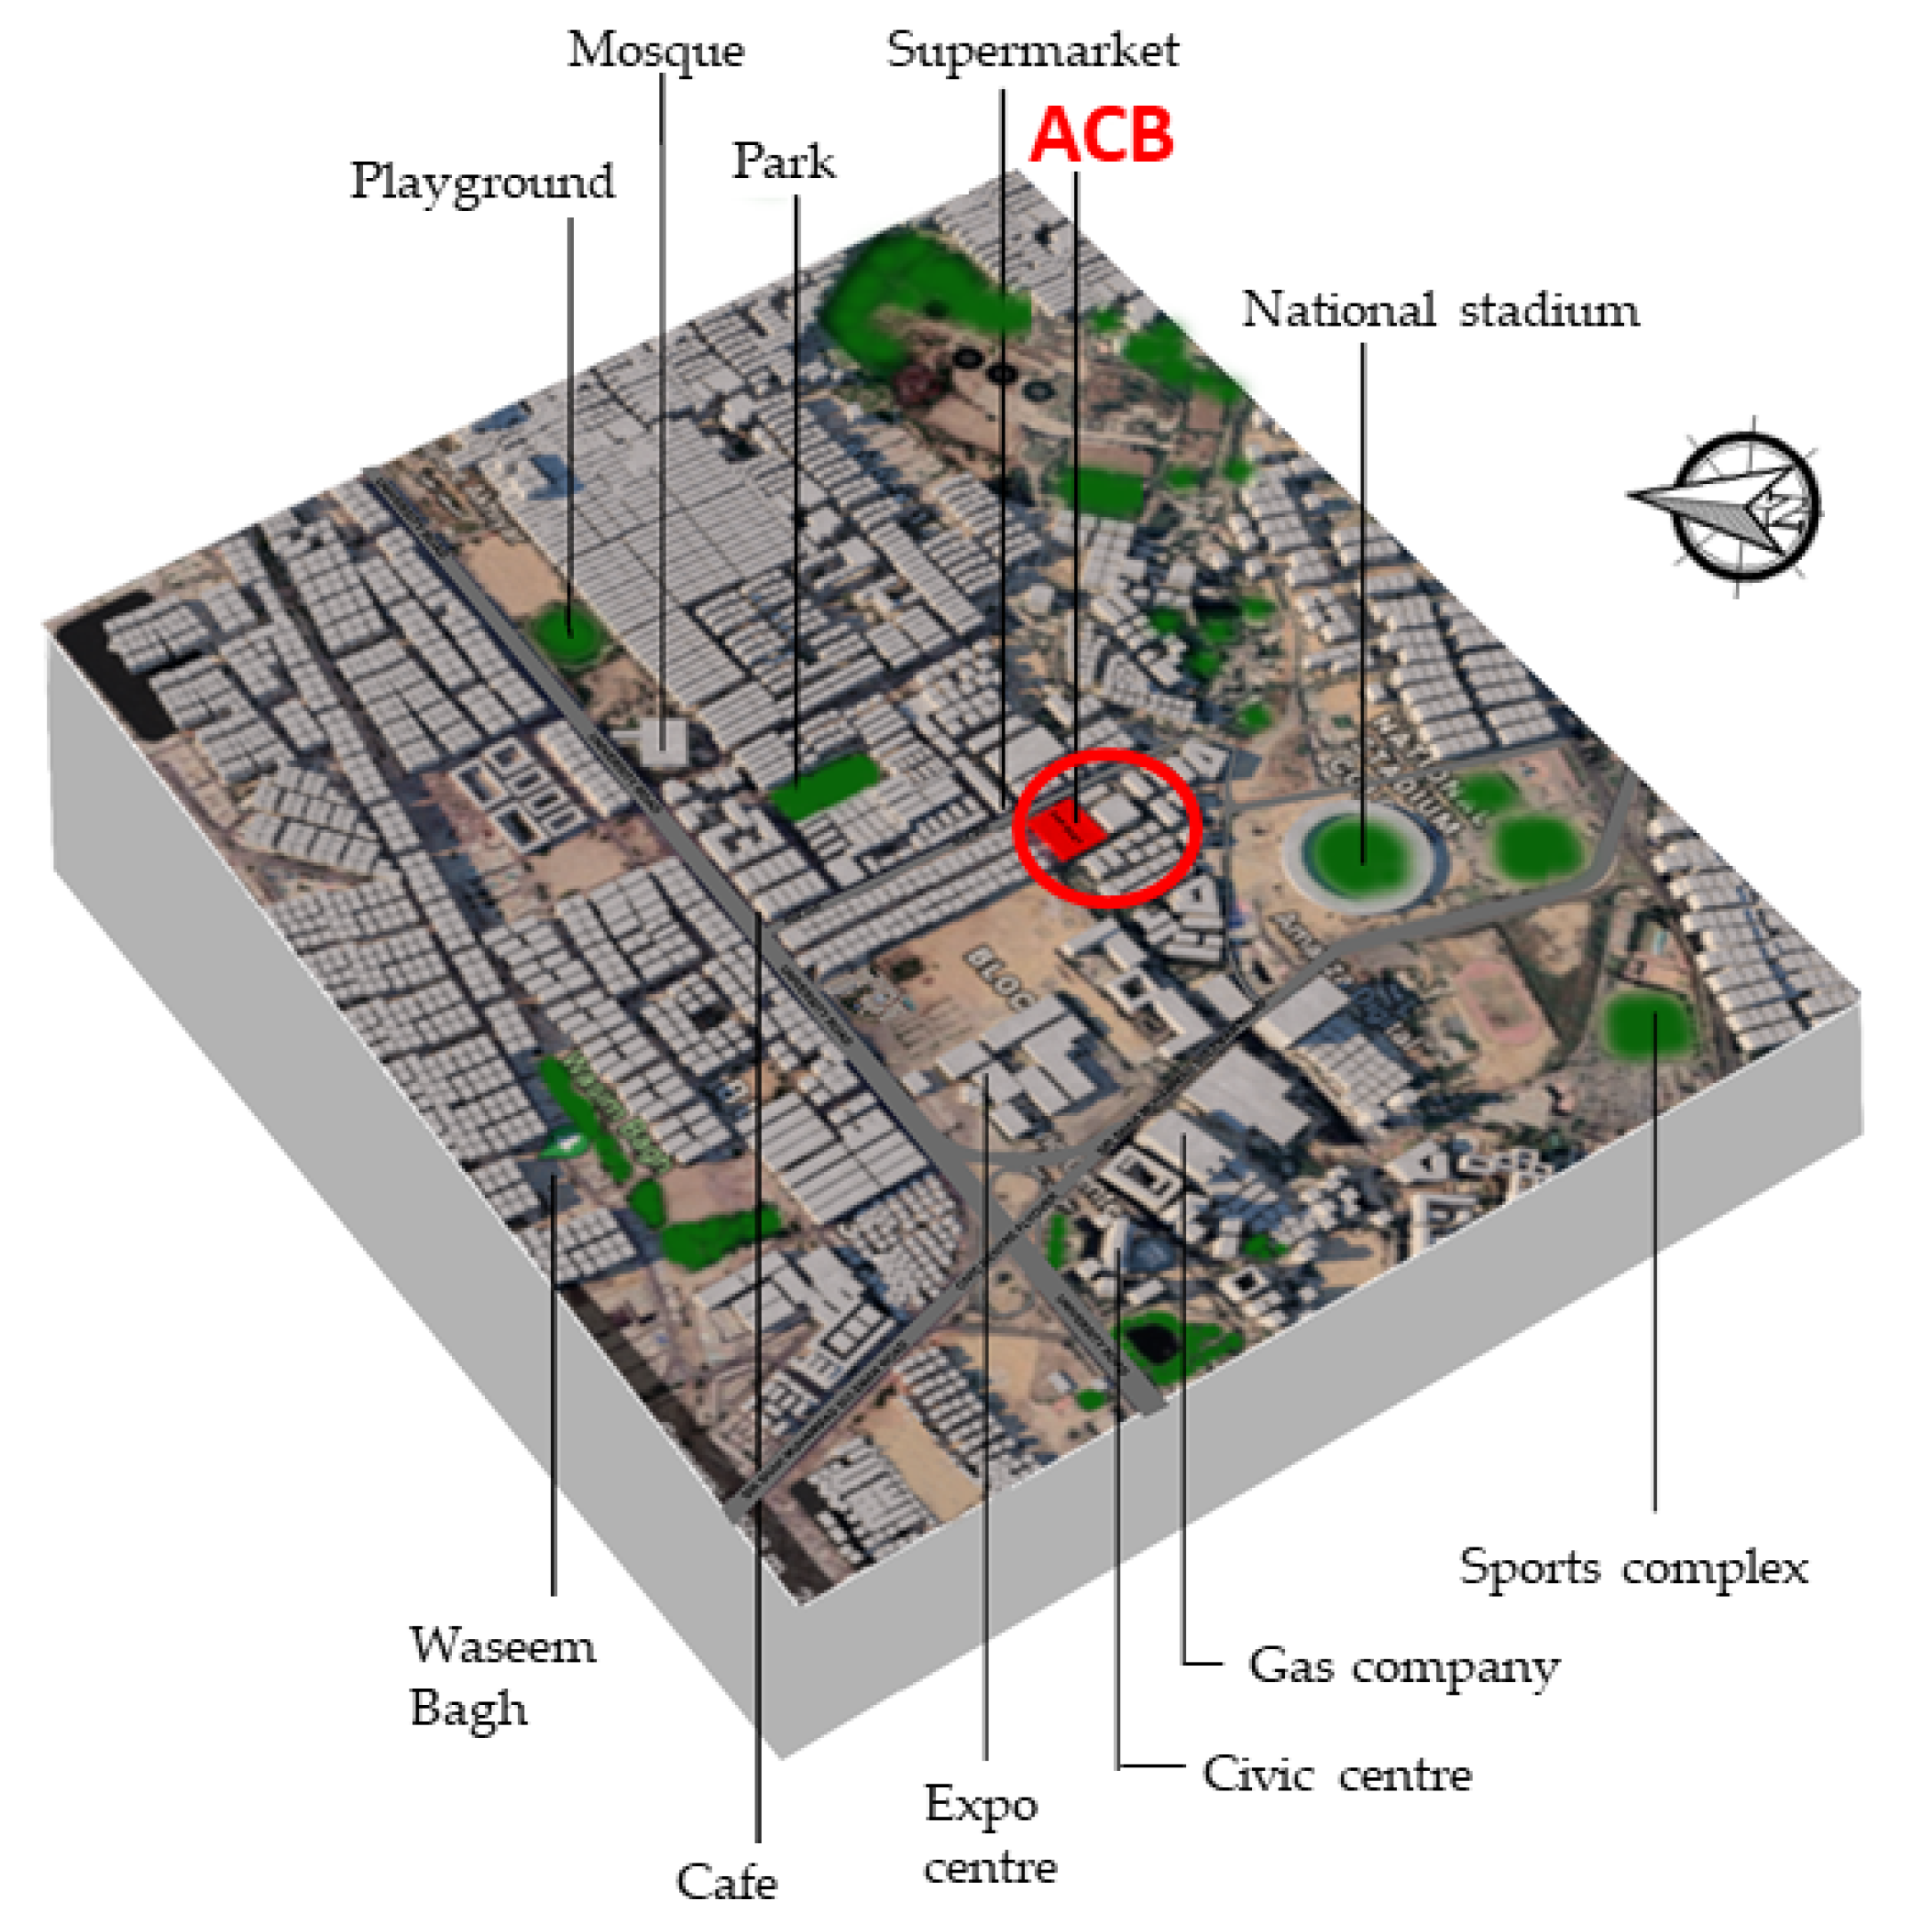
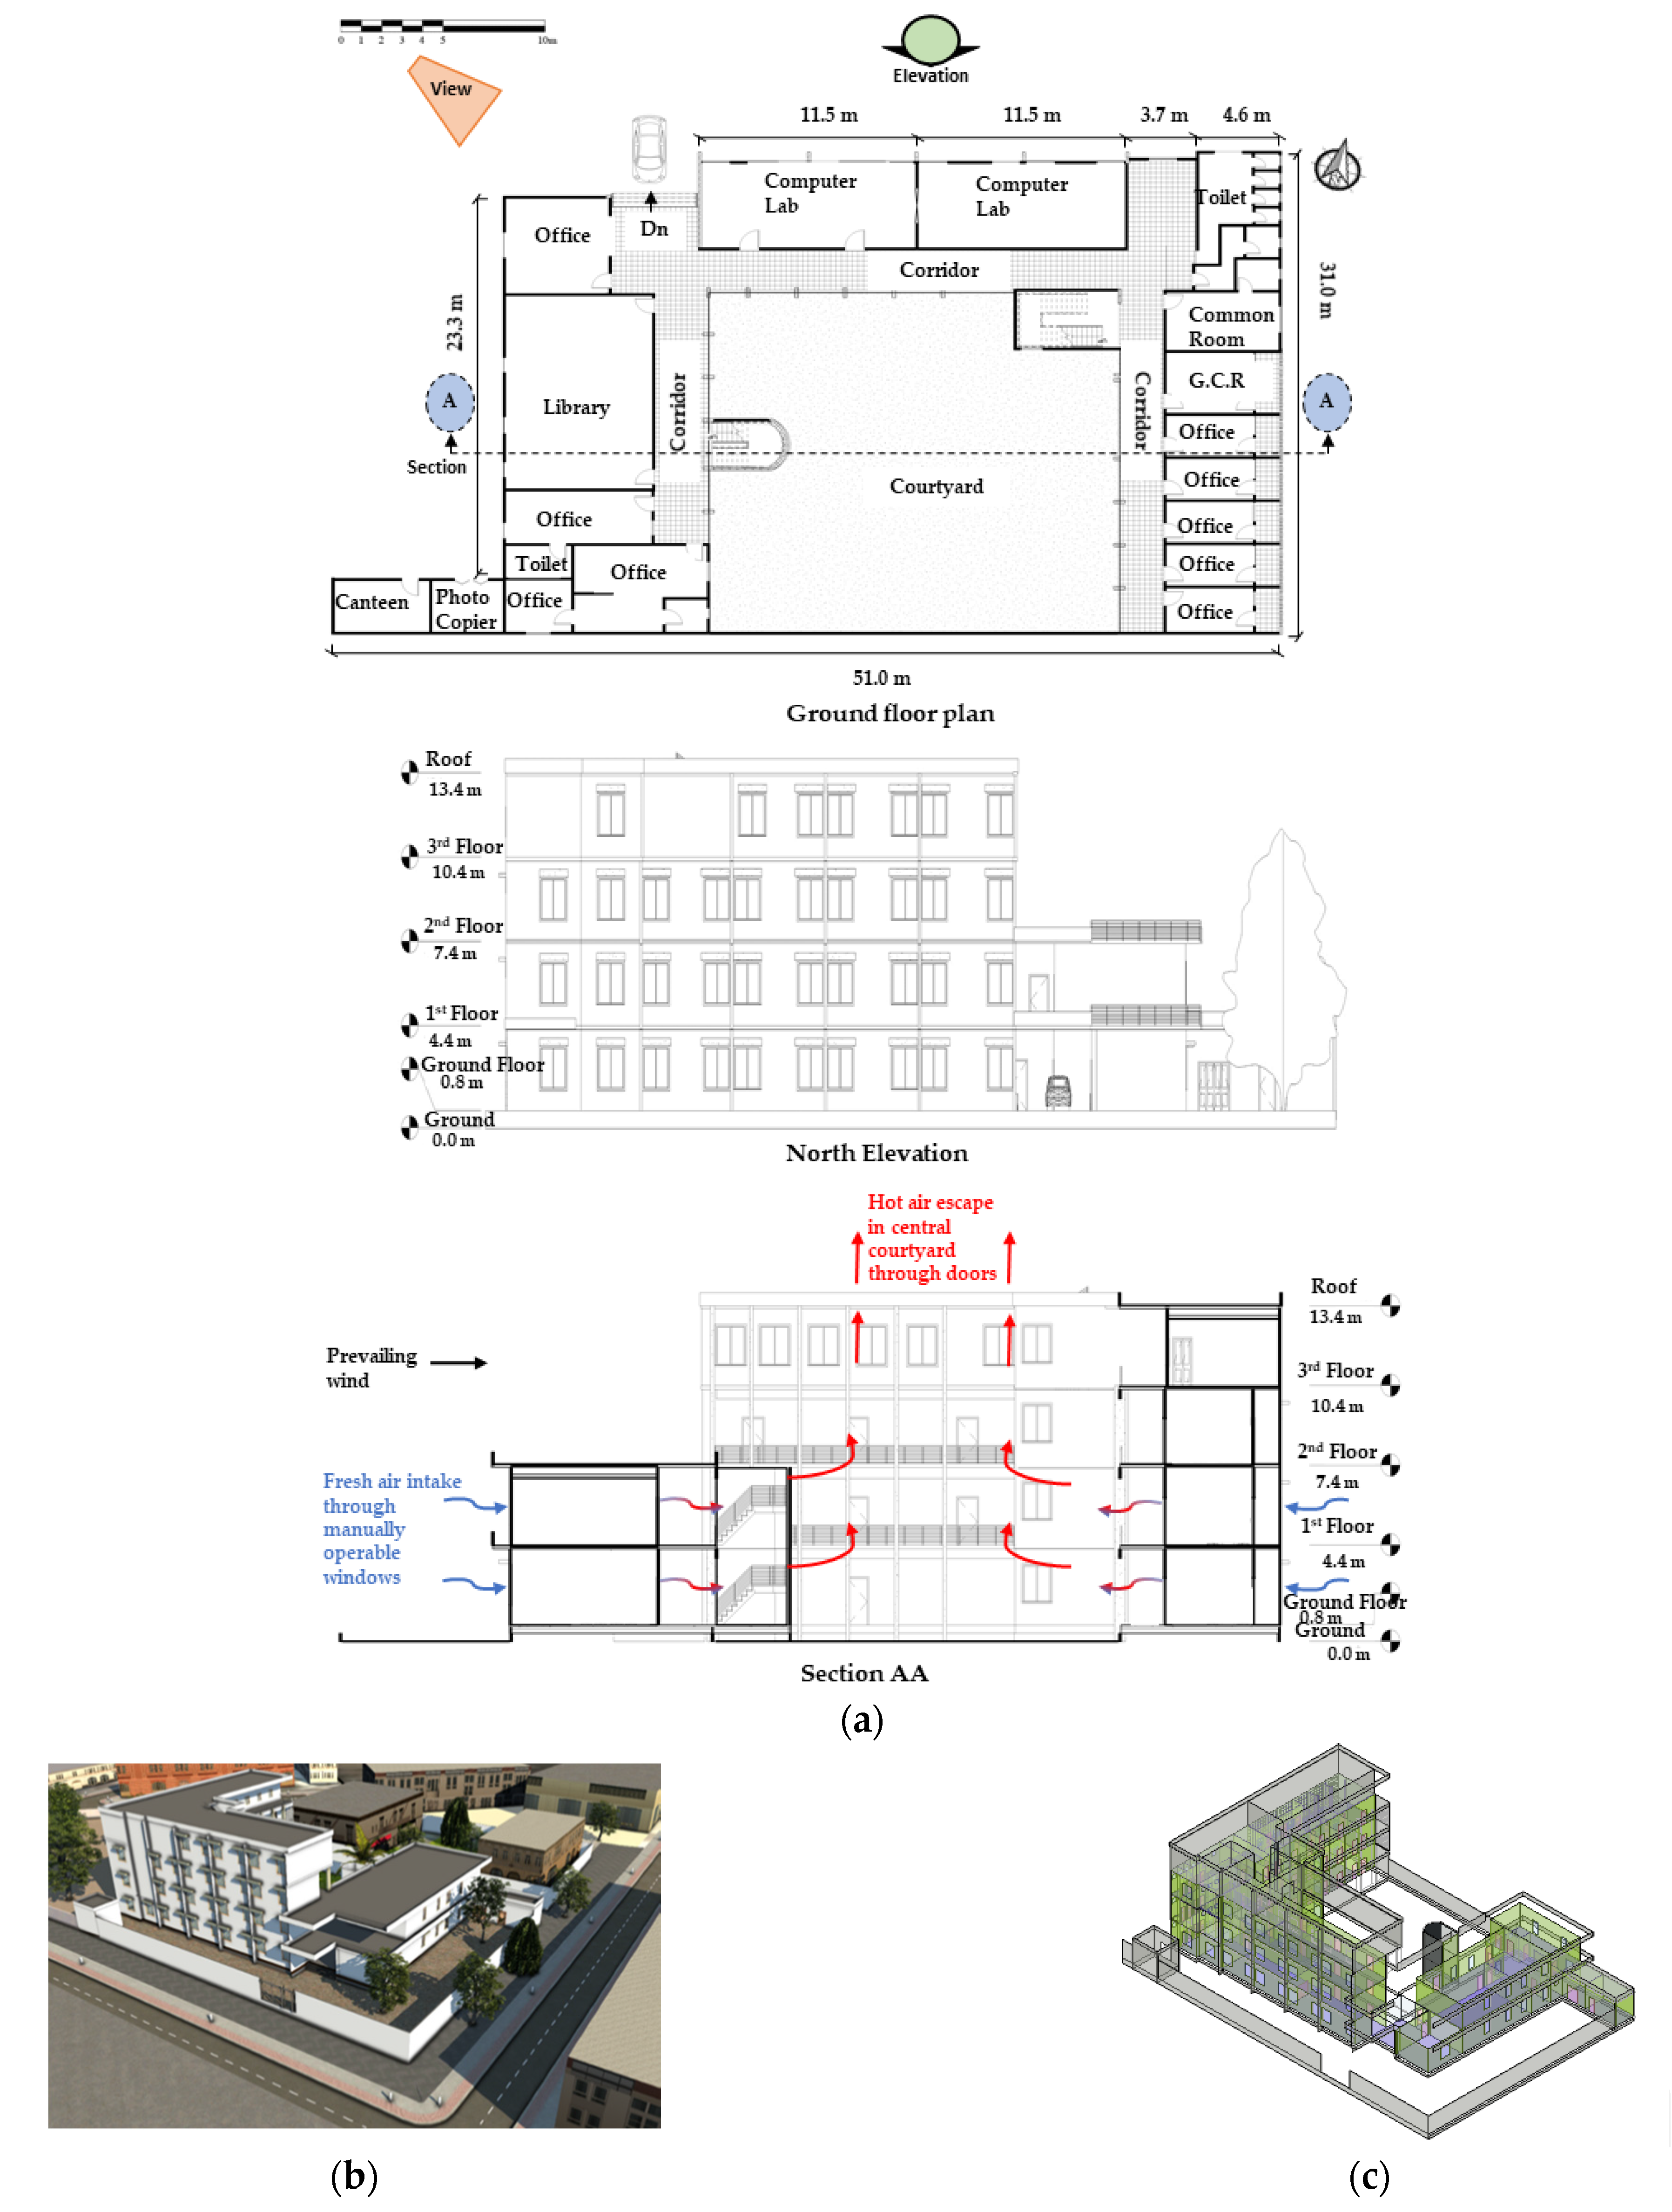
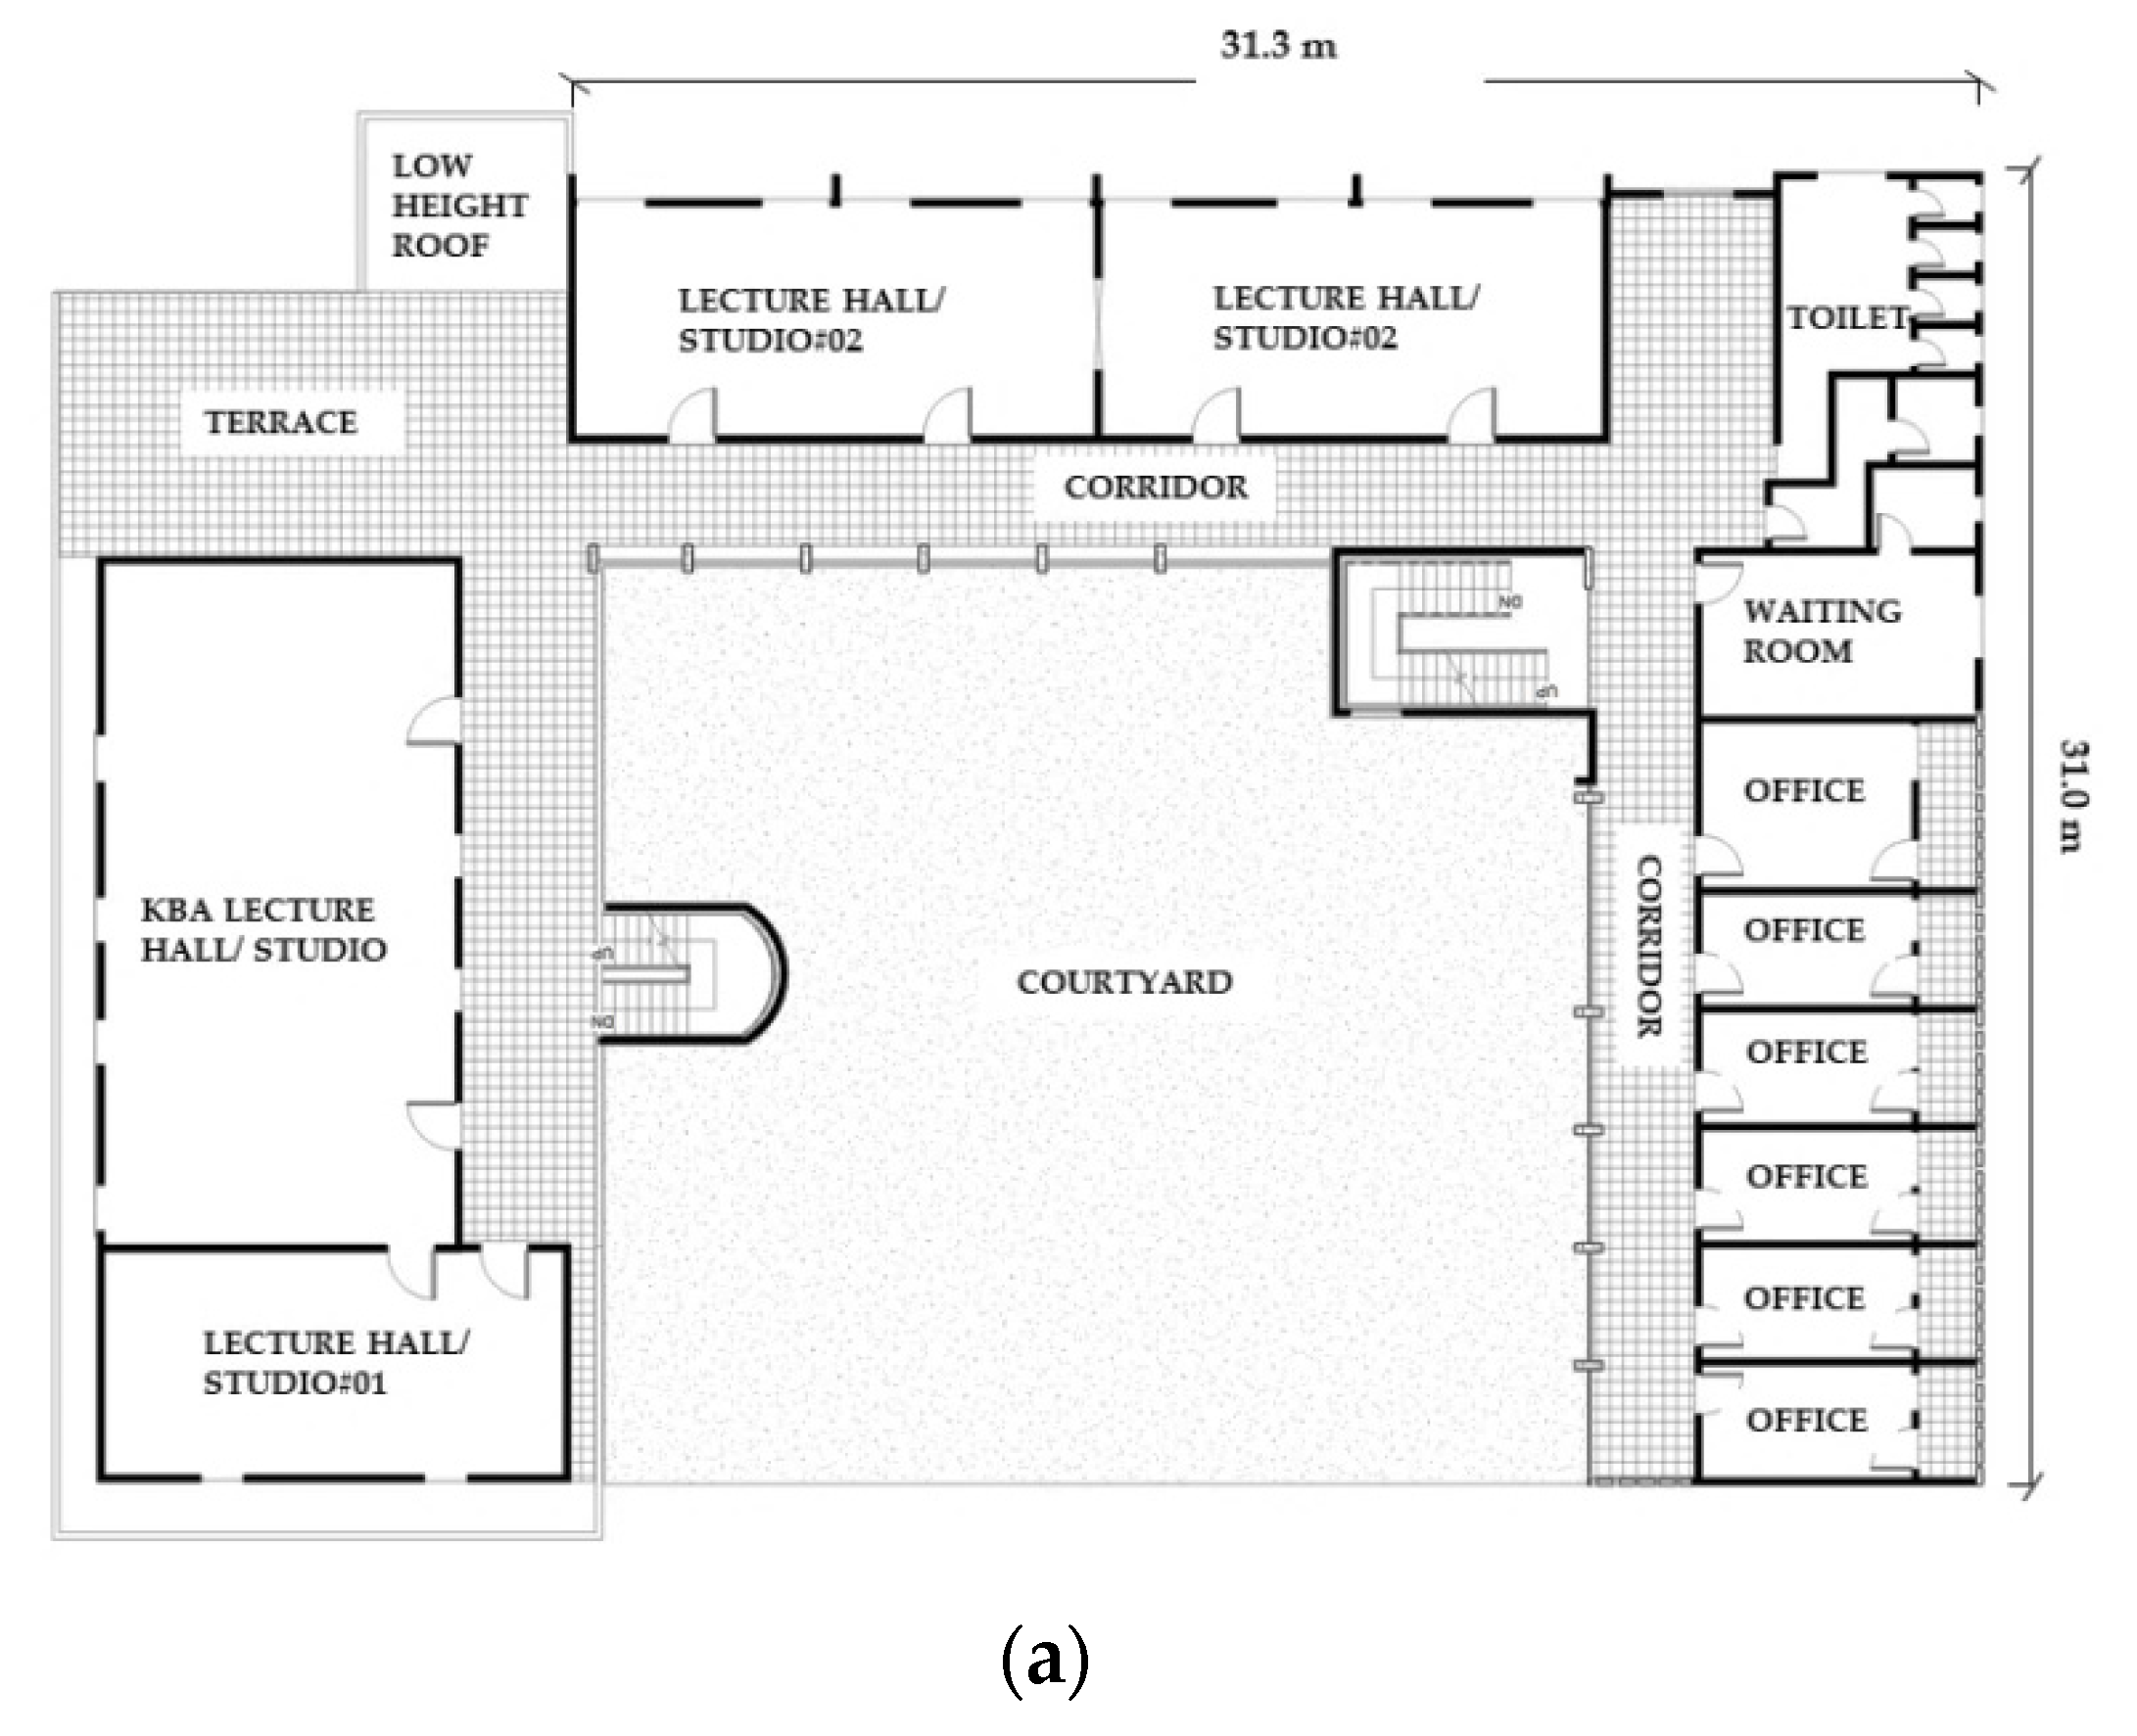
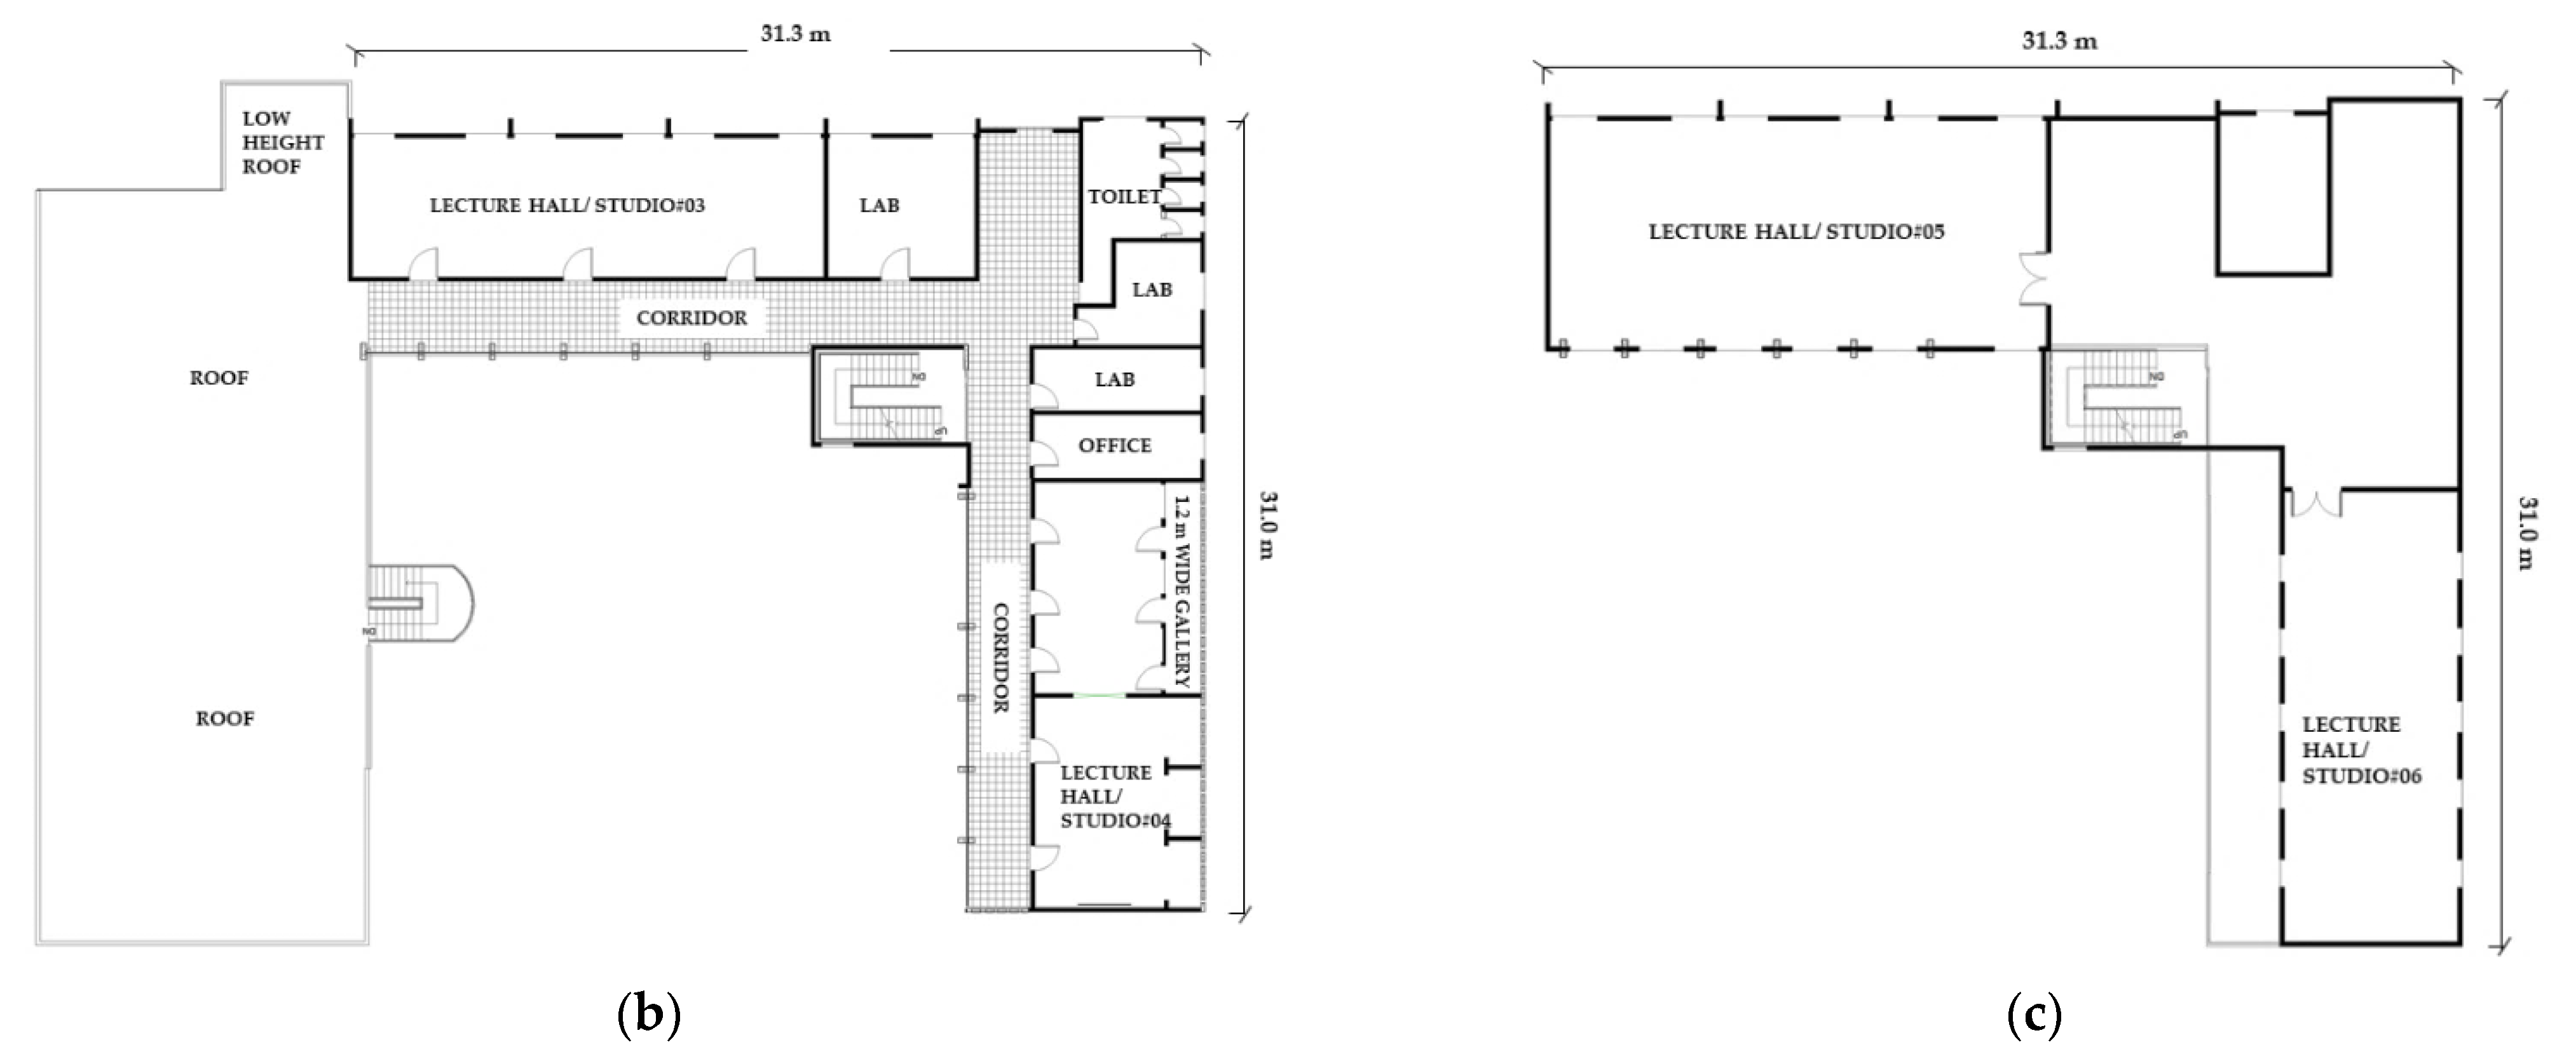
2.1. Base Case Building Modeling and Description
2.2. Calibration of the Model
3. Results
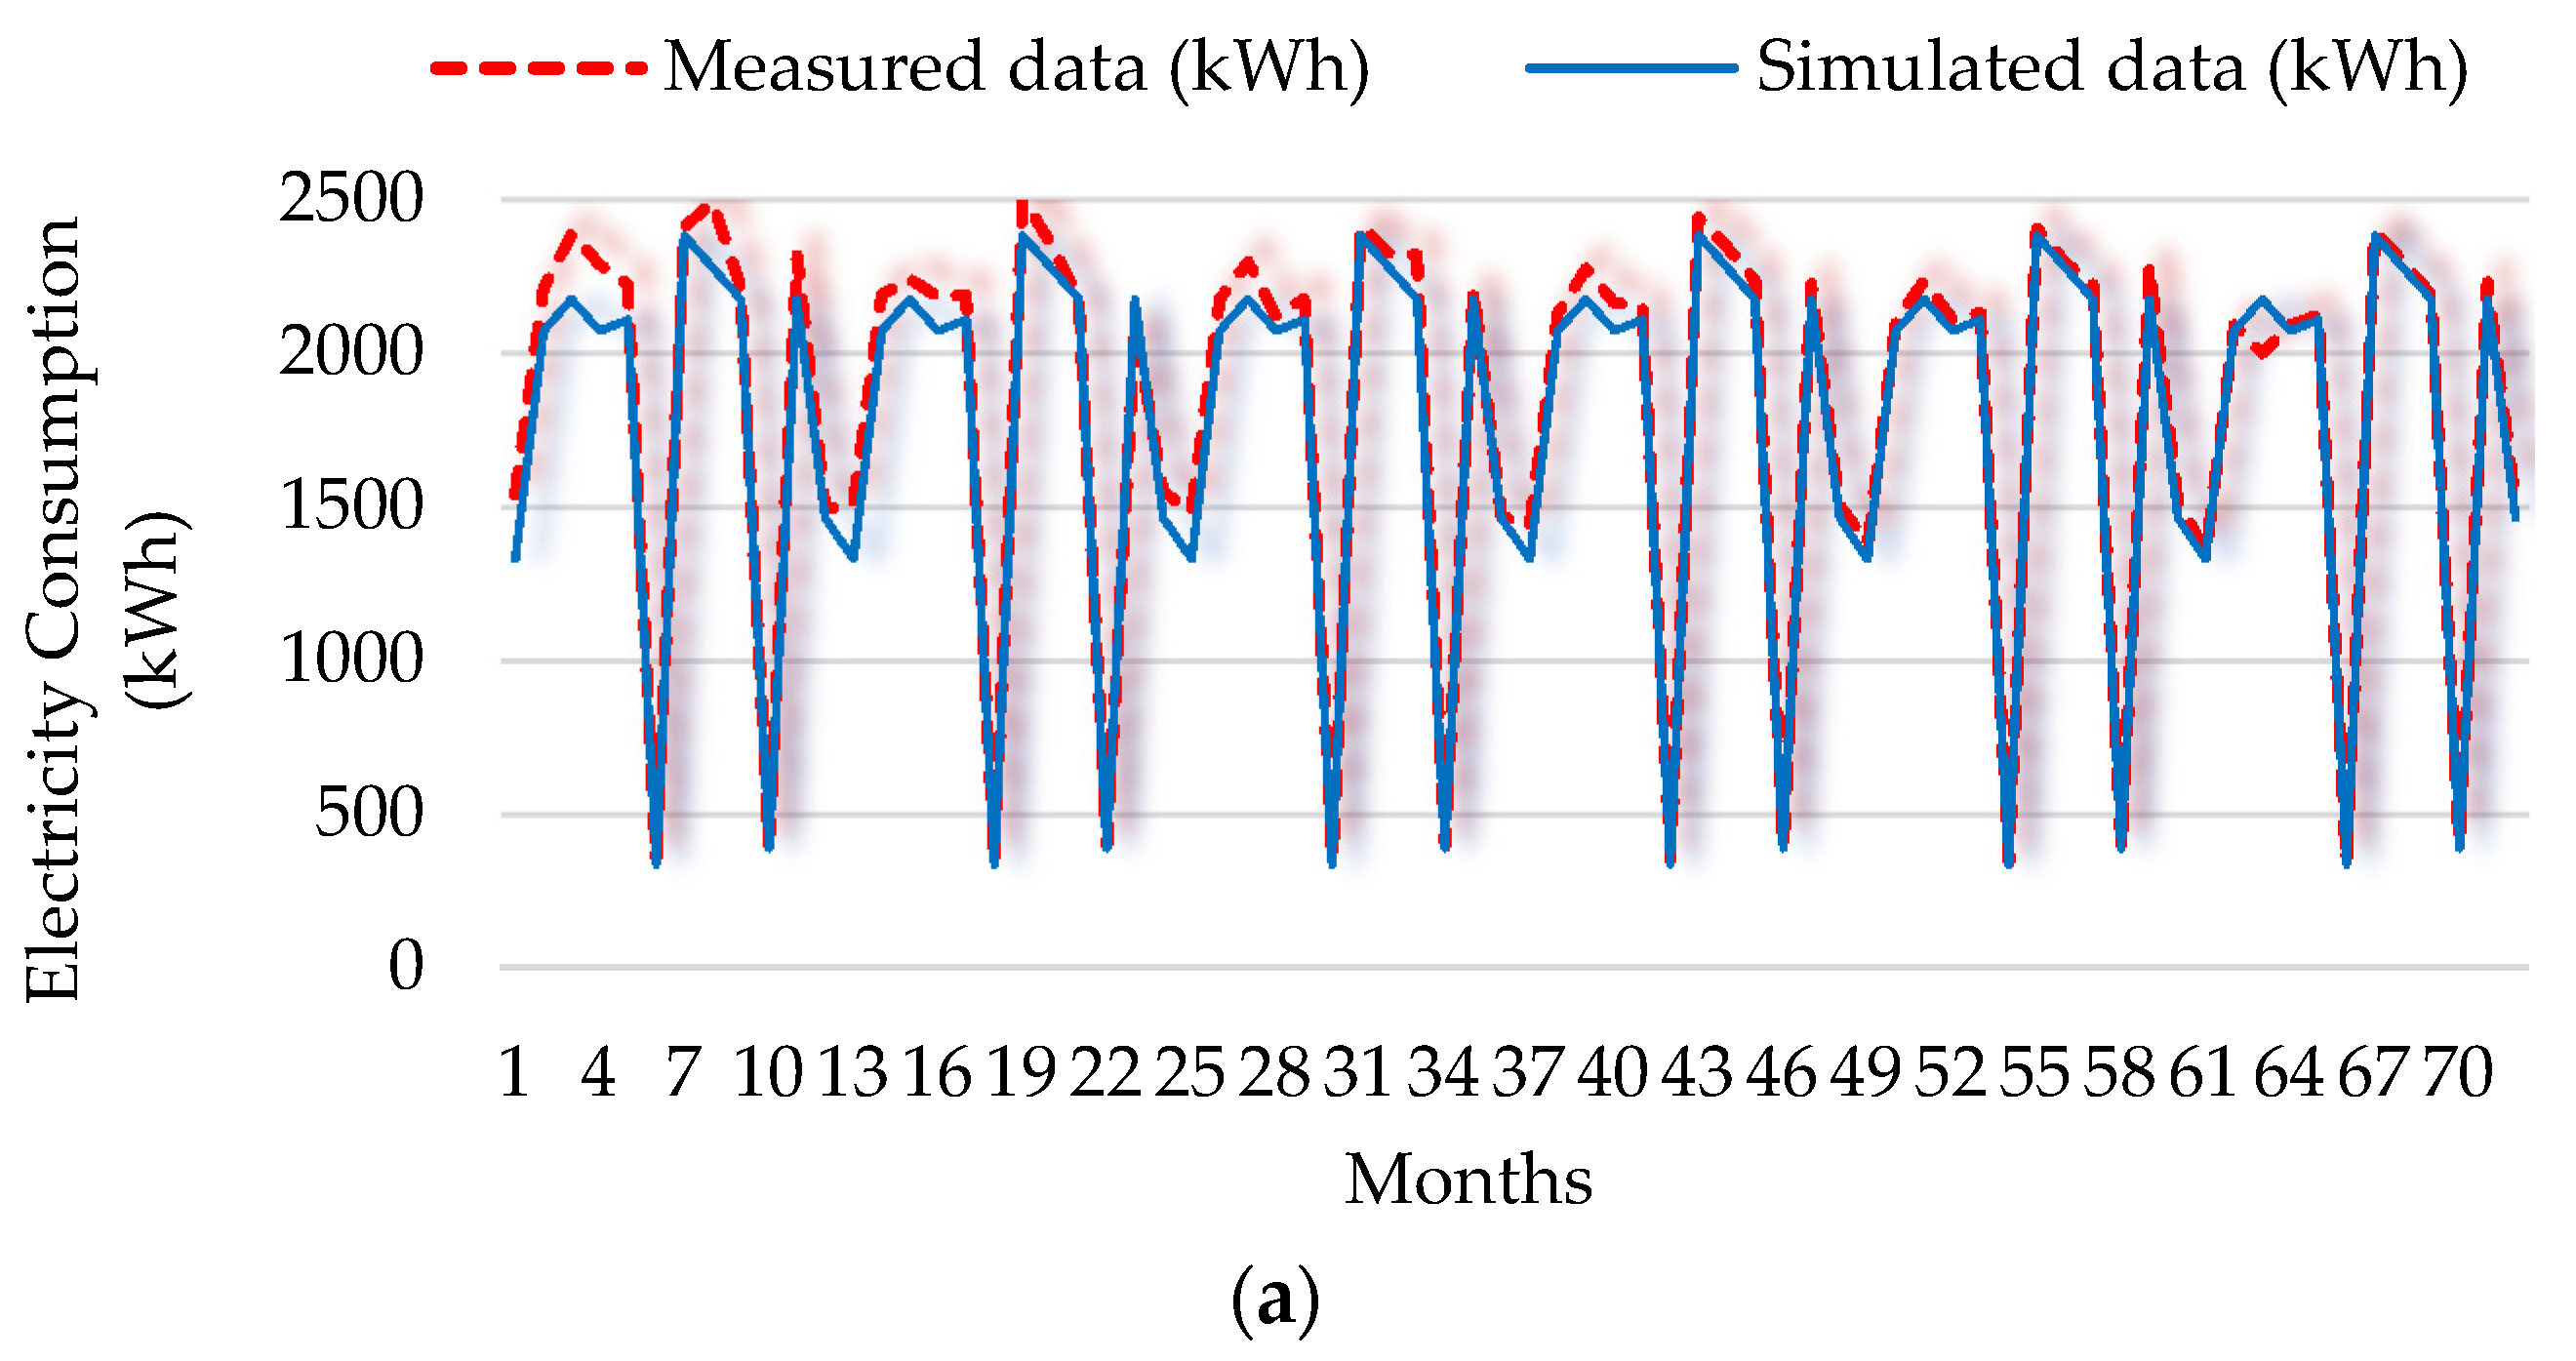
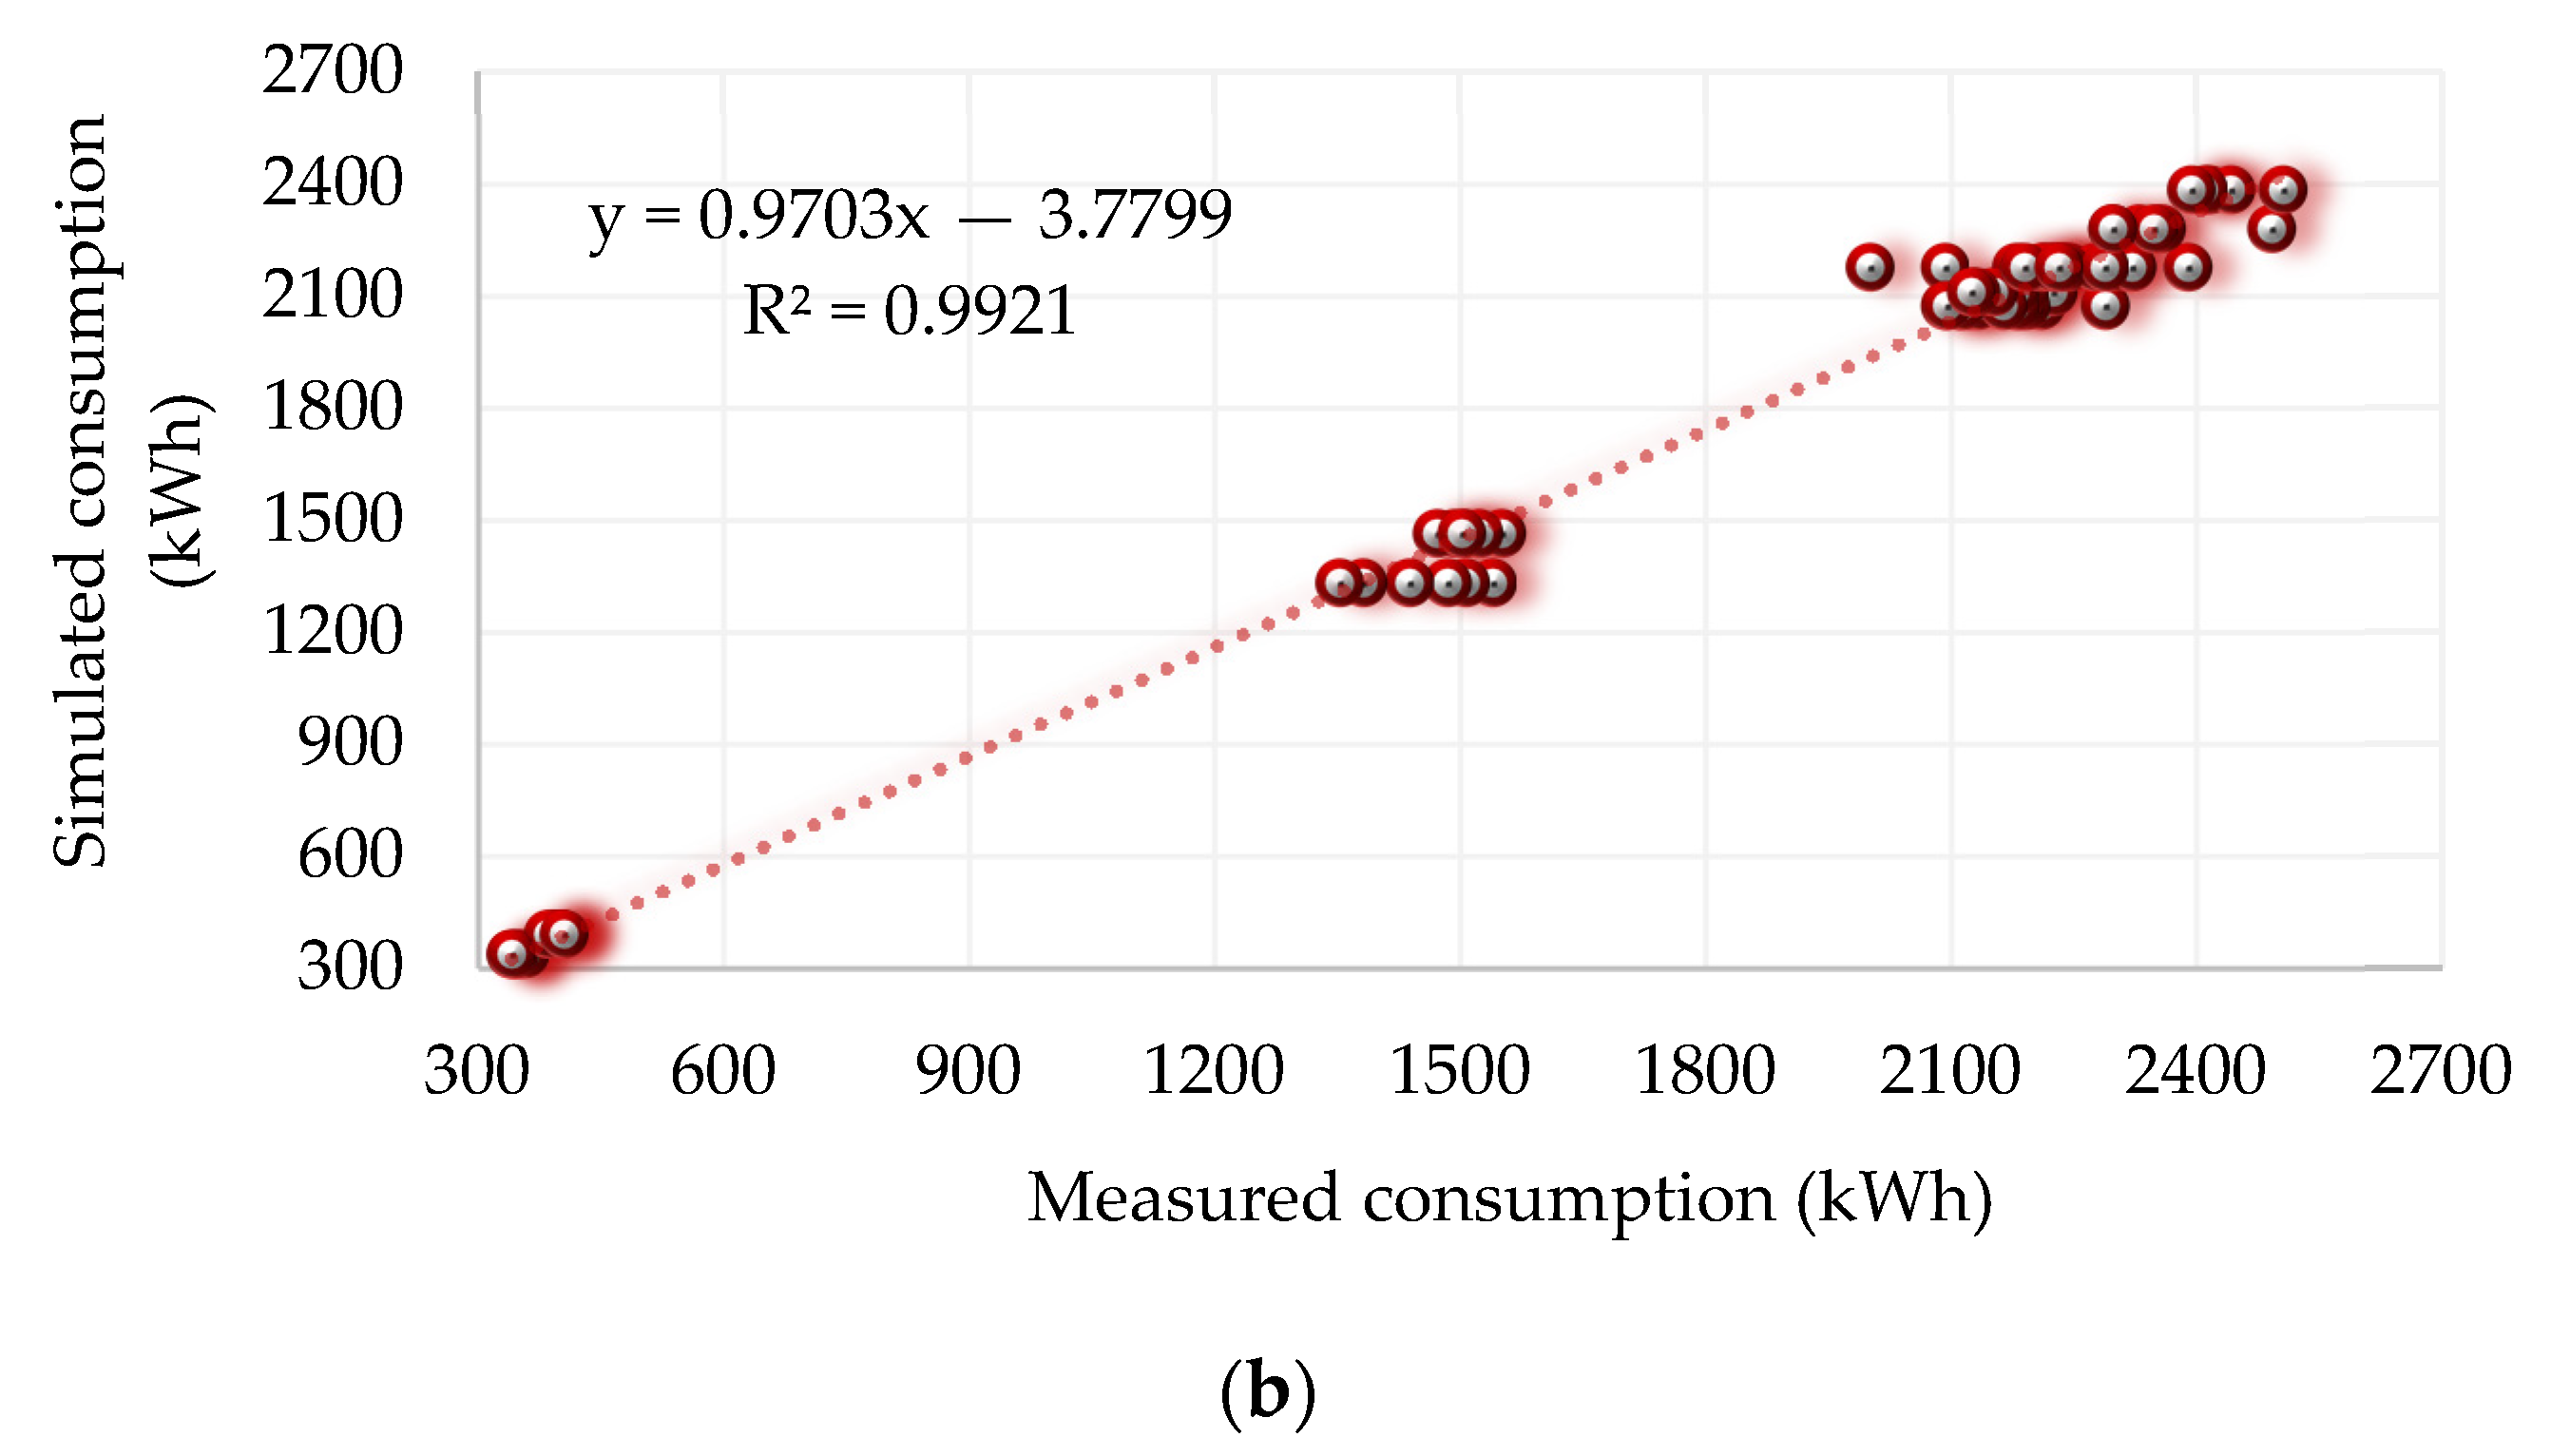
3.1. Calibration of the Model
3.2. PEEM
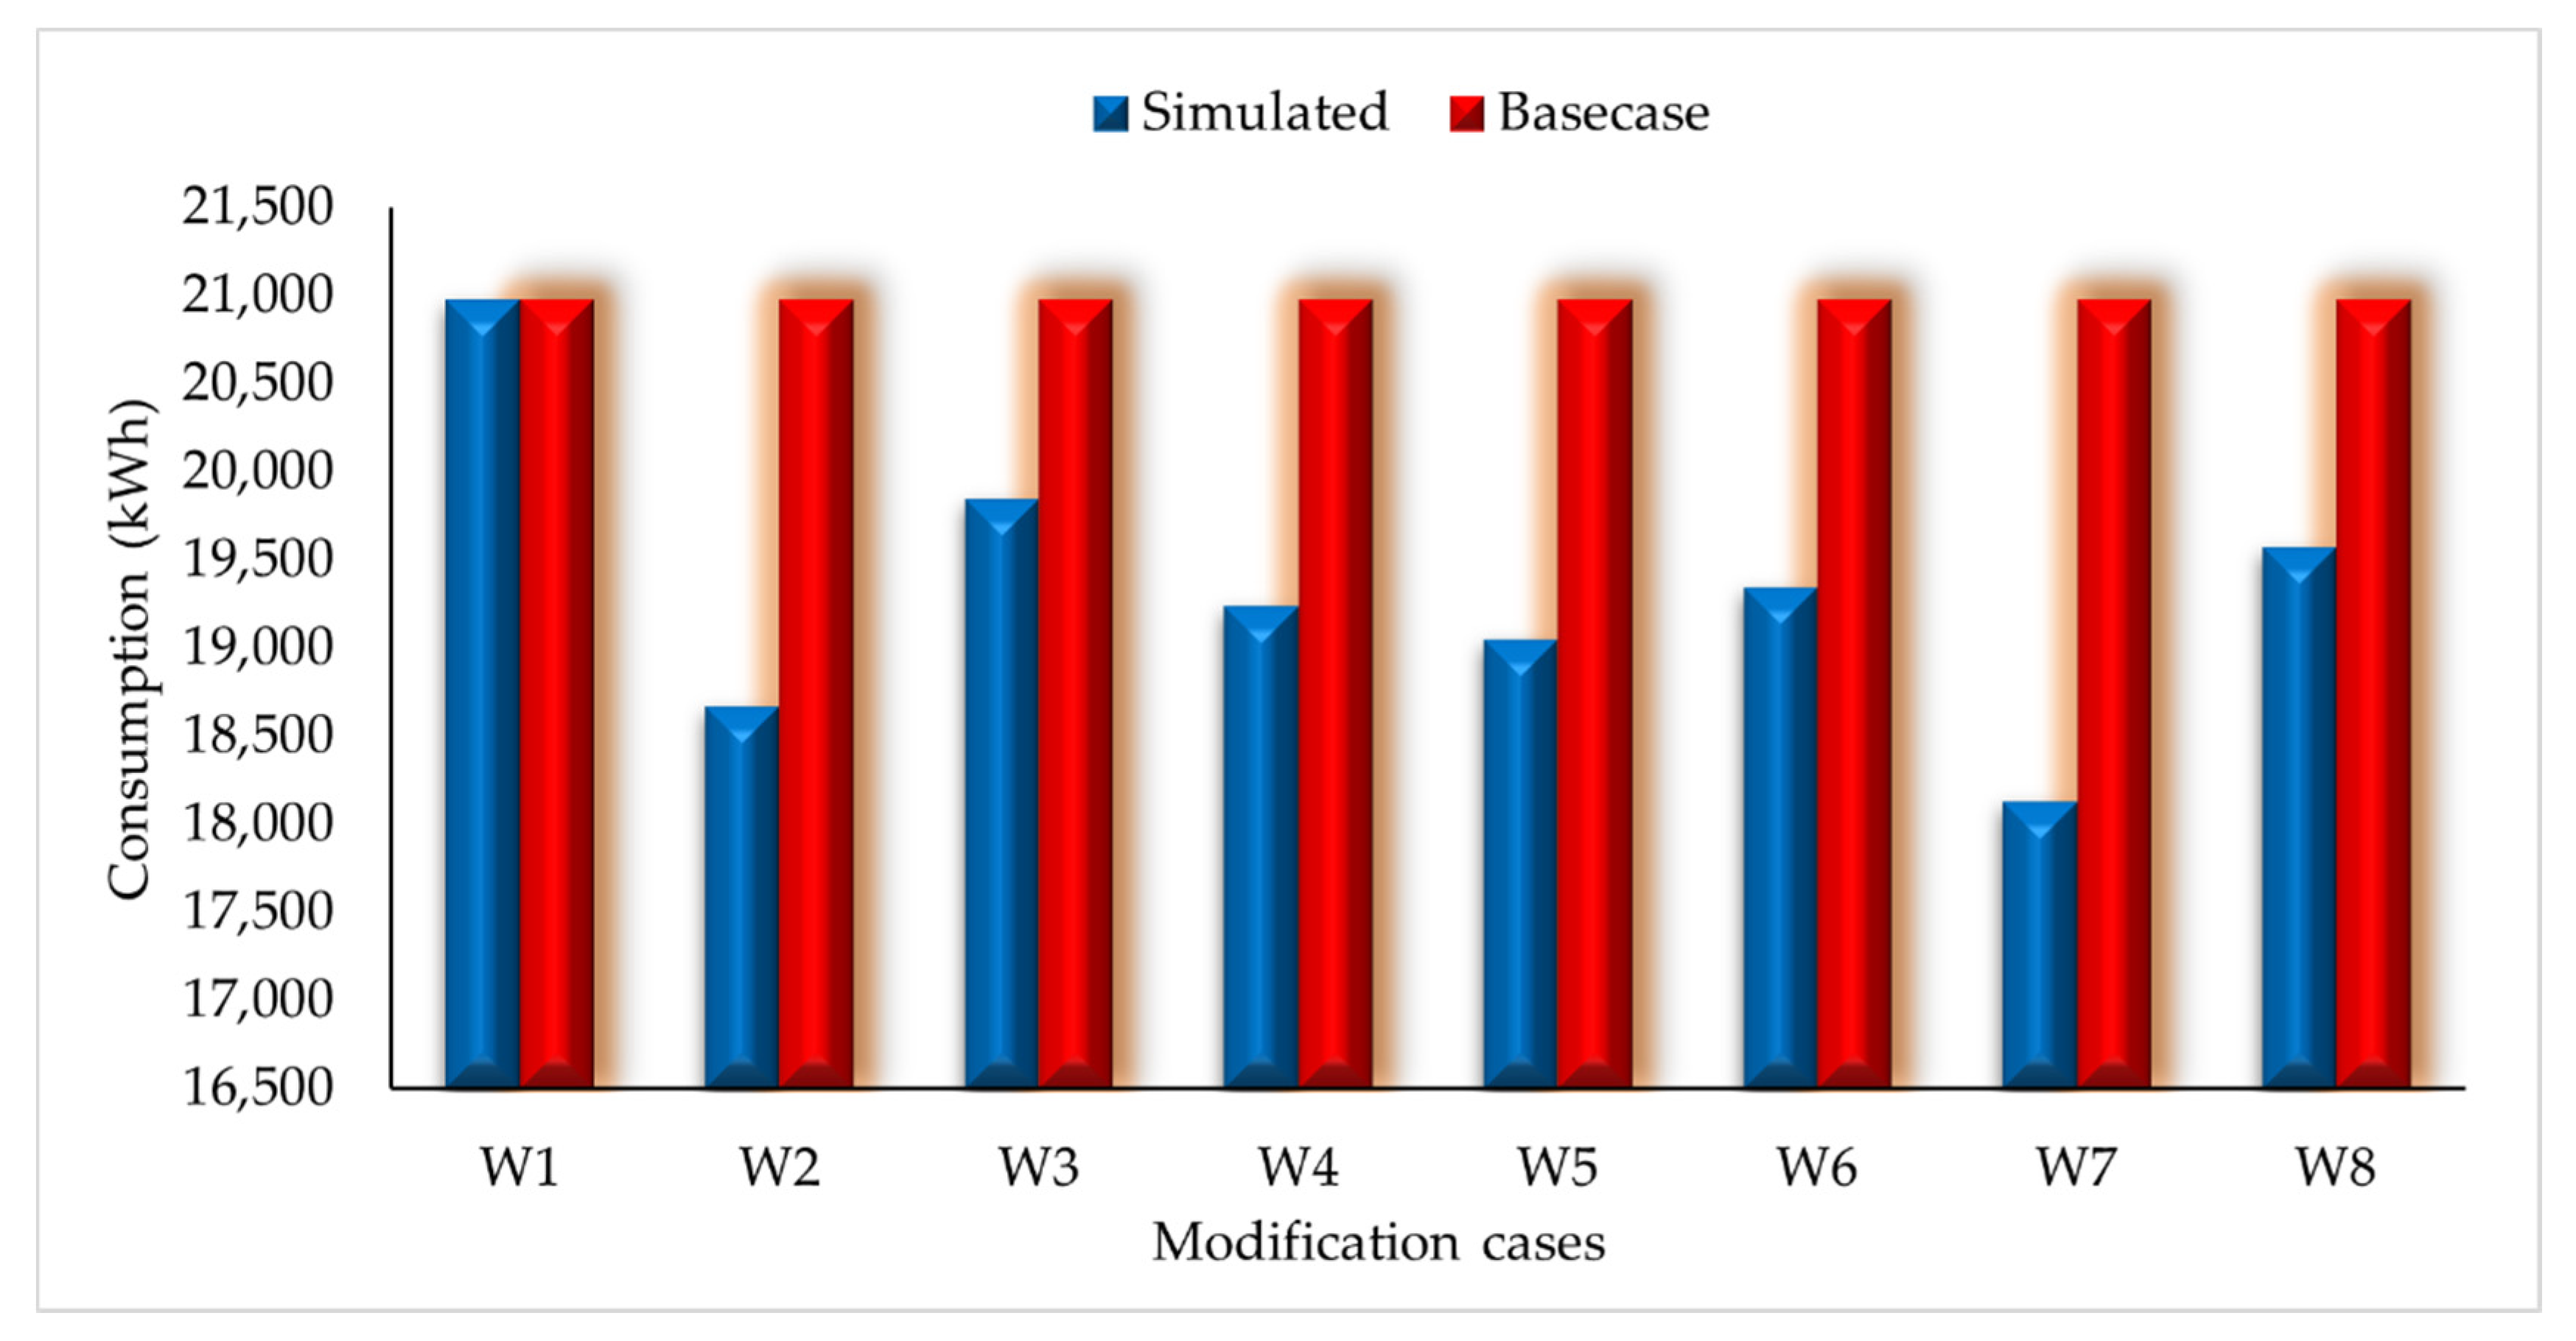
3.2.1. PEEM Alternative #1 (Wall)
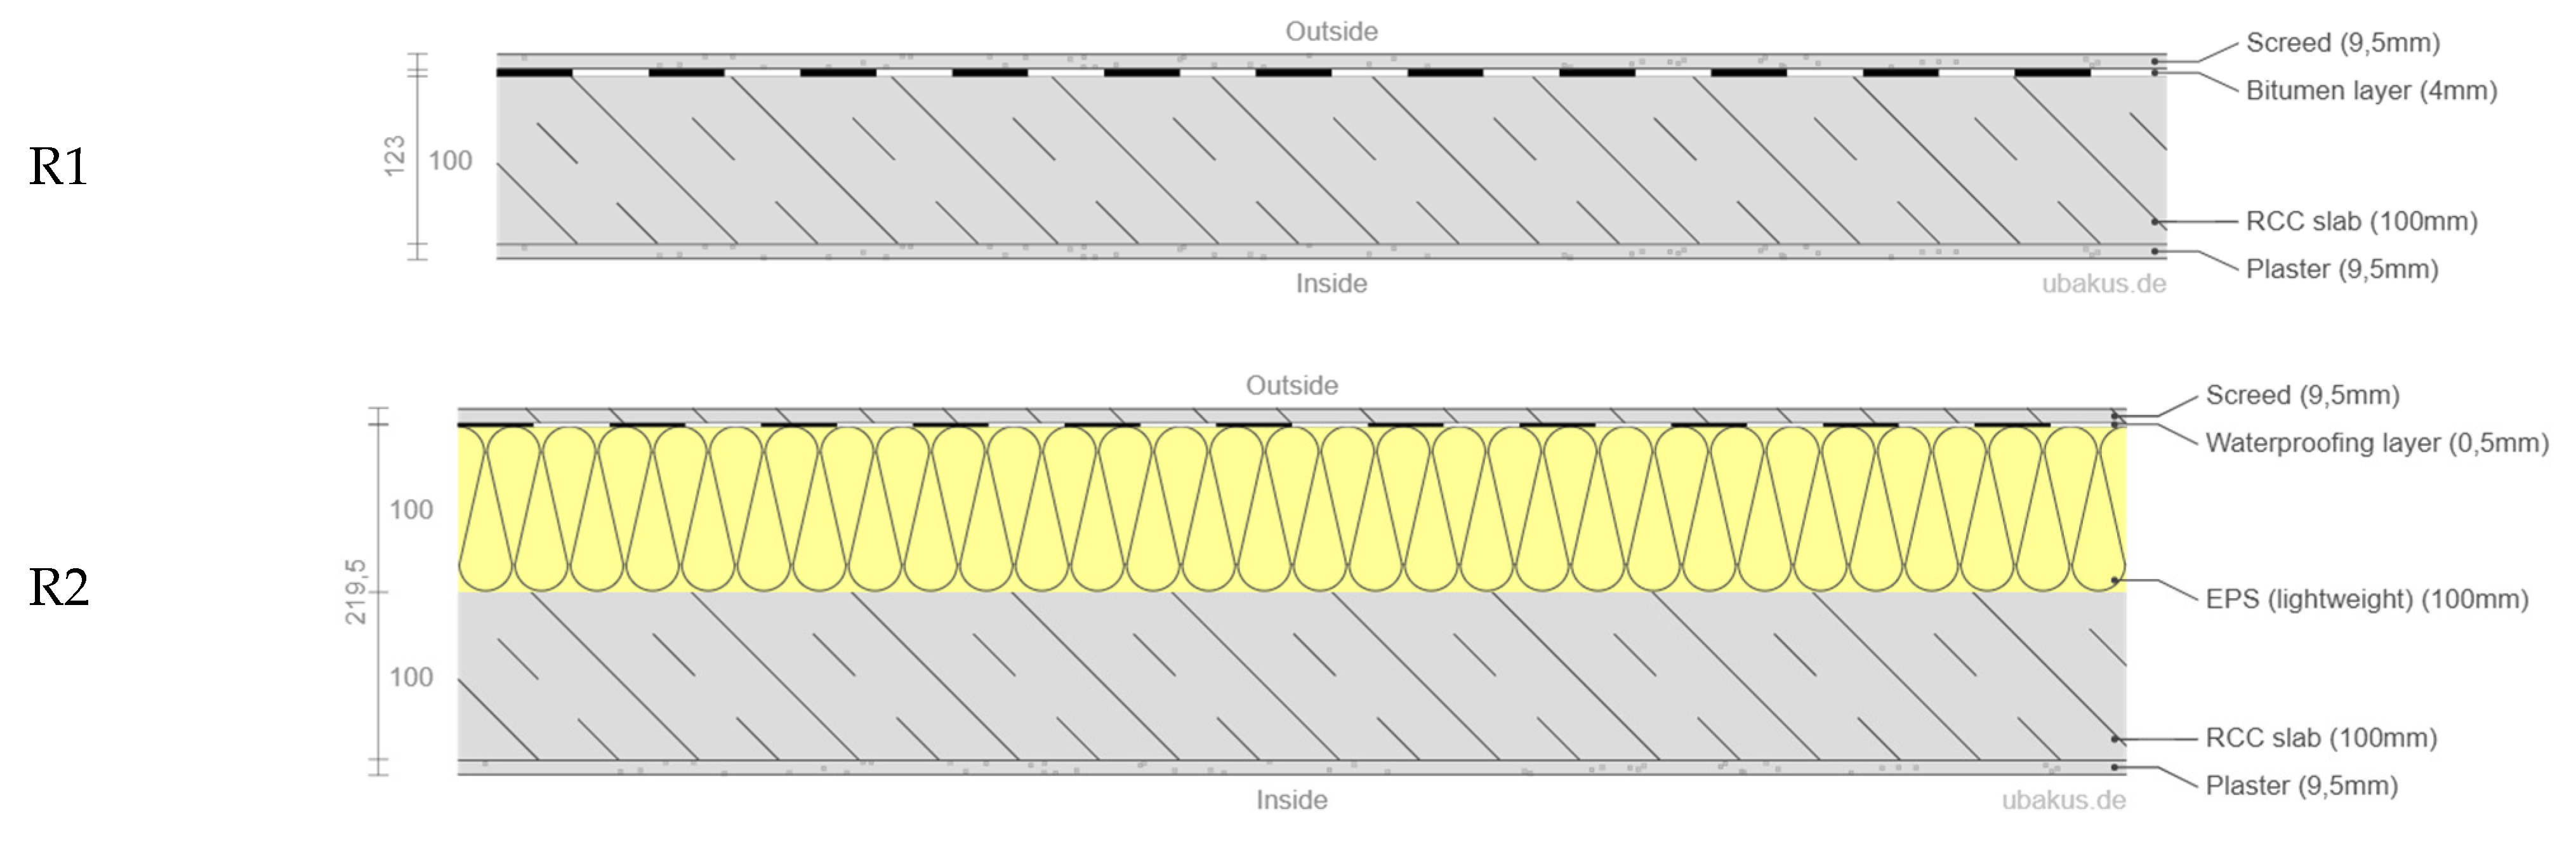
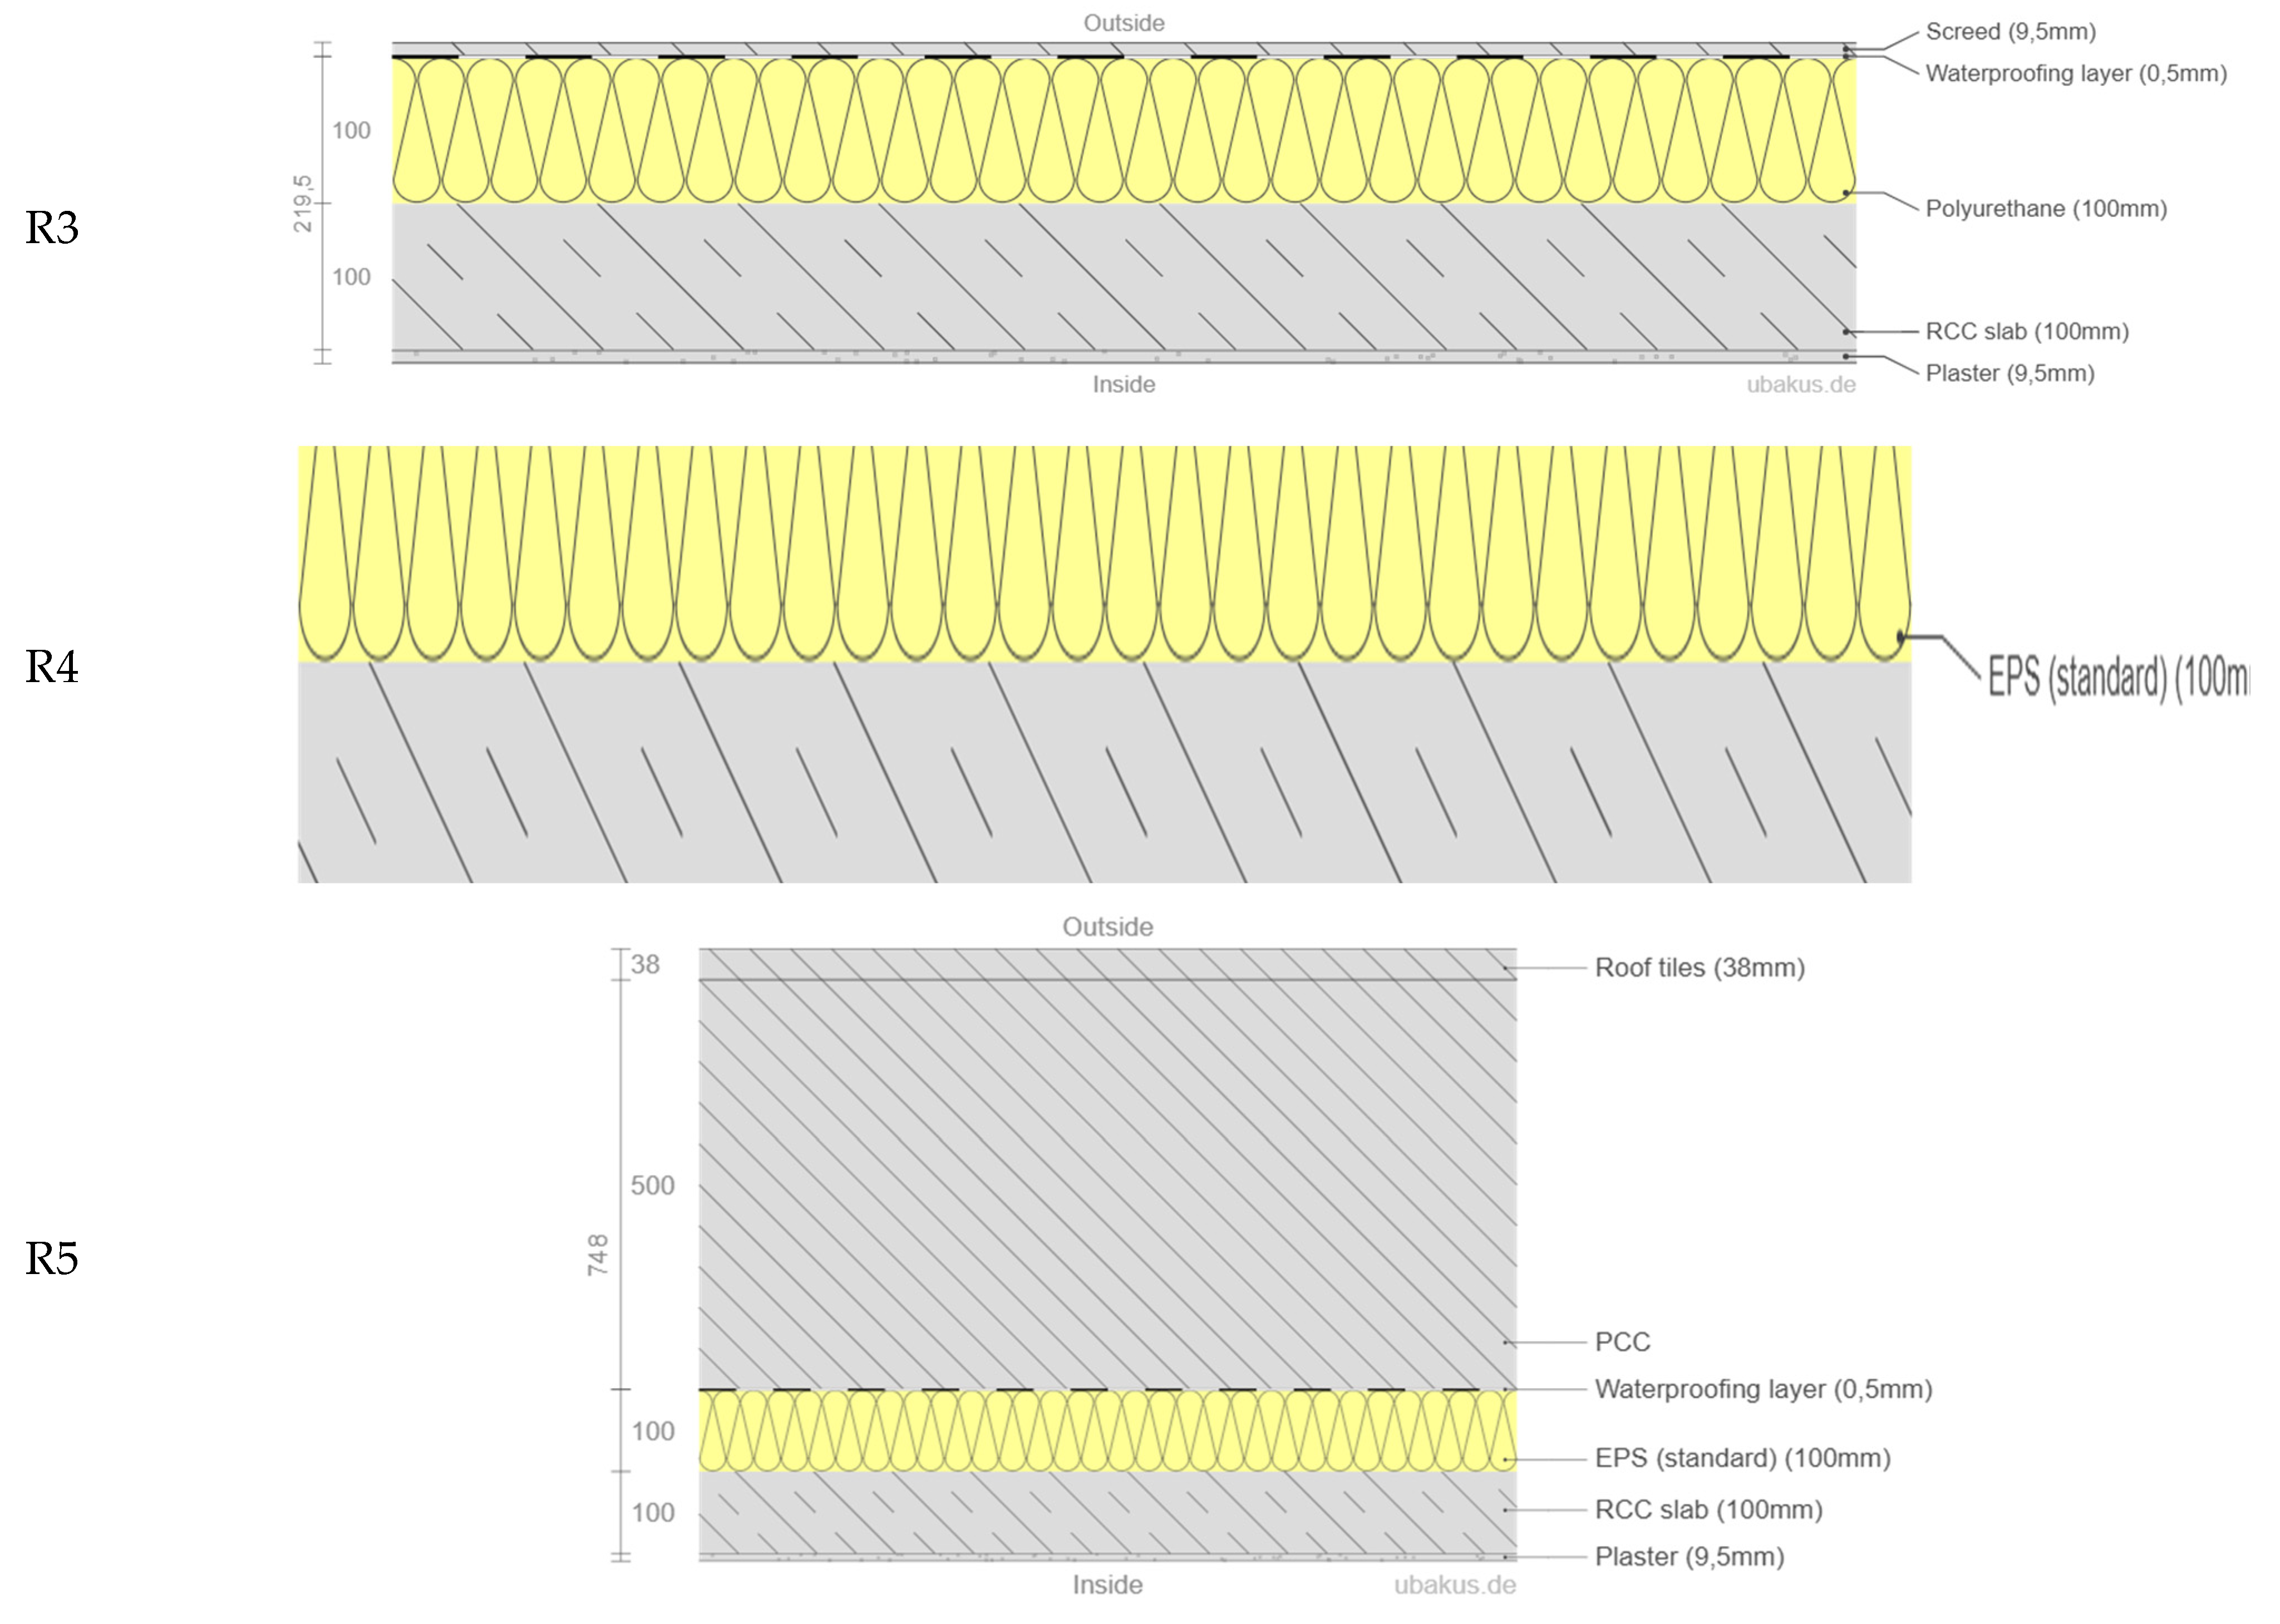
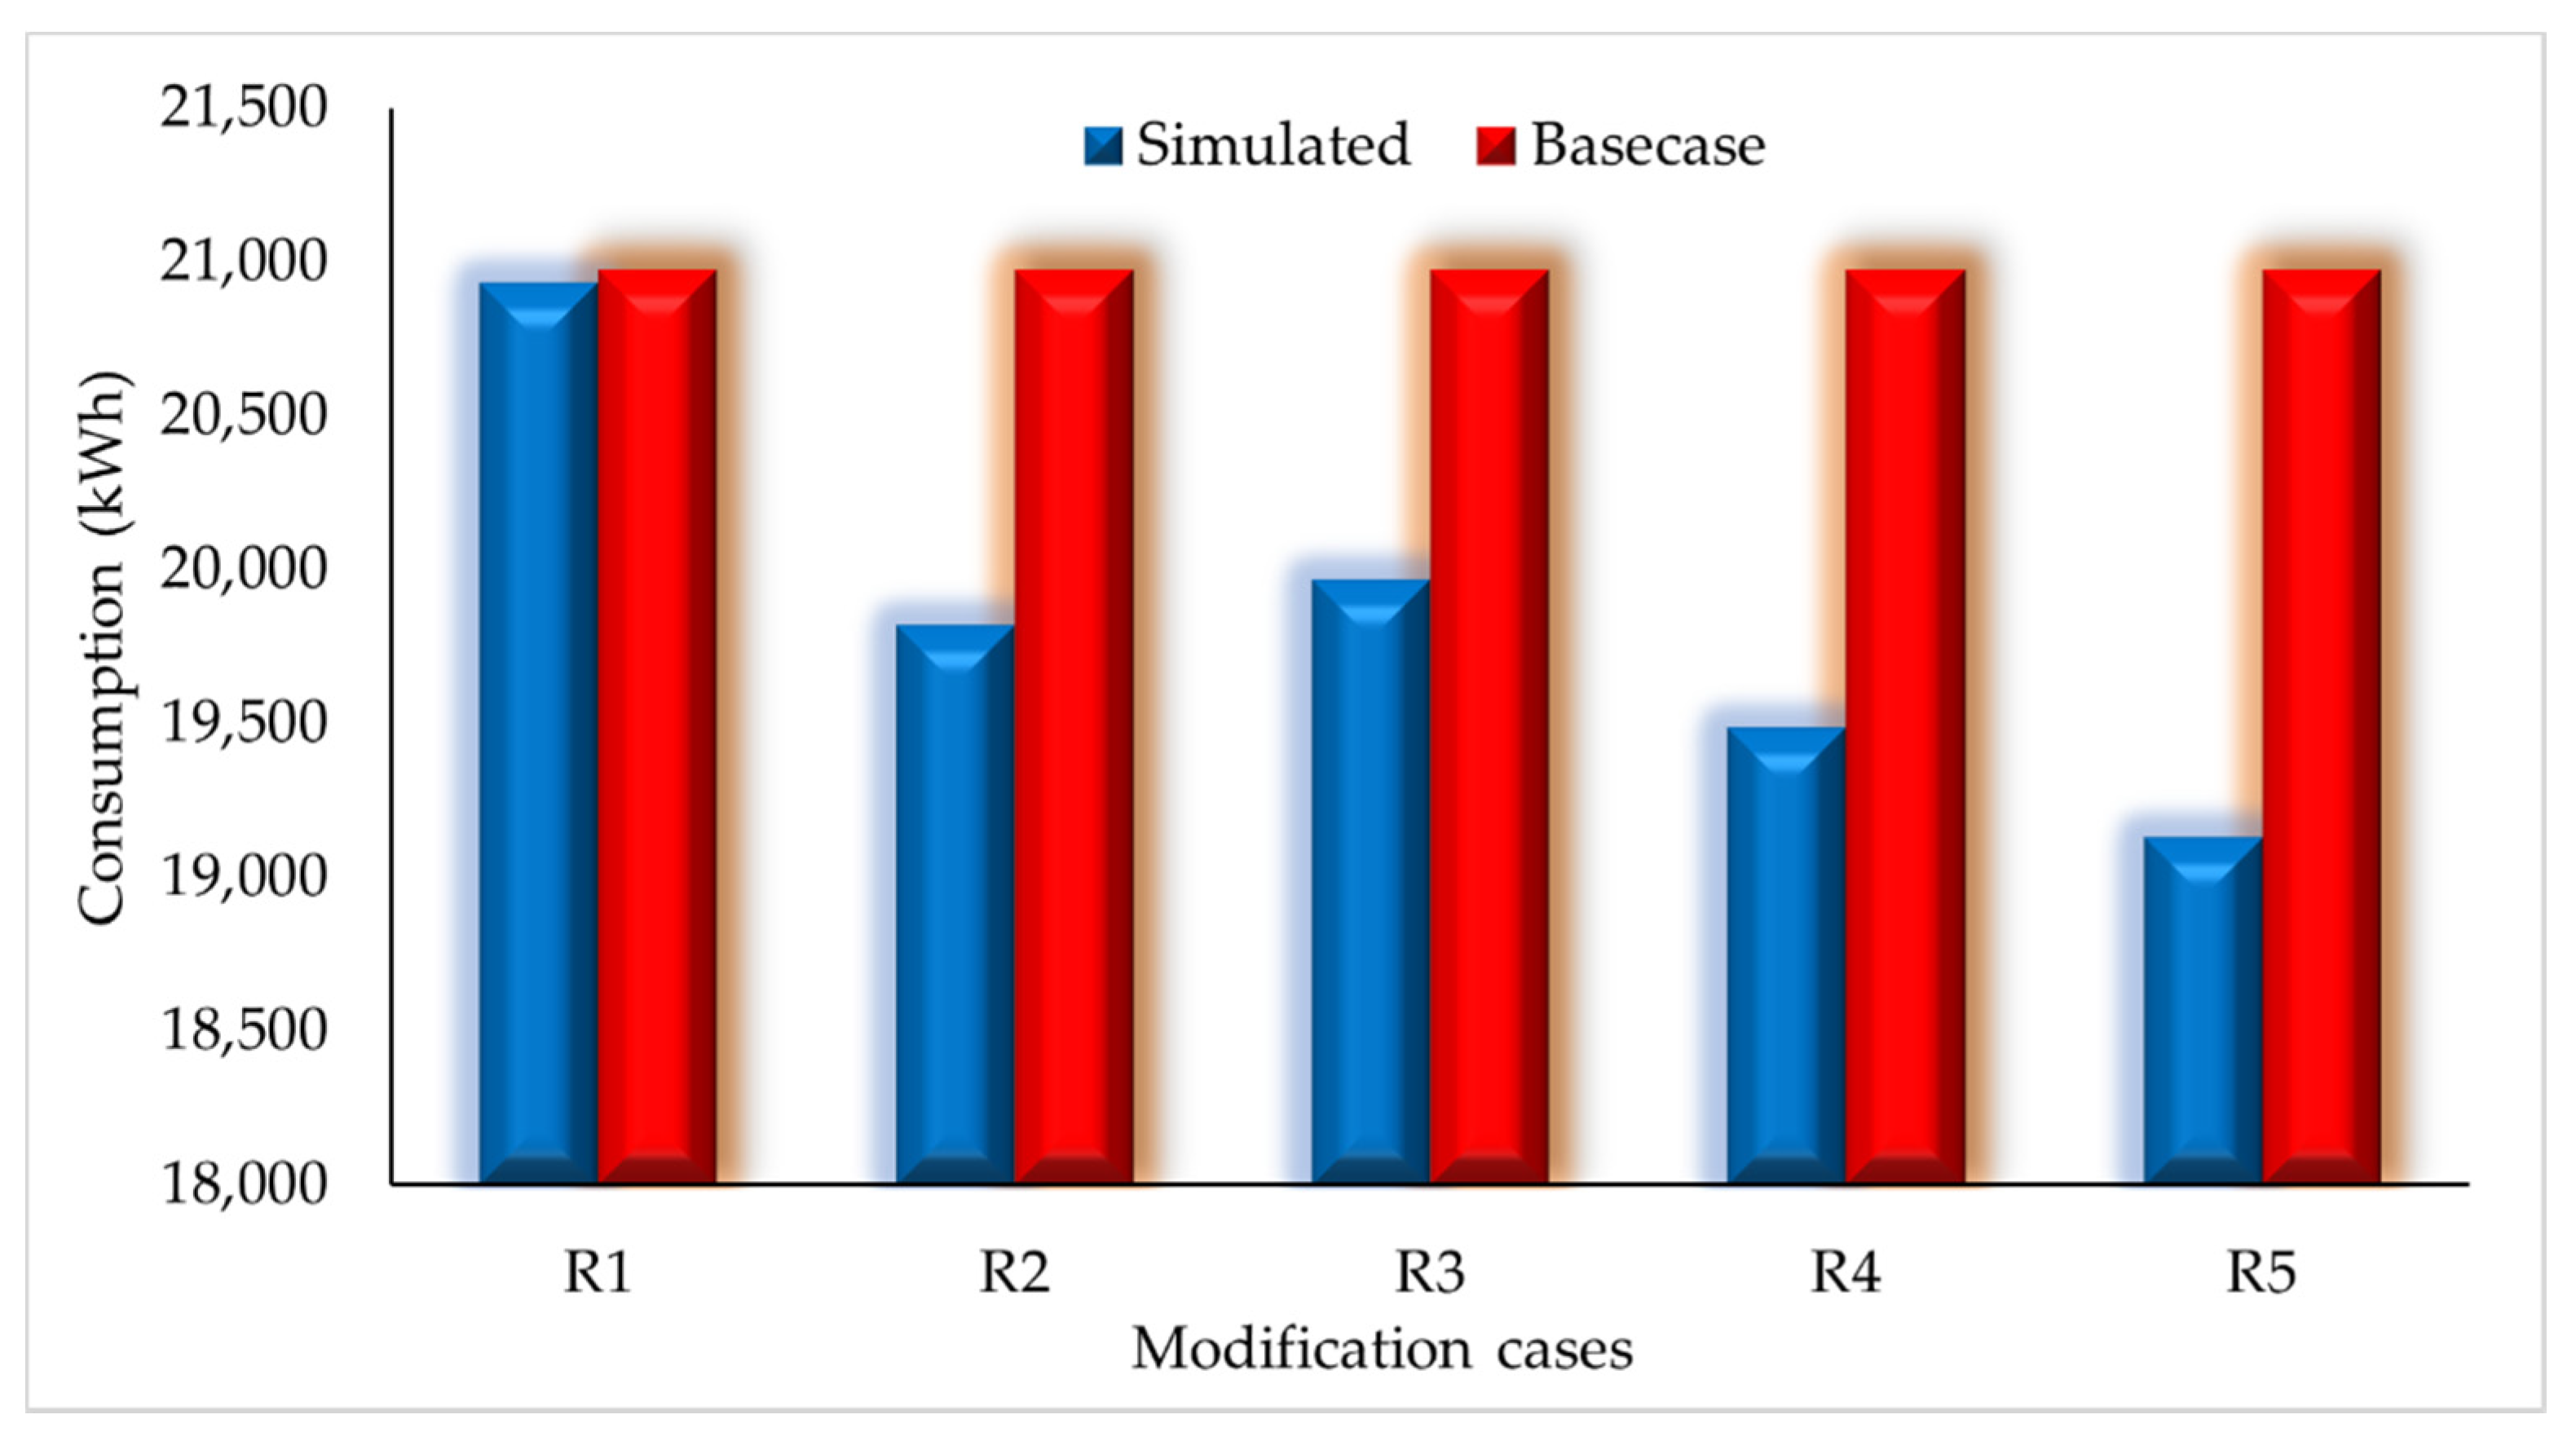
3.2.2. PEEM Alternative #2 (Roof)
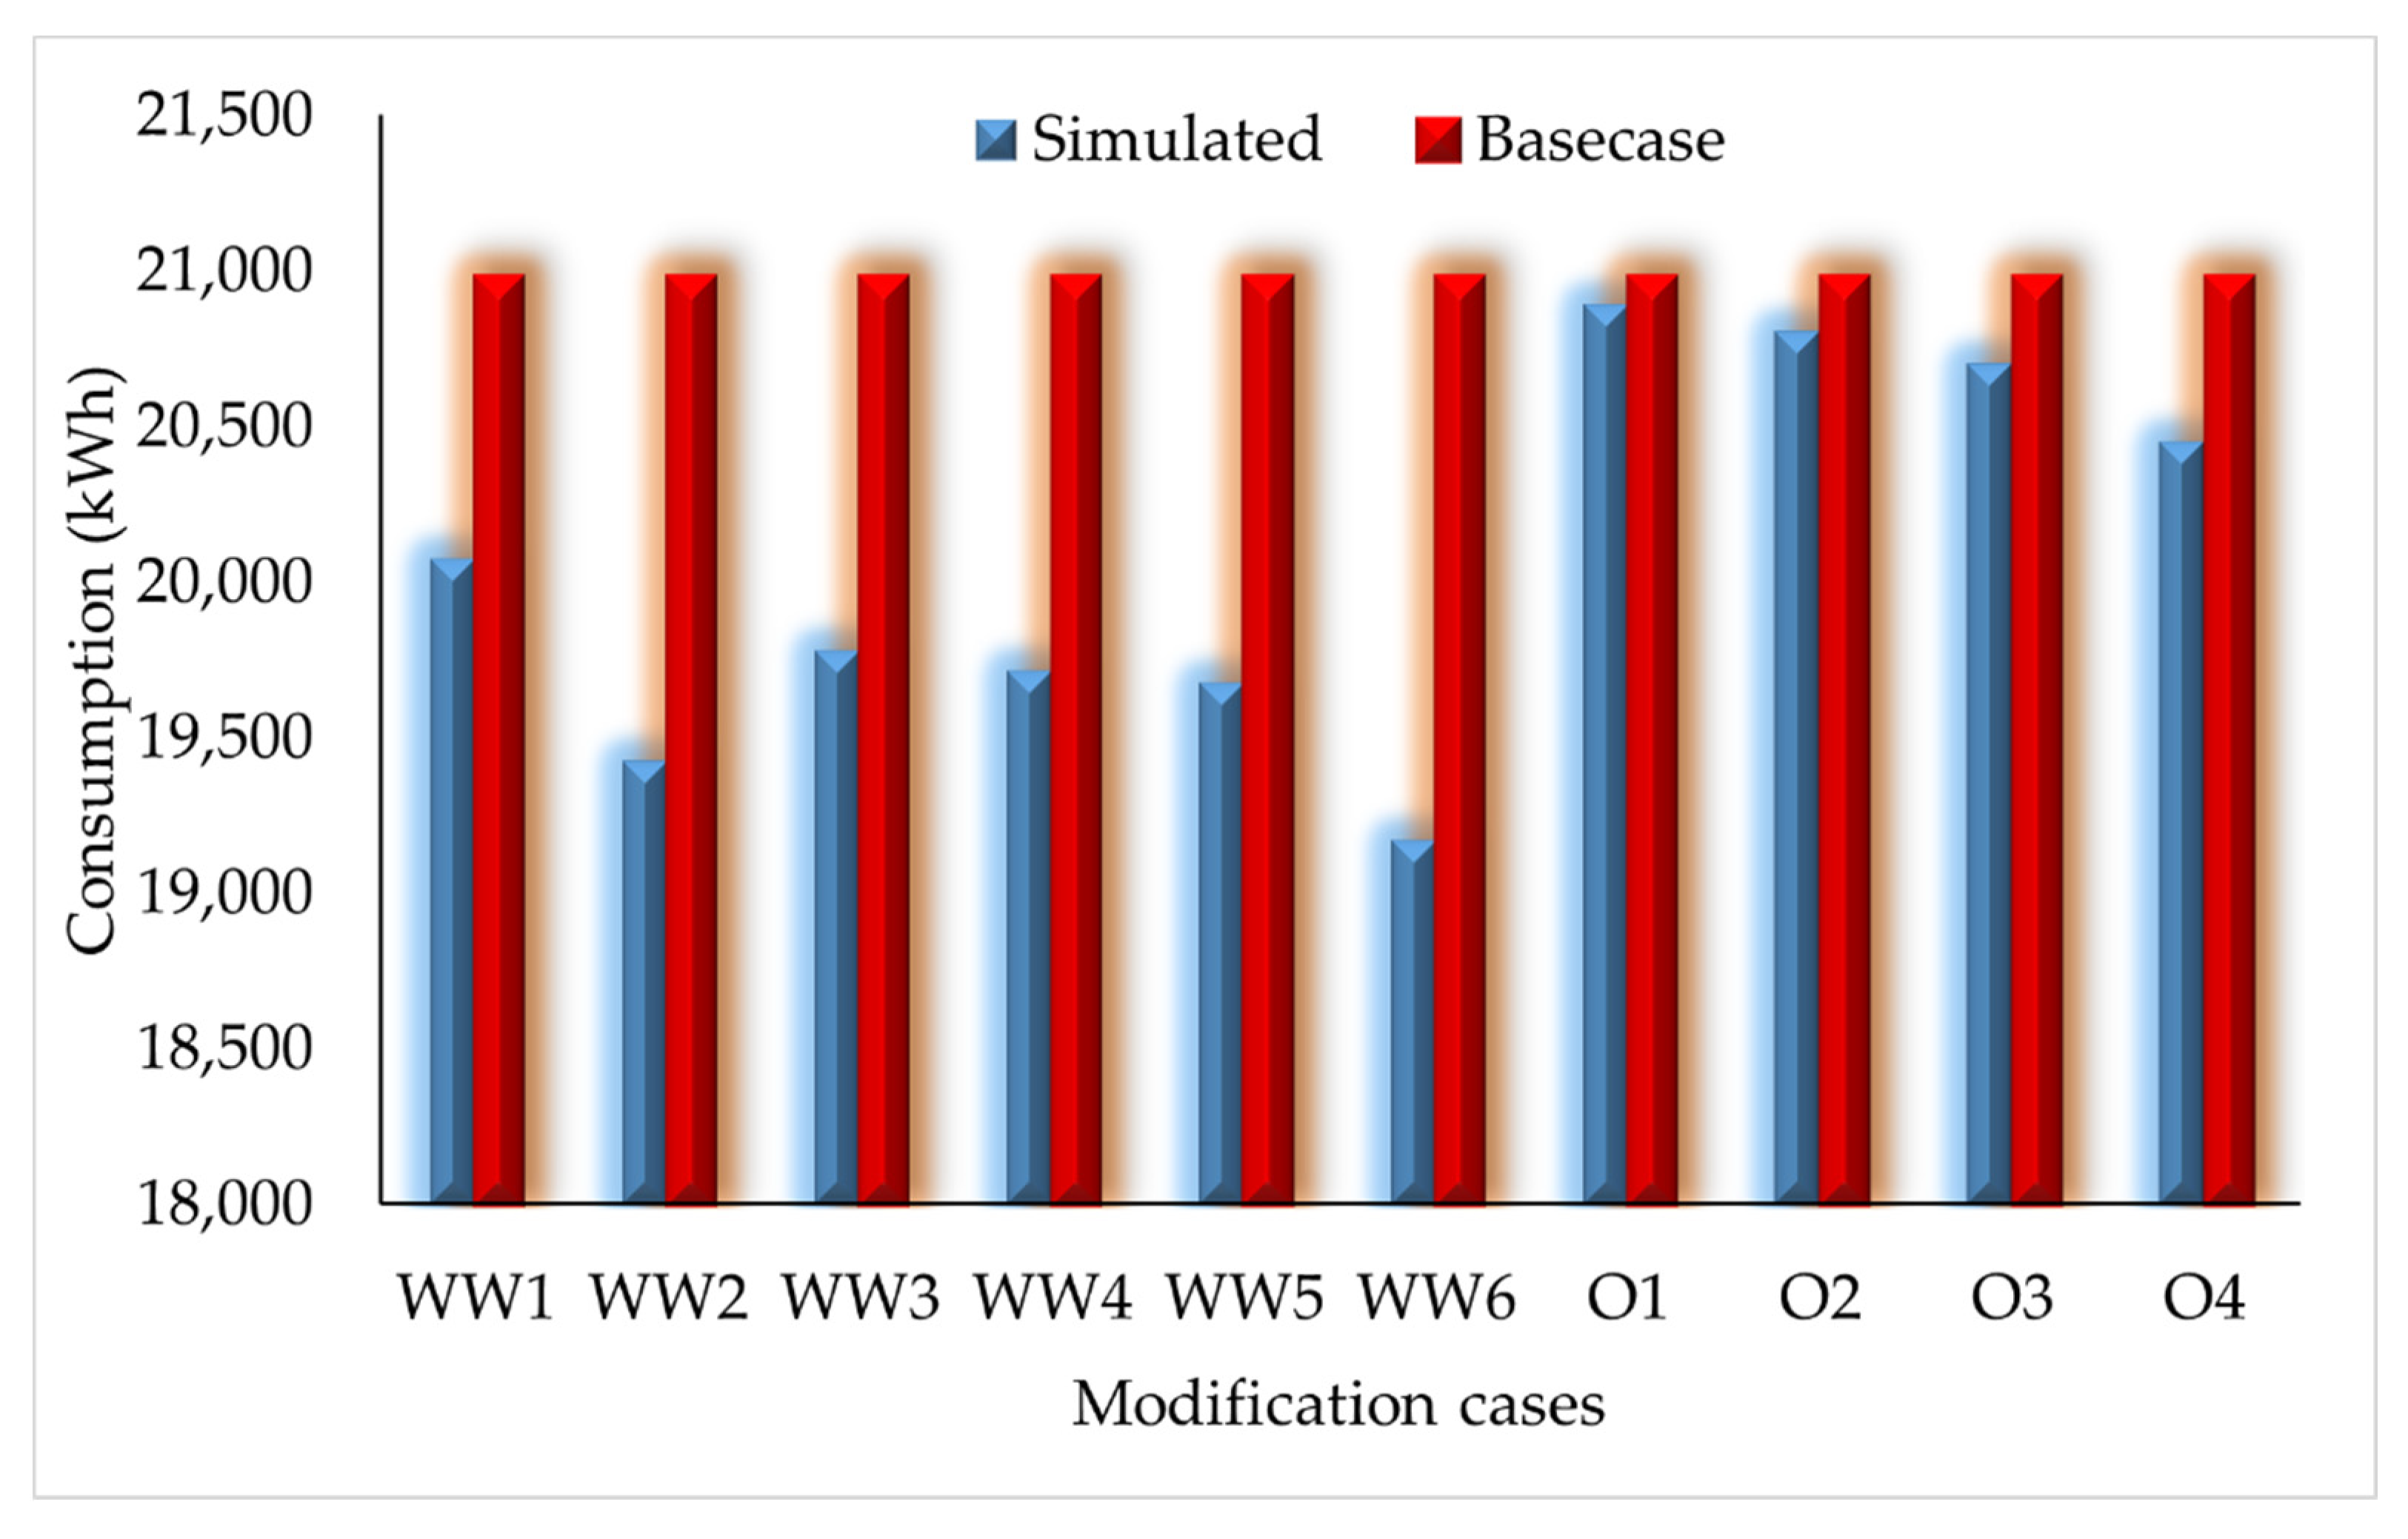
3.2.3. PEEM Alternative #3 (Windows)
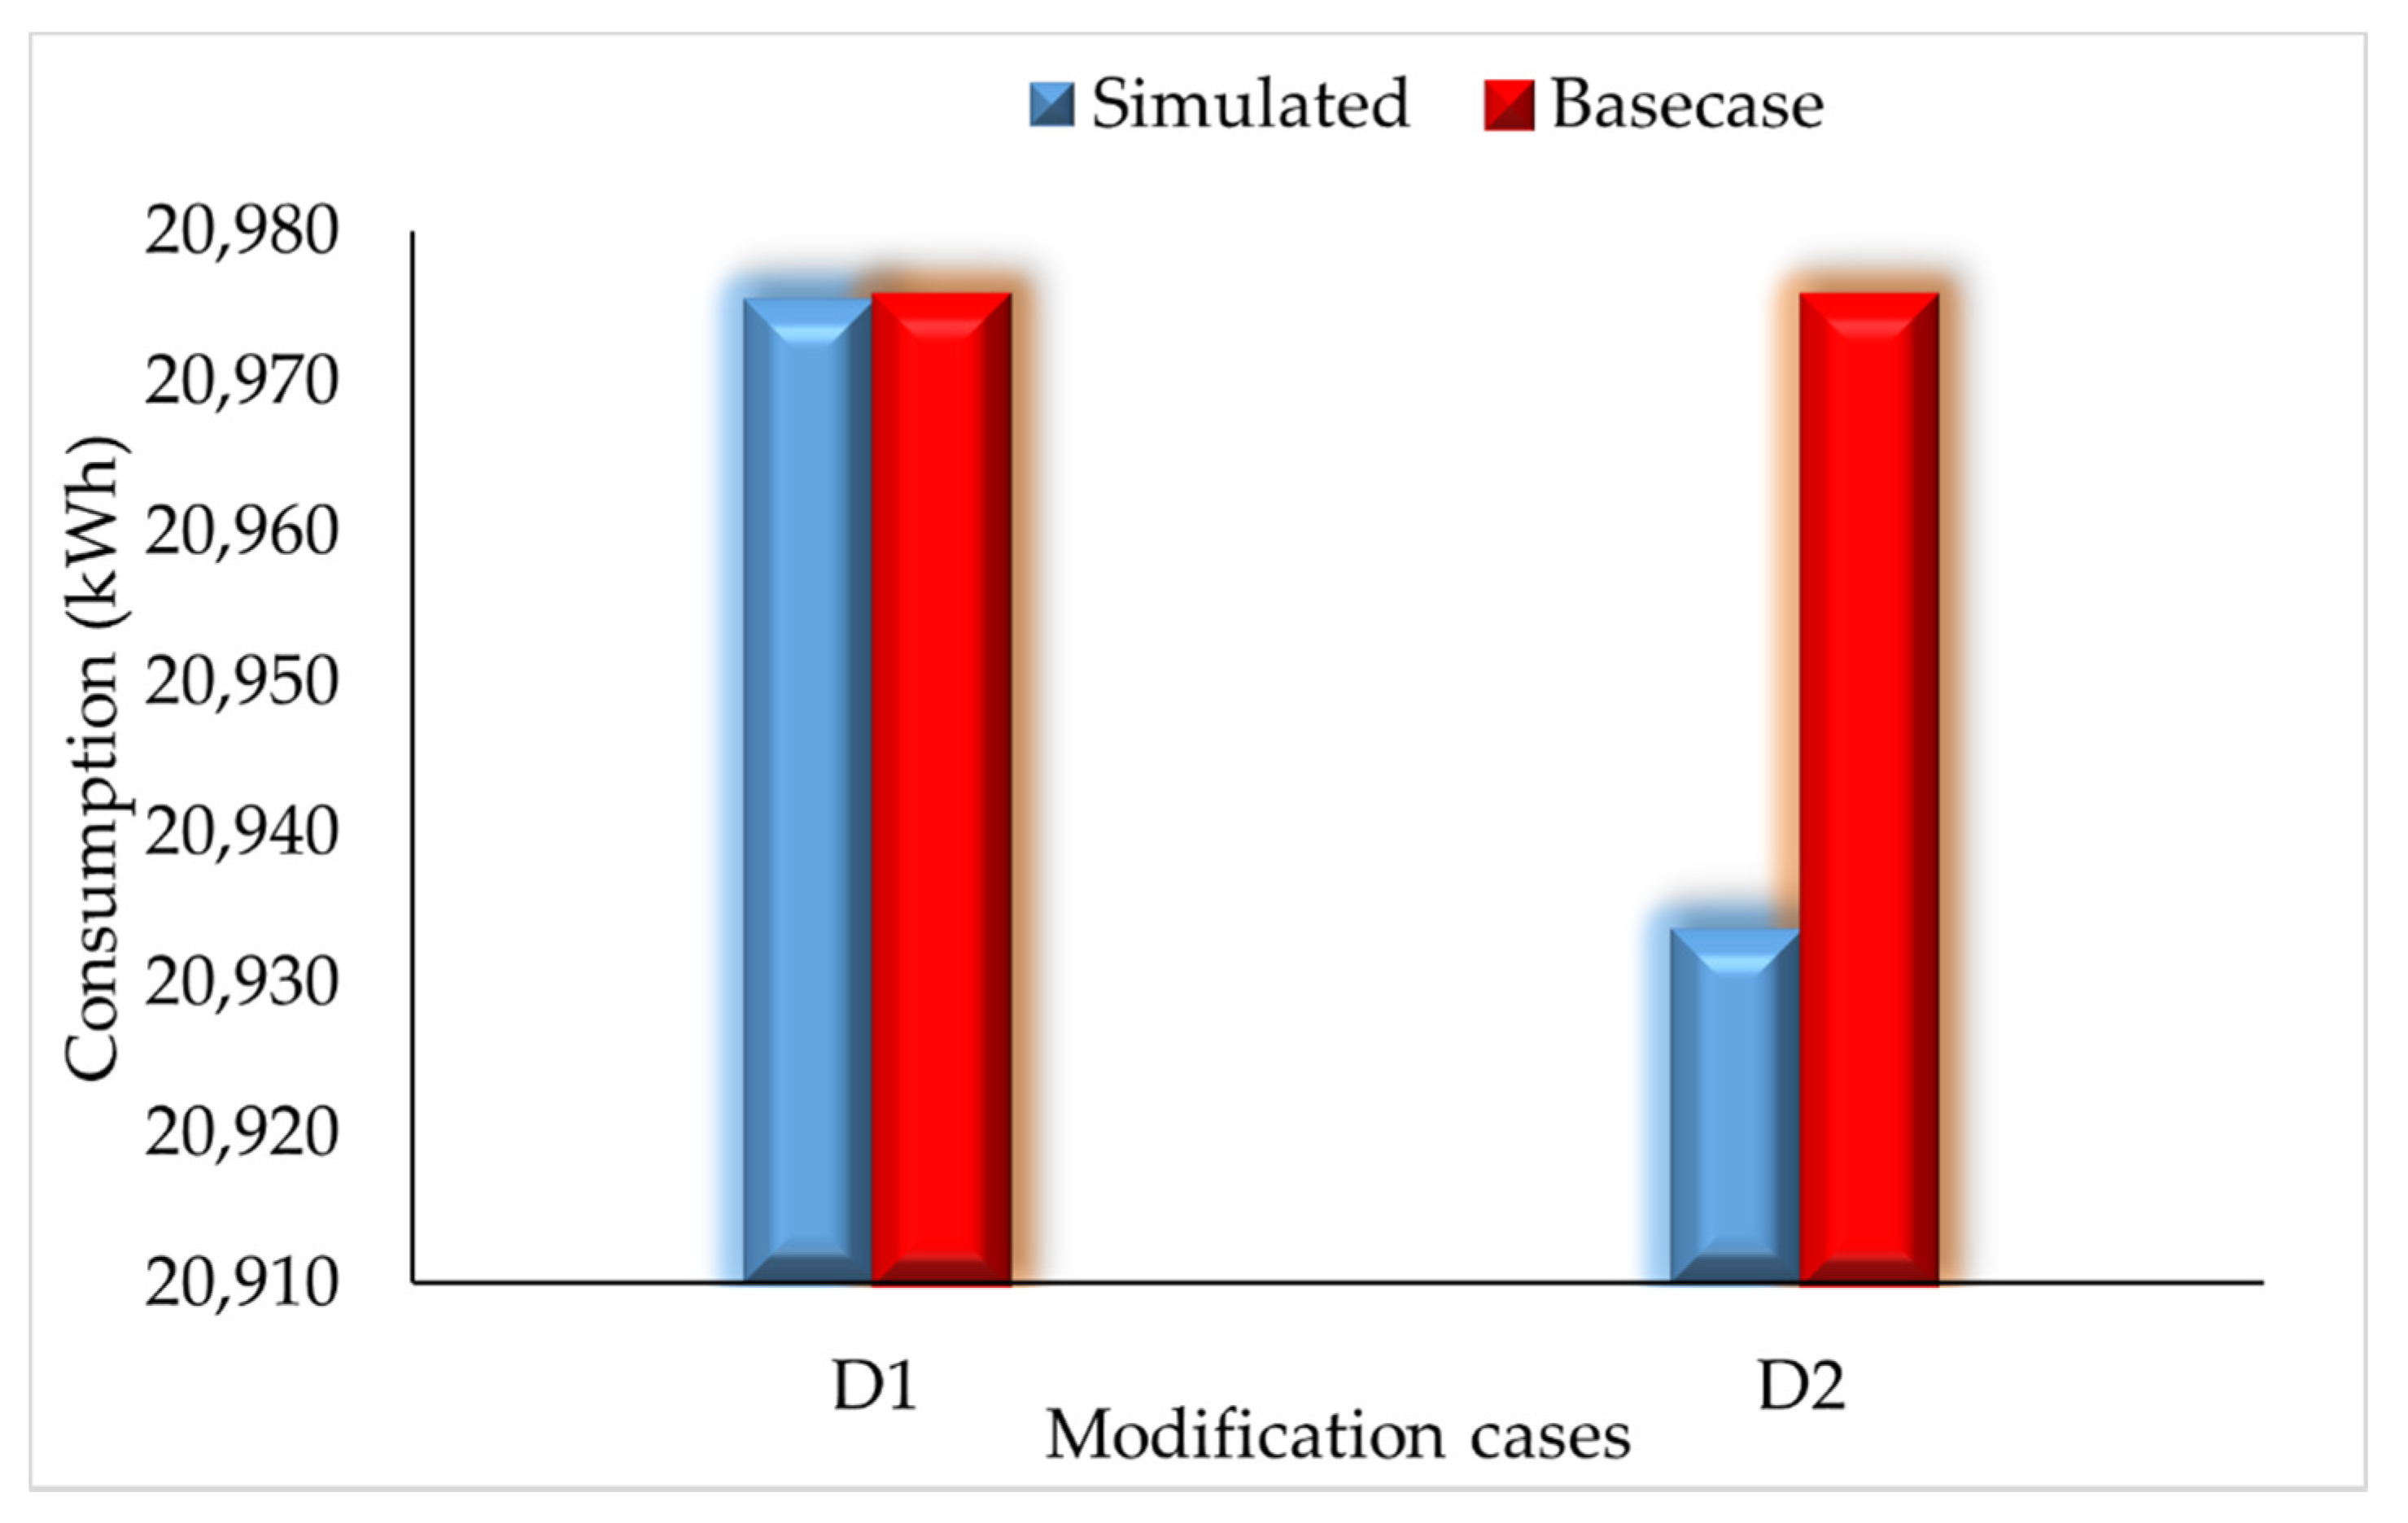
3.2.4. PEEM Alternative #4 (Door)
3.2.5. PEEM Alternative #5 (Combination of Modifications)
4. Discussion
4.1. Key Findings and Recommendations
- Building users consume a major proportion of electricity for thermal comfort, such as cooling in Karachi. This consumption can be reduced by using PEEMs. Building envelope modification is a crucial PEEM for thermal comfort and reduction in energy demand for cooling. By using PEEMs, a 31.96% reduction in energy demand for cooling can be achieved.
- Thermal insulation of 100 mm outside the thermal mass (200 mm) in the wall plays a significant role in reducing the maximum indoor temperature in hybrid buildings, and accordingly, reducing the electricity demand of a building.
- The common practice in Karachi is the use of single-glazed windows with high U-values (5.7 W/m2 K). By replacing the single-glazed windows with double-glazed low-E reflective glass windows, the cooling energy demand can be reduced by 8.6%.
- Awnings (overhangs) above the windows are provided to reduce heat gains in the building. This study showed that the longer the overhangs, the greater the reduction in energy demand for cooling. However, long fixed overhangs are not practical, because they limit the solar heat gain in winter, as well as natural light. Hence, adjustable shading devices can be useful, since adjustable shading devices allow greater flexibility to make adjustments in response to changing weather conditions.
- Pakistan’s urban population experiences 12–15 h of electricity blackout (load shedding) per day. Hence, reliance on active systems is not possible, and PEEMs are recommended. Retrofitting existing buildings to improve building energy efficiency is a better solution to such problems, since the existing buildings in Pakistan are energy inefficient.
4.2. Strengths and Limitations
4.3. Study Implications and Future Research
5. Conclusions
- Thermal insulation of walls is found to be the best modification measure to reduce cooling energy demand.
- Replacing single-glazed windows with double low-E electro reflective glass gave 8.6% reduction in cooling energy demand.
- Thermal insulation with the lowest thermal conductivity and the highest specific heat capacity with similar thickness among the investigated insulation materials is the most effective insulating material for lowering the cooling energy demand.
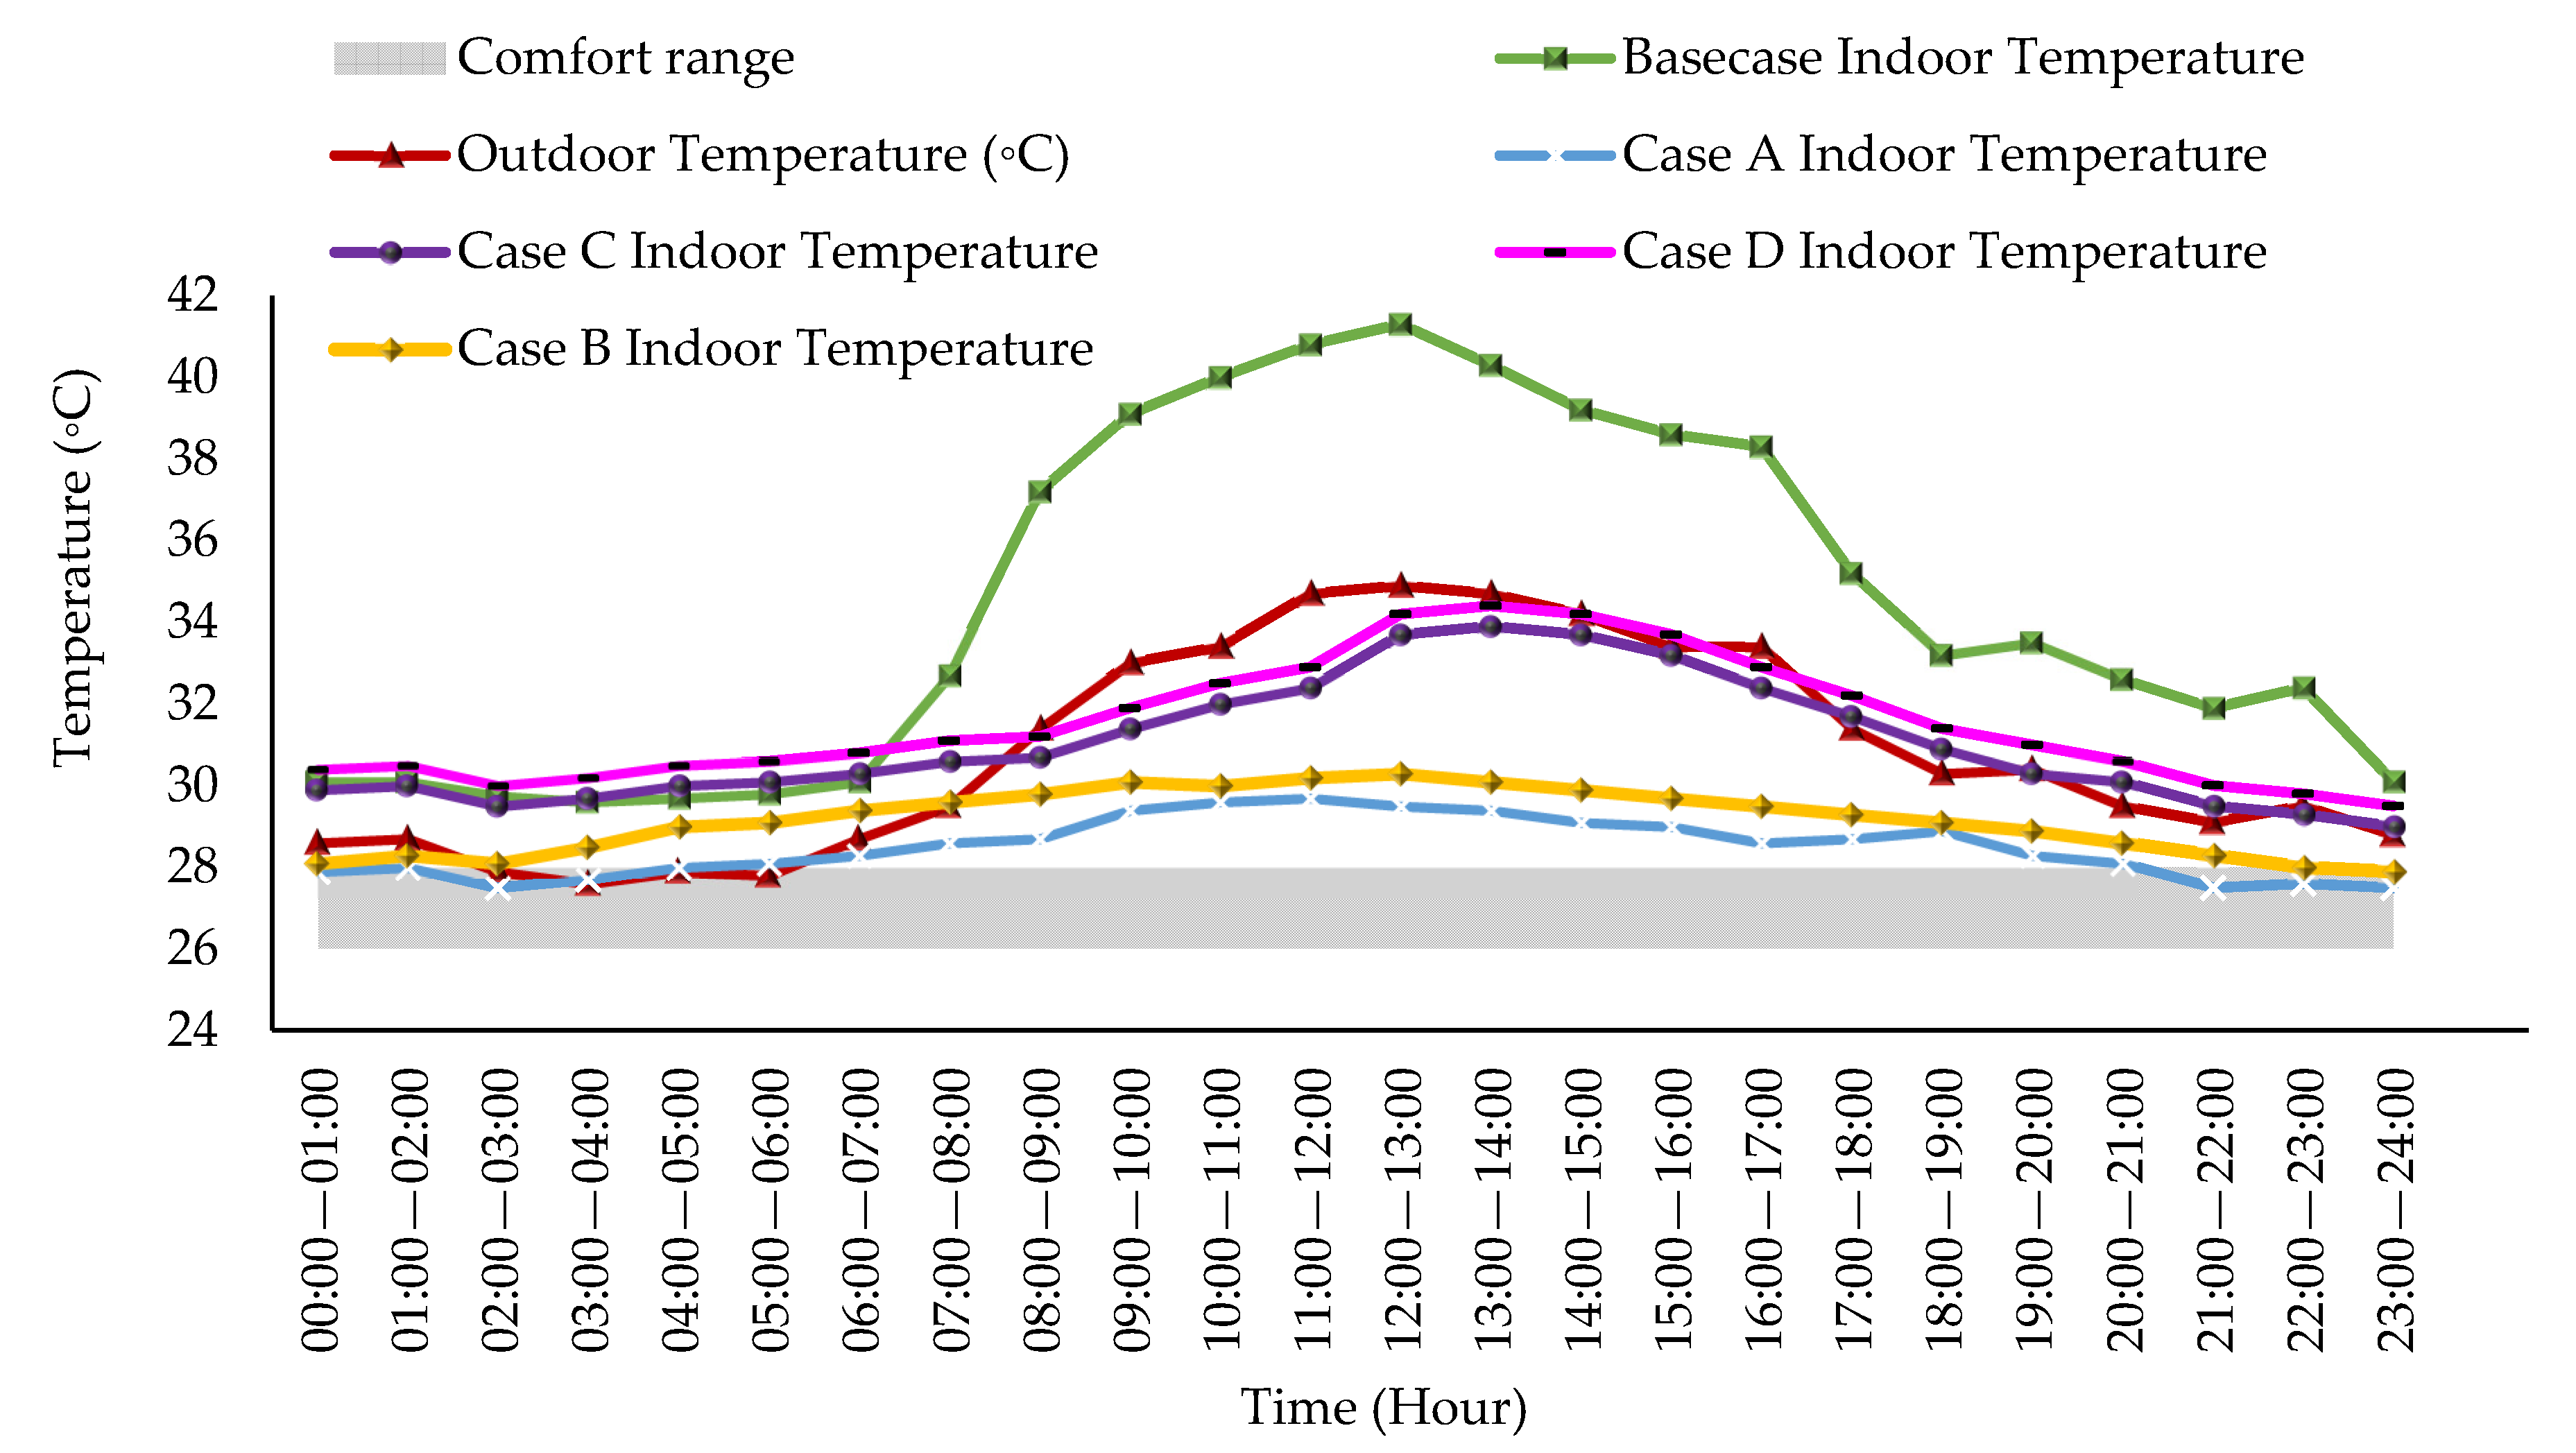
- The indoor temperature of the base case ACB was 34.3 °C. The modification strategies applied in case A reduced the indoor temperature to 29.4 °C. Case B, case C, and case D reduced the indoor temperature to 29.5, 31, and 31.5 °C, respectively.
- An architect and designer can use building thermal modeling to design an energy-efficient building by analyzing the effectiveness of various construction and material alternatives. Hence, it is recommended to use BIM and building performance simulation to investigate energy-efficient measures.
- In Pakistan, building owners lack the knowledge, interest, expertise, and awareness in the retrofitting of buildings for energy efficiency. Therefore, the government should provide incentives to facilitate the retrofitting of buildings to achieve energy efficiency.
Author Contributions
Funding
Institutional Review Board Statement
Informed Consent Statement
Data Availability Statement
Acknowledgments
Conflicts of Interest
Nomenclature
| ACB | architectural campus building |
| AM | analytical model |
| ASHRAE | American Society of Heating, Refrigeration, and Air-Conditioning Engineers |
| BIM | building information modeling |
| BPS | building performance simulation |
| CV(RMSE) | coefficient of variation of root square mean error |
| D | door |
| DB | DesignBuilder |
| EPS | expanded polystyrene |
| gbXML | Green Building Extensible Markup Language |
| HVAC | heating, ventilation, and air-conditioning |
| LT | light transmission |
| NMBE | normalized mean bias error |
| O | overhang |
| PCC | plain cement concrete |
| PEC | Pakistan Engineering Council |
| PEEMs | passive energy efficiency measures |
| PGBC | Pakistan Green Building Council |
| R | roof |
| RCC | reinforced cement concrete |
| SHGC | solar heat gain coefficient |
| W | wall |
| WW | window |
| WWR | window-to-wall ratio |
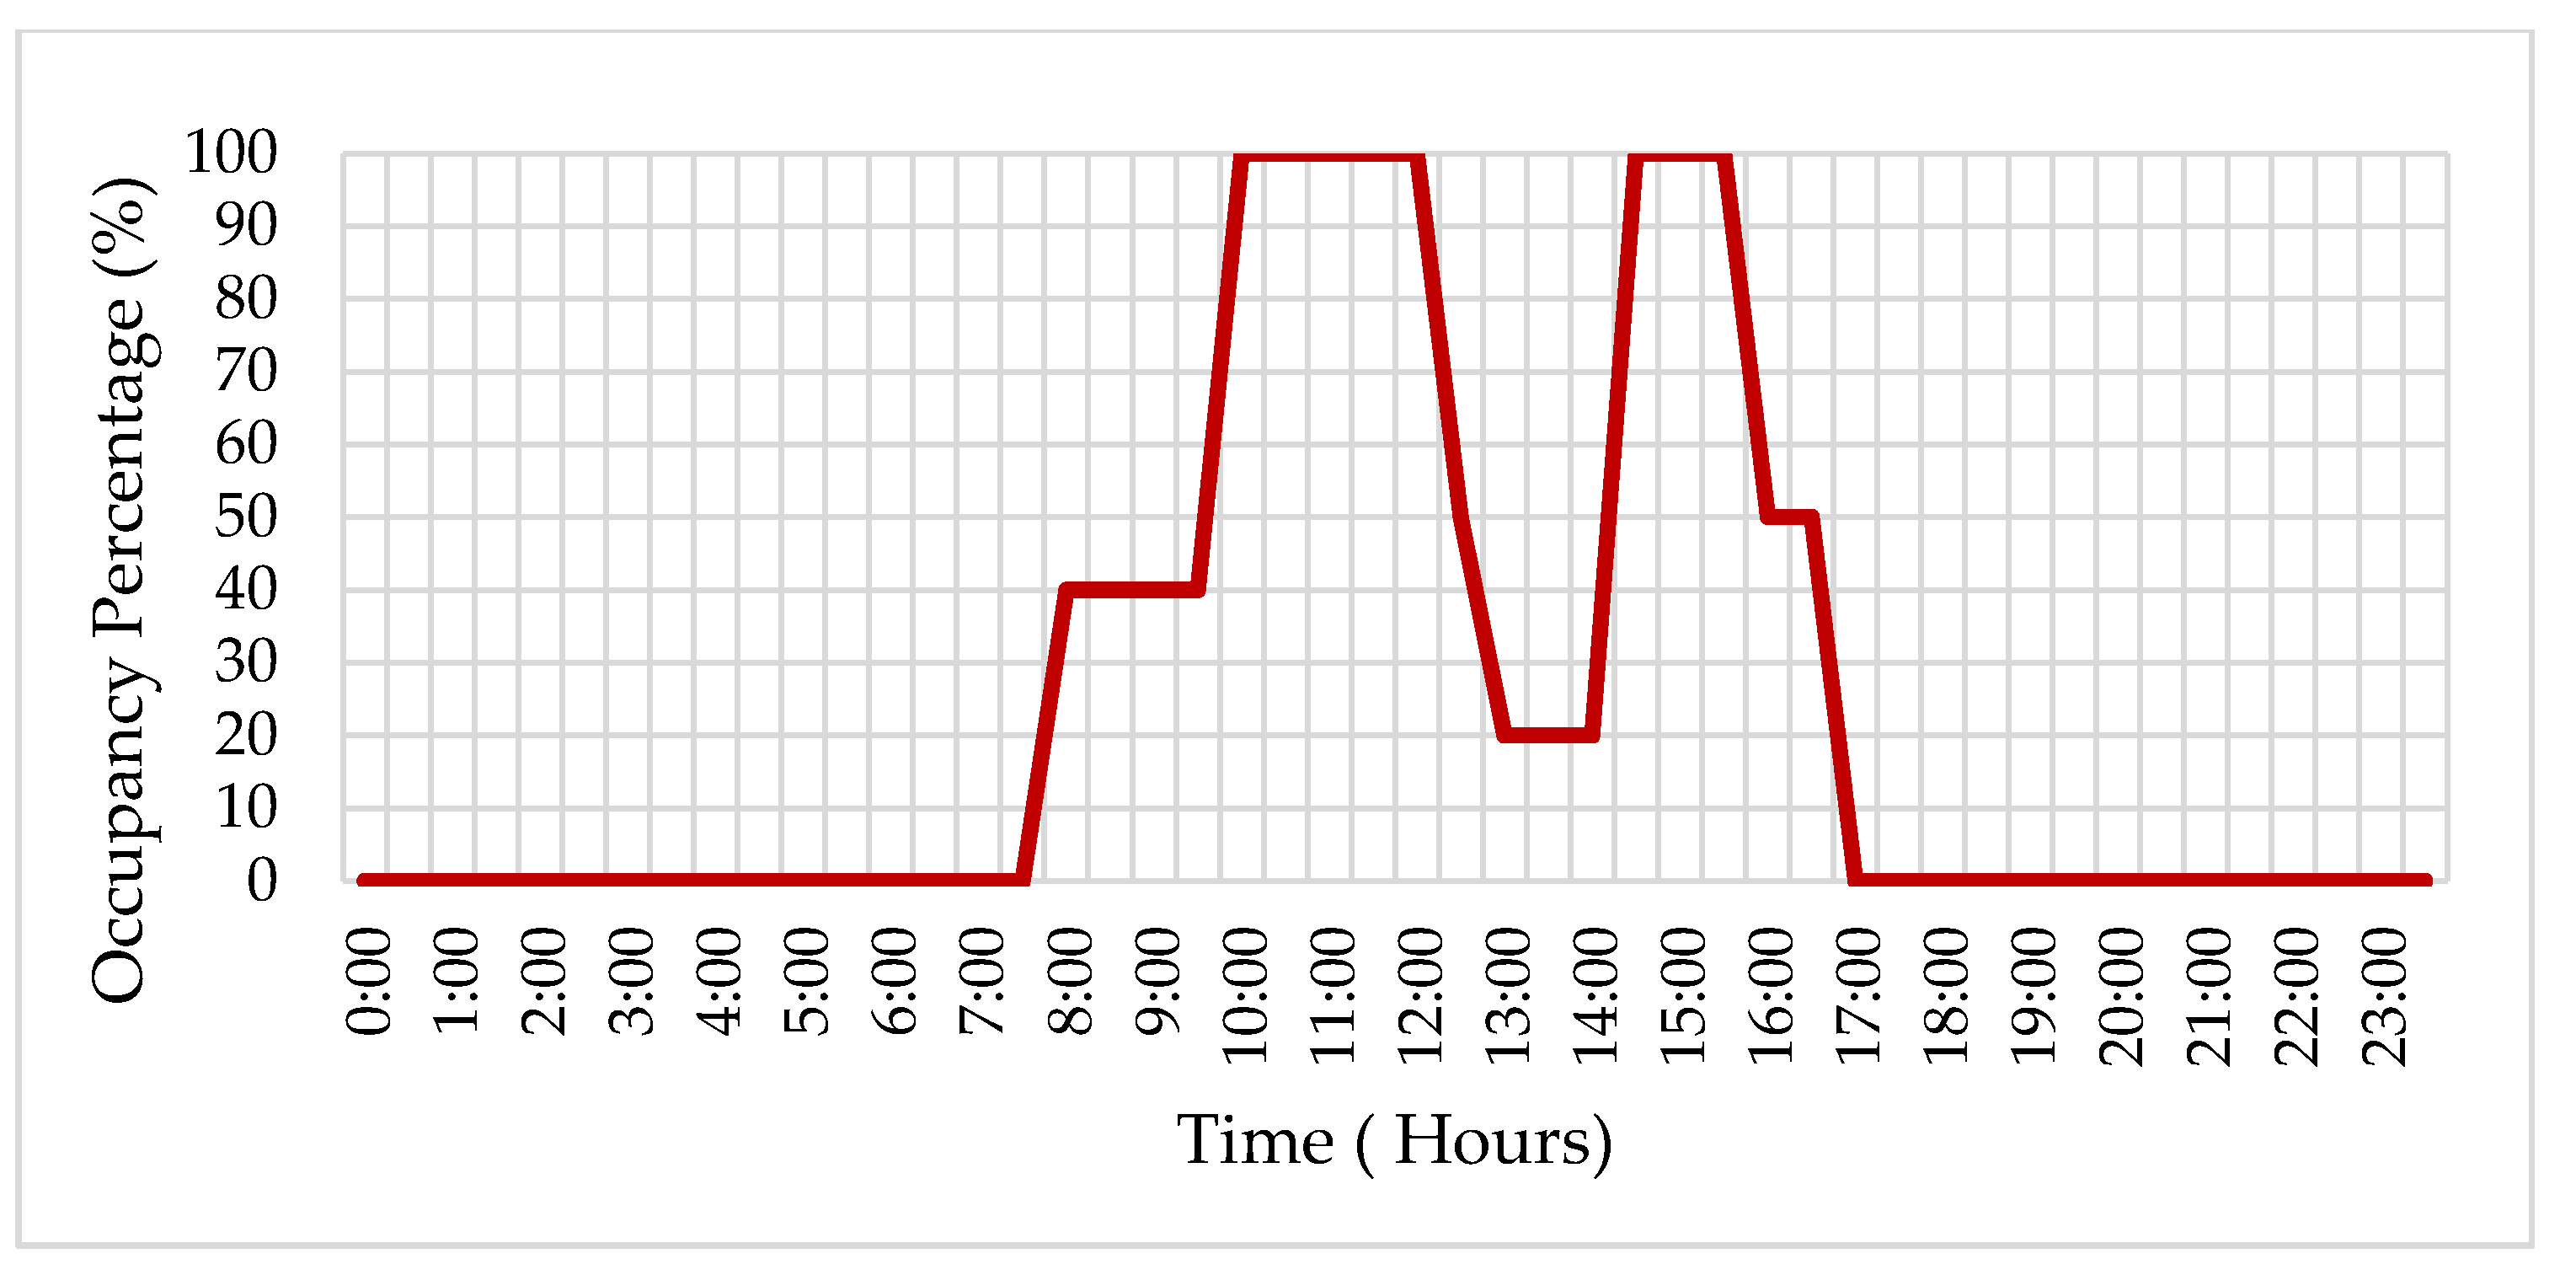
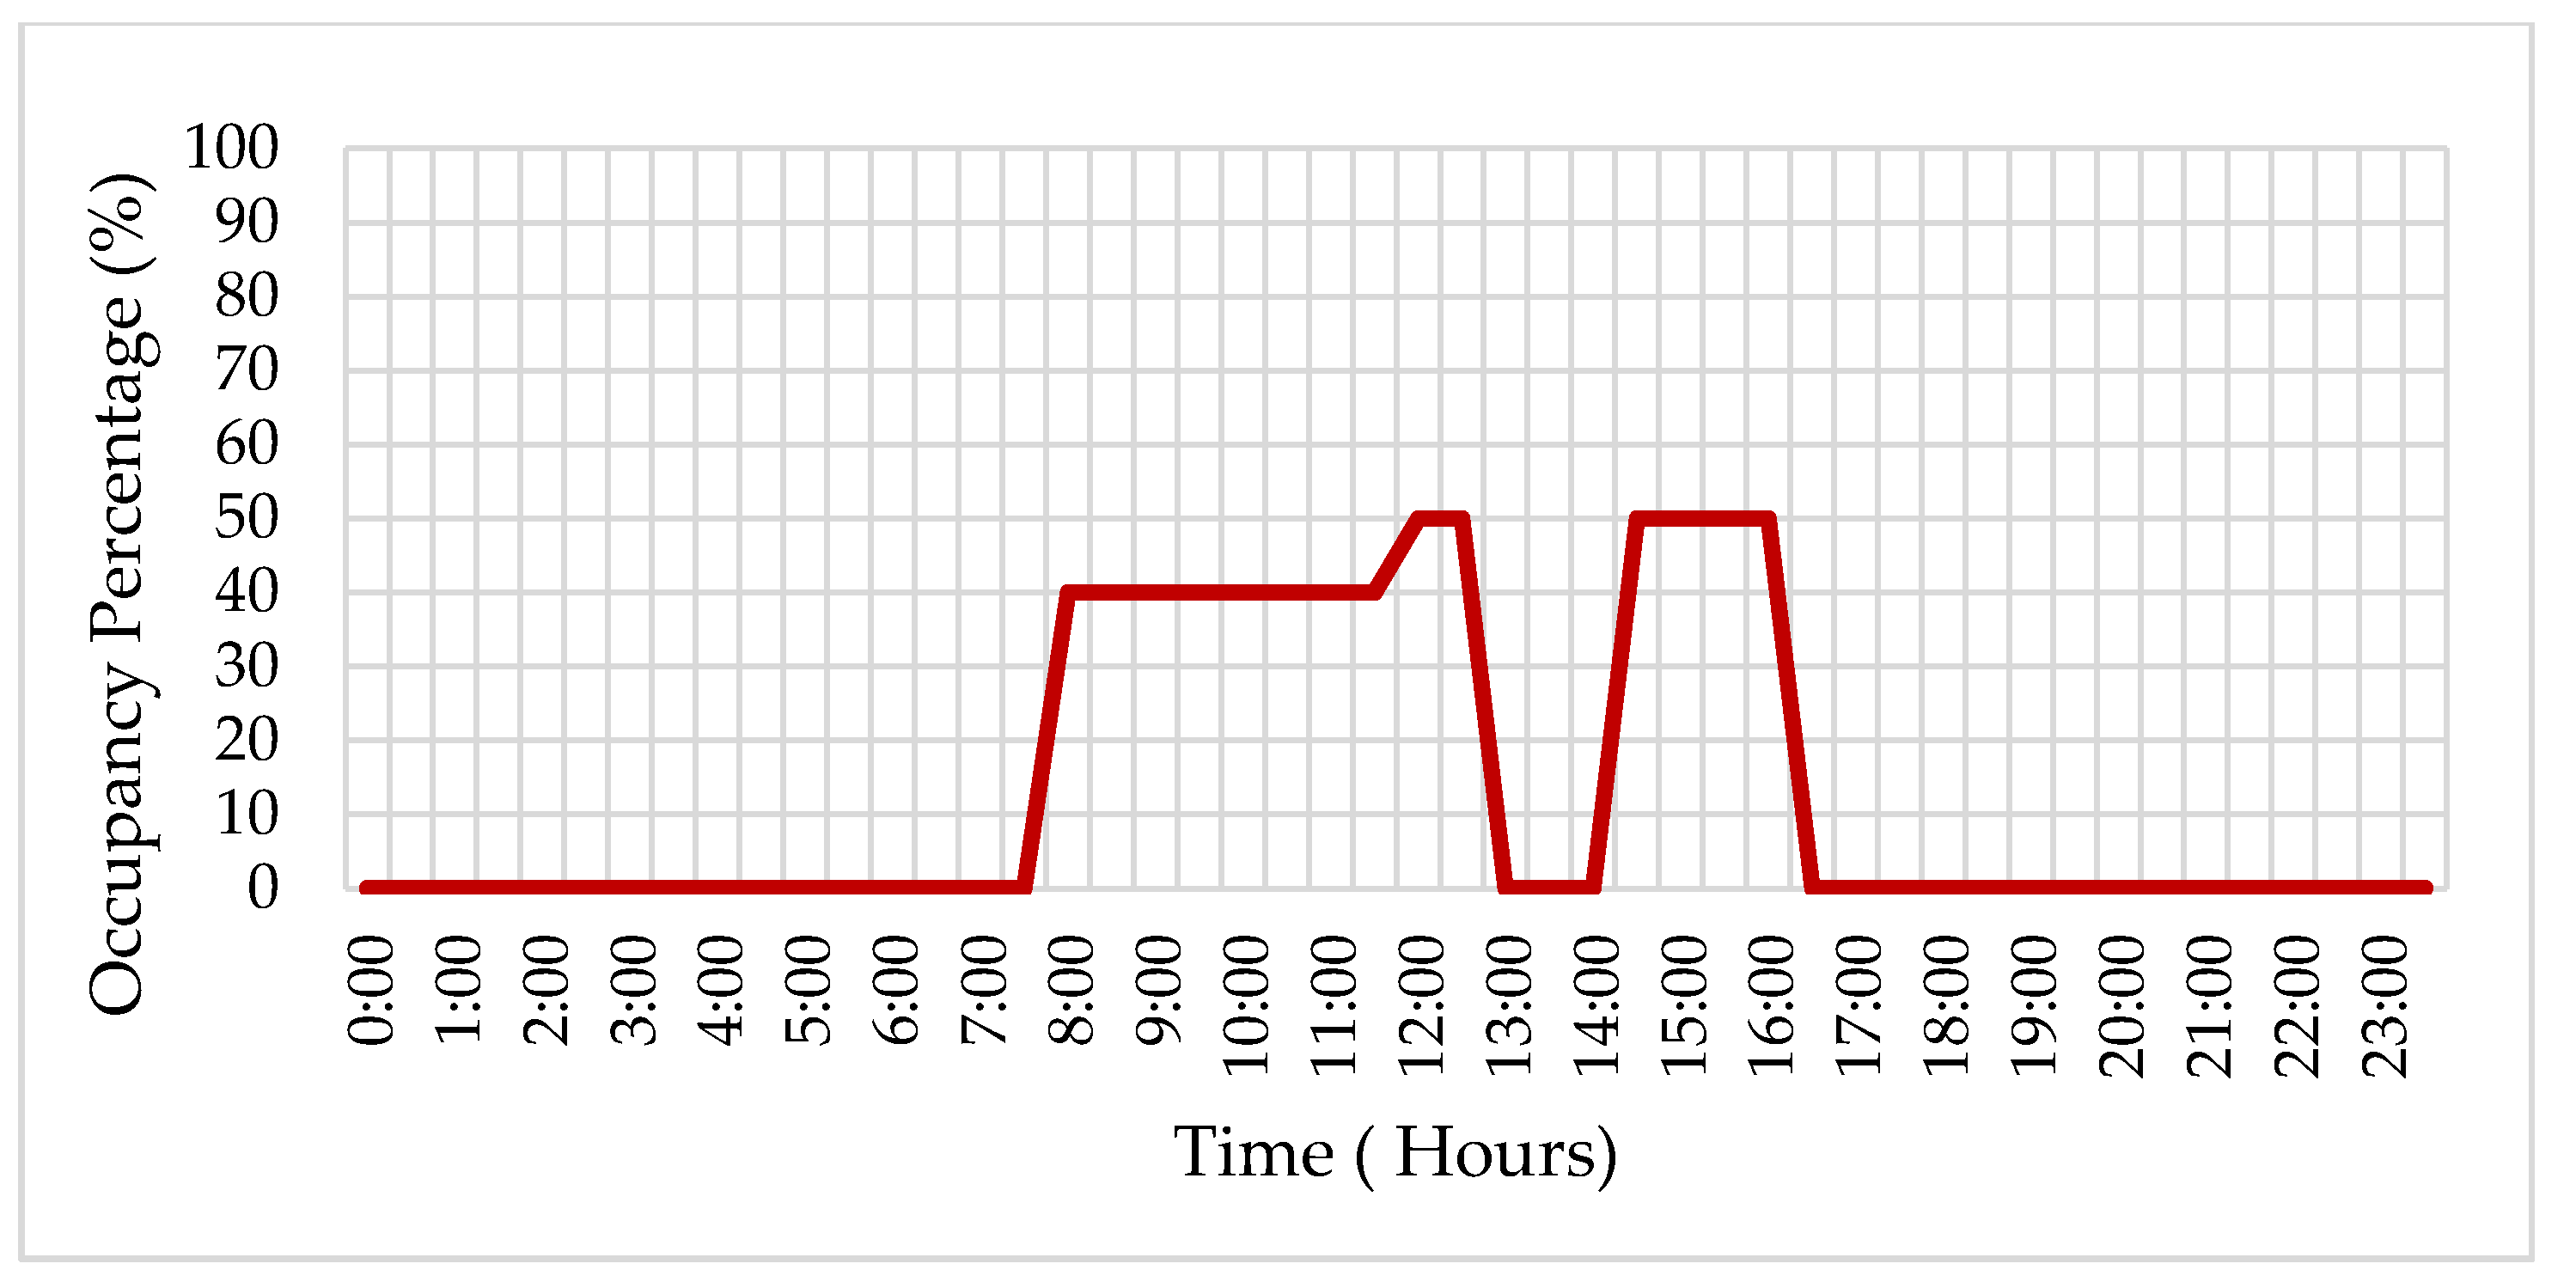
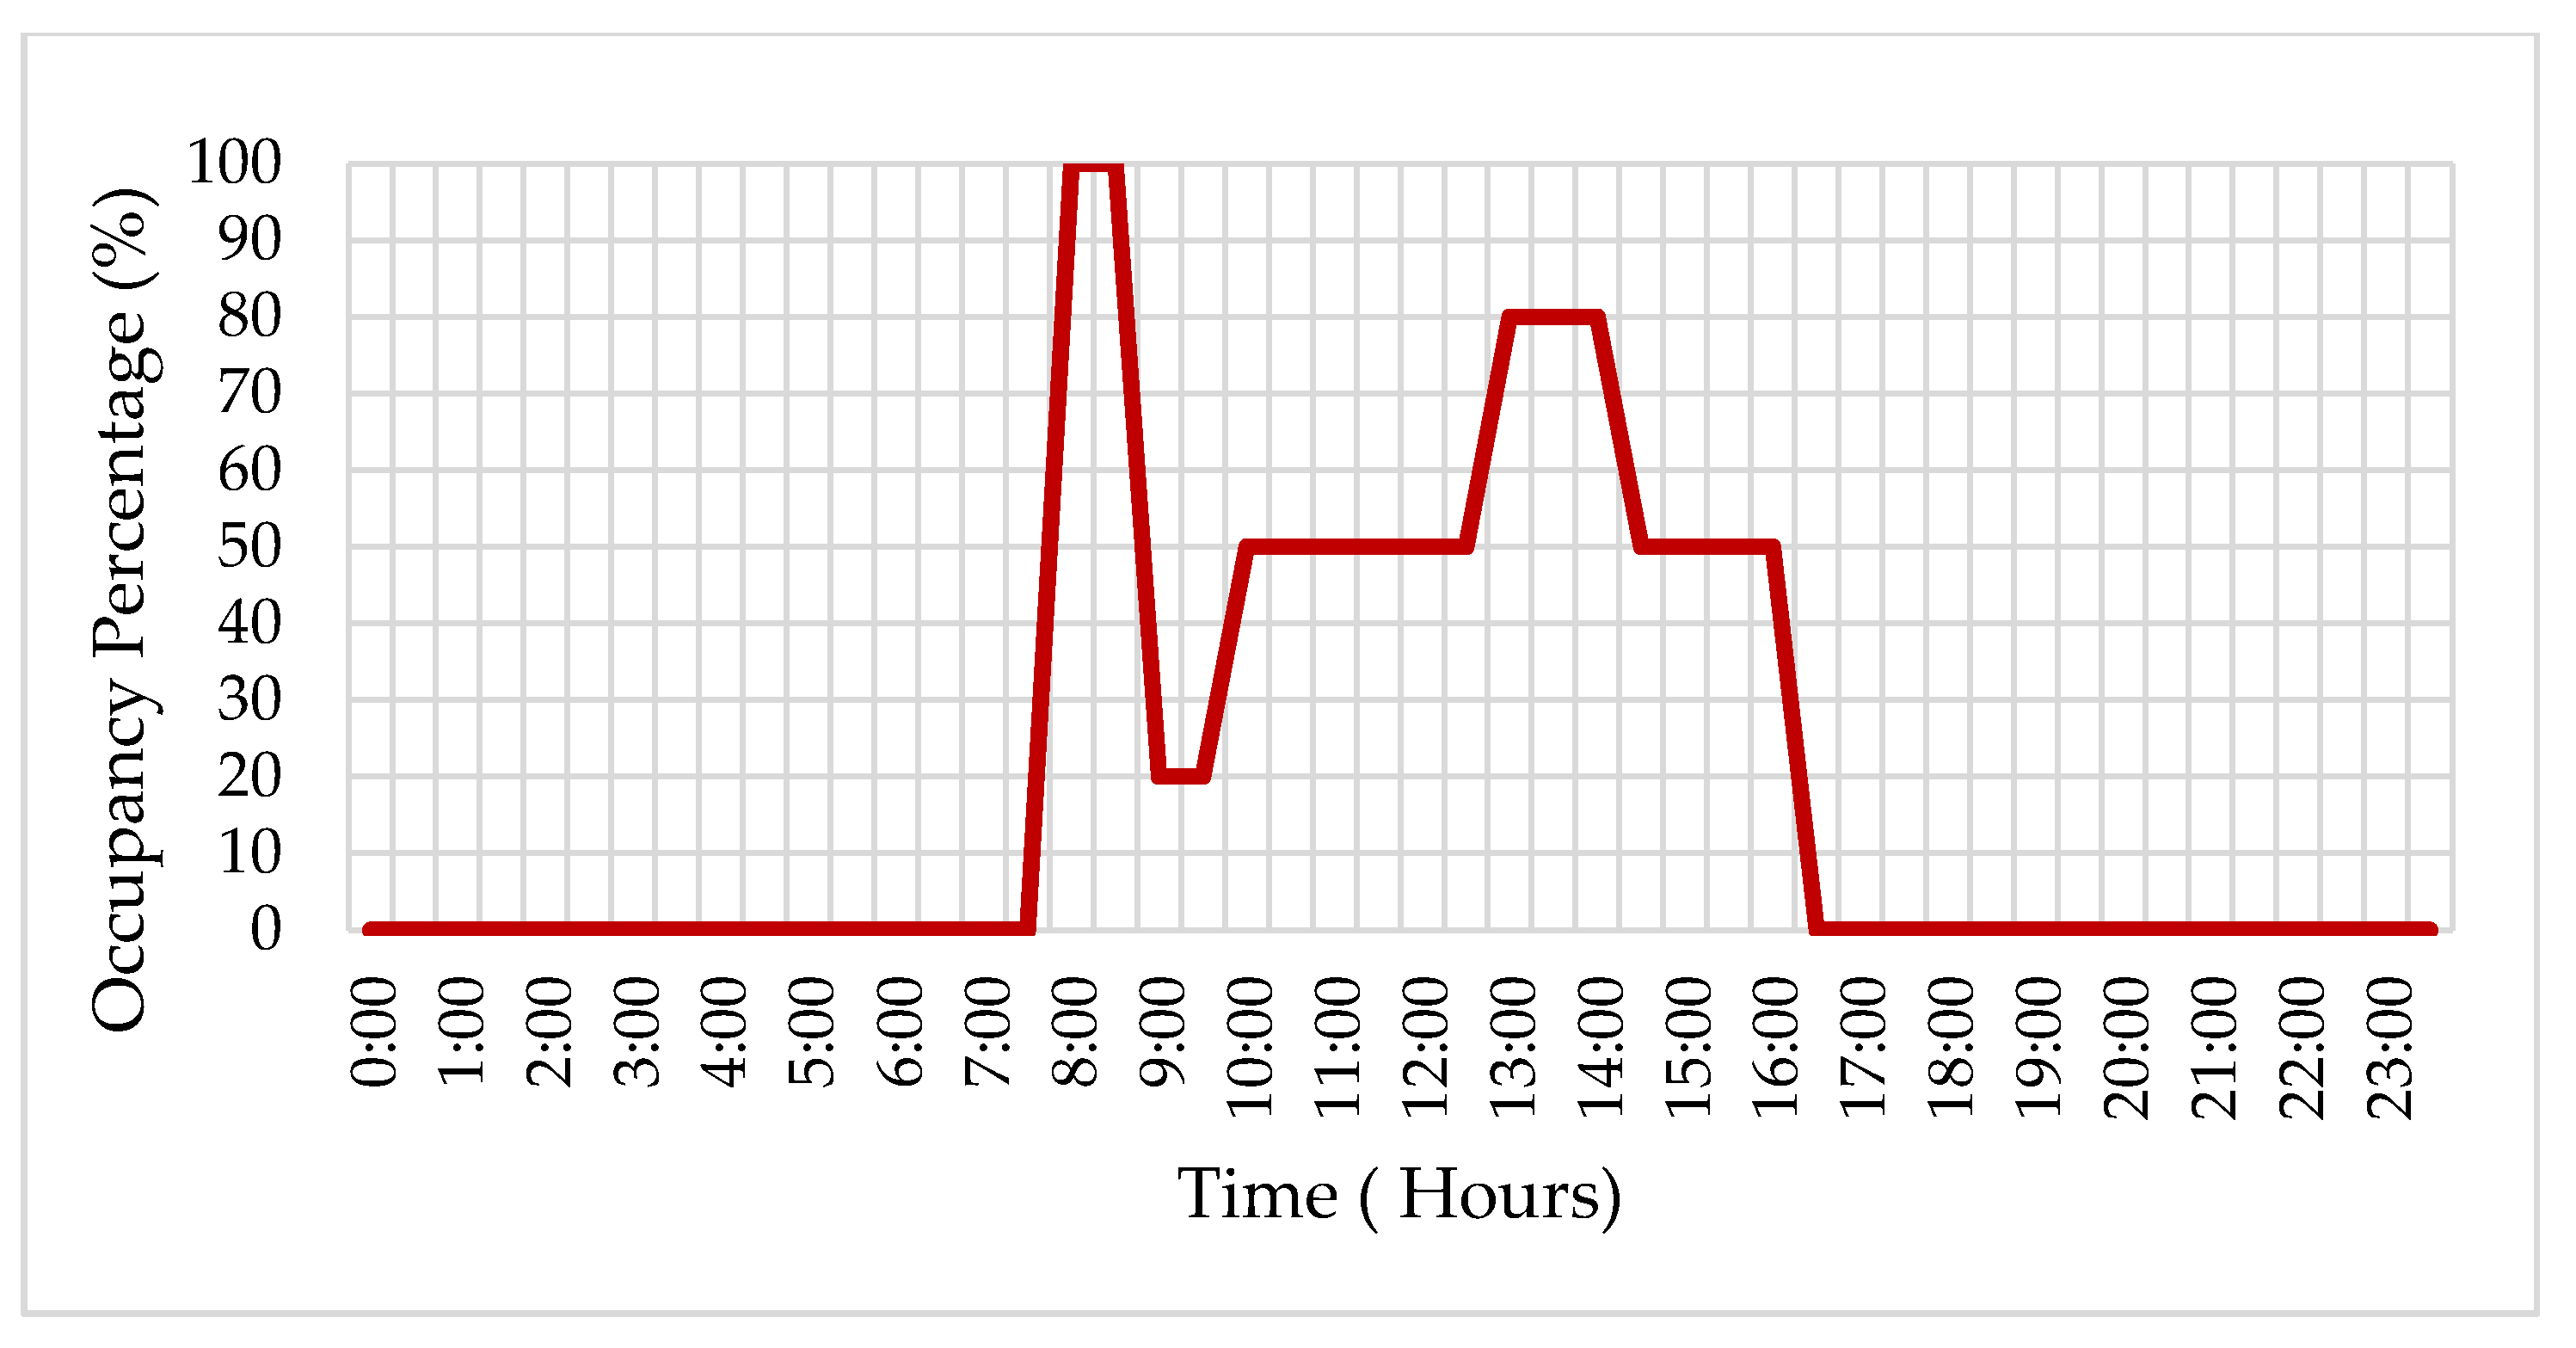
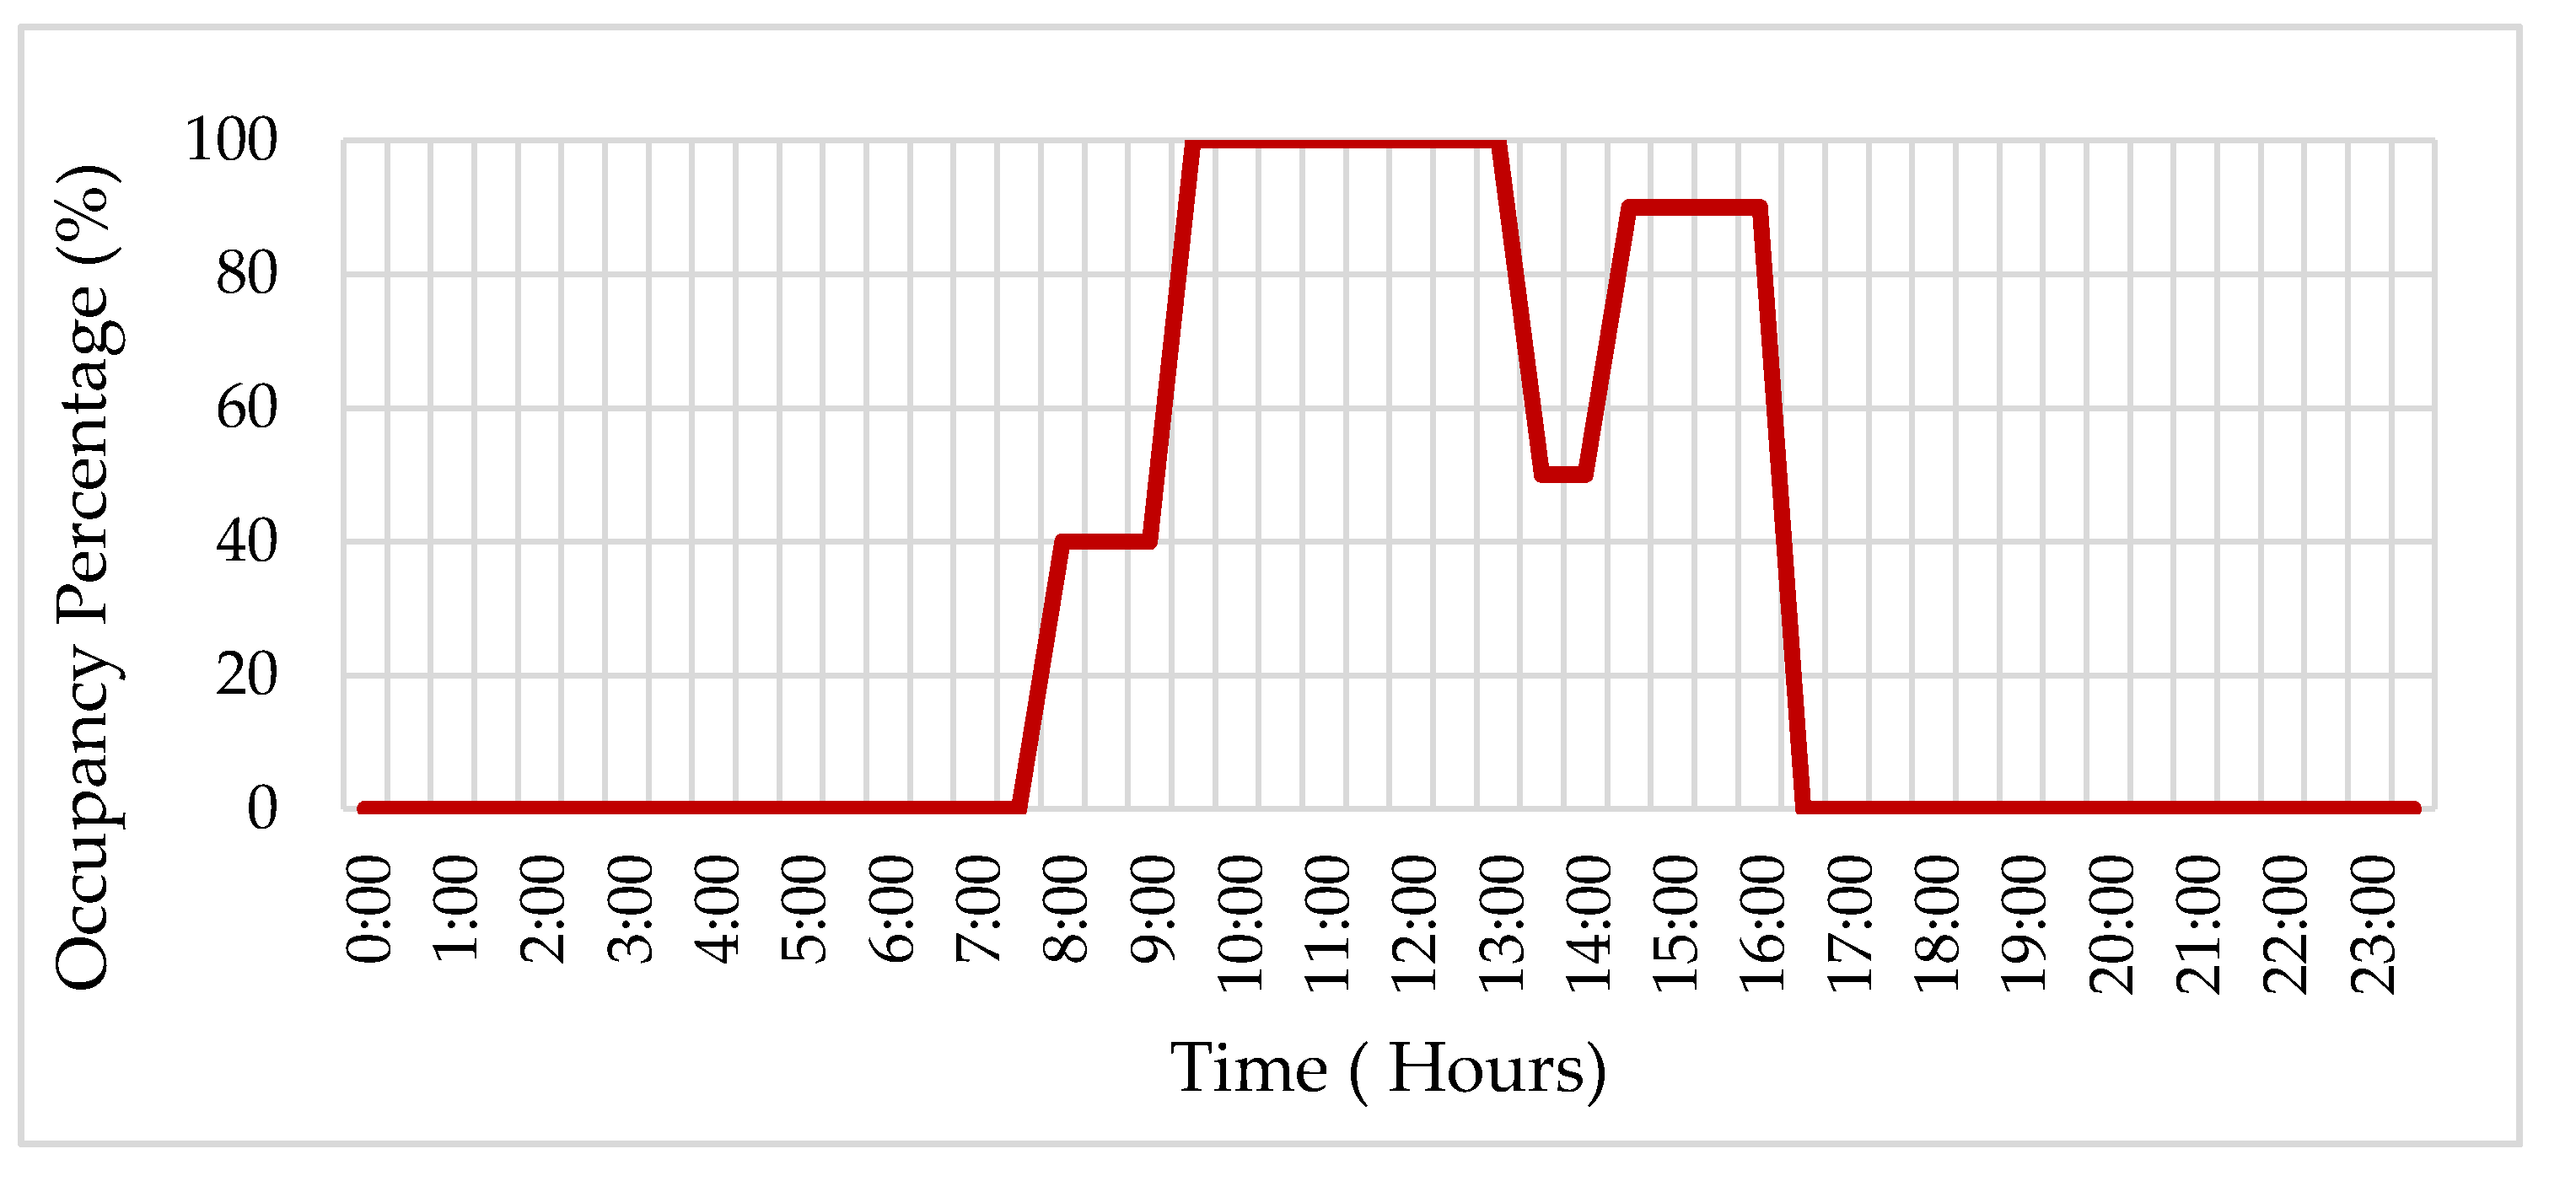
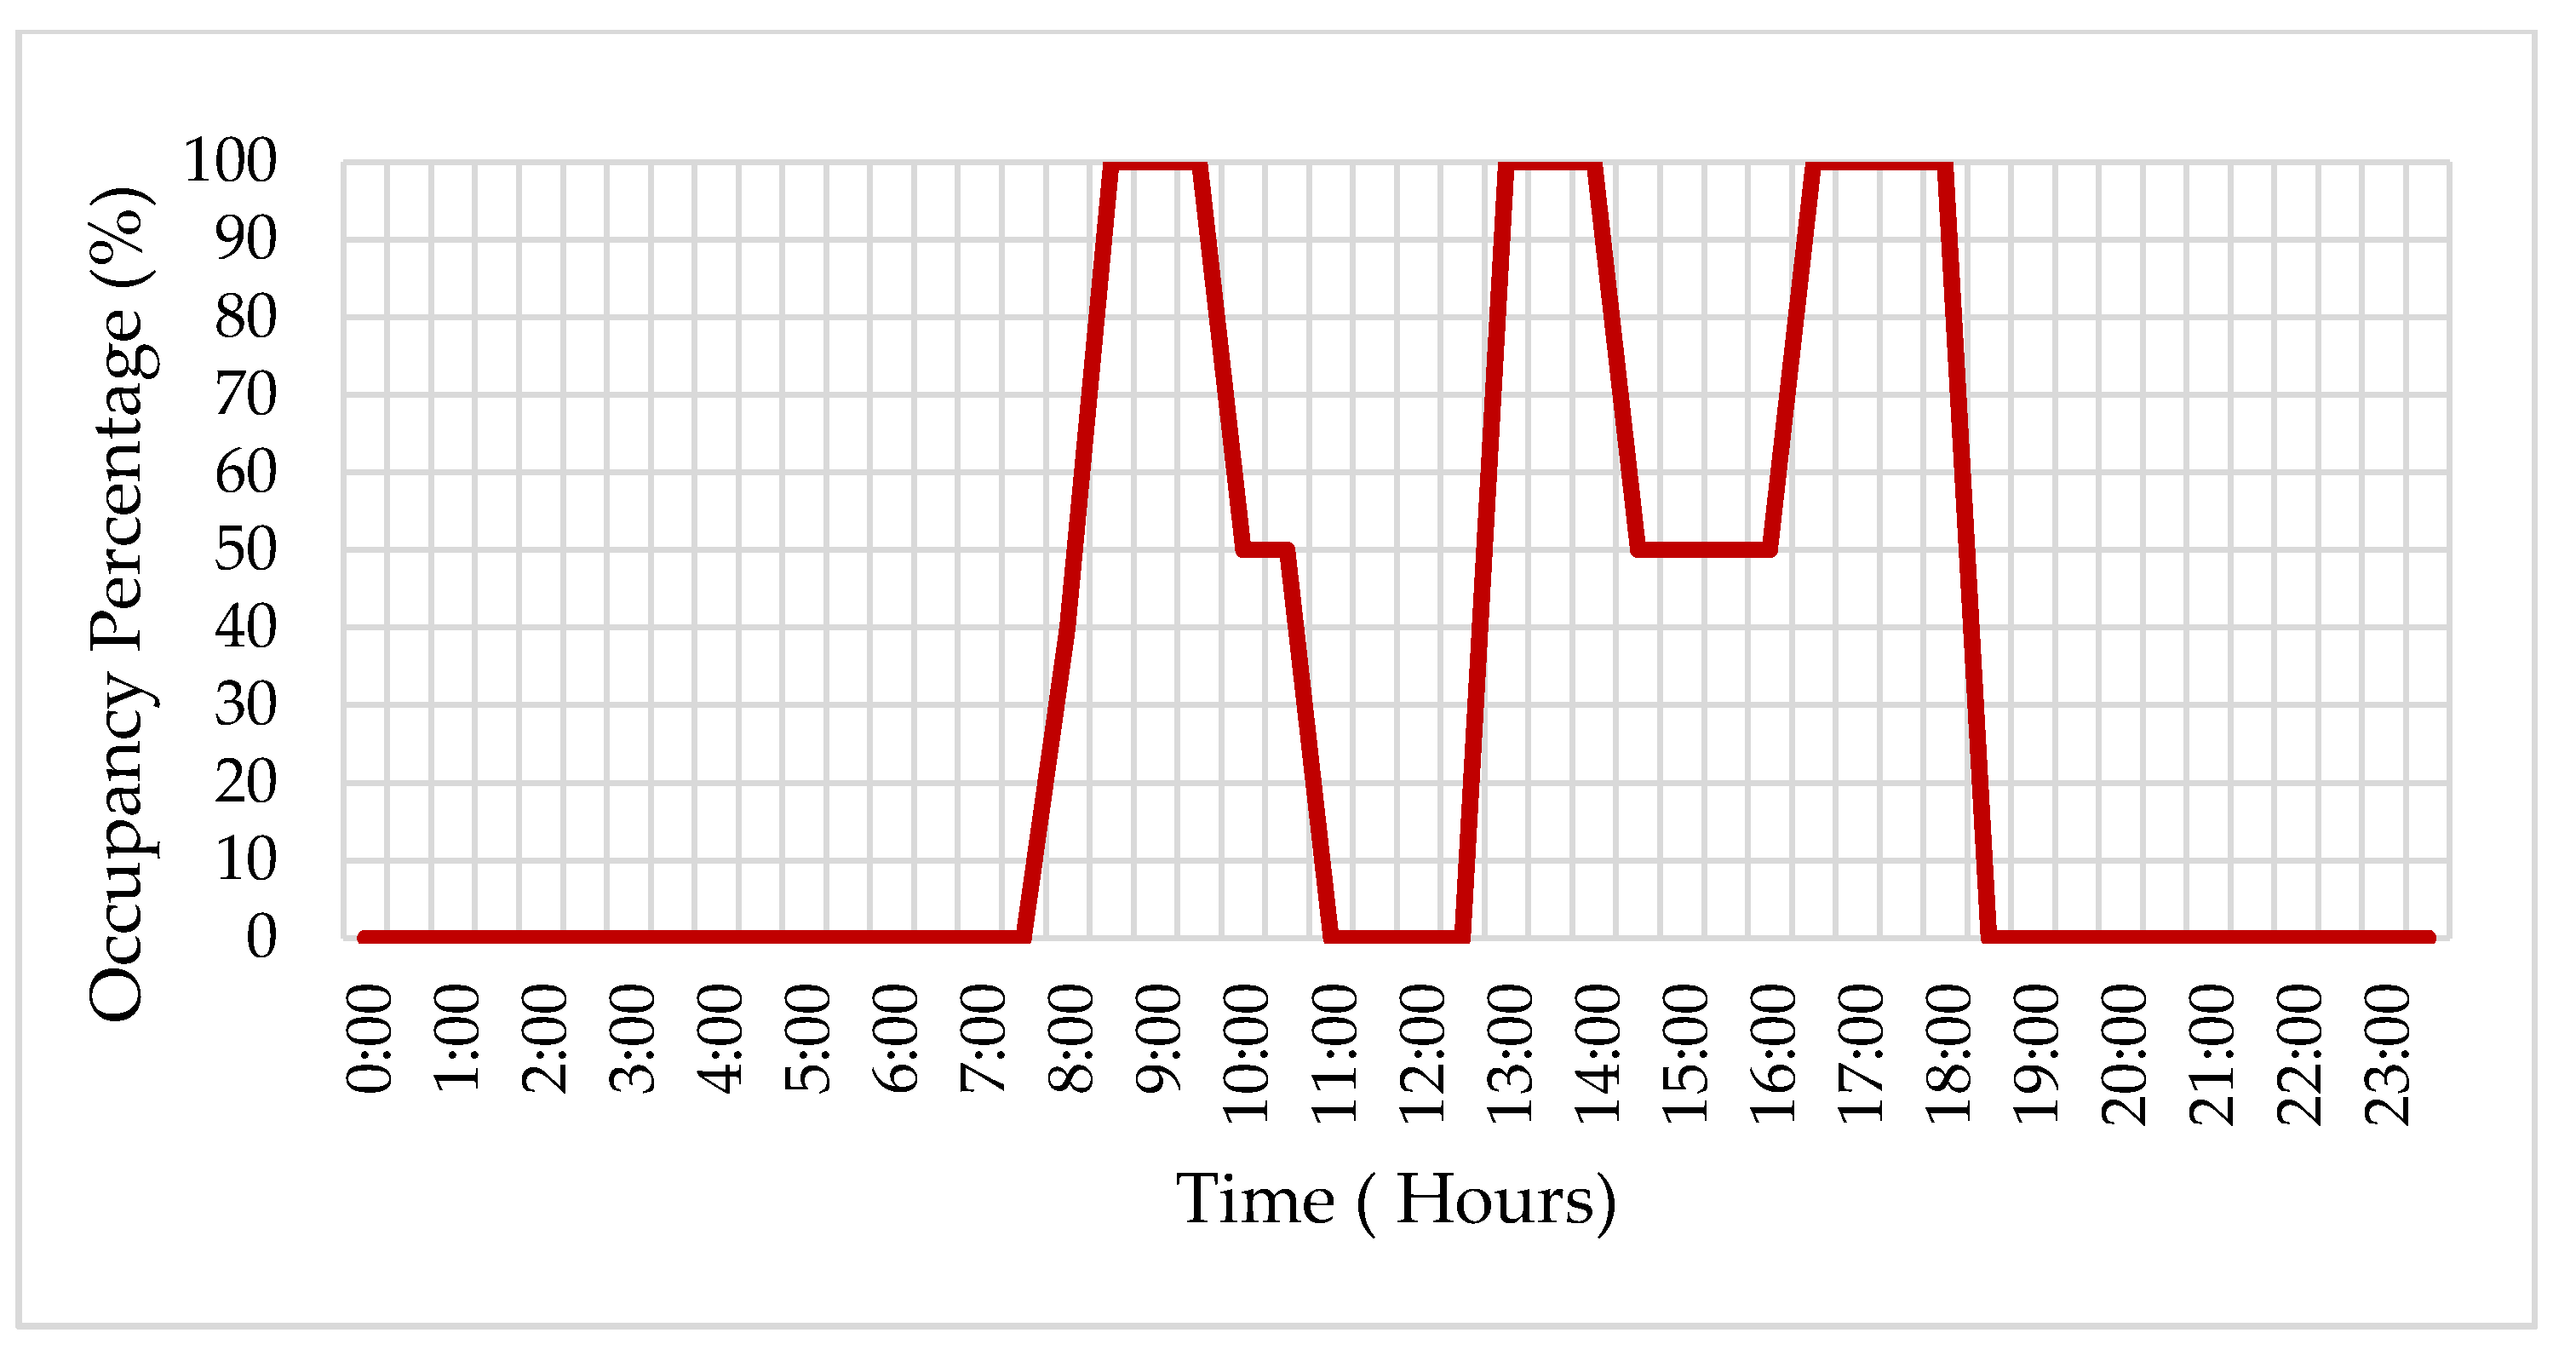
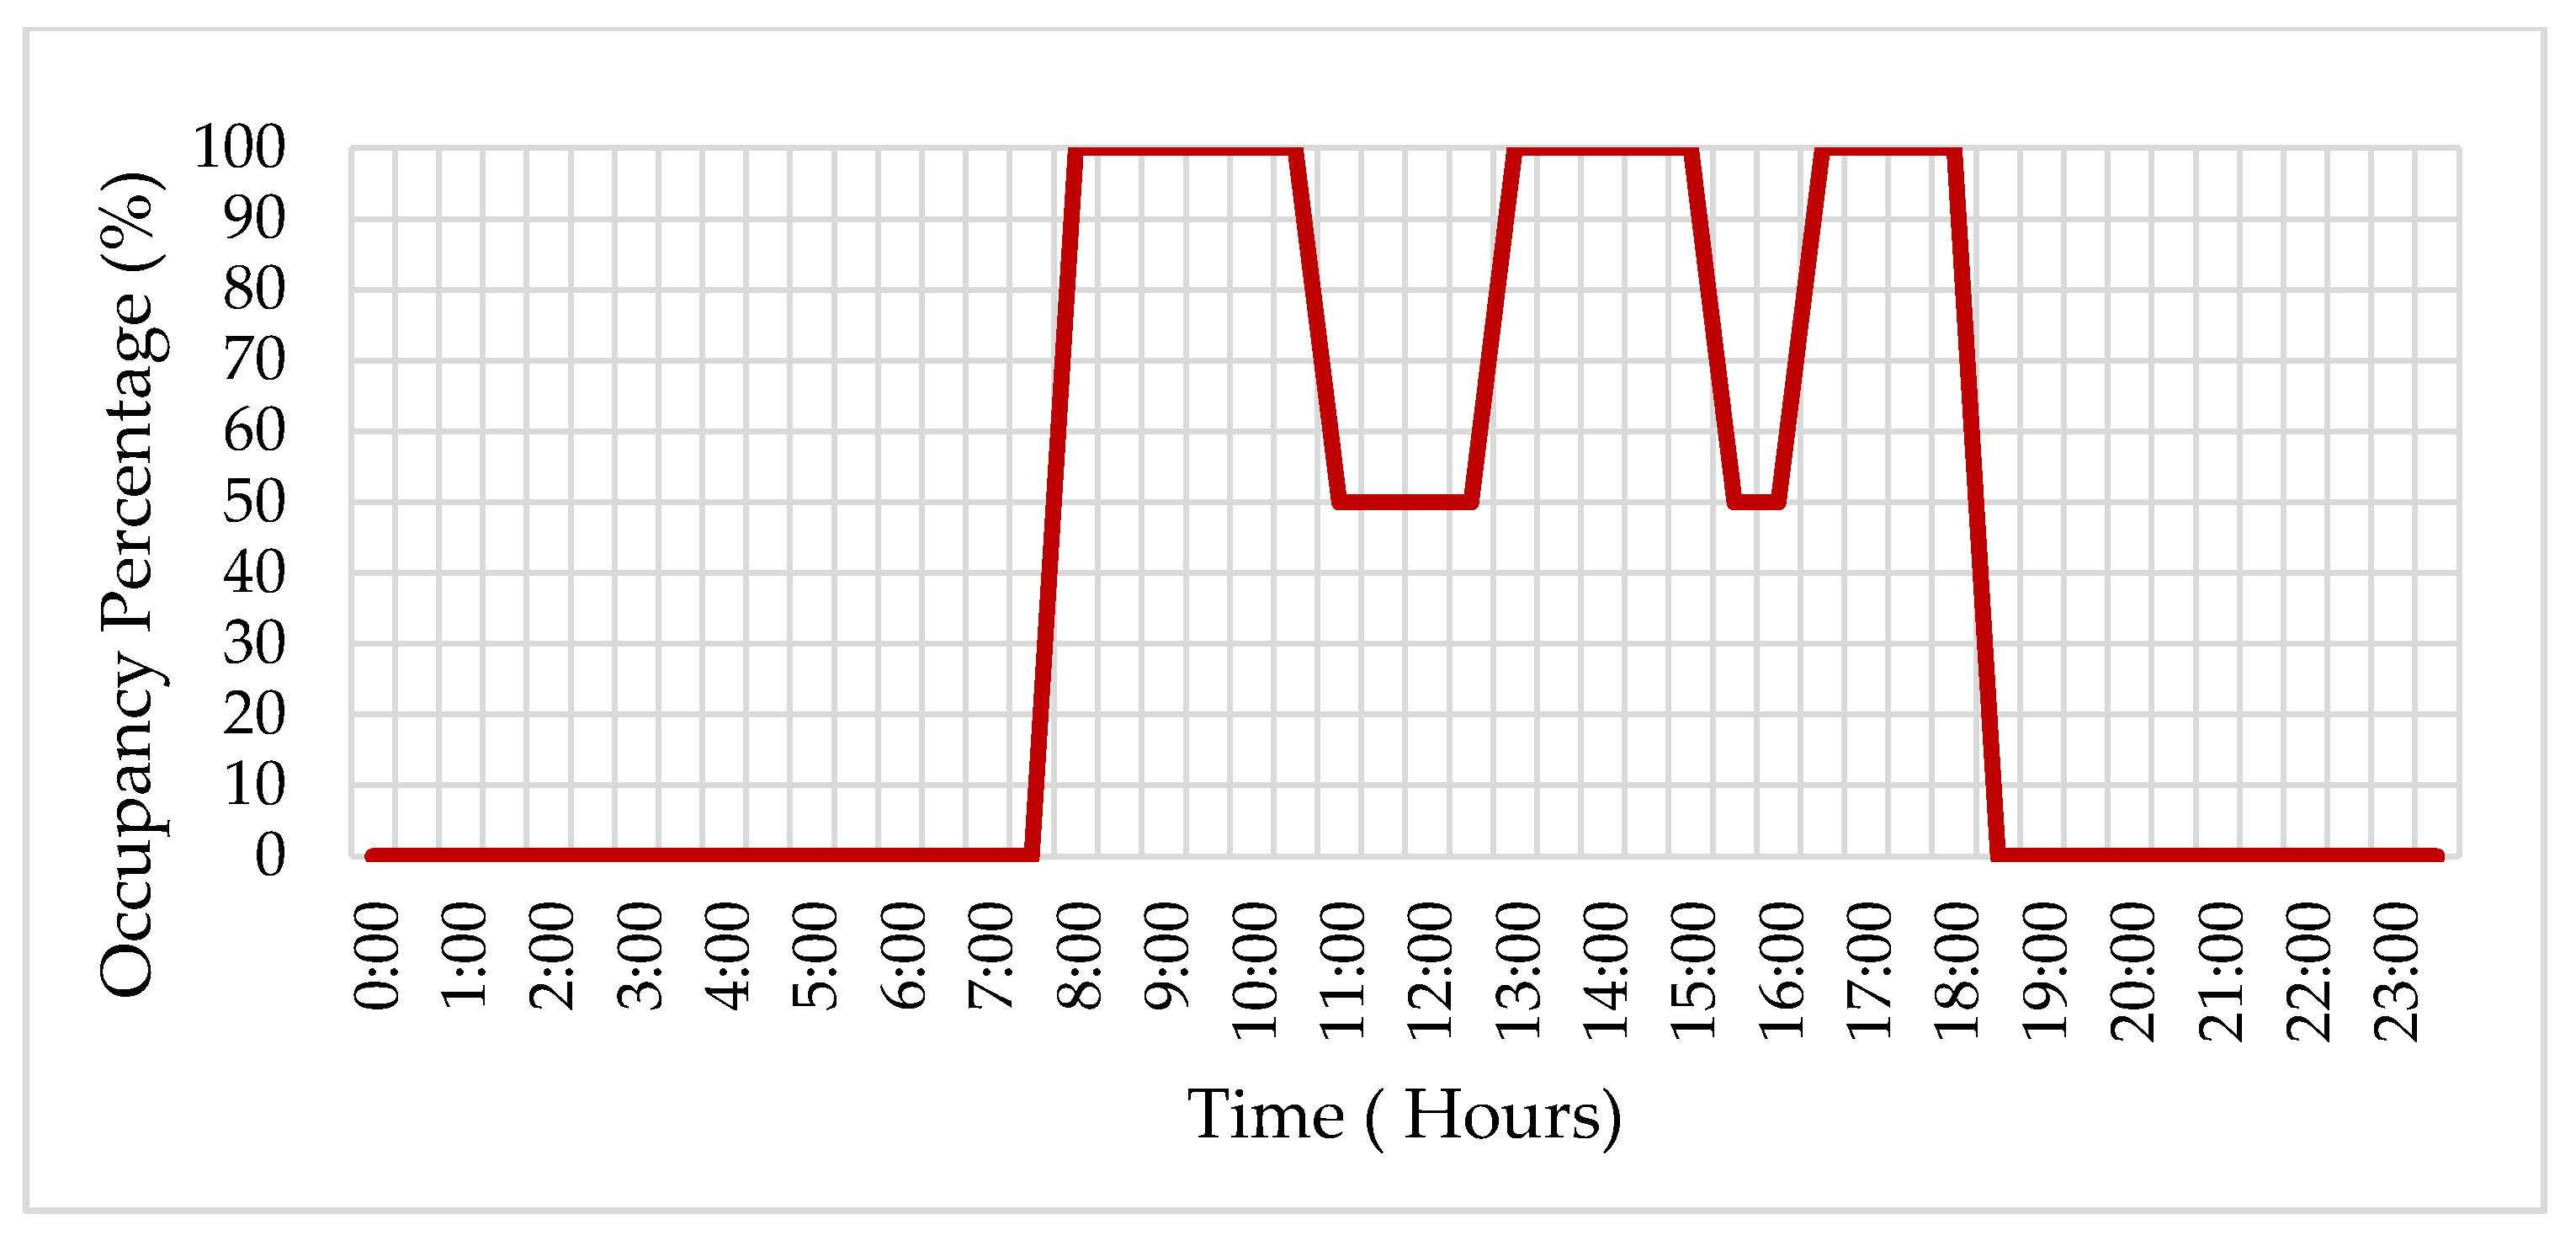
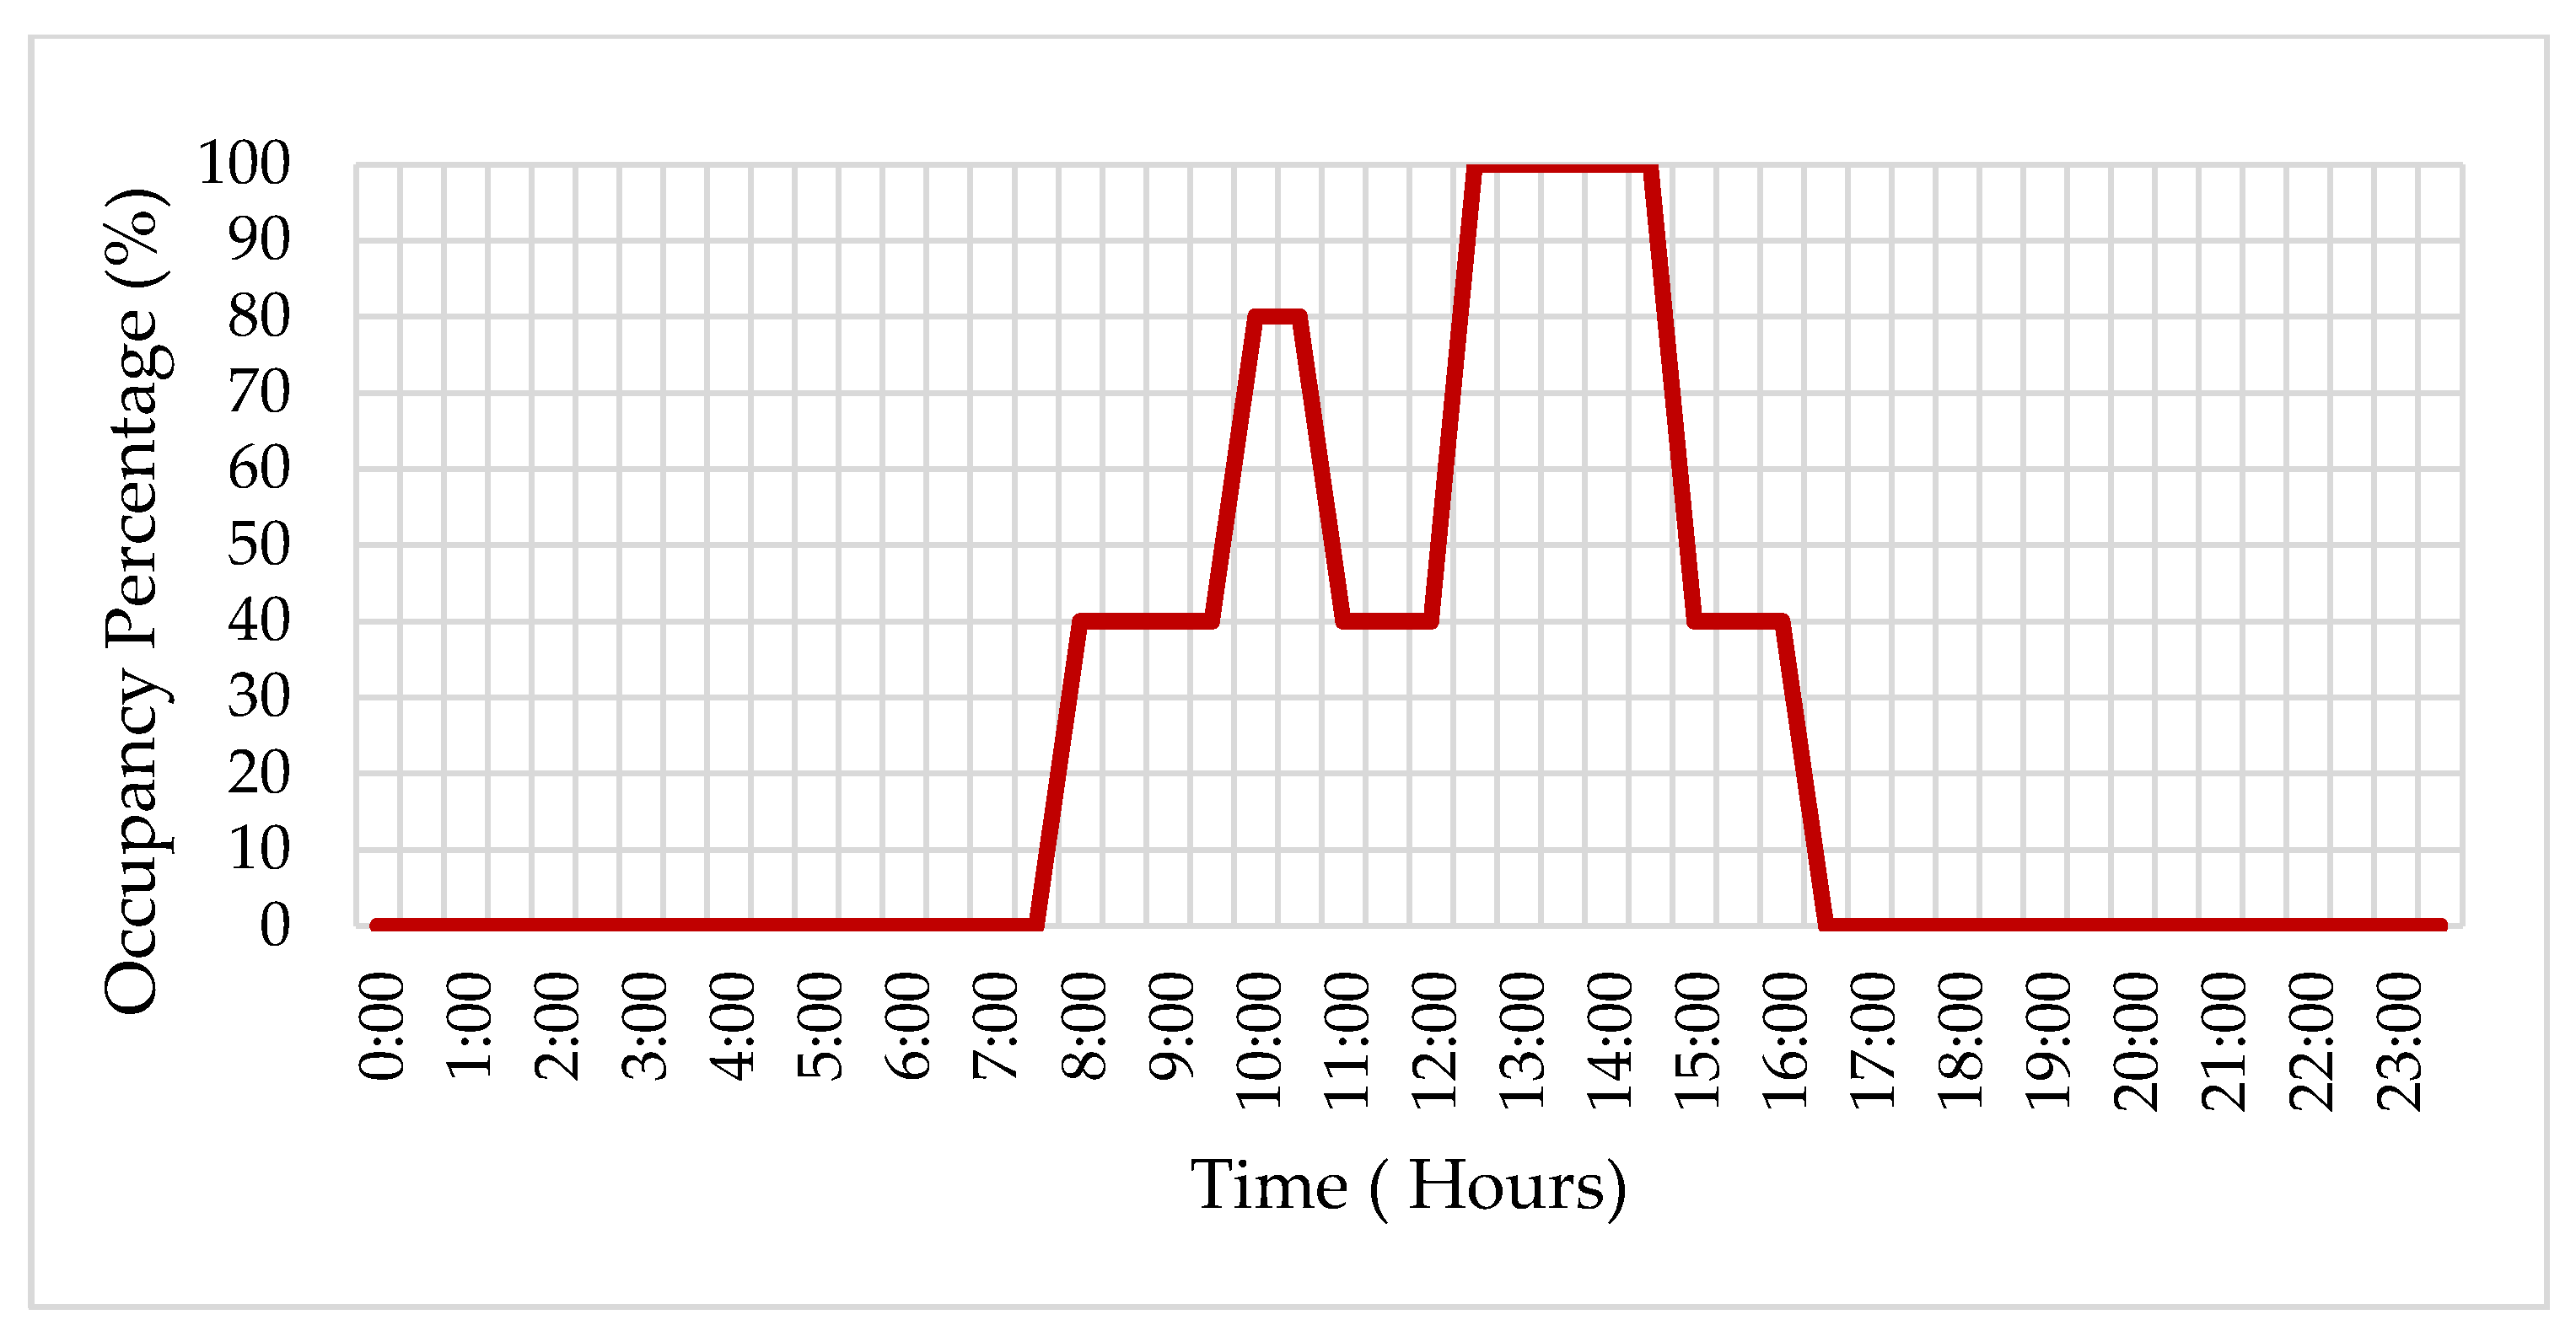
Appendix A. Occupancy Schedules


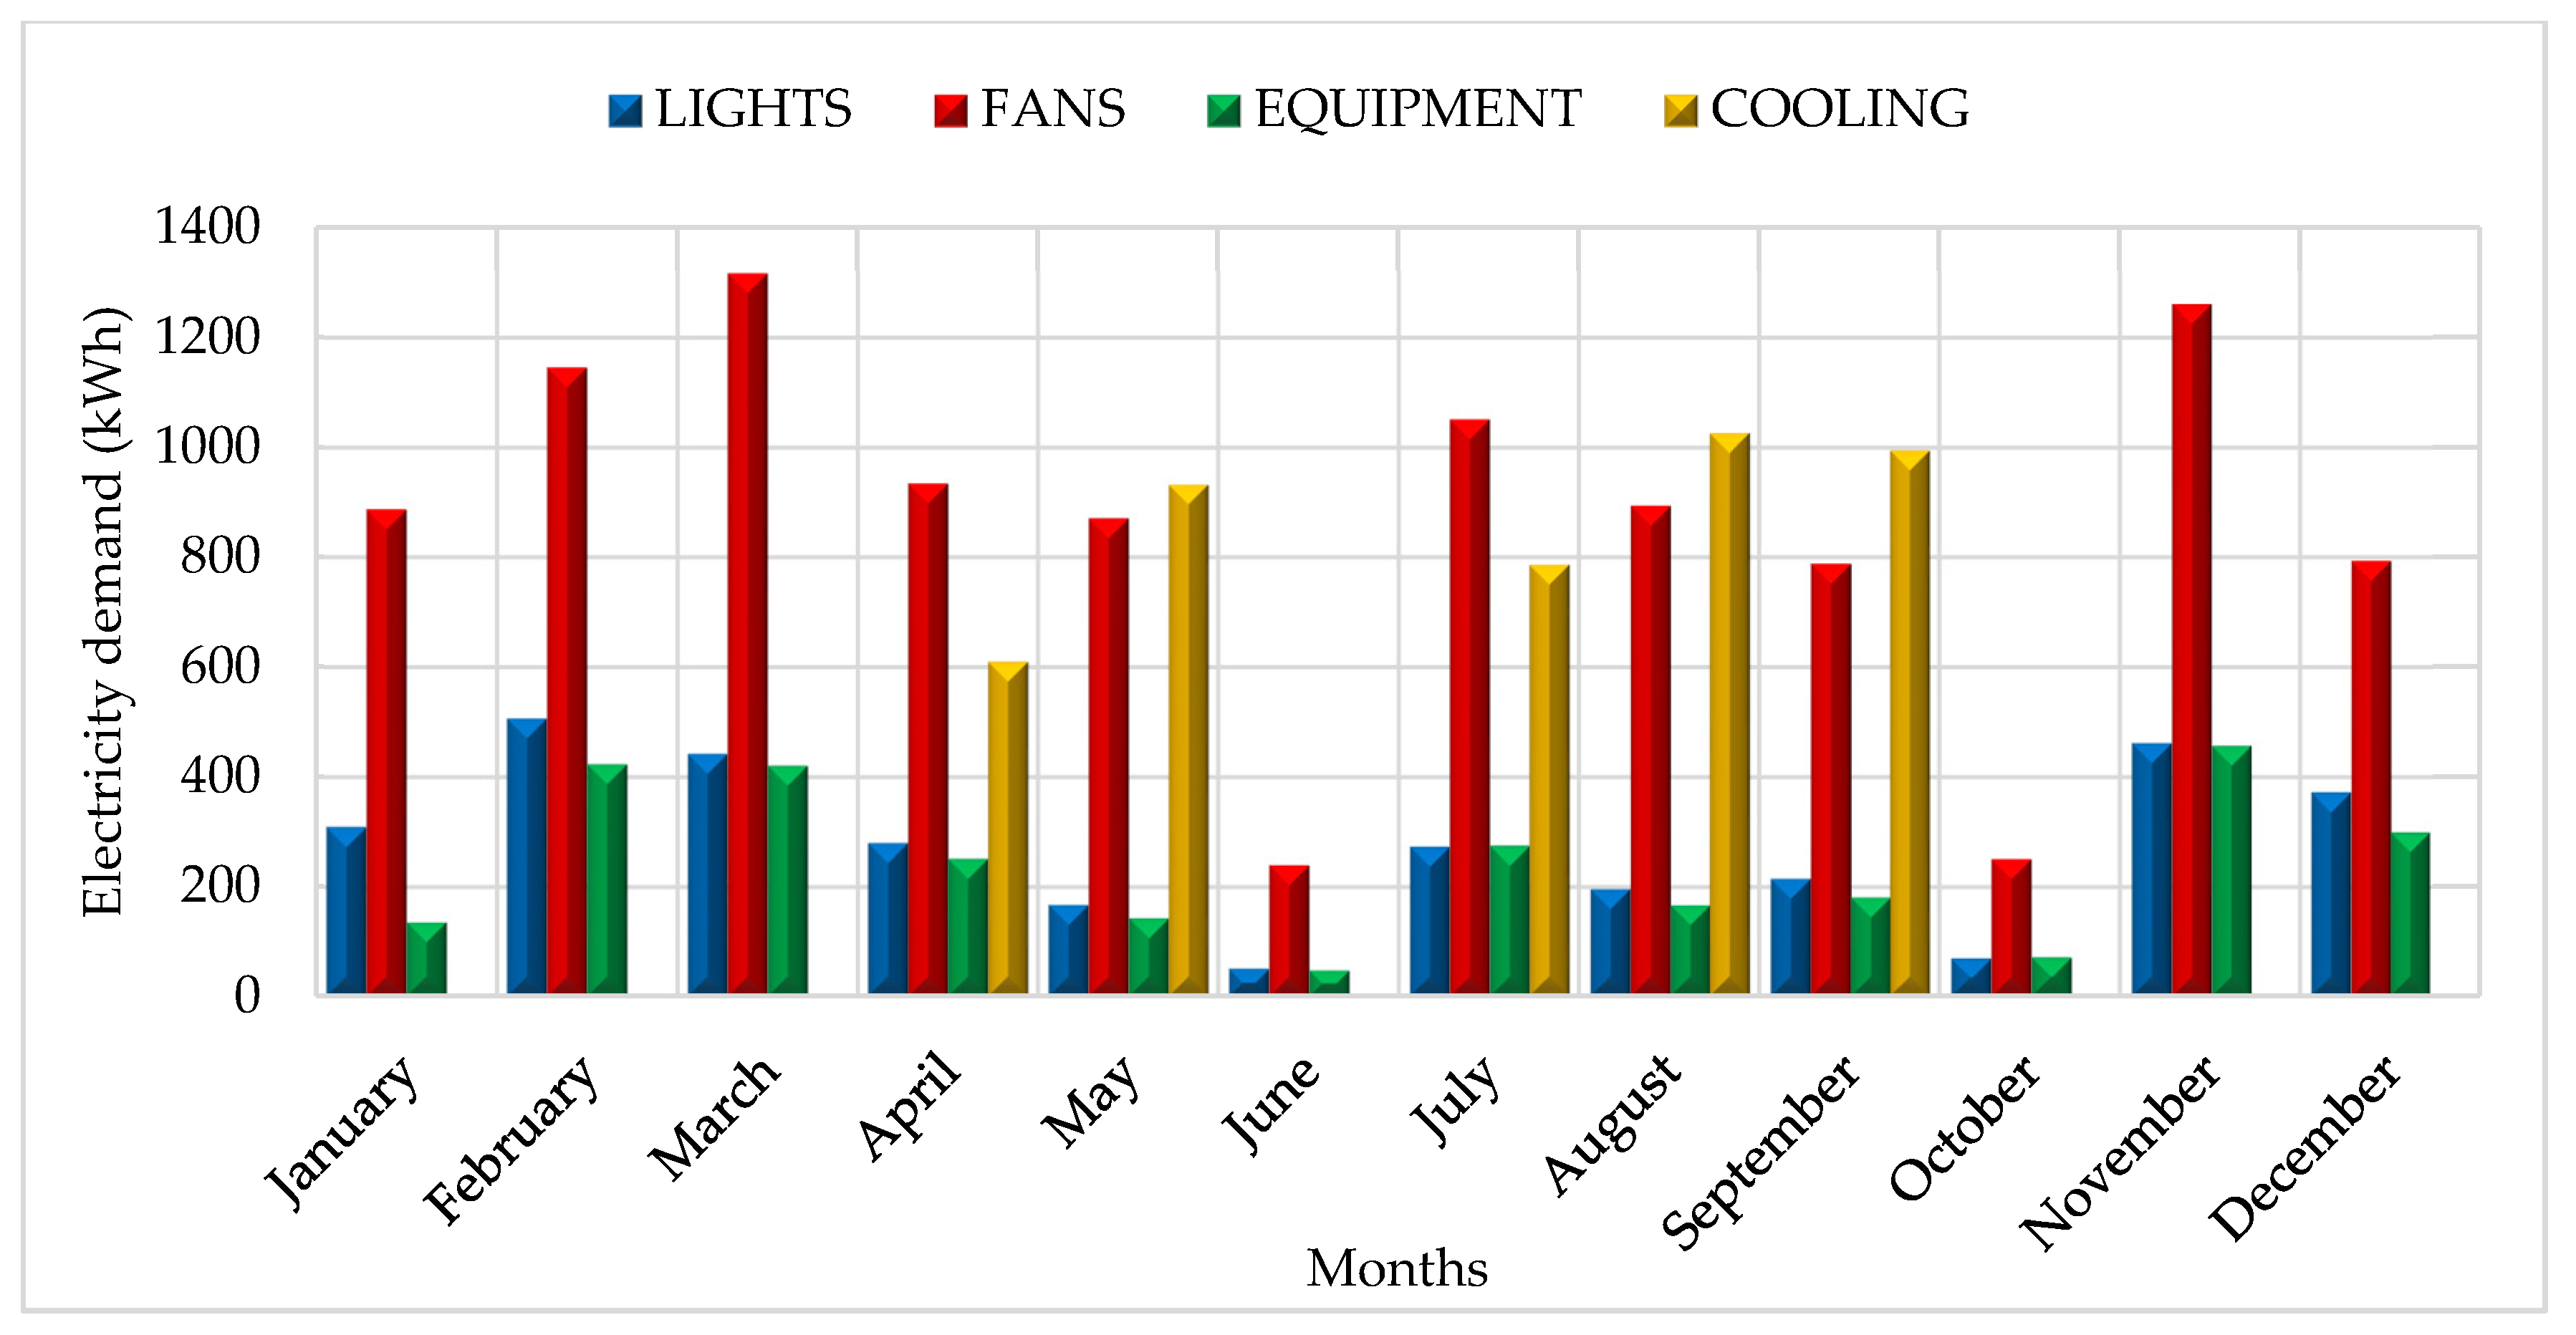
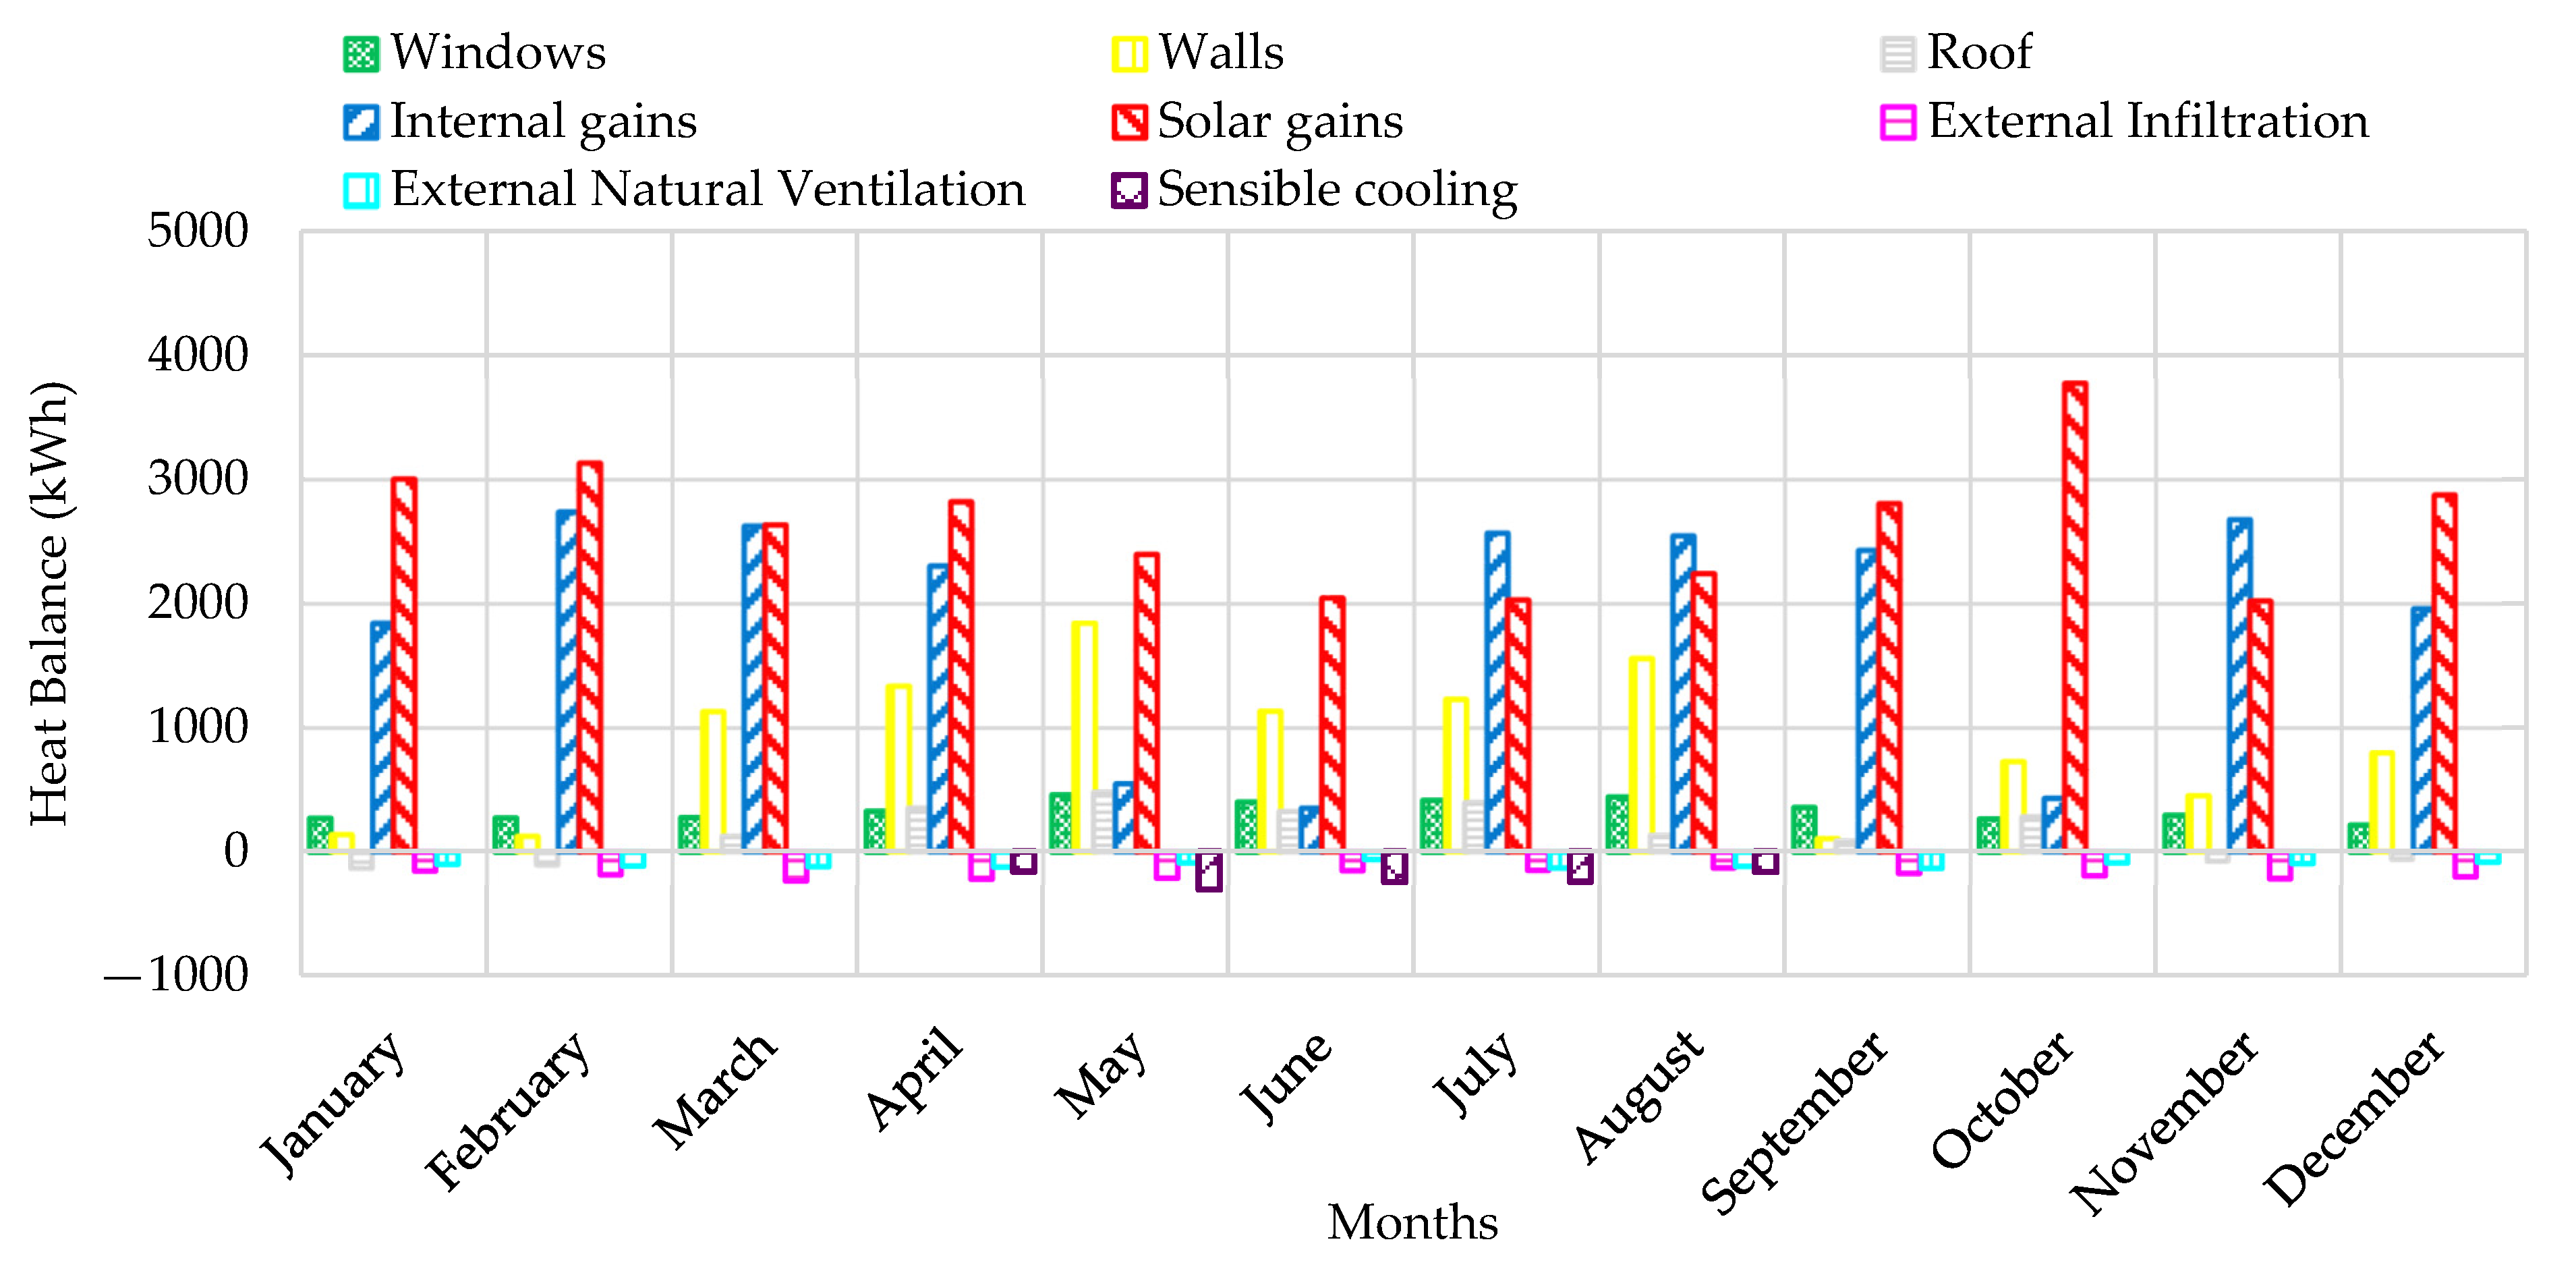
Appendix B. Breakdown of Monthly Electricity Demand
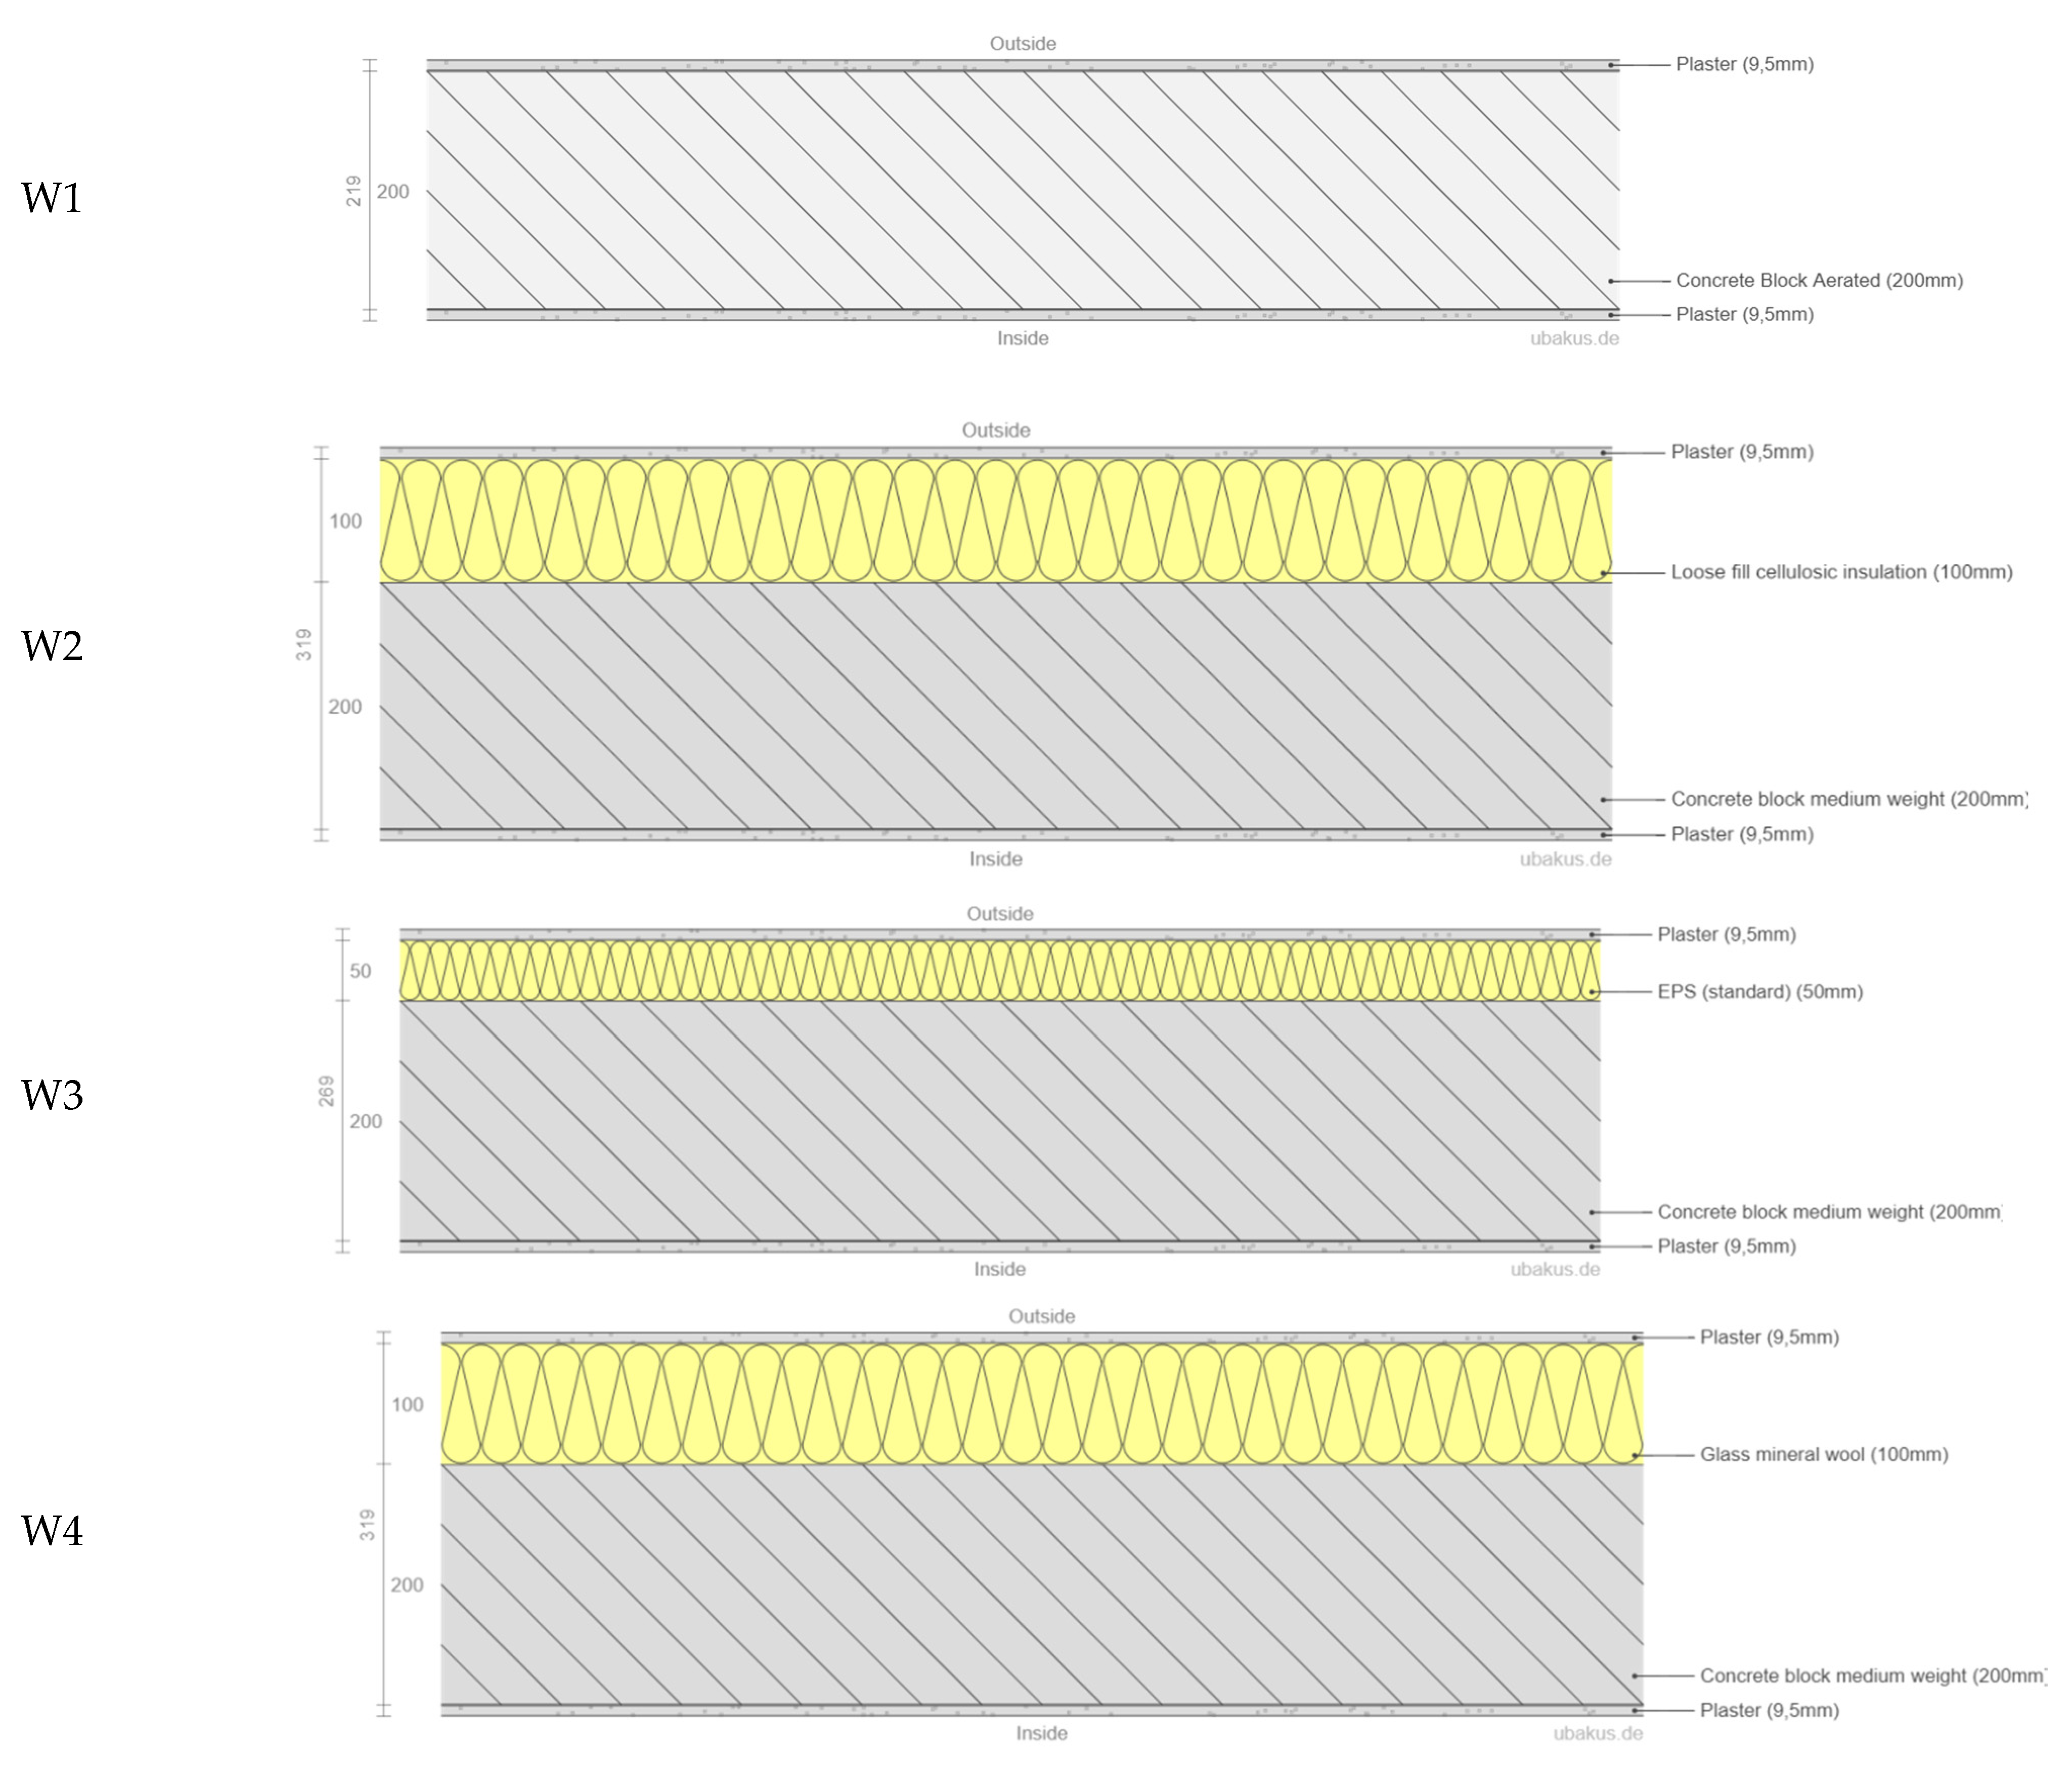
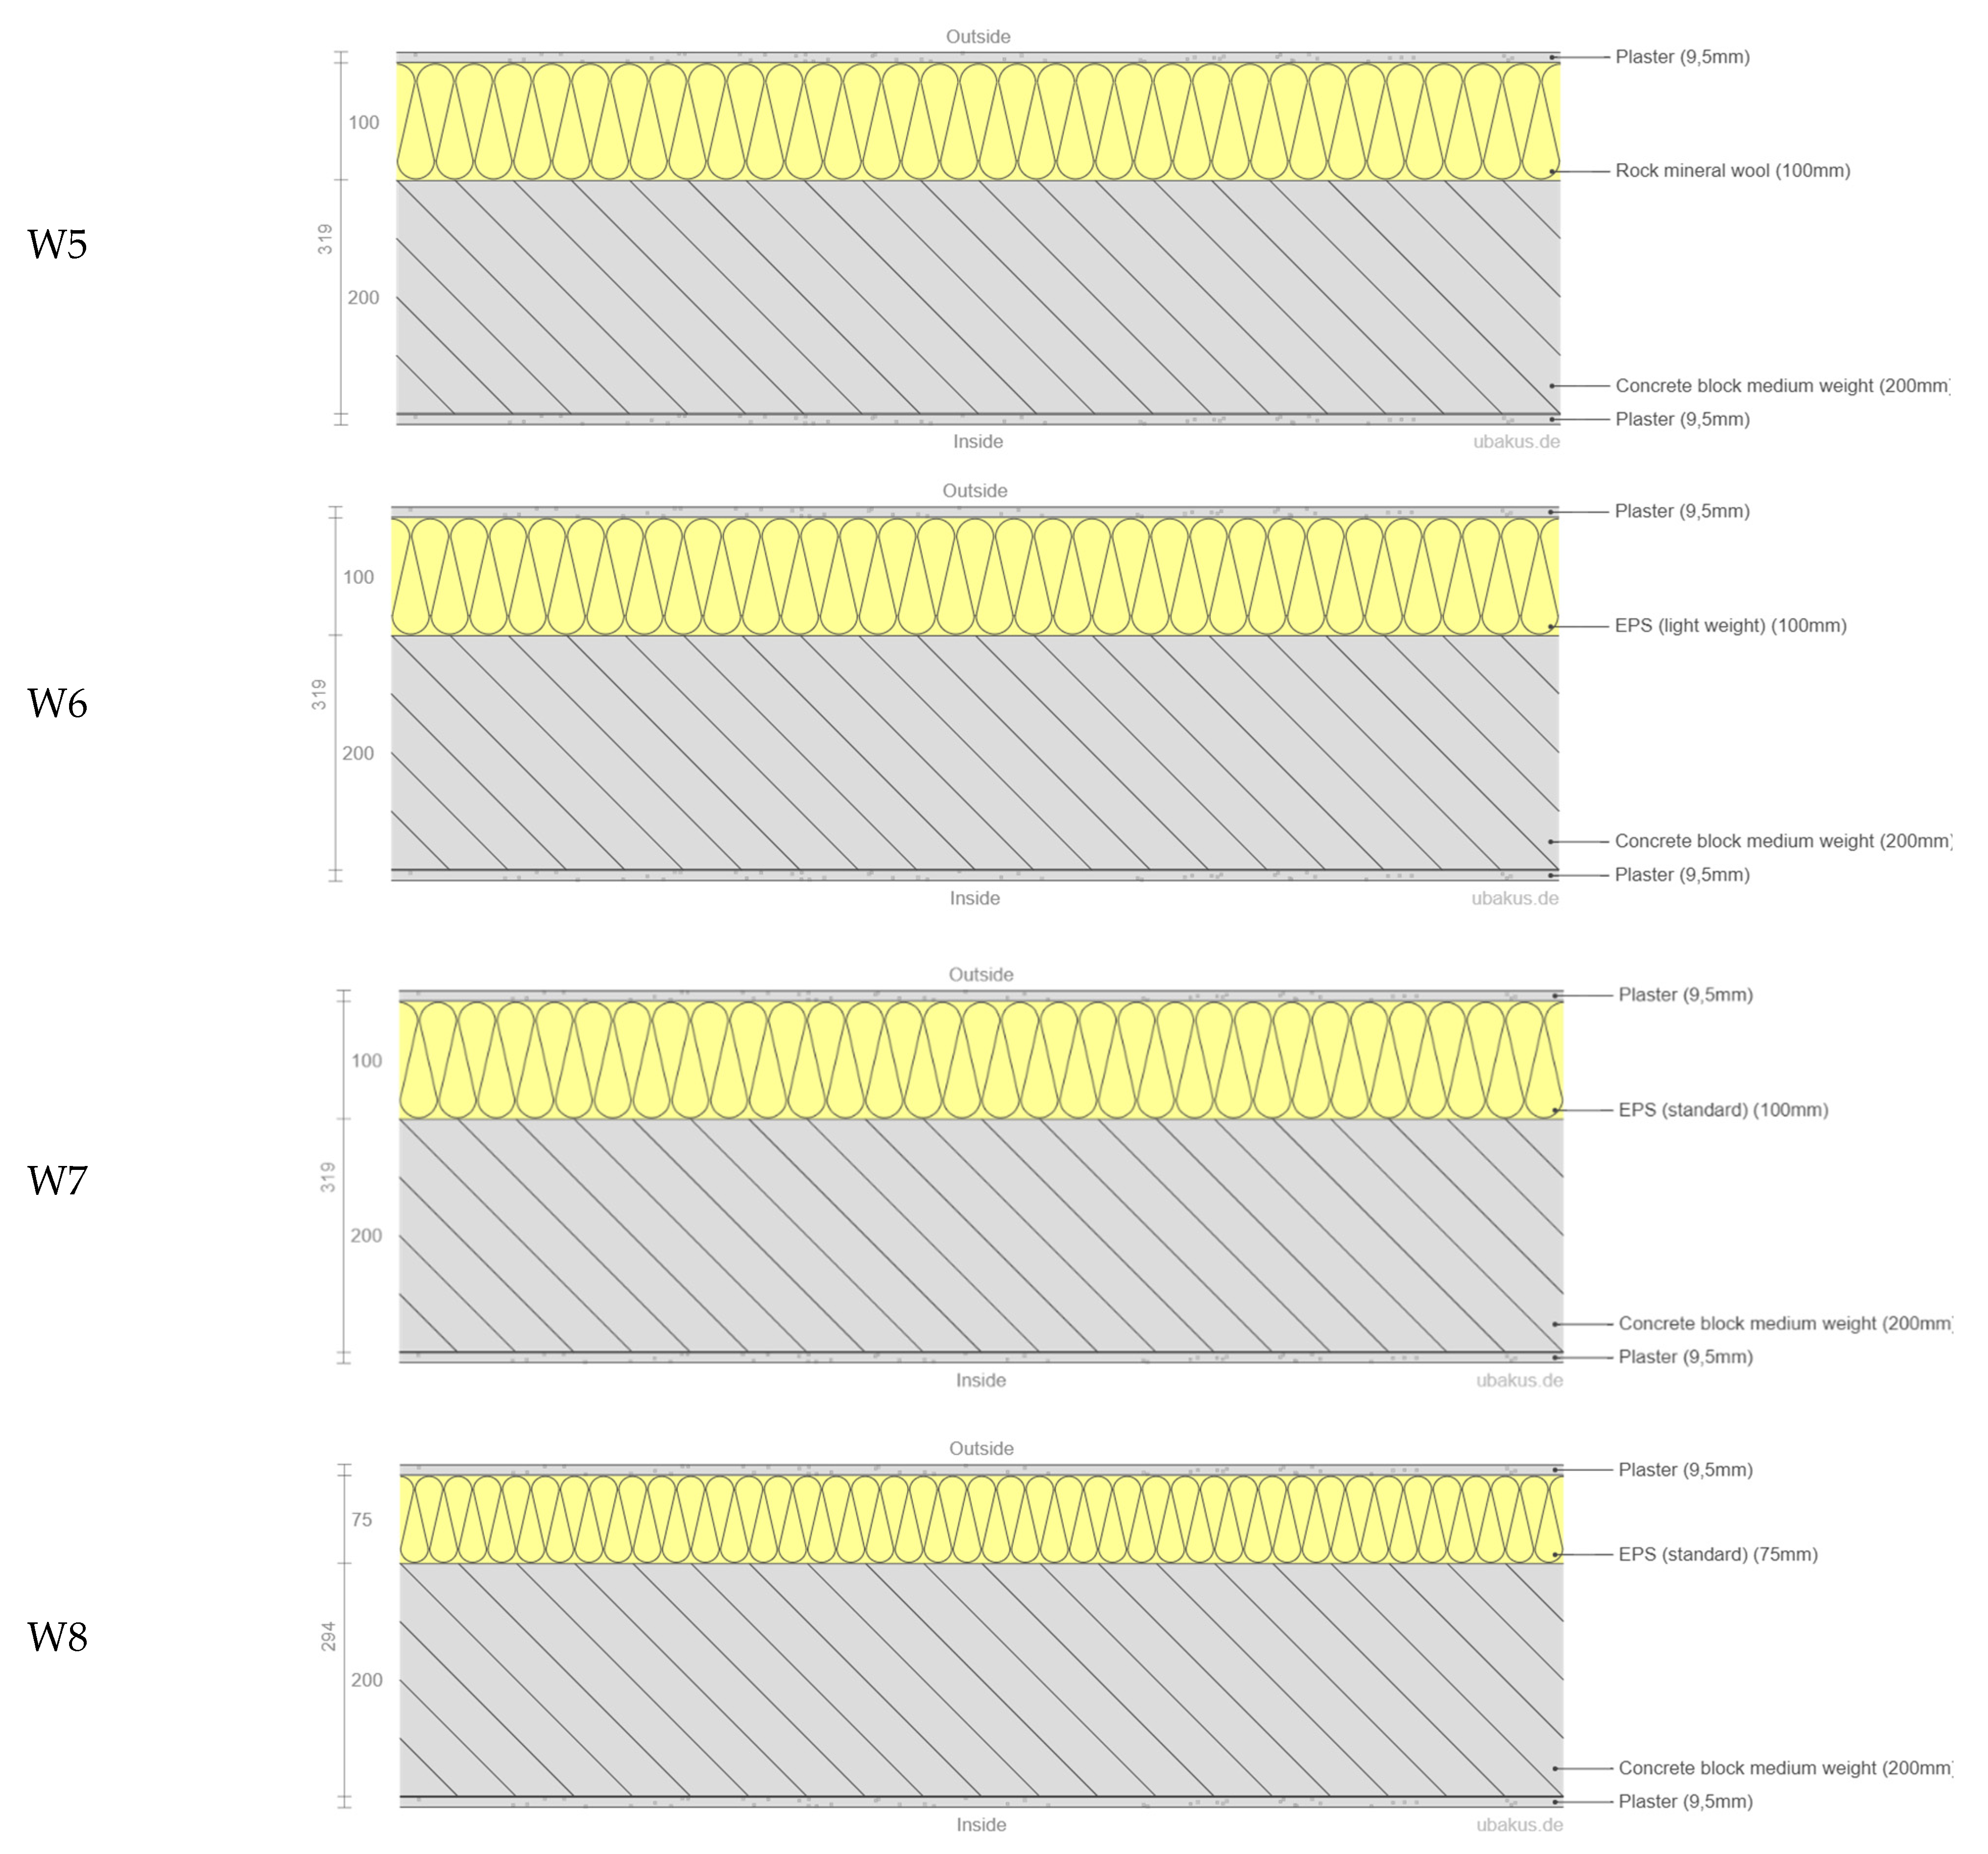
Appendix C. Cross Sections of Alternative Wall and Roof Compositions


Appendix D. Floor Plans of the ACB


References
- Shoubi, M.V.; Bagchi, A.; Barough, A.S. Reducing the operational energy demand in reducing the operational energy demand in buildings using building information modeling tools and sustainability approaches. Ain Shams Eng. J. 2015, 6, 41–55. [Google Scholar] [CrossRef] [Green Version]
- Yılmaz, Z. Evaluation of energy efficient design strategies for different climatic zones: Comparison of thermal performance of buildings in temperate-humid and hot-dry climate. Energy Build. 2007, 39, 306–316. [Google Scholar] [CrossRef]
- International Energy Agency. Global Status Report for Buildings and Construction. Available online: https://www.iea.org/reports/global-status-report-for-buildings-and-construction-2019 (accessed on 12 February 2021).
- Ahsan, M.M.; Zulqernain, M.; Ahmad, H.; Wajid, B.A.; Shahzad, S.; Hussain, M. Reducing the operational energy consump-tion in buildings by passive cooling techniques using building information modelling tools. Int. J. Renew. Energy Res. 2019, 9, 343–353. [Google Scholar]
- Ministry of Planning Development and Reform; Government of Pakistan. National Action Plan; Government of Pakistan: Islamabad, Pakistan, 2019.
- Ministry of Energy (Petroleum Division). Pakistan Energy Yearbook; Ministry of Energy: Islamabad, Pakistan, 2018.
- HIMA Verte. Energy Saving in Pakistan. 2016. Available online: https://img1.wsimg.com/blobby/go/a53308c6-148c-4dca-b8b1-d0227fe8ea99/downloads/1bp8e88mo_374945.pdf?ver=1616937863780 (accessed on 15 February 2021).
- Mahar, W.A.; Verbeeck, G.; Singh, M.K.; Attia, S. An Investigation of Thermal Comfort of Houses in Dry and Semi-Arid Climates of Quetta, Pakistan. Sustainability 2019, 11, 5203. [Google Scholar] [CrossRef] [Green Version]
- Khalid, A. Design Strategies and Guidelines for Tropical Coast of Pakistan, Using Climate Consultant. Eur. J. Sustain. Dev. 2015, 5, 505–512. [Google Scholar] [CrossRef] [Green Version]
- Sadineni, S.B.; Madala, S.; Boehm, R.F. Passive building energy savings: A review of building envelope components. Renew. Sustain. Energy Rev. 2011, 15, 3617–3631. [Google Scholar] [CrossRef]
- Okba, E.M. Building envelope design as a passive cooling technique. In Proceedings of the International Conference on Passive Low Energy Cooling for the Built Environment, Santorini, Greece, 19–21 May 2005; pp. 467–473. [Google Scholar]
- Iwaro, J.; Mwasha, A. The impact of sustainable building envelope design on building sustainability using Integrated Performance Model. Int. J. Sustain. Built Environ. 2013, 2, 153–171. [Google Scholar] [CrossRef] [Green Version]
- Sait, H.H. Auditing and analysis of energy consumption of an educational building in hot and humid area. Energy Convers. Manag. 2013, 66, 143–152. [Google Scholar] [CrossRef]
- Iqbal, I.; Al-Homoud, M.S. Parametric analysis of alternative energy conservation measures in an office building in hot and humid climate. Build. Environ. 2007, 42, 2166–2177. [Google Scholar] [CrossRef]
- Perez, Y.V.; Capeluto, I.G. Climatic considerations in school building design in the hot–humid climate for reducing energy consumption. Appl. Energy 2009, 86, 340–348. [Google Scholar] [CrossRef]
- Cheng, V.; Ng, E.; Givoni, B. Effect of envelope colour and thermal mass on indoor temperatures in hot humid climate. Sol. Energy 2005, 78, 528–534. [Google Scholar] [CrossRef]
- Mirrahimi, S.; Mohamed, M.F.; Haw, L.C.; Ibrahim, N.L.N.; Yusoff, W.F.M.; Aflaki, A. The effect of building envelope on the thermal comfort and energy saving for high-rise buildings in hot–humid climate. Renew. Sustain. Energy Rev. 2016, 53, 1508–1519. [Google Scholar] [CrossRef]
- Cheung, C.; Fuller, R.; Luther, M. Energy-efficient envelope design for high-rise apartments. Energy Build. 2005, 37, 37–48. [Google Scholar] [CrossRef] [Green Version]
- Hassan, A.S.; Al-Ashwal, N.T. Impact of Building Envelope Modification on Energy Performance of High-Rise Apartments in Kuala Lumpur, Malaysia. Int. Trans. J. Eng. Manag. Appl. Sci. Technol. 2015, 6, 91–105. [Google Scholar]
- Al-Tamimi, N.; Fadzil, S.F.S. Energy-efficient envelope design for high-rise residential buildings in Malaysia. Arch. Sci. Rev. 2012, 55, 119–127. [Google Scholar] [CrossRef]
- Sang, X.; Pan, W.; Kumaraswamy, M. Informing Energy-efficient Building Envelope Design Decisions for Hong Kong. Energy Procedia 2014, 62, 123–131. [Google Scholar] [CrossRef] [Green Version]
- Mahar, W.A.; Anwar, N.U.R.; Attia, S. Building Energy Efficiency Policies and Practices in Pakistan: A Literature Review. In Proceedings of the 5th International Conference on Energy, Environment and Sustainable Development (EESD-2018), Jamshoro, Pakistan, 14–16 November 2018. [Google Scholar]
- Rehman, A.; Deyuan, Z. Pakistan’s energy scenario: A forecast of commercial energy consumption and supply from different sources through. Energy Sustain. Soc. 2018, 8, 26. [Google Scholar] [CrossRef] [Green Version]
- Anwar, N.U.R.; Mahar, W.A.; Khan, J.F. Renewable energy technologies in Balochistan: Practice, prospects and challenges. In Proceedings of the 5th International Conference on Energy, Environment and Sustainable Development (EESD-2018), Jamshoro, Pakistan, 14–16 November 2018. [Google Scholar]
- Ministry of Finance of Pakistan. Energy. In Pakistan Economic Survey 2019–2020; Ministry of Finance of Pakistan: Islamabad, Pakistan, 2020. [Google Scholar]
- Xie, Y.; Fang, C.; Lin, G.C.; Gong, H.; Qiao, B. Tempo-Spatial Patterns of Land Use Changes and Urban Development in Globalizing China: A Study of Beijing. Sensors 2007, 7, 2881–2906. [Google Scholar] [CrossRef] [Green Version]
- The Nation News. Unscheduled Load-Shedding Continues in Karachi Despite Government Claims. 2020. Available online: https://nation.com.pk/15-Jul-2020/unscheduled-load-shedding-continues-in-karachi-despite-govt-claims (accessed on 16 March 2021).
- Poel, B.; van Cruchten, G.; Balaras, C.A. Energy performance assessment of existing dwellings. Energy Build. 2007, 39, 393–403. [Google Scholar] [CrossRef]
- Saleem, F. Investigation of Energy Efficiency Opportunities and Assessment of Renewable Energy technologies for a College in the Rural Area of Pakistan: A Case Study of Namal College. Master’s Thesis, Murdoch University, Perth, Australia, 2016. [Google Scholar]
- Kazmi, N.A.; Anjum, N.; Iftikhar, N.; Qureshi, S. User comfort and energy efficiency in public buildings of hot composite climate of Multan, Pakistan. J. Res. Archit. Plan. 2011, 10, 76–95. [Google Scholar]
- Mahar, W.A.; Attia, S. Indoor Thermal Comfort in Residential Building Stock: A Study of RCC Houses in Quetta, Pakistan; Techninal Report; Sustainable Building Design SBD Lab/University of Liege: Liege, Belgium, 2018. [Google Scholar]
- Mahar, W.A.; Amer, M.; Attia, S. Indoor thermal comfort assessment of residential building stock in Quetta, Pakistan. In Proceedings of the European Network for Housing Research (ENHR) Annual Conference 2018, Uppsala, Sweden, 12–14 September 2018; pp. 1–12. [Google Scholar]
- Mahar, W.A.; Verbeeck, G.; Reiter, S.; Attia, S. Sensitivity Analysis of Passive Design Strategies for Residential Buildings in Cold Semi-Arid Climates. Sustainability 2020, 12, 1091. [Google Scholar] [CrossRef] [Green Version]
- Shaheen, N.; Arif, S.; Khan, A. Thermal Performance of Typical Residential Building in Karachi with Different Materials for Construction. Mehran Univ. Res. J. Eng. Technol. 2015, 35, 189–198. Available online: http://publications.muet.edu.pk/research_papers/pdf/pdf1275.pdf (accessed on 3 March 2021).
- Mahar, W.A. Methodology for the Design of Climate-Responsive Houses for Improved Thermal Comfort in Cold Semi-Arid Climates. Ph.D. Thesis, University of Liège, Liege, Belgium, 2021. [Google Scholar]
- Naeem, A.; Rafeeqi, S.F.A. NED city campus restoration- setting benchmarks for conservation practices. J. Res. Archit. Plan. 2012, 12, 1–12. [Google Scholar]
- Bughio, M.; Schuetze, T.; Mahar, W.A. Comparative Analysis of Indoor Environmental Quality of Architectural Campus Buildings’ Lecture Halls and its Perception by Building Users in Karachi, Pakistan. Sustainability 2020, 12, 2995. [Google Scholar] [CrossRef] [Green Version]
- Autodesk Revit. Understanding Revit 2020. Available online: https://help.autodesk.com/view/RVT/2019/ENU/ (accessed on 15 July 2020).
- Khan, M.S.; Adil, M.; Khalil, F.; Jamil, I. BIM Based Energy Simulation for Assessment of Buildings: Energy Wastage for Pakistan. In Proceedings of the 4th Conference on Sustainability in Process Industry (SPI-2018), Peshawar, Pakistan, 24–25 October 2018; pp. 44–49. [Google Scholar]
- Khan, M.S.; Adil, M.; Khan, A. Assessment of structural design capability of building information modeling (BIM) tools in building industry of Pakistan. J. Mech. Contin. Math. Sci. 2019, 14, 385–401. [Google Scholar] [CrossRef]
- Khan, M.S.; Khan, A.; Adil, M.; Khalil, F. Role of Building Information Modeling (BIM) in Building Design Industry. In Proceedings of the INUMDC 2018: “Iqra National University Multi-Disciplinary conference”, Peshawar, Pakistan, 7–8 November 2018; pp. 119–123. [Google Scholar]
- DesignBuilder. DesignBuilder Revit—gbXML Tutorial 2018. Available online: http://www.batisim.net/telechargement/documentation-logiciel/444-designbuilder-revit-gbxml-tutorial-v2/file.html (accessed on 5 March 2021).
- Kamel, E.; Memari, A.M. Review of BIM’s application in energy simulation: Tools, issues, and solutions. Autom. Constr. 2019, 97, 164–180. [Google Scholar] [CrossRef]
- DesignBuilder. Software DesignBuilder Simulation + CFD Training Guide. 2008. Available online: http://www.designbuilder.co.uk/downloadsv1/doc/DesignBuilder-Simulation-Training-Manual.pdf (accessed on 5 March 2021).
- National Energy Conservation Centre (ENERCON); Pakistan Engineering Council (PEC); Ministry of Housing and Works. Building Code of Pakistan Energy Provisions (2011). Available online: https://www.iea.org/policies/2539-building-code-of-pakistan-energy-provisions-2011 (accessed on 18 February 2021).
- Trachte, S.; de Herde, A. Sustainable refurbishment—School buildings. In Proceedings of the IEA Solar Heating and Cooling Programme, Istanbul, Turkey, 2–4 December 2015. [Google Scholar]
- American Society of Heating, Refrigerating and Air-Conditioning Engineers (ASHRAE). Measurement of Energy, Demand, and Water Savings; ASHRAE Guideline 14-2014; ASHRAE: Peachtree Corners, GA, USA, 2014; Available online: https://upgreengrade.ir/admin_panel/assets/images/books/ASHRAE%20Guideline%2014-2014.pdf (accessed on 5 March 2021).
- Garwood, T.L.; Hughes, B.R.; O’Connor, D.; Calautit, J.K.; Oates, M.R.; Hodgson, T. A framework for producing gbXML building geometry from Point Clouds for accurate and efficient Building Energy Modelling. Appl. Energy 2018, 224, 527–537. [Google Scholar] [CrossRef]
- Semahi, S.; Benbouras, M.; Mahar, W.; Zemmouri, N.; Attia, S. Development of Spatial Distribution Maps for Energy Demand and Thermal Comfort Estimation in Algeria. Sustainability 2020, 12, 6066. [Google Scholar] [CrossRef]
- Lotfabadi, P.; Hançer, P. A Comparative Study of Traditional and Contemporary Building Envelope Construction Techniques in terms of Thermal Comfort and Energy Efficiency in Hot and Humid Climates. Sustainability 2019, 11, 3582. [Google Scholar] [CrossRef] [Green Version]
- Bano, F.; Kamal, M.A. Examining the Role of Building Envelope for Energy Efficiency in Office Buildings in India. Archit. Res. 2016, 6, 107–115. [Google Scholar] [CrossRef]
- Mcilvaine, J.; Sutherland, K.; Martin, E. Energy Retrofit Field Study and Best Practices in a Hot-Humid Climate; U.S. Department of Energy: Oak Ridge, TN, USA, 2013. [Google Scholar]
- Boostani, H.; Hancer, P. A Model for External Walls Selection in Hot and Humid Climates. Sustainability 2018, 11, 100. [Google Scholar] [CrossRef] [Green Version]
- National Renewable Energy Laboratory. Energy Design Guidelines for High Performance Schools. 2002. Available online: https://www.nrel.gov/docs/fy02osti/29105.pdf (accessed on 18 February 2021).
- Baderia, N. The Role of Thermal Mass in Humid Subtropical Climate: Thermal Performance and EnergyDemand of CSET Building Ningbo. 2014. Available online: http://www.plea2014.in/wpcontent/uploads/2014/12/Paper_5E_2747_PR.pdf (accessed on 18 February 2021).
- Long, L.; Ye, H. The roles of thermal insulation and heat storage in the energy performance of the wall materials: A simulation study. Sci. Rep. 2016, 6, 24181. [Google Scholar] [CrossRef]
- Ren, J.; Liu, J.; Cao, X.; Hou, Y. Influencing factors and energy-saving control strategies for indoor fine particles in commercial office buildings in six Chinese cities. Energy Build. 2017, 149, 171–179. [Google Scholar] [CrossRef]
- Shaeri, J.; Habibi, A.; Yaghoubi, M.; Chokhachian, A. The Optimum Window-to-Wall Ratio in Office Buildings for Hot‒Humid, Hot‒Dry, and Cold Climates in Iran. Environments 2019, 6, 45. [Google Scholar] [CrossRef] [Green Version]
- Lee, J.; Jung, H.; Park, J.; Yoon, Y. Optimization of building window system in Asian regions by analyzing solar heat gain and daylighting elements. Renew. Energy 2013, 50, 522–531. [Google Scholar] [CrossRef]
- Gut, P.; Ackerknecht, D. Climate Responsive Building: Appropriate Building Construction in Tropical and Subtropical Regions; SKAT Publications: St. Gallen, Switzerland, 1993. [Google Scholar]
- Nicol, J.F.; Raja, I.A.; Allaudin, A.; Jamy, G.N. Climatic variations in comfortable temperatures: The Pakistan projects. Energy Build. 1999, 30, 261–279. [Google Scholar] [CrossRef]
- Chen, Y.; Mae, M.; Taniguchi, K.; Kojima, T.; Mori, H.; Trihamdani, A.R.; Morita, K.; Sasajima, Y. Performance of passive design strategies in hot and humid regions. Case study: Tangerang, Indonesia. J. Asian Arch. Build. Eng. 2020, 1–19. [Google Scholar] [CrossRef]
- Passivhaus Institut. The Passivhaus Estandar in European Warm Climates: Design Guidelines for Comfrotable Low Energy Homes: Part Comfort, Climate and Passive Strategies. 2007. Available online: http://www.eerg.it/passive-on.org/CD/Tech-nicalGuidelines/Part3/Part3.pdf (accessed on 8 March 2021).
- Amecke, H.; Deason, J. Buildings Energy Efficiency in China, Germany and the United States: Climate Policy Initiative; CPI Report; Climate Policy Initiative (CPI): San Francisco, CA, USA, 2013. [Google Scholar]
- Szokolay, S.V. Dilemmas of warm-humid climate house design: Heavy vs. lightweight + cooling effect of air movement. In Proceedings of the Passive and Low Energy Architecture conference, Cambridge, UK, 2–5 July 2000. [Google Scholar]
- Soebarto, V.I. A ‘New’ Approach to Passive Design for Residential Buildings in a Tropical Climate. In Proceedings of the PLEA ‘99 “Sustaining the Future—Energy, Ecology, Architecture”, Brisbane, Australia, 22–24 September 1999. [Google Scholar]


| Factors | ACBs 2 and 3 | Selected Base Case ACB |
|---|---|---|
| HVAC systems | No | No |
| Thermal insulation of the building envelope | No | No |
| Number of occupants per batch | 50 | 50 |
| Availability of architectural plans | Unavailable in one ACB | Available |
| Being representative in terms of location | Main city districts | Main city districts |
| Educational level | Minimum undergraduate | Minimum undergraduate |
| The willingness of the campus administration to cooperate | One was unwilling to cooperate | Willing |
| Geometry | Varying | Varying |
| Use | Educational purpose | Educational purpose |
| Index | Value |
|---|---|
| Land plot area | 1836.9 m2 |
| Gross building area | 1166.88 m2 |
| Building form | Courtyard |
| Clusters | 3 |
| Number of floors | 2 and 4 |
| Floor-to-floor height | 3.2 m |
| Floor-to-ceiling height | 3 m |
| Measure Category | Input Measures | Values/Parameters | |
|---|---|---|---|
| Description | Building envelope | WWR (%) | North façade = 27, south façade = 5.5, east and west façades = 14 |
| Windows (W/m2 K) | U-value = 5.7 | ||
| Shading coefficient of glass (SC) | 0.7 | ||
| Solar heat gain coefficient (SHGC) | 0.81 | ||
| Light transmission (LT) | 0.88 | ||
| Awnings (overhangs) (m) projection above the windows on the north, east, and west façades | 0.3 | ||
| Eaves (m) over the roof of the west façade | 0.6 | ||
| Wall (W/m2 K) | U-value = 2.7 | ||
| Roof (W/m2 K) | U-value = 2.5 | ||
| Floor (W/m2 K) | U-value = 1.11 | ||
| Door (W/m2 K) | U-value = 2.5 | ||
| Airtightness (ACH) | 2.5 | ||
| Temperature and humidity | Mean outdoor temperature (°C) during summer | 30.7 | |
| Relative humidity (%) | 59.7 | ||
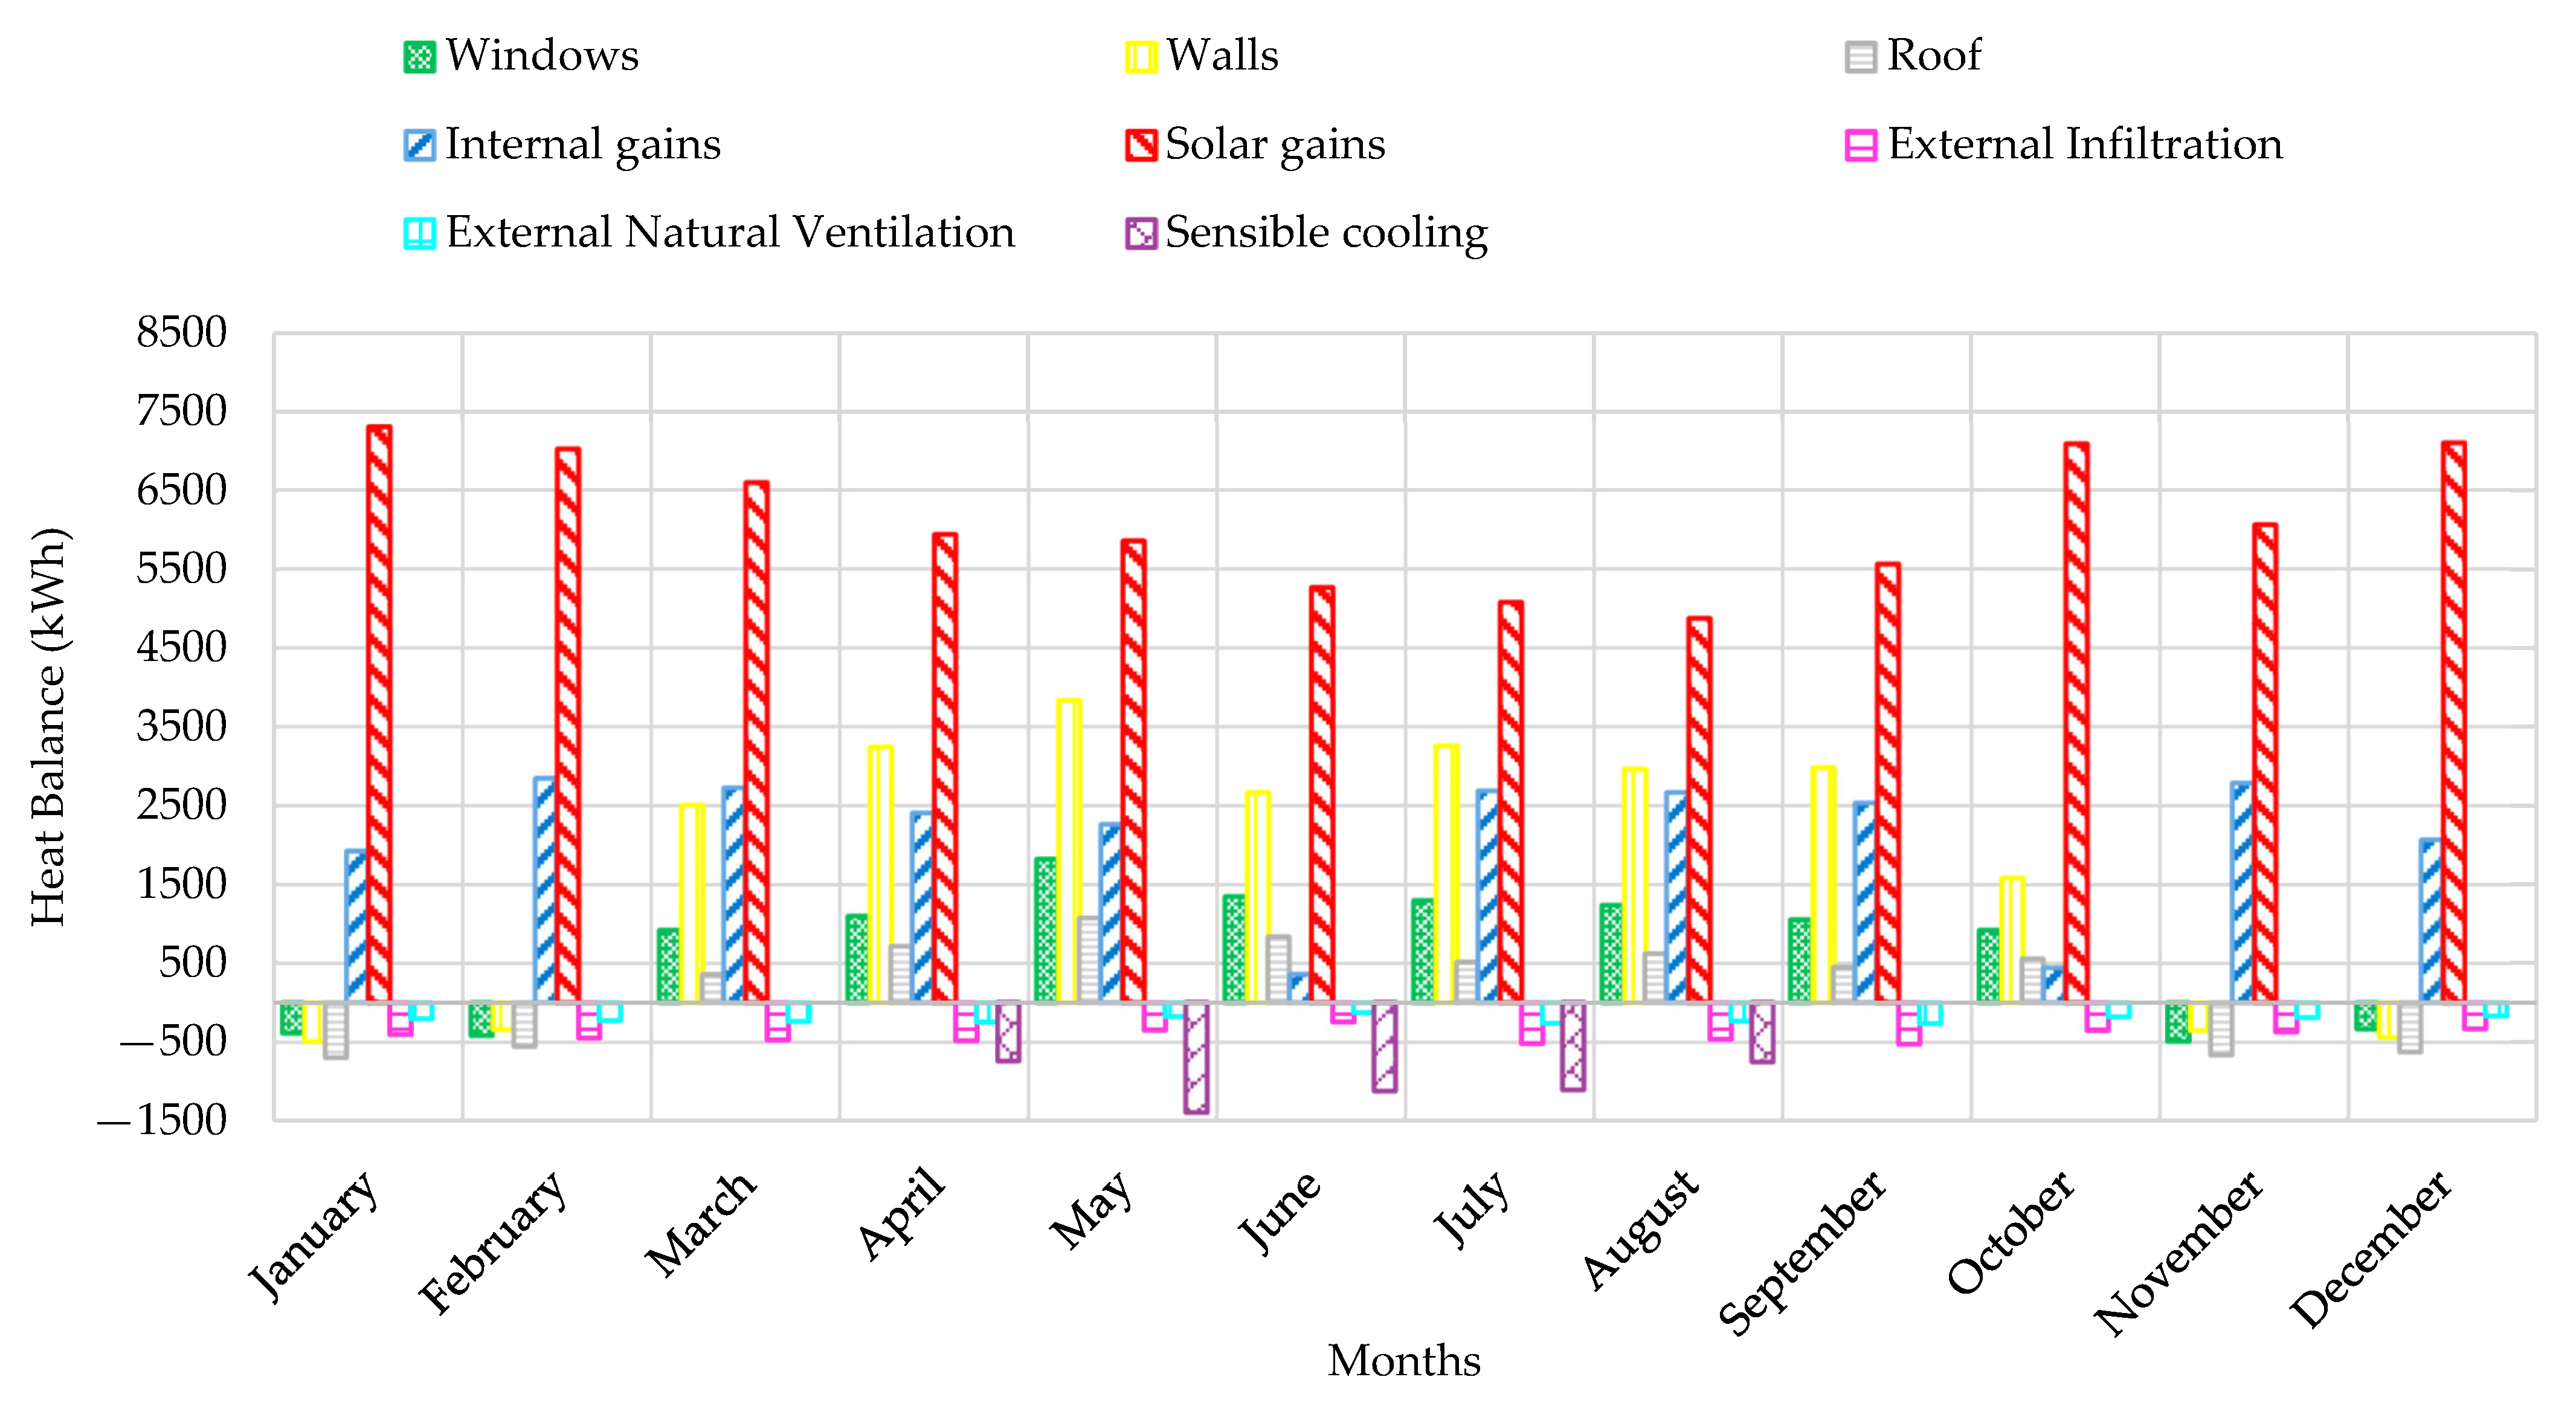
| Comparison of mean outdoor (°C) and indoor temperatures (°C) during summer | Figure 11 | ||
| Land plot area and building description | Land plot area of the building (m2) | 1836.9 | |
| SA/V ratio (m−1) | 0.46 | ||
| Building drawings | Figure 3 and Figure A11 | ||
| Occupancy and density | Density (persons/usable building area in m2) | 0.29 | |
| Total occupancy (people) | 350 | ||
| Simulated monthly electricity demand (kWh) | January | 1331.1 | |
| February | 2073.17 | ||
| March | 2176.84 | ||
| April | 2073.17 | ||
| May | 2111.01 | ||
| June | 337.29 | ||
| July | 2384.15 | ||
| August | 2280.49 | ||
| September | 2176.84 | ||
| October | 390.54 | ||
| November | 2176.84 | ||
| December | 1464.04 | ||
| Simulated annual electricity demand | 20,975.48 | ||
| Breakdown of monthly electricity demand | Figure A8 | ||
| Clothing and activity | Summer (clo) | 0.40 | |
| Winter (clo) | 0.66 | ||
| Metabolic rate (met) | 1.0 | ||
| Zone | Lecture halls | Occupancy (people) | 50 |
| Type of system (cooled, natural ventilation) | Natural ventilation. Fans used for air movement. | ||
| Weekday occupancy schedule | Figure A1 | ||
| Airflow rate (m3/s) | North cluster = 0.46 East cluster = 0.40 West cluster = 0.58 | ||
| Mean indoor temperature (°C) during summer | North cluster = 34.48 East cluster = 33.2 West cluster = 32.2 | ||
| Temperature thresholds for windows (°C) | Opening threshold = 23 Closing threshold = 18 | ||
| LPD (W/m2) | 10 | ||
| EPD (W/m2) | 15 | ||
| Naturally ventilated offices | Occupancy (people) | 02 | |
| Type of system (cooled, natural ventilation) | Natural ventilation. Fans used for air movement. | ||
| Weekday occupancy schedule | Figure A2 | ||
| Airflow rate (m3/s) | East cluster = 0.40 | ||
| Mean indoor temperature (°C) during summer | East cluster = 33.2 | ||
| Temperature thresholds for windows (°C) | Opening threshold = 23 Closing threshold = 18 | ||
| LPD (W/m2) | 10 | ||
| EPD (W/m2) | 10 | ||
| Conditioned offices | Occupancy (people) | 02 | |
| Type of system (cooled, natural ventilation) |
| ||
| Energy efficiency ratio (EER) of the cooling system | 2.7 | ||
| Cooling temperature setpoint (°C) | 25 | ||
| Weekday occupancy schedule | Figure A3 | ||
| Airflow rate (m3/s) | West cluster = 0.58 | ||
| Mean indoor temperature (°C) during summer without AC turned on | West cluster = 32.2 | ||
| LPD (W/m2) | 15 | ||
| EPD (W/m2) | 15 | ||
| Computer lab | Occupancy (people) | 40 | |
| Type of system (cooled, natural ventilation) |
| ||
| Energy efficiency ratio (EER) of the cooling system | 2.7 | ||
| Cooling temperature setpoint (°C) | 25 | ||
| Weekday occupancy schedule | Figure A4 | ||
| Airflow rate (m3/s) | North cluster = 0.46 | ||
| Mean indoor temperature (°C) during summer without AC turned on | North cluster = 34.48 | ||
| LPD (W/m2) | 20 | ||
| EPD (W/m2) | 25 | ||
| Common room and canteen | Occupancy (people) | 15 | |
| Type of system (cooled, natural ventilation) | Natural ventilation. Fans used for air movement. | ||
| Weekday occupancy schedule | Figure A5 | ||
| Airflow rate (m3/s) | East cluster = 0.40 | ||
| Mean indoor temperature (°C) during summer | East cluster = 33.2 | ||
| Temperature thresholds for windows (°C) | Opening threshold = 23 Closing threshold = 18 | ||
| LPD (W/m2) | 10 | ||
| EPD (W/m2) | 10 | ||
| Laboratories | Occupancy (people) | 25 | |
| Type of system (cooled, natural ventilation) | Natural ventilation. Fans used for air movement. | ||
| Weekday occupancy schedule | Figure A6 | ||
| Airflow rate (m3/s) | North cluster = 0.46 East cluster = 0.40 West cluster = 0.58 | ||
| Mean indoor temperature (°C) during summers | North cluster = 34.48 East cluster = 33.2 West cluster = 32.2 | ||
| Temperature thresholds for windows (°C) | Opening threshold = 23 Closing threshold = 18 | ||
| LPD (W/m2) | 10 | ||
| EPD (W/m2) | 10 | ||
| Toilets | Occupancy (people) | 04 | |
| Type of system (cooled, natural Ventilation) | Natural ventilation. | ||
| Weekday occupancy schedule | Figure A7 |
| Building Elements | Conductivity (W/m K) | Specific Heat Capacity (J/kg K) | Density (kg/m3) | Thickness (cm) | |
|---|---|---|---|---|---|
| Exterior Walls (3 Layers) | |||||
| Outermost | Plaster | 0.431 | 1088 | 1250 | 0.95 |
| Concrete block, medium weight | 1.3 | 840 | 1800 | 20 | |
| Innermost | Plaster | 0.431 | 1088 | 1250 | 0.95 |
| U-value | 2.7 W/m2 K | ||||
| Ground Floor (5 Layers) | |||||
| Outermost | Ceramic tiles | 0.39 | 656 | 1900 | 0.95 |
| PCC | 0.753 | 656 | 2000 | 5 | |
| Aggregate | 1.8 | 840 | 2240 | 7 | |
| Sand | 1.74 | 840 | 2240 | 10 | |
| Innermost | Earth/soil | 0.837 | 1046 | 1300 | 22 |
| U-value | 1.117 W/m2 K | ||||
| Intermediate floors (4 Layers) | |||||
| Outermost | Ceramic tiles | 0.39 | 656 | 1900 | 0.95 |
| PCC | 0.753 | 656 | 2000 | 5 | |
| RCC slab | 0.753 | 656.9 | 2300 | 10 | |
| Plaster | 0.38 | 840 | 1150 | 0.95 | |
| U-value | 1.46 W/m2 K | ||||
| Roof (3 Layers) | |||||
| Outermost | Plaster | 0.38 | 840 | 1150 | 0.95 |
| RCC slab | 0.753 | 656.9 | 2300 | 10 | |
| Innermost | Plaster | 0.38 | 840 | 1150 | 0.95 |
| U-value | 2.58 W/m2 K | ||||
| Single Clear 6 mm Glass Window with Aluminum Frame | |||||
| Single clear 6 mm glass | U-value | 5.7 W/m2 K | |||
| Aluminum frame | U-value | 5.88 W/m2 K | |||
| Overhangs | 30 cm | ||||
| Door (3 Layers) | |||||
| Outermost | Plywood | 0.14 | 1400 | 530 | 0.31 |
| Air gap | 5.56 | 1004 | 1.3 | 4.6 | |
| Innermost | Plywood | 0.14 | 1400 | 530 | 0.31 |
| U-value | 2.5 W/m2 K | ||||
| Cases | Conductivity (W/m K) | Specific Heat Capacity (J/kg K) | Density (kg/m3) | Thickness (cm) | |
|---|---|---|---|---|---|
| Case-W1 | |||||
| Outermost | Plaster | 0.431 | 1088 | 1250 | 0.95 |
| Concrete block aerated | 0.24 | 1000 | 750 | 20 | |
| Innermost | Plaster | 0.431 | 1088 | 1250 | 0.95 |
| U-value | 0.943 W/m2 K | ||||
| Case-W2 | |||||
| Outermost | Plaster | 0.431 | 1088 | 1250 | 0.95 |
| Loose-fill cellulose insulation | 0.04 | 1380 | 43 | 10 | |
| Concrete block, medium weight | 1.3 | 840 | 1800 | 20 | |
| Innermost | Plaster | 0.431 | 1088 | 1250 | 0.95 |
| U-value | 0.344 W/m2 K | ||||
| Case-W3 | |||||
| Outermost | Plaster | 0.431 | 1088 | 1250 | 0.95 |
| EPS (standard) | 0.04 | 1500 | 15 | 5 | |
| Concrete block, medium weight | 1.3 | 840 | 1800 | 20 | |
| Innermost | Plaster | 0.431 | 1088 | 1250 | 0.95 |
| U-value | 0.619 W/m2 K | ||||
| Case-W4 | |||||
| Outermost | Plaster | 0.431 | 1088 | 1250 | 0.95 |
| Glass mineral wool | 0.04 | 830 | 15 | 10 | |
| Concrete block, medium weight | 1.3 | 840 | 1800 | 20 | |
| Innermost | Plaster | 0.431 | 1088 | 1250 | 0.95 |
| U-value | 0.349 W/m2 K | ||||
| Case-W5 | |||||
| Outermost | Plaster | 0.431 | 1088 | 1250 | 0.95 |
| Rock mineral wool | 0.038 | 840 | 140 | 10 | |
| Concrete block, medium weight | 1.3 | 840 | 1800 | 20 | |
| Innermost | Plaster | 0.431 | 1088 | 1250 | 0.95 |
| U-value | 0.334 W/m2 K | ||||
| Case-W6 | |||||
| Outermost | Plaster | 0.431 | 1088 | 1250 | 0.95 |
| EPS (lightweight) | 0.046 | 1400 | 10 | 10 | |
| Concrete block, medium weight | 1.3 | 840 | 1800 | 20 | |
| Innermost | Plaster | 0.431 | 1088 | 1250 | 0.95 |
| U-value | 0.388 W/m2 K | ||||
| Case-W7 | |||||
| Outermost | Plaster | 0.431 | 1088 | 1250 | 0.95 |
| EPS (standard) | 0.04 | 1500 | 15 | 10 | |
| Concrete block, medium weight | 1.3 | 840 | 1800 | 20 | |
| Innermost | Plaster | 0.431 | 1088 | 1250 | 0.95 |
| U-value | 0.320 W/m2 K | ||||
| Case-W8 | |||||
| Outermost | Plaster | 0.431 | 1088 | 1250 | 0.95 |
| EPS (standard) | 0.04 | 1500 | 15 | 7.5 | |
| Concrete block, medium weight | 1.3 | 840 | 1800 | 20 | |
| Innermost | Plaster | 0.431 | 1088 | 1250 | 0.95 |
| U-value | 0.446 W/m2 K | ||||
| Cases | Insulation | Cost of Insulation in USD | Energy Demand (kWh) | Reduction in Energy Demand (%) |
|---|---|---|---|---|
| Base case | No | - | 20,975.48 | 0 |
| W1 | No | - | 20,975.48 | 0 |
| W2 | Loose-fill cellulose insulation | 34.54 per kg | 18,667.75 | 11.1 |
| W3 | 0.05 m EPS (standard) | 11–16 per m2 | 19,842.35 | 5.4 |
| W4 | Glass mineral wool | 1–3 per m2 | 19,234.08 | 8.3 |
| W5 | Rock mineral wool | 0.98–1.84 per m2 | 19,045.3 | 9.2 |
| W6 | EPS (light weight) | 11–13 per m2 | 19,338.95 | 7.8 |
| W7 | 0.1 m EPS (standard) | 11–16 per m2 | 18,130.79 | 13.56 |
| W8 | 0.075 m EPS (standard) | 11–16 per m2 | 19,569.68 | 6.7 |
| Cases | Conductivity (W/m K) | Specific Heat Capacity (J/kg K) | Density (kg/m3) | Thickness (cm) | |
|---|---|---|---|---|---|
| Case-R1 | |||||
| Outermost | Screed | 0.4 | 840 | 1200 | 0.95 |
| Bitumen layer | 0.5 | 1000 | 1700 | 0.4 | |
| RCC slab | 0.753 | 656.9 | 2300 | 10 | |
| Innermost | Plaster | 0.38 | 840 | 1150 | 0.95 |
| U-value | 2.53 W/m2 K | ||||
| Case-R2 | |||||
| Outermost | Screed | 0.4 | 840 | 1200 | 0.95 |
| Waterproofing layer | 0.5 | 1800 | 980 | 0.05 | |
| EPS (lightweight) | 0.046 | 1400 | 10 | 10 | |
| RCC slab | 0.753 | 656.9 | 2300 | 10 | |
| Innermost | Plaster | 0.38 | 840 | 1150 | 0.95 |
| U-value | 0.341 W/m2 K | ||||
| Case-R3 | |||||
| Outermost | Screed | 0.4 | 840 | 1200 | 0.95 |
| Waterproofing layer | 0.5 | 1800 | 980 | 0.05 | |
| Polyurethane | 0.05 | 1470 | 70 | 10 | |
| RCC slab | 0.753 | 656.9 | 2300 | 10 | |
| Innermost | Plaster | 0.38 | 840 | 1150 | 0.95 |
| U-value | 0.434 W/m2 K | ||||
| Case-R4 | |||||
| Outermost | Screed | 0.4 | 840 | 1200 | 0.95 |
| Waterproofing layer | 0.5 | 1800 | 980 | 0.05 | |
| EPS (standard) | 0.04 | 1500 | 15 | 10 | |
| RCC slab | 0.753 | 656.9 | 2300 | 10 | |
| Innermost | Plaster | 0.38 | 840 | 1150 | 0.95 |
| U-value | 0.319 W/m2 K | ||||
| Case-R5 | |||||
| Outermost | Roof tiles | 0.84 | 800 | 1900 | 3.8 |
| PCC | 0.209 | 656 | 950 | 50 | |
| Waterproofing layer | 0.5 | 1800 | 980 | 0.05 | |
| EPS (standard) | 0.04 | 1500 | 15 | 10 | |
| RCC slab | 0.753 | 656.9 | 2300 | 10 | |
| Innermost | Plaster | 0.38 | 840 | 1150 | 0.95 |
| U-value | 0.214 W/m2 K | ||||
| Cases | Insulation | Cost of Insulation in USD per m2 | Energy Demand (kWh) | Reduction in Energy Demand (%) |
|---|---|---|---|---|
| Base case | No | - | 20,975.48 | 0 |
| R1 | Bitumen | 1.42–1.97 | 20,933.53 | 0.2 |
| R2 | EPS (lightweight) | 11–13 | 19,821.8 | 5.5 |
| R3 | Polyurethane | 2.99–5.6 | 19,968.66 | 4.8 |
| R4 | EPS (standard) | 11–16 | 19,486.22 | 7.1 |
| R5 | EPS (standard) | 11–16 | 19,129.6 | 8.8 |
| Cases | Specifications | |
|---|---|---|
| Case-WW1 | Double clear 3 mm glass /13 mm air window | |
| U-value = 2.7 W/m2 K | SHGC = 0.76 | LT = 0.81 |
| Case-WW2 | Triple clear 6 mm glass /25 mm air window | |
| U-value = 1.9 W/m2 K | SHGC = 0.60 | LT = 0.69 |
| Case-WW3 | Double tinted 6 mm glass /13 mm air window | |
| U-value = 2.6 W/m2 K | SHGC = 0.49 | LT = 0.50 |
| Case-WW4 | Double tinted 3 mm glass /13 mm air window | |
| U-value = 2.7 W/m2 K | SHGC = 0.62 | LT = 0.61 |
| Case-WW5 | Triple clear 3 mm glass /13 mm air window | |
| U-value = 1.75 W/m2 K | SHGC = 0.68 | LT = 0.73 |
| Case-WW6 | Double LoE clear 6 mm glass/13 mm argon | |
| U-value = 1.49 W/m2 K | SHGC = 0.56 | LT = 0.74 |
| Case-O1 | 40 cm overhang | |
| Case-O2 | 50 cm overhang | |
| Case-O3 | 60 cm overhang | |
| Case-O4 | 100 cm overhang | |
| Cases | Energy Demand (kWh) | Reduction in Energy Demand (%) |
|---|---|---|
| Base case | 20,975.48 | 0 |
| WW1 | 20,073.5 | 4.3 |
| WW2 | 19,423.2 | 7.4 |
| WW3 | 19,779.8 | 5.7 |
| WW4 | 19,716.9 | 6 |
| WW5 | 19,675 | 6.2 |
| WW6 | 19,171.5 | 8.6 |
| O1 | 20,891.5 | 0.4 |
| O2 | 20,807.6 | 0.8 |
| O3 | 20,702.7 | 1.3 |
| O4 | 20,451 | 2.5 |
| Cases | Specifications |
|---|---|
| Case-D1 | 3.5 cm painted oak door |
| U-value | 2.82 W/m2 K |
| Case-D2 | 4.2 cm painted oak door |
| U-value | 2.557 W/m2 K |
| Cases | Energy Demand (kWh) | Reduction in Energy Demand (%) |
|---|---|---|
| Base case | 20,975.48 | 0 |
| D1 | 20,975.48 | 0 |
| D2 | 20,933.53 | 0.2 |
| Case | Combination of Modifications | Reduction of Energy Demand (%) | Indoor Temperature(°C) | Airtightness (ACH) | Airflow (m3/s) |
|---|---|---|---|---|---|
| Base case | 0 | 34.3 | 2.5 | N = 0.46, E = 0.40, W = 0.58 | |
| A | W7, R4, WW6, O2, D2 | 31.96 | 29.4 | 1.2 | N = 0.40, E = 0.35, W = 0.45 |
| B | W7, R5, WW6, O4, D2 | 31.96 | 29.5 | 1.3 | N = 0.42, E = 0.36, W = 0.49 |
| C | W8, R4, WW2, O2, D2 | 24.9 | 31 | 2 | N = 0.43, E = 0.37, W = 0.51 |
| D | W8, R5, WW2, O2, D2 | 23.2 | 31.5 | 1.5 | N = 0.44, E = 0.38, W = 0.53 |
Publisher’s Note: MDPI stays neutral with regard to jurisdictional claims in published maps and institutional affiliations. |
© 2021 by the authors. Licensee MDPI, Basel, Switzerland. This article is an open access article distributed under the terms and conditions of the Creative Commons Attribution (CC BY) license (https://creativecommons.org/licenses/by/4.0/).
Share and Cite
Bughio, M.; Khan, M.S.; Mahar, W.A.; Schuetze, T. Impact of Passive Energy Efficiency Measures on Cooling Energy Demand in an Architectural Campus Building in Karachi, Pakistan. Sustainability 2021, 13, 7251. https://doi.org/10.3390/su13137251
Bughio M, Khan MS, Mahar WA, Schuetze T. Impact of Passive Energy Efficiency Measures on Cooling Energy Demand in an Architectural Campus Building in Karachi, Pakistan. Sustainability. 2021; 13(13):7251. https://doi.org/10.3390/su13137251
Chicago/Turabian StyleBughio, Mushk, Muhammad Shoaib Khan, Waqas Ahmed Mahar, and Thorsten Schuetze. 2021. "Impact of Passive Energy Efficiency Measures on Cooling Energy Demand in an Architectural Campus Building in Karachi, Pakistan" Sustainability 13, no. 13: 7251. https://doi.org/10.3390/su13137251
APA StyleBughio, M., Khan, M. S., Mahar, W. A., & Schuetze, T. (2021). Impact of Passive Energy Efficiency Measures on Cooling Energy Demand in an Architectural Campus Building in Karachi, Pakistan. Sustainability, 13(13), 7251. https://doi.org/10.3390/su13137251