
Soy Expansion, Environment, and Human Development: An Analysis across Brazilian Municipalities


Abstract
:1. Introduction
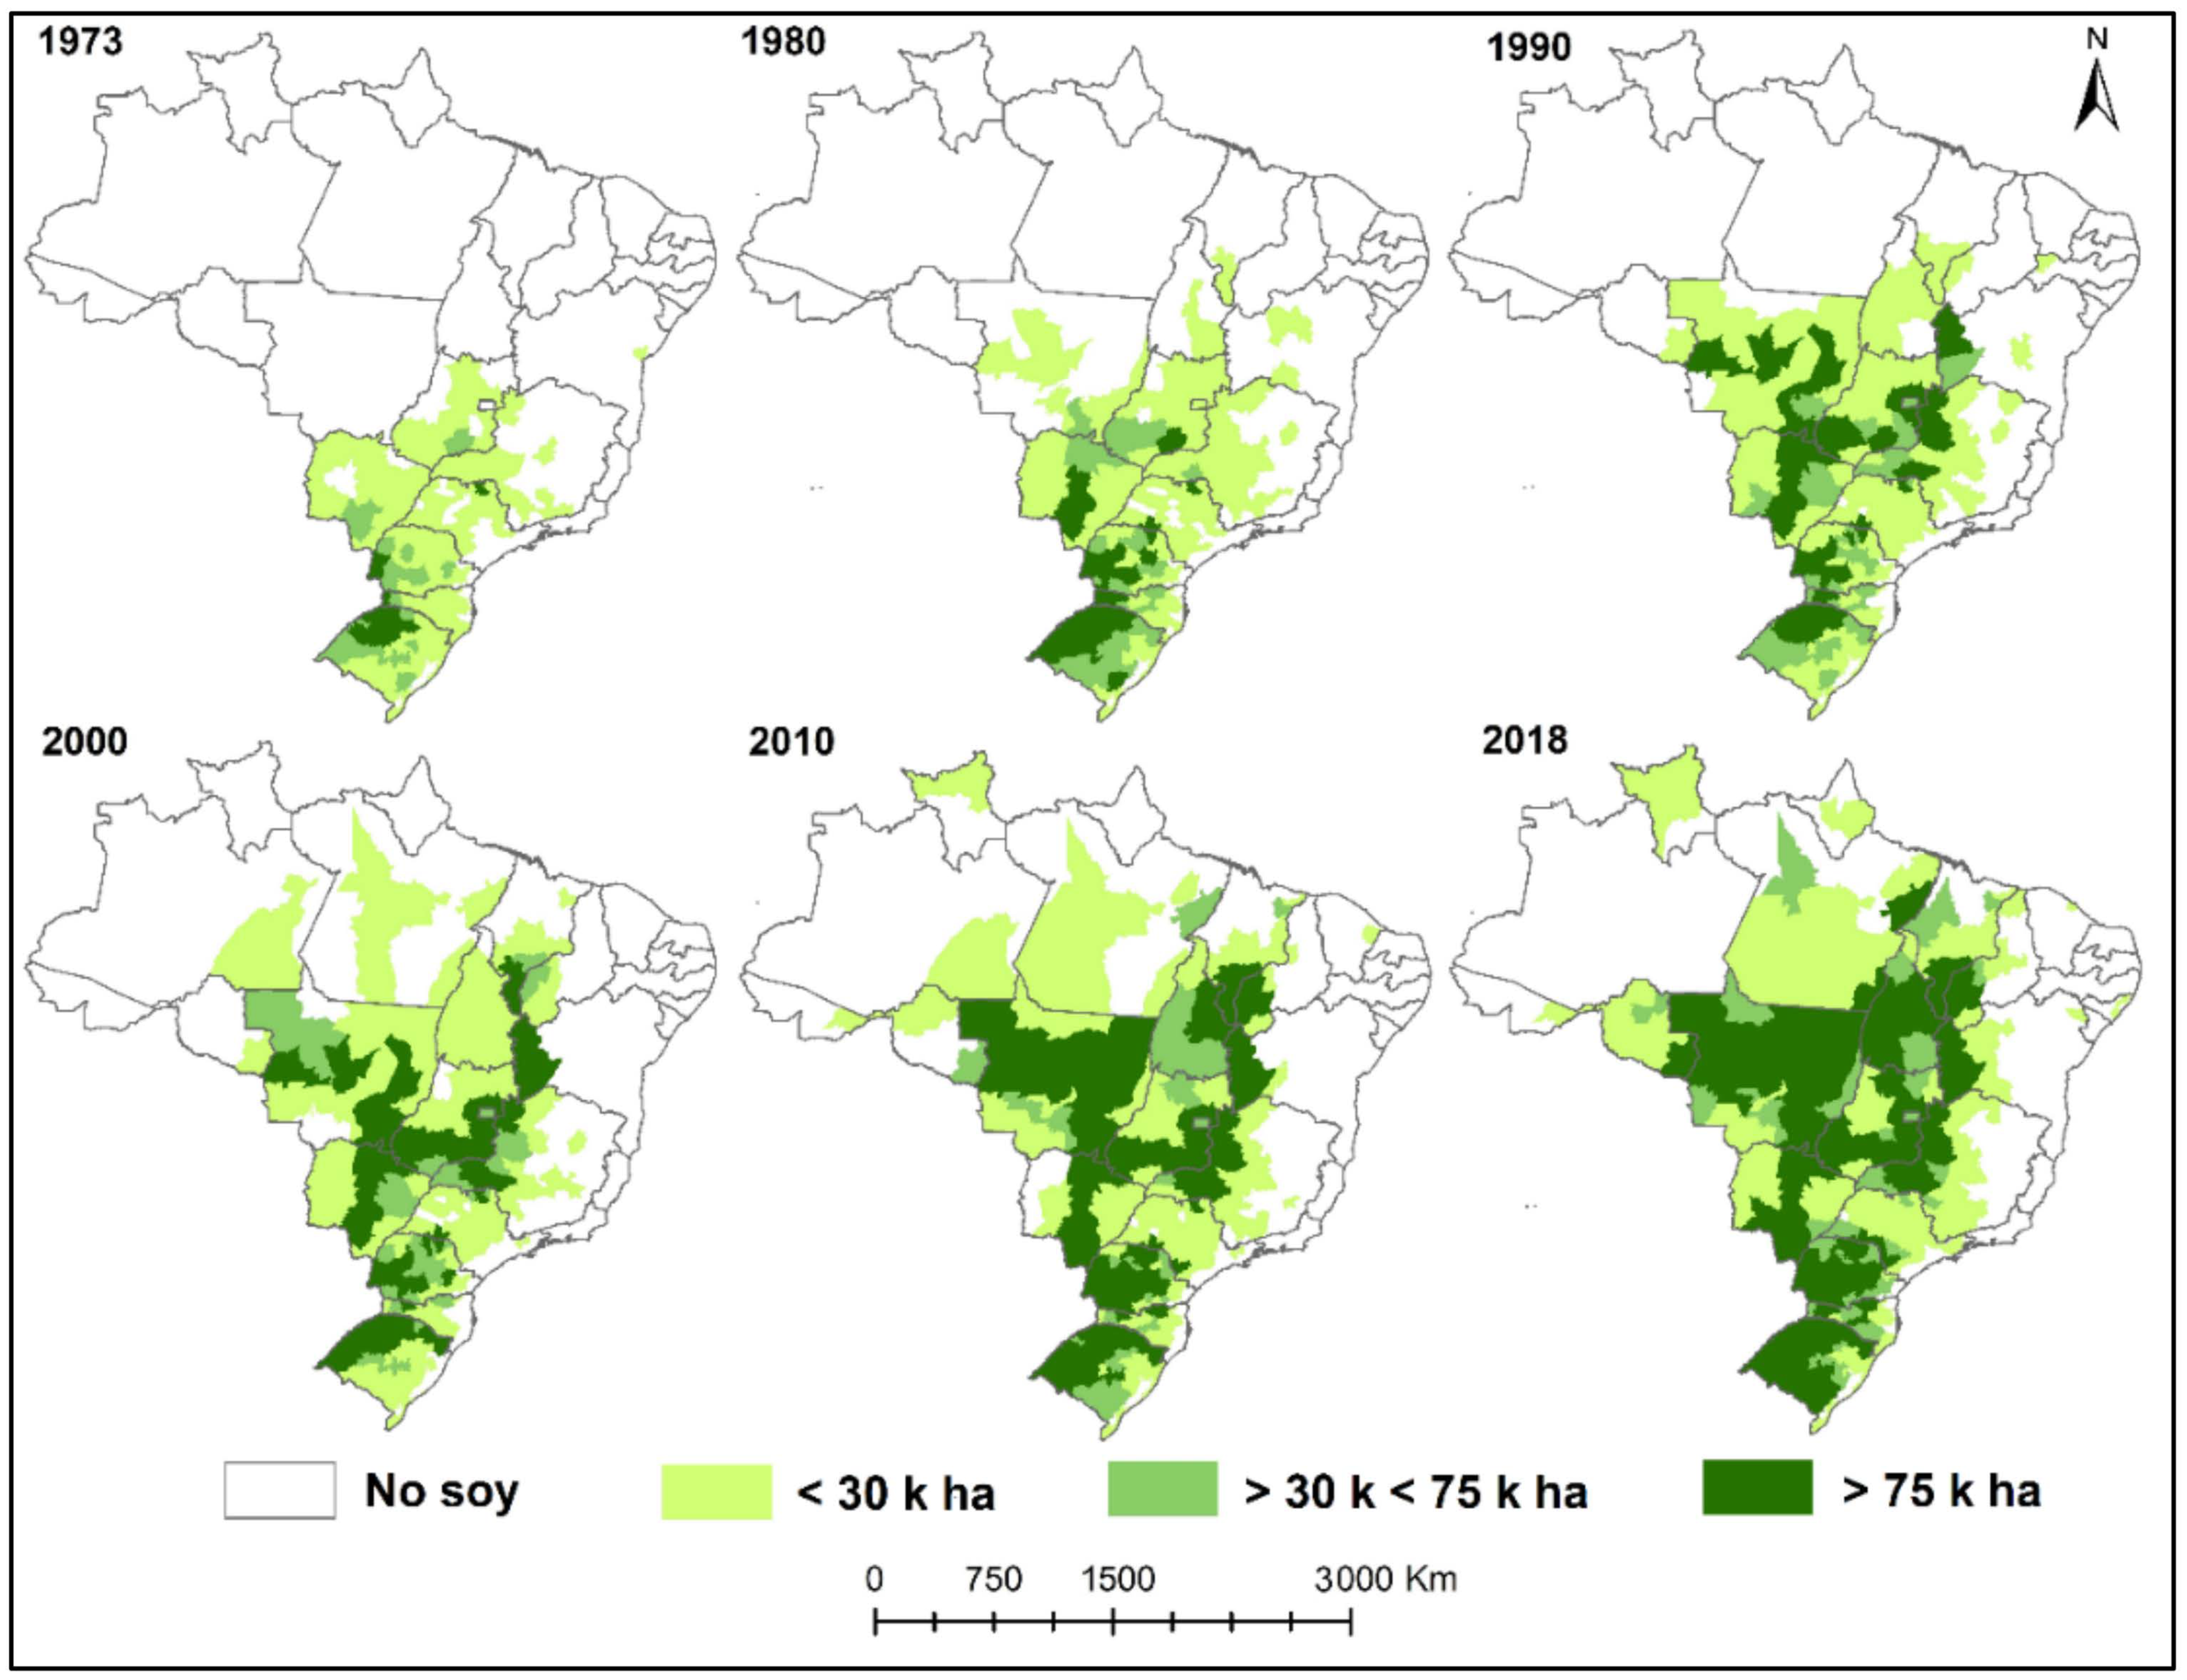
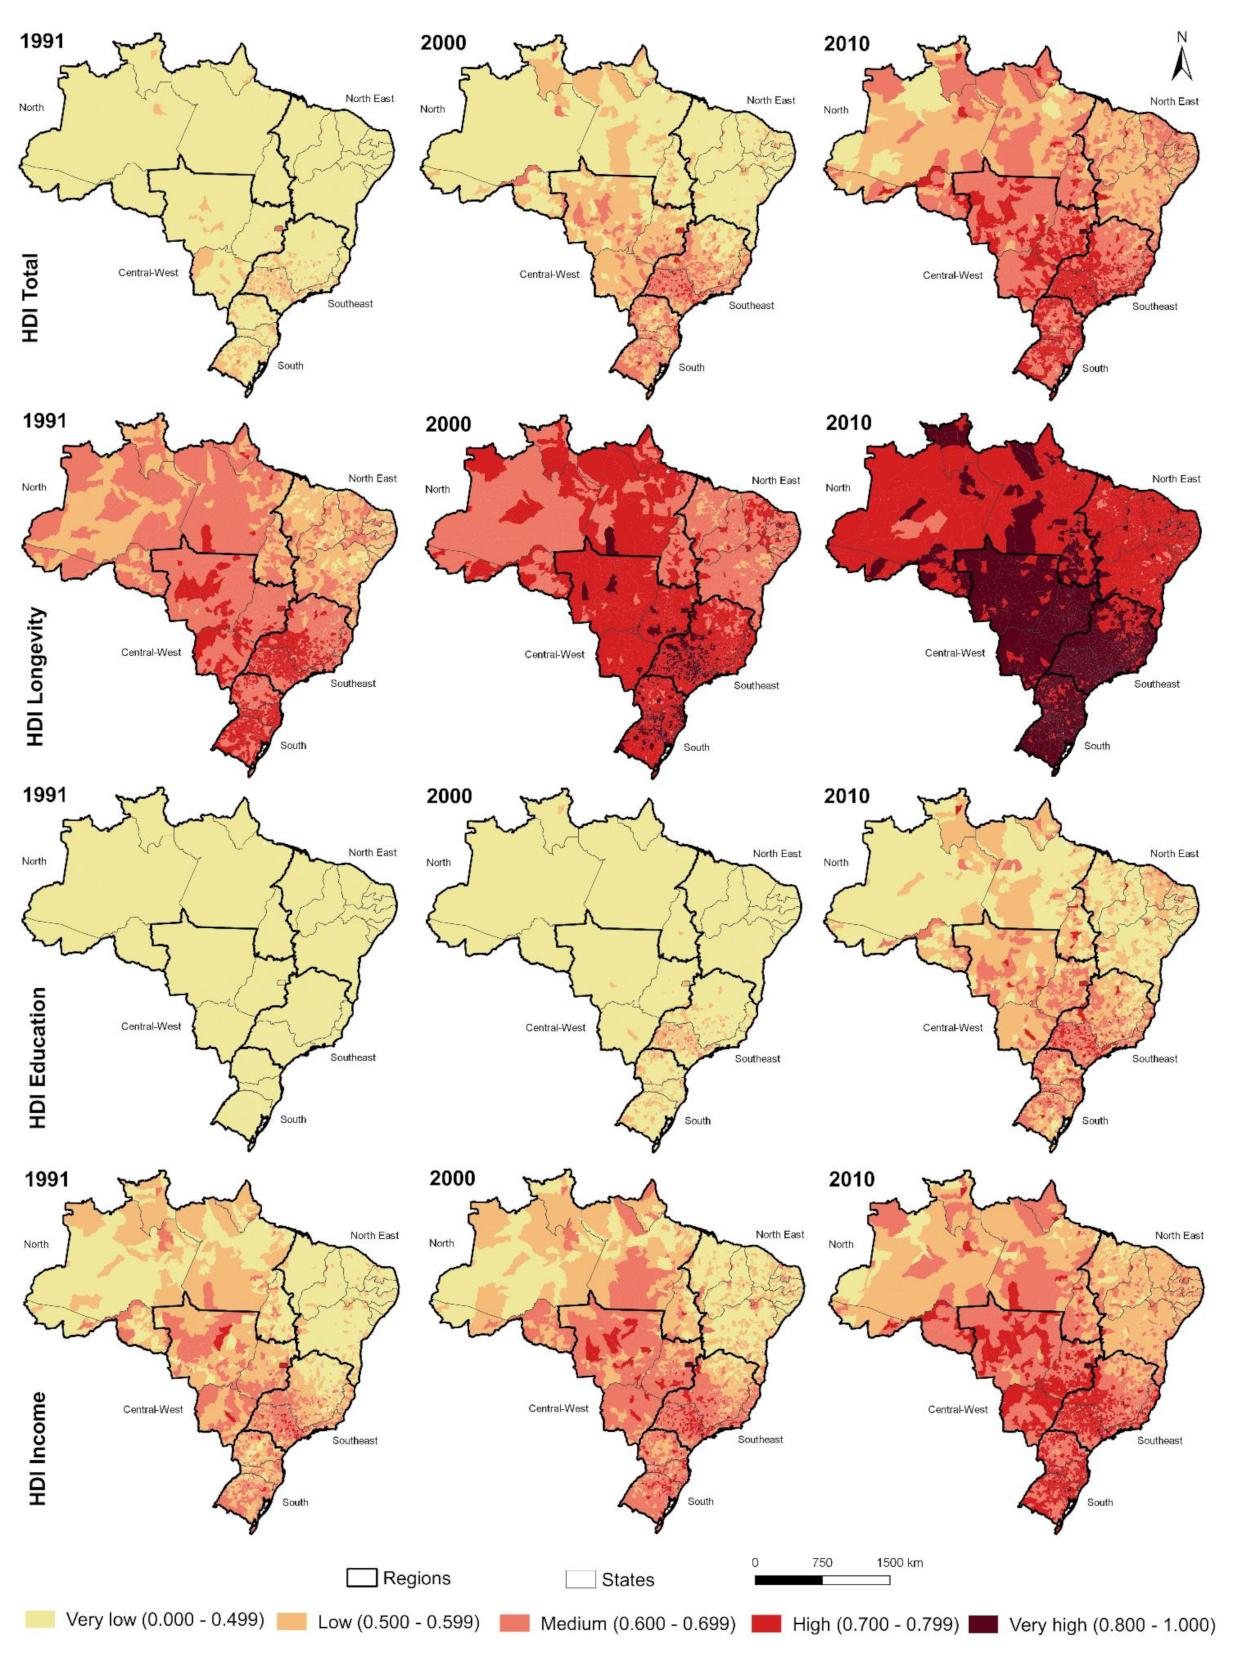
2. Soy Expansion and the HDI in Brazil
3. Data
- The HDI, its dimensions, and background socio-demographic and economic variables at municipality level in the census years 1991, 2000, and 2010, calculated by the UNDP [44];
- Soy-related variables (land area, volume of production, productivity, and economic value) at municipality level from 1974 to 2019 [27] (https://sidra.ibge.gov.br/tabela/1612 (accessed on 25 June 2021));
- Data on the use of pesticides, limestone, and other correctors of soil pH and on the prevalence of family farms at municipality level, according to the Agricultural Censuses 2006 and 2017 [27] (use of pesticides in 2006: https://sidra.ibge.gov.br/tabela/913 (accessed on 25 June 2021); use of pesticides in 2017: https://sidra.ibge.gov.br/tabela/6852 (accessed on 25 June 2021); application of limestone and other correctors of soil pH in 2006: https://sidra.ibge.gov.br/tabela/1245 (accessed on 25 June 2021); application of limestone and other correctors of soil pH in 2017: https://sidra.ibge.gov.br/tabela/6850 (accessed on 25 June 2021)).
4. Theoretical Model and Modelling Strategy
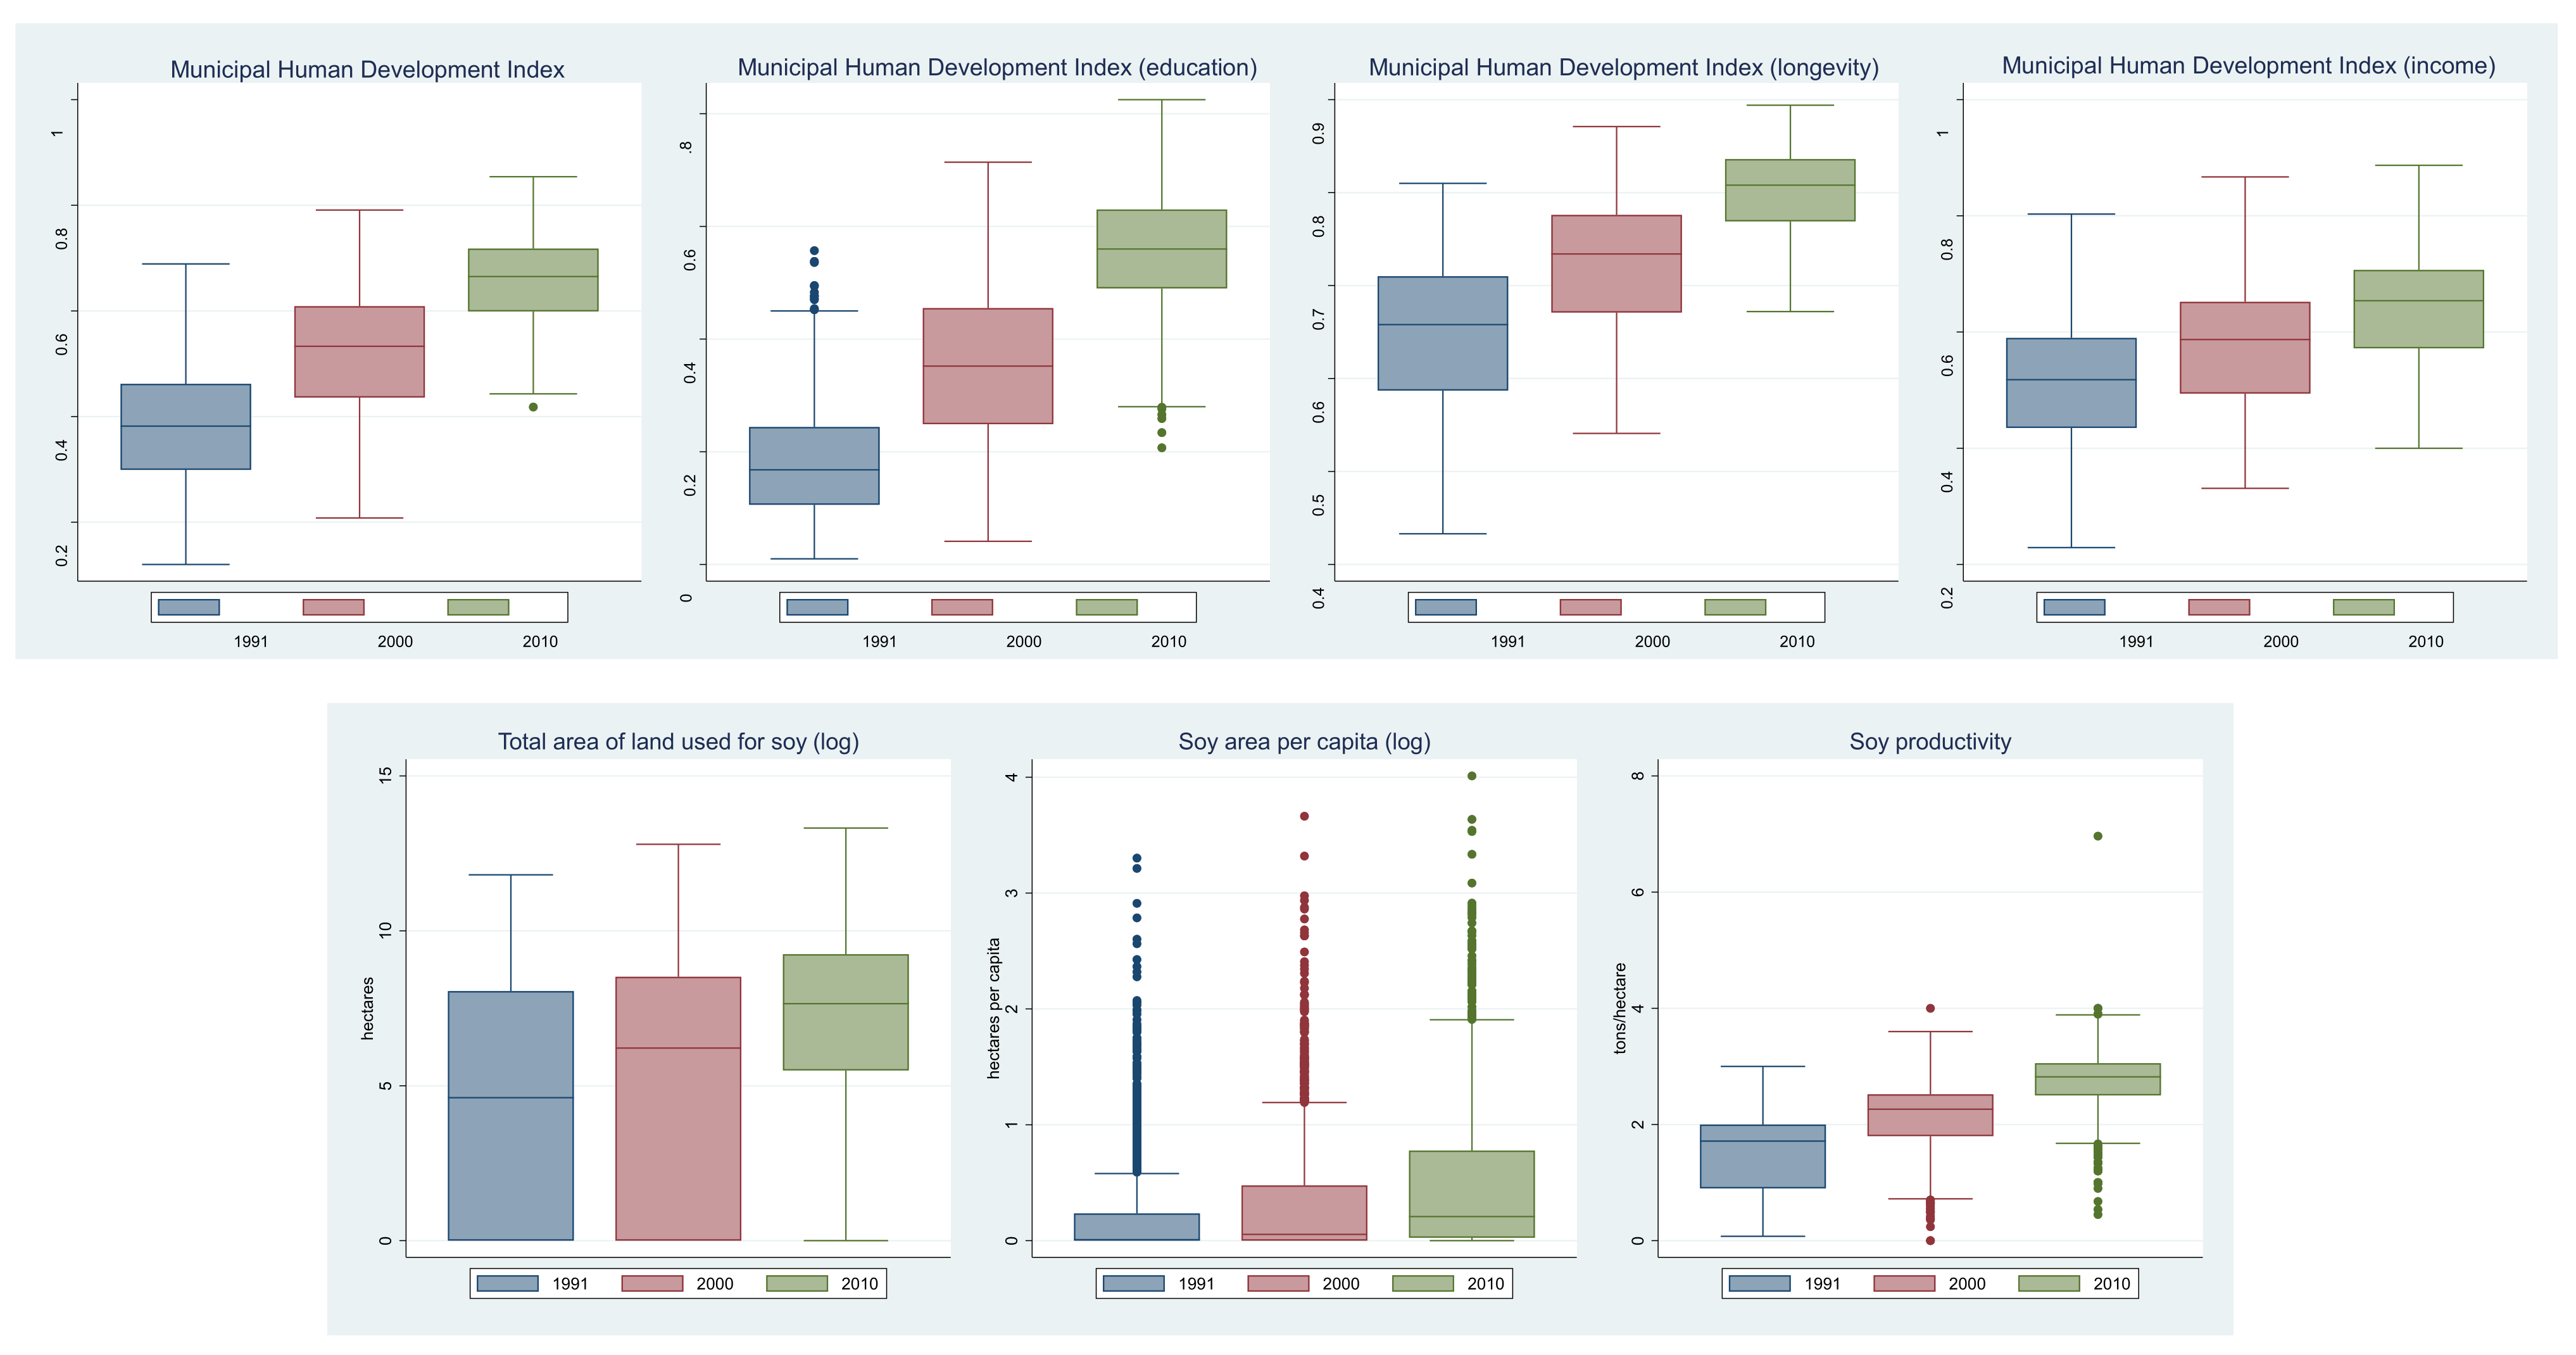
5. Results
6. Discussion
7. Conclusions
Author Contributions
Funding
Institutional Review Board Statement
Data Availability Statement
Conflicts of Interest
Appendix A

| Year | 1991 | 2000 (2007) | 2010 (2016) | |||||||||
|---|---|---|---|---|---|---|---|---|---|---|---|---|
| Variables | Mean | Std. dev. | Min. | Max. | Mean | Std. dev. | Min. | Max. | Mean | Std. dev. | Min. | Max. |
| Municipal Human Development Index and its change | ||||||||||||
| IDHM | 0.381 | 0.103 | 0.120 | 0.689 | 0.523 | 0.104 | 0.208 | 0.791 | 0.659 | 0.072 | 0.418 | 0.854 |
| IDHM_E | 0.179 | 0.092 | 0.010 | 0.557 | 0.354 | 0.127 | 0.041 | 0.714 | 0.559 | 0.093 | 0.207 | 0.825 |
| IDHM_L | 0.646 | 0.079 | 0.433 | 0.810 | 0.724 | 0.066 | 0.541 | 0.871 | 0.802 | 0.045 | 0.672 | 0.894 |
| IDHM_R | 0.514 | 0.097 | 0.229 | 0.803 | 0.576 | 0.094 | 0.331 | 0.867 | 0.643 | 0.081 | 0.400 | 0.887 |
| delta_IDHM | 0.142 | 0.035 | 0.025 | 0.327 | 0.136 | 0.041 | 0.030 | 0.326 | ||||
| delta_IDHM_E | 0.175 | 0.059 | 0.002 | 0.421 | 0.205 | 0.057 | 0.015 | 0.416 | ||||
| delta_IDHM_L | 0.078 | 0.029 | 0.008 | 0.147 | 0.078 | 0.033 | 0.002 | 0.145 | ||||
| delta_IDHM_R | 0.061 | 0.038 | −0.057 | 0.265 | 0.067 | 0.033 | −0.062 | 0.296 | ||||
| Soy-related variables and their change | ||||||||||||
| soy_area_pc_log | 0.081 | 0.278 | 0.000 | 3.302 | 0.116 | 0.341 | 0.000 | 3.663 | 0.176 | 0.437 | 0.000 | 4.011 |
| soy_productivity | 0.311 | 0.669 | 0.000 | 3.000 | 0.564 | 0.993 | 0.000 | 4.000 | 0.897 | 1.324 | 0.000 | 6.964 |
| soy_area_used_log | 1.924 | 3.436 | 0.000 | 12.794 | 2.519 | 3.834 | 0.000 | 13.318 | ||||
| delta_soy_area_pc | 1.538 | 3.162 | 0 | 11.808 | 0.054 | 0.392 | −5.100 | 6.164 | 0.130 | 0.440 | −2.820 | 7.362 |
| delta_soy_productivity | 0.253 | 0.754 | −3.000 | 3.600 | 0.332 | 0.868 | −3.000 | 6.964 | ||||
| delta_soy_area_used | 5.032 | 35.399 | −284.076 | 514.783 | 13.627 | 42.866 | −348.547 | 497.996 | ||||
| Geographical variables | ||||||||||||
| macro_region_2 | 0.323 | 0.468 | 0.000 | 1.000 | 0.323 | 0.468 | 0.000 | 1.000 | 0.323 | 0.468 | 0.000 | 1.000 |
| macro_region_3 | 0.299 | 0.458 | 0.000 | 1.000 | 0.299 | 0.458 | 0.000 | 1.000 | 0.299 | 0.458 | 0.000 | 1.000 |
| macro_region_4 | 0.214 | 0.410 | 0.000 | 1.000 | 0.214 | 0.410 | 0.000 | 1.000 | 0.214 | 0.410 | 0.000 | 1.000 |
| macro_region_5 | 0.084 | 0.277 | 0.000 | 1.000 | 0.084 | 0.277 | 0.000 | 1.000 | 0.084 | 0.277 | 0.000 | 1.000 |
| persons_tot_log | 9.248 | 1.075 | 6.321 | 16.083 | 9.337 | 1.114 | 6.680 | 16.161 | 9.413 | 1.148 | 6.692 | 16.236 |
| rural_pop | 0.516 | 0.268 | 0.000 | 1.000 | 0.416 | 0.236 | 0.000 | 1.000 | 0.362 | 0.220 | 0.000 | 0.958 |
| Economic variables | ||||||||||||
| GINI | 0.526 | 0.072 | 0.270 | 0.920 | 0.547 | 0.069 | 0.300 | 0.870 | 0.494 | 0.066 | 0.280 | 0.800 |
| CPR | 28.079 | 10.779 | 0.670 | 82.540 | 24.687 | 9.851 | 1.360 | 76.680 | ||||
| EMP | 2.010 | 1.606 | 0.000 | 15.960 | 1.328 | 1.107 | 0.000 | 8.920 | ||||
| P_COM | 8.876 | 4.598 | 0.000 | 33.820 | 10.568 | 4.402 | 0.740 | 36.570 | ||||
| P_CONSTR | 5.779 | 3.242 | 0.000 | 31.780 | 6.489 | 2.995 | 0.140 | 26.300 | ||||
| P_EXTR | 0.552 | 1.801 | 0.000 | 31.630 | 0.559 | 1.677 | 0.000 | 28.190 | ||||
| P_SERV | 31.552 | 10.858 | 3.290 | 79.060 | 32.440 | 8.870 | 8.500 | 78.230 | ||||
| P_SIUP | 0.362 | 0.507 | 0.000 | 11.680 | 0.754 | 0.661 | 0.000 | 12.950 | ||||
| P_TRANSF | 9.372 | 8.540 | 0.000 | 69.170 | 9.613 | 8.923 | 0.000 | 65.110 | ||||
| Environmental and social variables and their change (2006–2017) | ||||||||||||
| area_applied_log 1,2 | 7.905 | 2.704 | 0.000 | 13.365 | 8.291 | 2.640 | 0.000 | 13.753 | ||||
| delta_area_applied 3 | 9300.58 | 33,879.26 | −56,782.00 | 532,015.10 | ||||||||
| share_area_applied 1,2 | 0.305 | 0.269 | 0.000 | 1.000 | 0.330 | 0.266 | 0.000 | 1.000 | ||||
| delta_share_area_applied 3 | 0.025 | 0.172 | −1.000 | 1.000 | ||||||||
| share_applied 1,2 | 0.214 | 0.227 | 0.000 | 1.000 | 0.192 | 0.182 | 0.000 | 1.000 | ||||
| delta_share_applied 3 | −0.022 | 0.135 | −1.000 | 1.000 | ||||||||
| area_agrochem_log 1,2 | 7.251 | 2.005 | 0.000 | 12.395 | 7.244 | 2.160 | 0.000 | 12.422 | ||||
| delta_area_agrochem 3 | 990.46 | 5054.96 | −49,456.75 | 68,179.00 | ||||||||
| share_area_agrochem 1,4 | 0.470 | 0.314 | 0.000 | 1.000 | 0.589 | 0.336 | 0.000 | 1.000 | ||||
| delta_share_area_agrochem 5 | 0.119 | 0.205 | −0.926 | 1.000 | ||||||||
| share_agrochem 1,2 | 0.300 | 0.260 | 0.000 | 1.000 | 0.360 | 0.273 | 0.000 | 1.000 | ||||
| delta_share_agrochem 3 | 0.059 | 0.143 | −0.762 | 1.000 | ||||||||
| share_area_family 4 | 0.474 | 0.279 | 0.000 | 1.000 | ||||||||
| share_family 2 | 0.726 | 0.143 | 0.000 | 1.000 | ||||||||
References
- Russo Lopes, G.; Bastos Lima, M.G.; dos Reis, T.N.P. Maldevelopment revisited: Inclusiveness and social impacts of soy expansion over Brazil’s Cerrado in Matopiba. World Dev. 2021, 139, 105316. [Google Scholar] [CrossRef]
- Ocampo, J.A. Alternative Pathways to Sustainable Development: Lessons from Latin America; Carbonnier, G., Campodónico, H., Tezanos Vázquez, S., Eds.; Brill Nijhoff/Graduate Institute Publications: Leiden, The Netherlands; Boston, MA, USA, 2017; Chapter 4; p. 5. [Google Scholar]
- Mempel, F.; Corbera, E. Framing the frontier—Tracing issues related to soybean expansion in transnational public spheres. Glob. Environ. Chang. 2021, 69, 102308. [Google Scholar] [CrossRef]
- Giraudo, M.E. Dependent development in South America: China and the soybean nexus. J. Agrar. Chang. 2020, 20, 60–78. [Google Scholar] [CrossRef] [Green Version]
- Burchardt, H.-J.; Dietz, K. (Neo-)Extractivism—A new challenge for development theory from Latin America. Third World Q. 2014, 35, 468–486. [Google Scholar] [CrossRef]
- Garrett, R.D.; Lambin, E.F.; Naylor, R.L. Land institutions and supply chain configurations as determinants of soybean planted area and yields in Brazil. Land Use Policy 2013, 31, 385–396. [Google Scholar] [CrossRef]
- Janssen, R.; Rutz, D.D. Sustainability of biofuels in Latin America: Risks and opportunities. Energ. Policy 2011, 39, 5717–5725. [Google Scholar] [CrossRef]
- Wesz, V.J., Jr. Soybean production in Paraguay: Agribusiness, economic change and agrarian transformations. J. Agrar. Chang. 2021, 1–24. [Google Scholar] [CrossRef]
- Wesz, V.J., Jr. Strategies and hybrid dynamics of soy transnational companies in the Southern Cone. J. Peasant Stud. 2016, 43, 286–312. [Google Scholar] [CrossRef]
- Wesz, V.J., Jr. O mercado da Soja e as Relações de Troca Entre Produtores Rurais e Empresas no Sudeste de Mato Grosso (Brasil). Ph.D. Thesis, Universidade Federal Rural do Rio de Janeiro, Rio de Janeiro, Brazil, 2014. [Google Scholar]
- Steward, C. From colonization to “environmental soy”: A case study of environmental and socio-economic valuation in the Amazon soy frontier. Agric. Hum. Values 2007, 24, 107–122. [Google Scholar] [CrossRef]
- Hafner, R.; Coy, M. Fairness and Justice in Natural Resource Politics; Pichler, M., Staritz, C., Küblböck, K., Plank, C., Raza, W., Ruiz Peyré, F., Eds.; Routledge: London, UK, 2017; Chapter 9; p. 146. [Google Scholar]
- Garrett, R.D.; Rausch, L.L. Green for gold: Social and ecological tradeoffs influencing the sustainability of the Brazilian soy industry. J. Peasant Stud. 2016, 43, 461–493. [Google Scholar] [CrossRef] [Green Version]
- Choi, S.; Kim, H. The impact of conglomerate farming on the poor: Empirical evidence from the Brazil soy sector. Int. Area Stud. Rev. 2015, 19, 147–164. [Google Scholar] [CrossRef] [Green Version]
- Lapola, D.M.; Martinelli, L.A.; Peres, C.A.; Ometto, J.P.H.B.; Ferreira, M.E.; Nobre, C.A.; Aguiar, A.P.D.; Bustamante, M.M.C.; Cardoso, M.F.; Costa, M.H.; et al. Pervasive transition of the Brazilian land-use system. Nat. Clim. Chang. 2013, 4, 27–35. [Google Scholar] [CrossRef] [Green Version]
- Arvor, D.; Tritsch, I.; Barcellos, C.; Jégou, N.; Dubreuil, V. Land use sustainability on the South-Eastern Amazon agricultural frontier: Recent progress and the challenges ahead. Appl. Geogr. 2017, 80, 86–97. [Google Scholar] [CrossRef]
- United Nation Development Program—UNDP. Human Development Report 1990; Oxford University Press: New York, NY, USA, 2009. [Google Scholar]
- Stanton, E.A. The Human Development Index: A History; Working Paper Series N. 127; Political Economy Research Institute—University of Massachusetts Amherst: Amherst, MA, USA, 2007. [Google Scholar]
- Martinelli, L.A.; Batistella, M.; da Silva, R.F.B.; Moran, E. Soy Expansion and Socioeconomic Development in Municipalities of Brazil. Land 2017, 6, 62. [Google Scholar] [CrossRef] [Green Version]
- Lima-de-Oliveira, R.; Alonso, M.L. Fueling development? Assessing the impact of oil and soybean wealth on municipalities in Brazil. Extr. Ind. Soc. 2017, 4, 576–585. [Google Scholar] [CrossRef]
- UNDP—United Nations Development Programme. Human Development Report 2010: The Real Wealth of Nations—Pathways to Human Development; UNDP: New York, NY, USA, 2010; Available online: http://hdr.undp.org/en/content/human-development-report-2010 (accessed on 15 April 2021).
- Gelman, A. Two-stage regression and multilevel modeling: A commentary. Polit. Anal. 2005, 13, 459–461. [Google Scholar] [CrossRef]
- Matyas, L.; Sevestre, P. The Econometrics of Panel Data: Fundamentals and Recent Developments in Theory and Practice, 3rd ed.; Springer: Berlin, Germany, 2008. [Google Scholar]
- FAO—Food and Agriculture Organisation of the United Nations. FAOSTAT. Value of Agricultural Production; FAO: Rome, Italy, 2021; Available online: http://www.fao.org/faostat/en/#home (accessed on 11 June 2021).
- Sparovek, G.; Reydon, B.P.; Pinto, L.F.G.; Faria, V.; de Freitas, F.L.M.; Azevedo-Ramos, C.; Gardner, T.; Hamamura, C.; Rajão, R.; Cerignoni, F.; et al. Who owns Brazilian lands? Land Use Policy 2019, 87, 104062. [Google Scholar] [CrossRef]
- IBGE—Brazilian Institute of Economics and Statistics. Monitoramento da Cobertura e Uso da Terra do Brasil; IBGE: Rio de Janeiro, Brazil, 2020. Available online: https://biblioteca.ibge.gov.br/visualizacao/livros/liv101703.pdf (accessed on 10 June 2021).
- IBGE—Brazilian Institute of Economics and Statistics. Banco de Dados Agregados; IBGE: Rio de Janeiro, Brazil, 2021. Available online: http://www.sidra.ibge.gov.br (accessed on 12 February 2021).
- Sauer, S. Soy expansion into the agricultural frontiers of the Brazilian Amazon: The agribusiness economy and its social and environmental conflicts. Land Use Policy 2018, 79, 326–338. [Google Scholar] [CrossRef]
- Rausch, L.L.; Gibbs, H.K.; Schelly, I.; Brandão, A., Jr.; Morton, D.C.; Filho, A.C.; Strassburg, B.; Walker, N.; Noojipady, P.; Barreto, P.; et al. Soy expansion in Brazil’s Cerrado. Conserv. Lett. 2019, 12, e12671. [Google Scholar] [CrossRef]
- UNDP—United Nations Development Programme. Indice de Desenvolvimento Humano Municipal Brasileiro; UNDP—United Nations Development Programme; FJP—Fundação João Pinheiro; IPEA—Instituto de Pesquisa Econômica Aplicada: Brasília, Brazil, 2013. [Google Scholar]
- Secex—Foreign Trade Secretariat. Comex Stat—General Imports and Exports. 2020. Available online: http://comexstat.mdic.gov.br/pt/home (accessed on 12 February 2021).
- Cepea—Center for Advanced Studies in Applied Economics. PIB de Cadeias Agropecuárias; Cepea: Piracicaba, Brazil, 2020; Available online: https://www.cepea.esalq.usp.br/br/pib-de-cadeias-agropecuarias.aspx (accessed on 12 February 2021).
- Klein, H.S.; Vidal Luna, F. The growth of the soybean frontier in South America: The case of Brazil and Argentina. Rev. Hist. Econ. 2020, in press. [Google Scholar] [CrossRef]
- Miranda, C.; Silva, H. Concepções da Ruralidade Contemporânea: As Singularidades Brasileiras; IICA: Brasília, Brazil, 2013. [Google Scholar]
- Oderish, E.H. Dinâmicas Socioeconômicas e Demográficas da Expansão Agrícola no Brasil: Situação e Tendências dos Municípios e Regiões da Soja e da Cana de Açúcar. Ph.D. Thesis, Universidade Federal do Rio Grande do Sul, Porto Alegre, Brazil, 2020. [Google Scholar]
- Almeida, L.S. Gaúchos, Festas e Negócios: O Agronegócio da Soja no Meio-Norte Matogrossense. Ph.D. Thesis, Universidade Federal do Rio Grande do Sul, Porto Alegre, Brazil, 2013. [Google Scholar]
- Desconsi, C. O controle da Lavoura: A Construção de Relações Sociais e a Produção de Soja Entre Assentados do Meio norte do MATO Grosso-Brasil. Ph.D. Thesis, Universidade Federal do Rio Grande do Sul, Porto Alegre, Brazil, 2017. [Google Scholar]
- VanWey, L.K.; Spera, S.; de Sa, R.; Mahr, D.; Mustard, J.F. Socioeconomic development and agricultural intensification in Mato Grosso. Philos. Trans. Roy. Soc. B 2013, 368. [Google Scholar] [CrossRef]
- Weinhold, D.; Killick, E.; Reis, E.J. Soybeans, poverty and inequality in the Brazilian Amazon. World Dev. 2013, 52, 132–143. [Google Scholar] [CrossRef] [Green Version]
- Sagar, A.D.; Najam, A. The human development index: A critical review. Ecol. Econ. 1998, 25, 249–264. [Google Scholar] [CrossRef]
- Richards, P.; Pellegrina, H.; VanWey, L.; Spera, S. Soybean development: The impact of a decade of agricultural change on urban and economic growth in Mato Grosso, Brazil. PLoS ONE 2015, 10, e0122510. [Google Scholar] [CrossRef]
- Favareto, A.; Nakagawa, L.; Kleeb, S.; Seifer, P.; Pó, M. There is more poverty and inequality than well-being and wealth in the municipalities of Matopiba. Rev. NERA 2019, 47, 348–381. [Google Scholar] [CrossRef]
- Lima, M.S.B. Expansão da cadeia da soja na Amazônia Setentrional: Os casos de Roraima e Amapá. Bol. Geogr. 2020, 38, 79–93. [Google Scholar] [CrossRef]
- UNDP—United Nations Development Programme; FJP—Fundação João Pinheiro; IPEA—Instituto de Pesquisa Econômica Aplicada. Atlas do Desenvolvimiento Humano No Brasil; UNDP: New York, NY, USA, 2021; Available online: http://www.atlasbrasil.org.br/ (accessed on 15 April 2021).
- UNDP—United Nations Development Programme. Human Development Report 2007/8: Fighting Climate Change—Human Solidarity in a Divided World; UNDP: New York, NY, USA, 2007; Available online: http://hdr.undp.org/en/content/human-development-report-20078 (accessed on 15 April 2021).
- Carroll, R.J.; Ruppert, D. Transformation and Weighting in Regression; CRC Press: London, UK, 1988; Volume 30. [Google Scholar]
- Barro, R.J.; Sala-i-Martin, X. Convergence. J. Polit. Econ. 1992, 100, 223–251. [Google Scholar] [CrossRef]
- De la Fuente, A. The empirics of growth and convergence: A selective review. J. Econ. Dyn. Control 1997, 21, 23–73. [Google Scholar] [CrossRef]
- Ferreira, A. Convergence in Brazil: Recent trends and long-run prospects. Appl. Econ. 2000, 32, 479–489. [Google Scholar] [CrossRef]
- Baltagi, B.H. Econometric Analysis of Panel Data, 5th ed.; Wiley: Chichester, UK,, 2013. [Google Scholar]
- StataCorp. Stata Statistical Software: Release 15; StataCorp LLC: College Station, TX, USA, 2017. [Google Scholar]
- Ghinoi, S.; Wesz, V.J., Jr.; Piras, S. Political debates and agricultural policies: Discourse coalitions behind the creation of Brazil’s Pronaf. Land Use Policy 2018, 76, 68–80. [Google Scholar] [CrossRef] [Green Version]
- Wesz, V.J., Jr.; Piras, S.; Grisa, C.; Ghinoi, S. Assessing Brazilian agri-food policies: What impact on family farms? arXiv 2021, arXiv:2105.14996. [Google Scholar]
- Maranhão, R.L.A.; de Carvalho Júnior, O.A.; Hermuche, P.M.; Gomes, R.A.T.; McManus Pimentel, C.M.; Guimarães, R.F. The Spatiotemporal Dynamics of Soybean and Cattle Production in Brazil. Sustainability 2019, 11, 2150. [Google Scholar] [CrossRef] [Green Version]
- Kuznets, S. Economic Growth and Income Inequality. Am. Econ. Rev. 1995, 65, 1–28. [Google Scholar]
- León, M.G. The Kuznets curve in Brazil, 1850–2010. Rev. Hist. Econ. 2021, 39, 37–61. [Google Scholar]

| Variable | Variable Description | Obs. | Mean | Std. dev. | Min. | Max. |
|---|---|---|---|---|---|---|
| Municipal Human Development Index and Its change | ||||||
| IDHM | Municipal Human Development Index | 16,674 | 0.521 | 0.147 | 0.120 | 0.854 |
| IDHM_L | Municipal Human Development Index (longevity dimension) | 16,674 | 0.724 | 0.091 | 0.433 | 0.894 |
| IDHM_E | Municipal Human Development Index (education dimension) | 16,674 | 0.364 | 0.188 | 0.010 | 0.825 |
| IDHM_R | Municipal Human Development Index (income dimension) | 16,674 | 0.578 | 0.105 | 0.229 | 0.887 |
| delta_IDHM | Change in the Municipal Human Development Index | 11,116 | 0.139 | 0.038 | 0.025 | 0.327 |
| delta_IDHM_L | Change in the Municipal Human Development Index (longevity dimension) | 11,116 | 0.078 | 0.031 | 0.002 | 0.147 |
| delta_IDHM_E | Change in the Municipal Human Development Index (education dimension) | 11,116 | 0.190 | 0.060 | 0.002 | 0.421 |
| delta_IDHM_R | Change in the Municipal Human Development Index (income dimension) | 11,116 | 0.064 | 0.036 | −0.062 | 0.296 |
| Soy-related variables and their change | ||||||
| soy_area_pc_log | Soy area per capita at the start of the period (log ha) | 16,674 | 0.124 | 0.360 | 0.000 | 4.011 |
| soy_productivity | Soy productivity at the start of the period (tons/ha) | 16,689 | 0.590 | 1.058 | 0.000 | 6.964 |
| soy_area_used_log | Soy area at the start of the period (log ha) | 16,674 | 1.994 | 3.512 | 0.000 | 13.318 |
| delta_soy_area_pc | Change in the soy area per capita (log ha) | 11,116 | 0.092 | 0.419 | −5.100 | 7.362 |
| delta_soy_productivity | Change in soy productivity (tons/ha) | 11,120 | 0.293 | 0.813 | −3.000 | 6.964 |
| delta_soy_area_used | Change in the soy area (log ha) | 11,116 | 9.329 | 39.543 | −348.547 | 514.783 |
| Geographical variables | ||||||
| macro_region_2 | Federal region Northeast | 16,674 | 0.323 | 0.468 | 0.000 | 1.000 |
| macro_region_3 | Federal region Southeast | 16,674 | 0.299 | 0.458 | 0.000 | 1.000 |
| macro_region_4 | Federal region South | 16,674 | 0.214 | 0.410 | 0.000 | 1.000 |
| macro_region_5 | Federal region Centre-West | 16,674 | 0.084 | 0.277 | 0.000 | 1.000 |
| persons_tot_log | Population of the municipality at the start of the period (log) | 16,674 | 9.333 | 1.115 | 6.321 | 16.236 |
| rural_pop_share | Share of rural population in the municipality | 16,674 | 0.431 | 0.250 | 0.000 | 1.000 |
| Economic variables | ||||||
| GINI | Inequality (Gini index) at the start of the period | 16,674 | 0.522 | 0.072 | 0.270 | 0.920 |
| CPR | Percent of self-employed persons at the end of the period | 11,116 | 26.383 | 10.463 | 0.670 | 82.540 |
| EMP | Percent of dependent workers at the end of the period | 11,116 | 1.669 | 1.421 | 0.000 | 15.960 |
| P_COM | Percent of people employed in trade at the end of the period | 11,116 | 9.722 | 4.580 | 0.000 | 36.570 |
| P_CONSTR | Percent of people employed in construction at the end of the period | 11,116 | 6.134 | 3.141 | 0.000 | 31.780 |
| P_EXTR | Percent of people employed in the mining sector at the end of the period | 11,116 | 0.555 | 1.740 | 0.000 | 31.630 |
| P_SERV | Percent of people employed in services at the end of the period | 11,116 | 31.996 | 9.923 | 3.290 | 79.060 |
| P_SIUP | Percent of people employed in public services at the end of the period | 11,116 | 0.558 | 0.620 | 0.000 | 12.950 |
| P_TRANSF | Percent of people employed in processing industry at the end of the period | 11,116 | 9.493 | 8.734 | 0.000 | 69.170 |
| Environmental and social variables and their change (2006–2017) | ||||||
| area_applied_log | Agricultural area where soil amendments 1 were applied (log) | 11,111 | 8.091 | 2.688 | 0.000 | 13.753 |
| delta_area_applied | Change in the agricultural area where soil amendments 1 were applied | 5547 | 9293.9 | 33,868.0 | −56,782.0 | 532,015.1 |
| share_area_applied | Share of agricultural area where soil amendments 1 were applied | 11,111 | 0.317 | 0.268 | 0.000 | 1.000 |
| delta_share_area_applied | Change in the share of agricultural area where soil amendments 1 were applied | 5547 | 0.025 | 0.172 | −1.000 | 1.000 |
| share_applied | Share of farms that applied soil amendments 1 | 11,111 | 0.203 | 0.206 | 0.000 | 1.000 |
| delta_share_applied | Change in the share of farms that applied soil amendments 1 | 5547 | −0.022 | 0.135 | −1.000 | 1.000 |
| area_agrochem_log | Agricultural area where soil amendments 1 were applied (log) | 11,111 | 7.241 | 2.094 | 0.000 | 12.422 |
| delta_area_agrochem | Change in the agricultural area where agrochemicals were applied | 5547 | 989.7 | 5053.2 | −49,456.8 | 68,179.0 |
| share_area_agrochem | Share of agricultural area where agrochemicals were applied | 11,106 | 0.530 | 0.331 | 0.000 | 1.000 |
| delta_share_area_agrochem | Change in the share of agricultural area where agrochemicals were applied | 5543 | 0.119 | 0.205 | −0.926 | 1.000 |
| share_agrochem | Share of farms that applied agrochemicals in that year | 11,111 | 0.330 | 0.268 | 0.000 | 1.000 |
| delta_share_agrochem | Change in the share of farms that applied agrochemicals | 5547 | 0.059 | 0.143 | −0.762 | 1.000 |
| share_area_family | Share of agricultural area used by family farms | 5560 | 0.474 | 0.280 | 0.000 | 1.000 |
| share_family | Share of family farms out of total farms | 5563 | 0.726 | 0.143 | 0.000 | 1.000 |
| Pairwise Correlations | delta_soy_area_pc | delta_soy_productivity | delta_soy_area_used | soy_area_pc_log | soy_productivity | soy_area_used_log |
|---|---|---|---|---|---|---|
| area_applied_log | 0.111 | 0.224 | 0.180 | 0.312 | 0.432 | 0.454 |
| delta_area_applied | 0.262 | 0.123 | 0.572 | 0.356 | 0.238 | 0.309 |
| share_area_applied | 0.117 | 0.214 | 0.153 | 0.355 | 0.453 | 0.472 |
| delta_share_area_applied | 0.052 | −0.014 | 0.088 | 0.029 | −0.007 | 0.019 |
| share_applied | 0.086 | 0.191 | 0.098 | 0.283 | 0.365 | 0.388 |
| delta_share_applied | 0.002 | −0.119 | 0.019 | −0.174 | −0.257 | −0.242 |
| area_agrochem_log | 0.142 | 0.284 | 0.212 | 0.437 | 0.541 | 0.589 |
| delta_area_agrochem | 0.197 | 0.147 | 0.420 | 0.316 | 0.302 | 0.374 |
| share_area_agrochem | 0.130 | 0.333 | 0.151 | 0.427 | 0.585 | 0.595 |
| delta_share_area_agrochem | 0.006 | 0.126 | 0.012 | −0.011 | 0.122 | 0.098 |
| share_agrochem | 0.101 | 0.267 | 0.070 | 0.363 | 0.426 | 0.447 |
| delta_share_agrochem | 0.046 | 0.098 | 0.050 | 0.055 | 0.081 | 0.083 |
| share_area_family | −0.132 | −0.188 | −0.197 | −0.318 | −0.407 | −0.427 |
| share_family | −0.065 | −0.021 | −0.119 | −0.087 | −0.106 | −0.106 |
| OLS Models for Panel Data | ΔHDI | ΔHDI (Longevity) | ΔHDI (Education) | ΔHDI (Income) |
|---|---|---|---|---|
| macro_region_2 | −6.87 *** | −5.30 *** | 0.91 | −3.13 *** |
| macro_region_3 | 22.69 *** | 9.97 *** | 45.35 *** | 24.70 *** |
| macro_region_4 | 29.85 *** | 13.45 *** | 54.82 *** | 38.25 *** |
| macro_region_5 | 20.57 *** | 13.22 *** | 27.43 *** | 22.55 *** |
| time_00_10 | 49.13 *** | 31.66 *** | 102.24 *** | 35.11 *** |
| delta_soy_area_pc | 5.75 *** | 0.17 | 12.88 *** | −0.77 |
| delta_soy_productivity | 7.66 *** | 1.13 ** | 12.36 *** | 5.14 *** |
| delta_soy_area_used | −0.04 ** | −0.01 | −0.11 *** | −0.01 |
| time_00_10#delta_soy_area_pc | −2.54 | 2.71 | −8.47 ** | 3.63 * |
| time_00_10#delta_soy_productivity | −8.92 *** | −1.75 *** | −13.95 *** | −3.59 *** |
| time_00_10#delta_soy_area_used | 0.00 | −0.02 | 0.03 | −0.03 |
| IDHM | −365.21 *** | |||
| IDHM_L | −405.35 *** | |||
| IDHM_E | −416.07 *** | |||
| IDHM_R | −379.73 *** | |||
| soy_area_pc_log | 0.80 | −0.09 | 2.45 | 4.96 *** |
| soy_productivity | −0.29 | −0.97 *** | 1.00 | 1.04 ** |
| persons_tot_log | −2.65 *** | −0.10 | −5.71 *** | −1.68 *** |
| GINI | 6.05 | 13.04 *** | 46.09 *** | −61.29 *** |
| rural_pop_share | 8.62 *** | −4.18 *** | −19.61 *** | 3.96 ** |
| CPR | −0.08 ** | −0.06 ** | −0.14 ** | 0.45 *** |
| EMP | 3.65 *** | 1.46 *** | 3.79 *** | 6.63 *** |
| P_COM | 0.67 *** | 0.12 | 1.24 *** | 0.50 *** |
| P_CONSTR | 0.80 *** | 0.41 *** | 0.55 *** | 0.72 *** |
| P_EXTR | 0.31 * | 0.04 | 0.20 | 0.35 ** |
| P_SERV | 0.59 *** | 0.16 *** | 1.31 *** | 0.63 *** |
| P_SIUP | −0.03 | 0.30 | 0.25 | 1.17 ** |
| P_TRANSF | 0.25 *** | 0.05 | 0.66 *** | 0.39 *** |
| Constant | 247.01 *** | 320.37 *** | 191.32 *** | 225.19 *** |
| R2 | 0.406 | 0.504 | 0.293 | 0.382 |
| Fixed Effect Models | HDI | HDI (Longevity) | HDI (Education) | HDI (Income) |
|---|---|---|---|---|
| time_2000 | 129.20 *** | 77.70 *** | 159.82 *** | 56.07 *** |
| time_2010 | 273.66 *** | 165.29 *** | 368.48 *** | 131.85 *** |
| soy_area_pc_log | 20.35 *** | 7.86 *** | 26.29 *** | −3.47 * |
| time_2000#soy_area_pc_log | −1.81 | −4.08 ** | −3.19 | 7.35 *** |
| time_2010#soy_area_pc_log | −0.19 | −5.57 *** | −5.88 ** | 12.61 *** |
| soy_productivity | 5.71 *** | 3.34 *** | −5.79 *** | 8.95 *** |
| time_2000#soy_productivity | 1.74 ** | −5.22 *** | 20.21 *** | −4.31 *** |
| time_2010#soy_productivity | −10.60 *** | −11.18 *** | 3.98 *** | −7.57 *** |
| persons_tot_log | −17.43 *** | −4.69 *** | −1.35 | −40.06 *** |
| rural_pop_share | −94.07 *** | −13.52 *** | −61.00 *** | −49.1 *** |
| GINI | 99.23 *** | 75.78 *** | −37.75 *** | 150.53 *** |
| constant | 535.33 *** | 654.41 *** | 242.00 *** | 828.54 *** |
| R2 within | 0.965 | 0.908 | 0.961 | 0.871 |
| R2 between | 0.231 | 0.032 | 0.473 | 0.003 |
| R2 total | 0.665 | 0.480 | 0.748 | 0.147 |
Publisher’s Note: MDPI stays neutral with regard to jurisdictional claims in published maps and institutional affiliations. |
© 2021 by the authors. Licensee MDPI, Basel, Switzerland. This article is an open access article distributed under the terms and conditions of the Creative Commons Attribution (CC BY) license (https://creativecommons.org/licenses/by/4.0/).
Share and Cite
Piras, S.; Wesz, V.J., Jr.; Ghinoi, S. Soy Expansion, Environment, and Human Development: An Analysis across Brazilian Municipalities. Sustainability 2021, 13, 7246. https://doi.org/10.3390/su13137246
Piras S, Wesz VJ Jr., Ghinoi S. Soy Expansion, Environment, and Human Development: An Analysis across Brazilian Municipalities. Sustainability. 2021; 13(13):7246. https://doi.org/10.3390/su13137246
Chicago/Turabian StylePiras, Simone, Valdemar João Wesz, Jr., and Stefano Ghinoi. 2021. "Soy Expansion, Environment, and Human Development: An Analysis across Brazilian Municipalities" Sustainability 13, no. 13: 7246. https://doi.org/10.3390/su13137246
APA StylePiras, S., Wesz, V. J., Jr., & Ghinoi, S. (2021). Soy Expansion, Environment, and Human Development: An Analysis across Brazilian Municipalities. Sustainability, 13(13), 7246. https://doi.org/10.3390/su13137246