Abstract
As rotary machines have become more complicated, balancing processes have been classified as a vital step in condition monitoring to ensure that machines operate reliably, smoothly and safely. All rotating objects will deflect during rotation and all objects possess certain natural frequencies in the absence of rotation. However, an unbalanced object can cause significant unwanted deflection created by resonant vibration at a frequency (cycles/second) close to certain rotational speeds (rotations/second), known as critical speeds. This is especially important for flexible machines which normally work at rotations above their critical speeds. Imbalance is a common problem in flexible rotating machinery that can lead to extreme vibration and noise levels. This is one of the major reasons for studying various balancing methods applied to the vibration response of rotating machines. Recently, the relation between acoustic and vibration response during a rotary machine balancing process based on the original Four-Run method has been presented for constant speed machines. This method cannot be applied to machines in start-up or shut-off. Hence, by considering the acoustic and vibration responses of a machine between its critical speeds, this research presents a new innovative speed-variant balancing method based on the original Four-Run method, named as (PPCS) Peak to Peak for Critical Speeds. The proposed method consists of two major types of application: the first is in the run-up of the machine and the second is in shut down. Experimental laboratory results show that this method can be implemented for speed-variant and flexible rotary machines during run-up or shut-down transient processes based on acoustic and vibration measurements. Further, the results show the same trend in acoustic and vibration responses during balancing process which was shown for constant speed rotary machines. With a 40% improvement in response compared to around 55% obtained by traditional vibration measurements, the results found show an appreciable benefit in an alternative acoustic methodology that may have not been considered previously for run-up and shut-down issues. In addition, since only the magnitude of response is required and this is a non-contact technique an acoustic-only methodology, it can be employed with some confidence as an innovative and readily available method for condition monitoring.
1. Introduction
High dynamic stresses that are observed within a rotating machine are commonly assessed as unwanted quantities; these could affect machine elements like bearings, shafts, structural joints and foundations, and in addition can produce undesirable noise. One possible reason for these periodic forces to show up is due to unbalanced rotating components inside the rotating part of the machine. These unbalances could arise from manufacturing inaccuracies or operational corrosions. In many rotating machines such as electrical motors, car engines, power turbines, pumps, etc., it is essential that these need to be balanced to work properly. It has been found that a balanced rotation will maintain the device and its elements, such as bearings, in an ideal working condition, which should lead, ultimately, to a longer life-span for the whole system [1,2,3].
Most of the conventional methods in the field of condition monitoring use methodical steps for determining any slightly unbalanced element to prevent further malfunctions. However, to achieve the best performance of any device and to keep it safe from experiencing damaging vibration, balancing methods are placed on a high level of importance. Innovations and an increase in effectiveness can thus arise; an example of these are outlined within these studies [4,5,6,7]. The standard methods such as vector balancing method and the Four-Run balancing method are widely used in industrial cases. Some of these methods require additional sensors like tachometers for calculations.
Goodman [8] presented the method of least squares for prediction of correction mass and the installation specifications, and this method was developed further by Lund et al. and Tessarzik et al. [9,10]. These studies can be considered as the first step for implementing various methods to balance rotary machines. Updated by Vania et al. [11], who developed a method of identifying unbalance in rotating machines, this has resulted in the development of the M-estimators method, Pennachi et al. [12]. By using run-up and shutdown process, Sinha et al. [13] proposed a method for speed-variant machines to calculate unbalance and misalignment of a flexible rotary machine. There have also been various kinds of modal-based balancing methods developed during the last few years [14,15,16,17]. The application of these methods have been studied for industrial-sized equipment [18,19,20,21,22,23,24]. By using transient vibrational data, the methods have been used for speed-variant rotating machines by Yue et al. and Edwards et al. [25,26]. Presenting a reliable balancing method to minimize vibrations of the rotating devices was the major area of concern in these references. As an illustration for improvement in experimental design, Shamsah et al. [27] worked on a new method of balancing which requires a reduced number of vibration sensors to reduce the computational efforts in the complex signal processing. So, the machine down time could be reduced significantly as a result.
Although many vibration-based balancing methods have been presented in the last few decades [28,29,30], a new approach proposes the possibility of using acoustic responses to identify the unbalance of a rotating device. Selecting appropriate accelerometers and mounting them on non-rotating parts for balancing process is crucial part of the traditional vibration Four-Run balancing technique. However, this method can have a serious drawback if no direct access is available. Given a device which appears to possess good sound radiation qualities, such as exposed flat plates, the acoustical method immediately possesses a specific advantage. The microphone method can offer “direct access” to the rotating elements, and if cost is an issue, this method is also a more affordable option. Care should be taken, though, regarding the necessity to avoid interference from neighboring devices or building services background noise, for example. In methods favored here, to avoid directivity influences, the microphone should be placed within one tenth of an acoustic wavelength from the vibration source, where wavelength is calculated according to the maximum frequency of interest. In theory, a simple sound radiation impedance matrix can determine the positions where directivity patterns dominate the sound radiation, but for our purposes, with the limits chosen, it is assumed the sound radiation profile obtained is, within a certain degree, equivalent to the vibration pattern. No further guidance is given here but will become a subject of a further study where the sound radiation profile from a vibrating plate is considered. This is not the first time an acoustic response has been studied in cases where vibration response is the primary objective. There has been some research which has utilized the relationship between the acoustic and vibration responses. Mao et al. [31] proposed an acoustic transfer matrix to calculate acoustic pressure from a plate which is vibrating, and Isavand et al. [32] showed that there is a possibility to utilize acoustic responses for diagnosis problems within buildings. The authors compared the acoustic and vibration response of a rotating machine balancing process at a constant speed and load, Isavand et al., [33]. The main objective in this work was the use of an acoustic response to calculate the properties of a corrective mass for a constant rotational speed device. Although the research showed that the trend of the vibration and acoustic response were similar, the study was isolated to the structural health for a constant rotation speed machine.
The research presented in this paper proposes an innovative method which balances an electrical rotating machine and provides comparison of acoustic and vibration response data during both run-up and shut-down stages. It is also shown that during these stages the vibration responses are significantly different to each other. Consideration of the benefits and drawbacks by using the acoustical signature, from the machine, as a sustainable alternative method for balancing for a speed-variant rotary machine is the main aim in this research. The content of this article begins with the proposed method, flow chart and description of the example case study in Section 2. Following this, the outcome of the balancing procedures, expressed as overlapping circles, is shown in Section 3: Results. Then, an assessment of the vibration and acoustic responses in terms of the rotation speed or the equivalent frequency spectra can be found in the Discussion, Section 4. Finally, the Conclusions complete the article in Section 5.
2. Materials and Methods
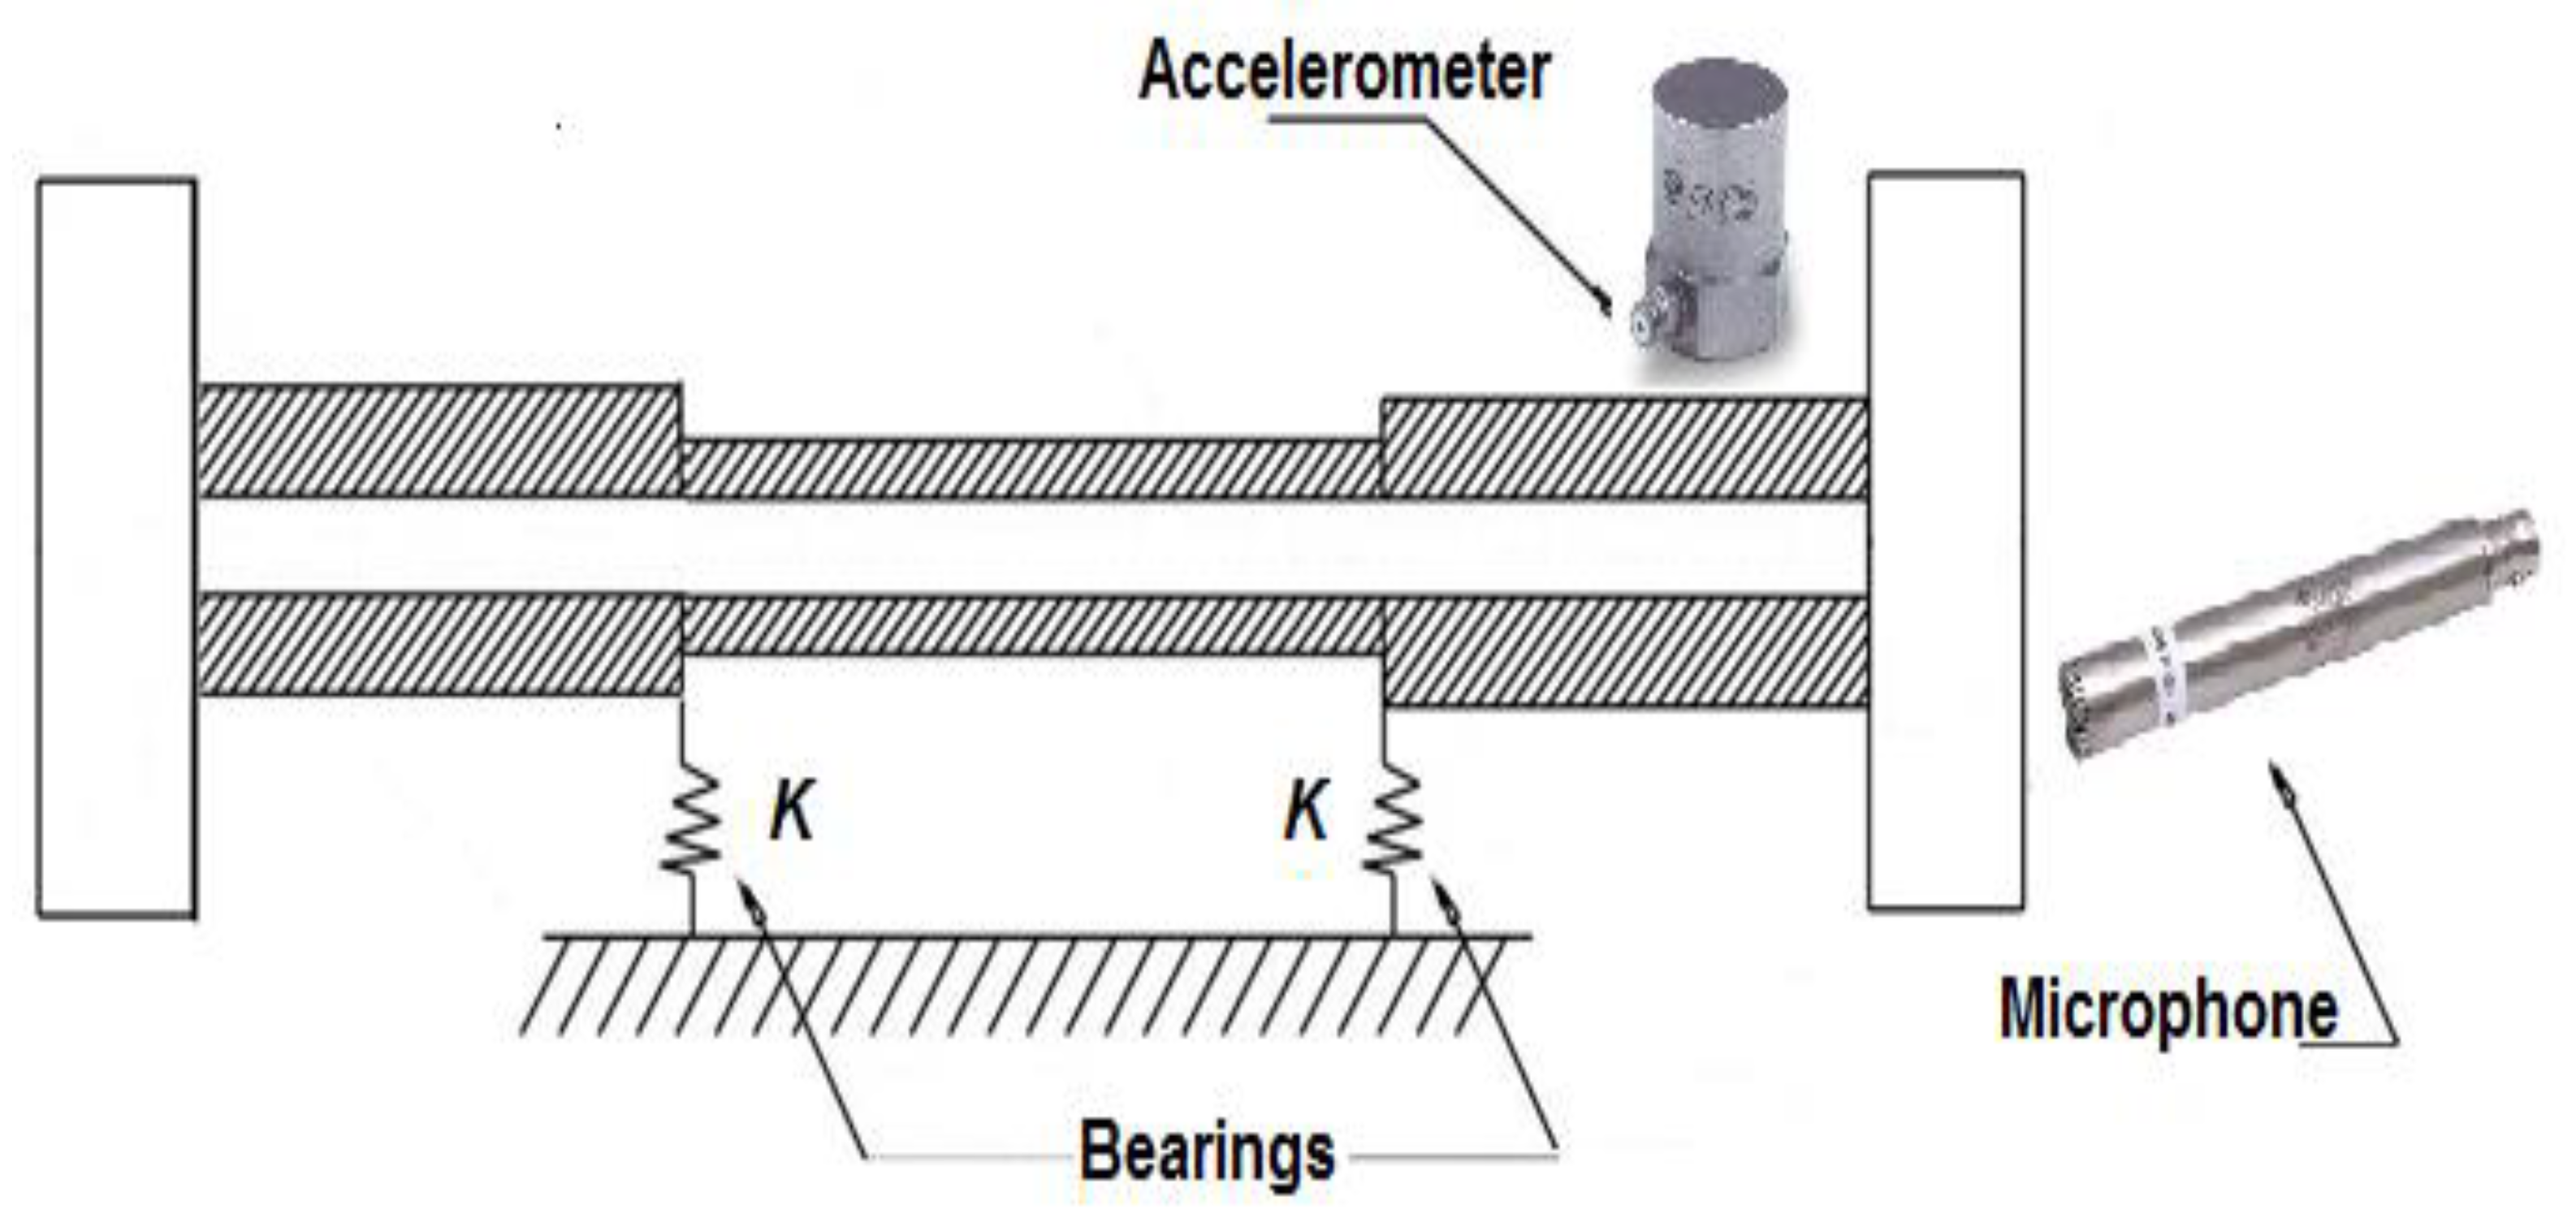
The proposed speed-variant balancing method is based on the concept of the Four-Run balancing method. In this section, the main concept and the proposed methodology are illustrated. Since the proposed method needs the modal balancing process, this procedure is outlined. A schematic of the experimental test setup is shown in Figure 1, where the microphone is placed adjacent to the rotating plate. Normally, an accelerometer, shown here, is placed on the vibration plate during an imbalance testing procedure. The figure illustrates a simple design, but common to flexible rotating machines, where a thick brushing or grinding plate is in operation.
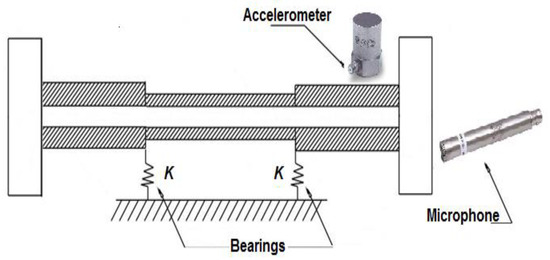
Figure 1.
A schematic of the test setup showing the rotating machine with accelerometer placed on the top and microphone placed approximately 100 mm from the grinder surface.
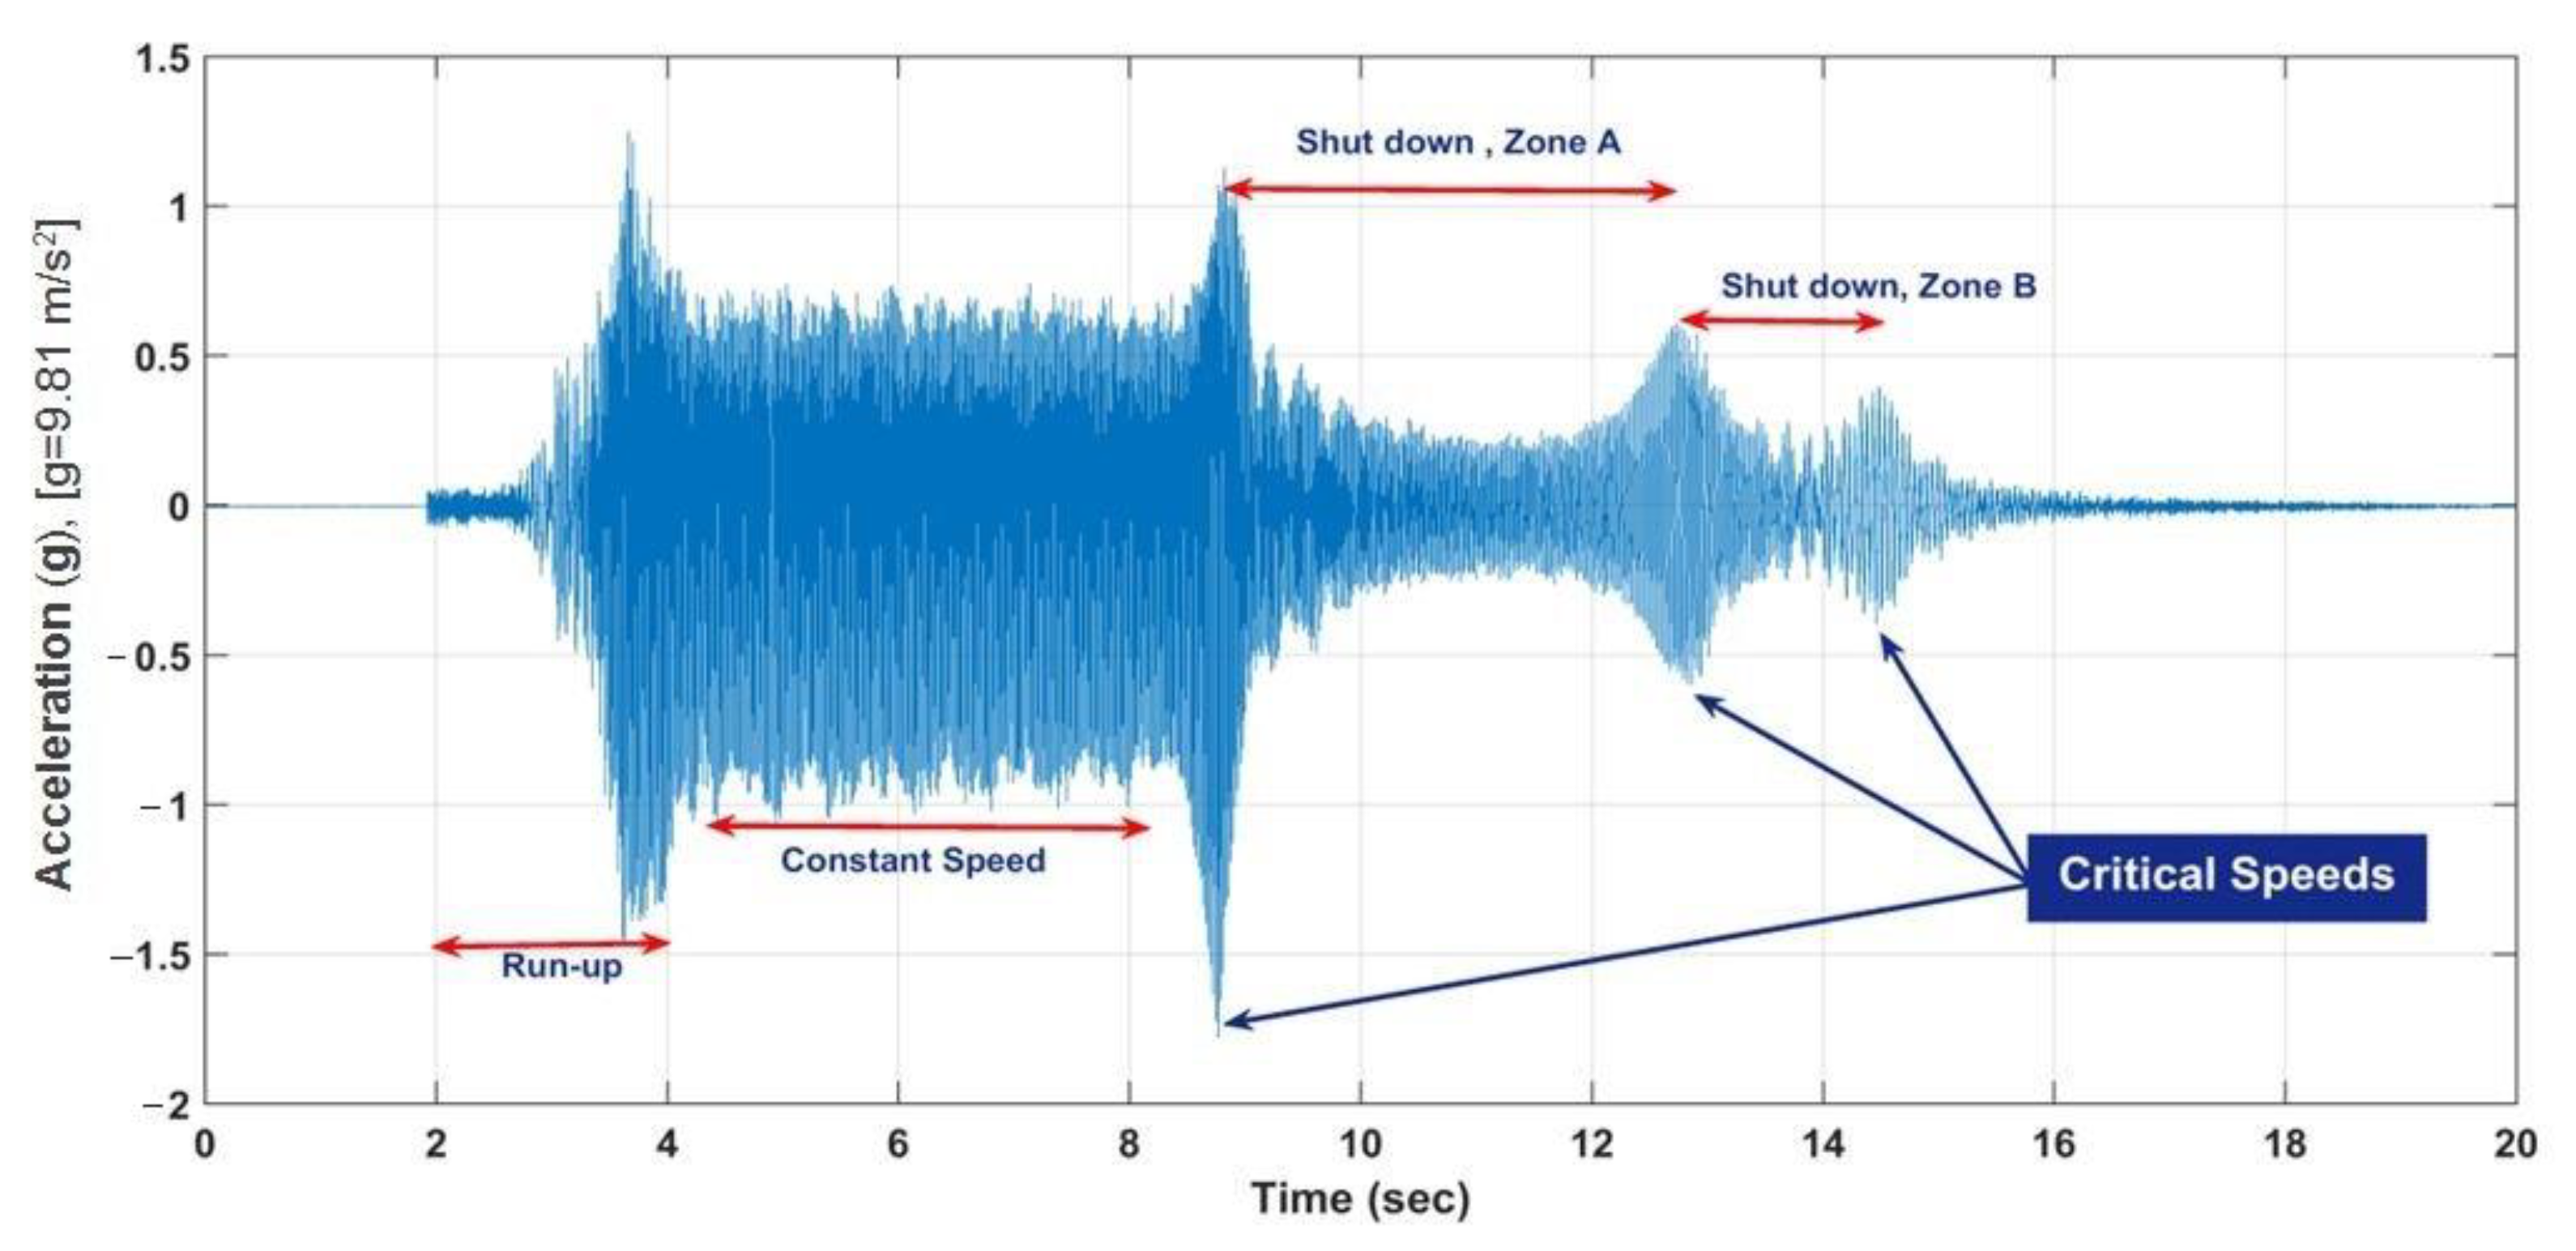
In this research the transient signals during running up or shutting down, as shown in Figure 2, are investigated, by transforming to the frequency domain, to balance the rotary machine.
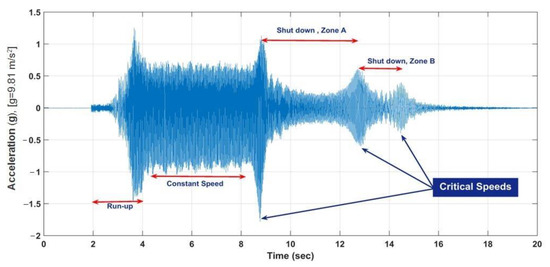
Figure 2.
The complete time-sample illustrating the vibration response of an example rotating machine. Annotations indicate the various mode states of the machine.
2.1. Methods
To give the procedure a formulaic-like structure, the general balancing equilibrium, modal balancing and Four-Run balancing method are described.
2.1.1. General Balancing Equilibrium
Since the machine’s rotating component has an assumed geometry typical of an overhung configuration, the main motion equation can be considered as presented by Fu et al. [21].
where , , and are the mass, damping, gyroscopic and stiffness matrices of the rotating system, respectively. Due to unbalance on the mass-disk and gravity, the excitation forces term can be written accordingly:
where and denote the rotational speed and the angular acceleration of the machine, and is the mass of the disc. It should be noted that (the eccentricity) and are referenced by the initial unbalanced angle. According to Equation (2) the balancing process can reduce the eccentricity parameter resulting in an acceptable decrease in an undesirable unbalance force. Thus, by decreasing the dynamic unbalance forces, the unwanted vibration character of the machine reduces respectively.
2.1.2. Modal Balancing
To obtain an accurate mass, the basic theory of modal balancing [25,34] and Kellenberger [35] is a necessary tool to assist in accomplishing this. For an isotropic flexible rotor system with arbitrary distributed mass, , the characteristic modal function can be obtained when the geometrical features and physical parameters of the system are given. The orthogonality condition between two modes can be defined as in the references, Yue et al. and Bishop et al. [25,34]:
where is the nth characteristic modal function and is the location of the horizontal axis of the rotor bearing system and is the kth distributed mass. The distributions of initial unbalance mass eccentricity of shaft can be expressed as
The dynamic deflection can be stated as
where is the nth critical angular speed. The critical rotation speeds in revolutions per minute (RPM), Figure 2, of the device are given by a simple relation in angular frequency
The actual values of the critical rotation speeds are presented a little later in the text, but it is clear here, Figure 2, that critical speeds have been reached by consideration of the acceleration at a point measured on a rotation object during shut-down and run-up. The constant speed RPM is slightly above the critical speed encountered during run-up and is highlighted during Shut down, Zone A. Indeed, this example illustrates a possible increase in transient acceleration during shut down periods. Note that vibration acceleration is shown here and throughout in terms of g = 9.807 m/s2 since this quantity is commonly used by test engineers in machine diagnostics.
The original Four-Run balancing method is also known as the common phase-less method, Walker et al. [29]. Based on the fundamentals of regular Four-Run balancing method, the Peak to Peak of different Critical Speeds (PPCS) balancing method is proposed. Therefore, the PPCS method is simply based on the root mean square of the amplitude of vibration or acoustic responses of the device which are then recorded during running-up or free shutting-down operating processes in presence of critical speeds. However, this method requires preliminary assessment of run-up and shut-down Zones in which the PPCS method is required to assess independently. This means that the PPCS method can be applied to different types of disc data: the run-up test and the shut-down test. These provide enough information to calculate the position and properties of a required correction but arbitrary sized mass. The PPCS method requires several steps that, described briefly here, it is important to restate that these steps also apply to acoustic data which can be obtained from a single microphone or an array during an operational sample test. Using acoustic signature can be considered as an innovative idea to estimate the machine vibration contactless. This point is considered as the novelty of the method which brings simplicity to the balancing procedure. The outline steps of the method are illustrated in Figure 3.
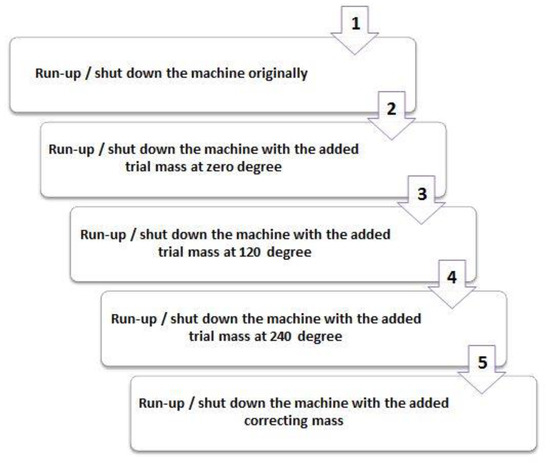
Figure 3.
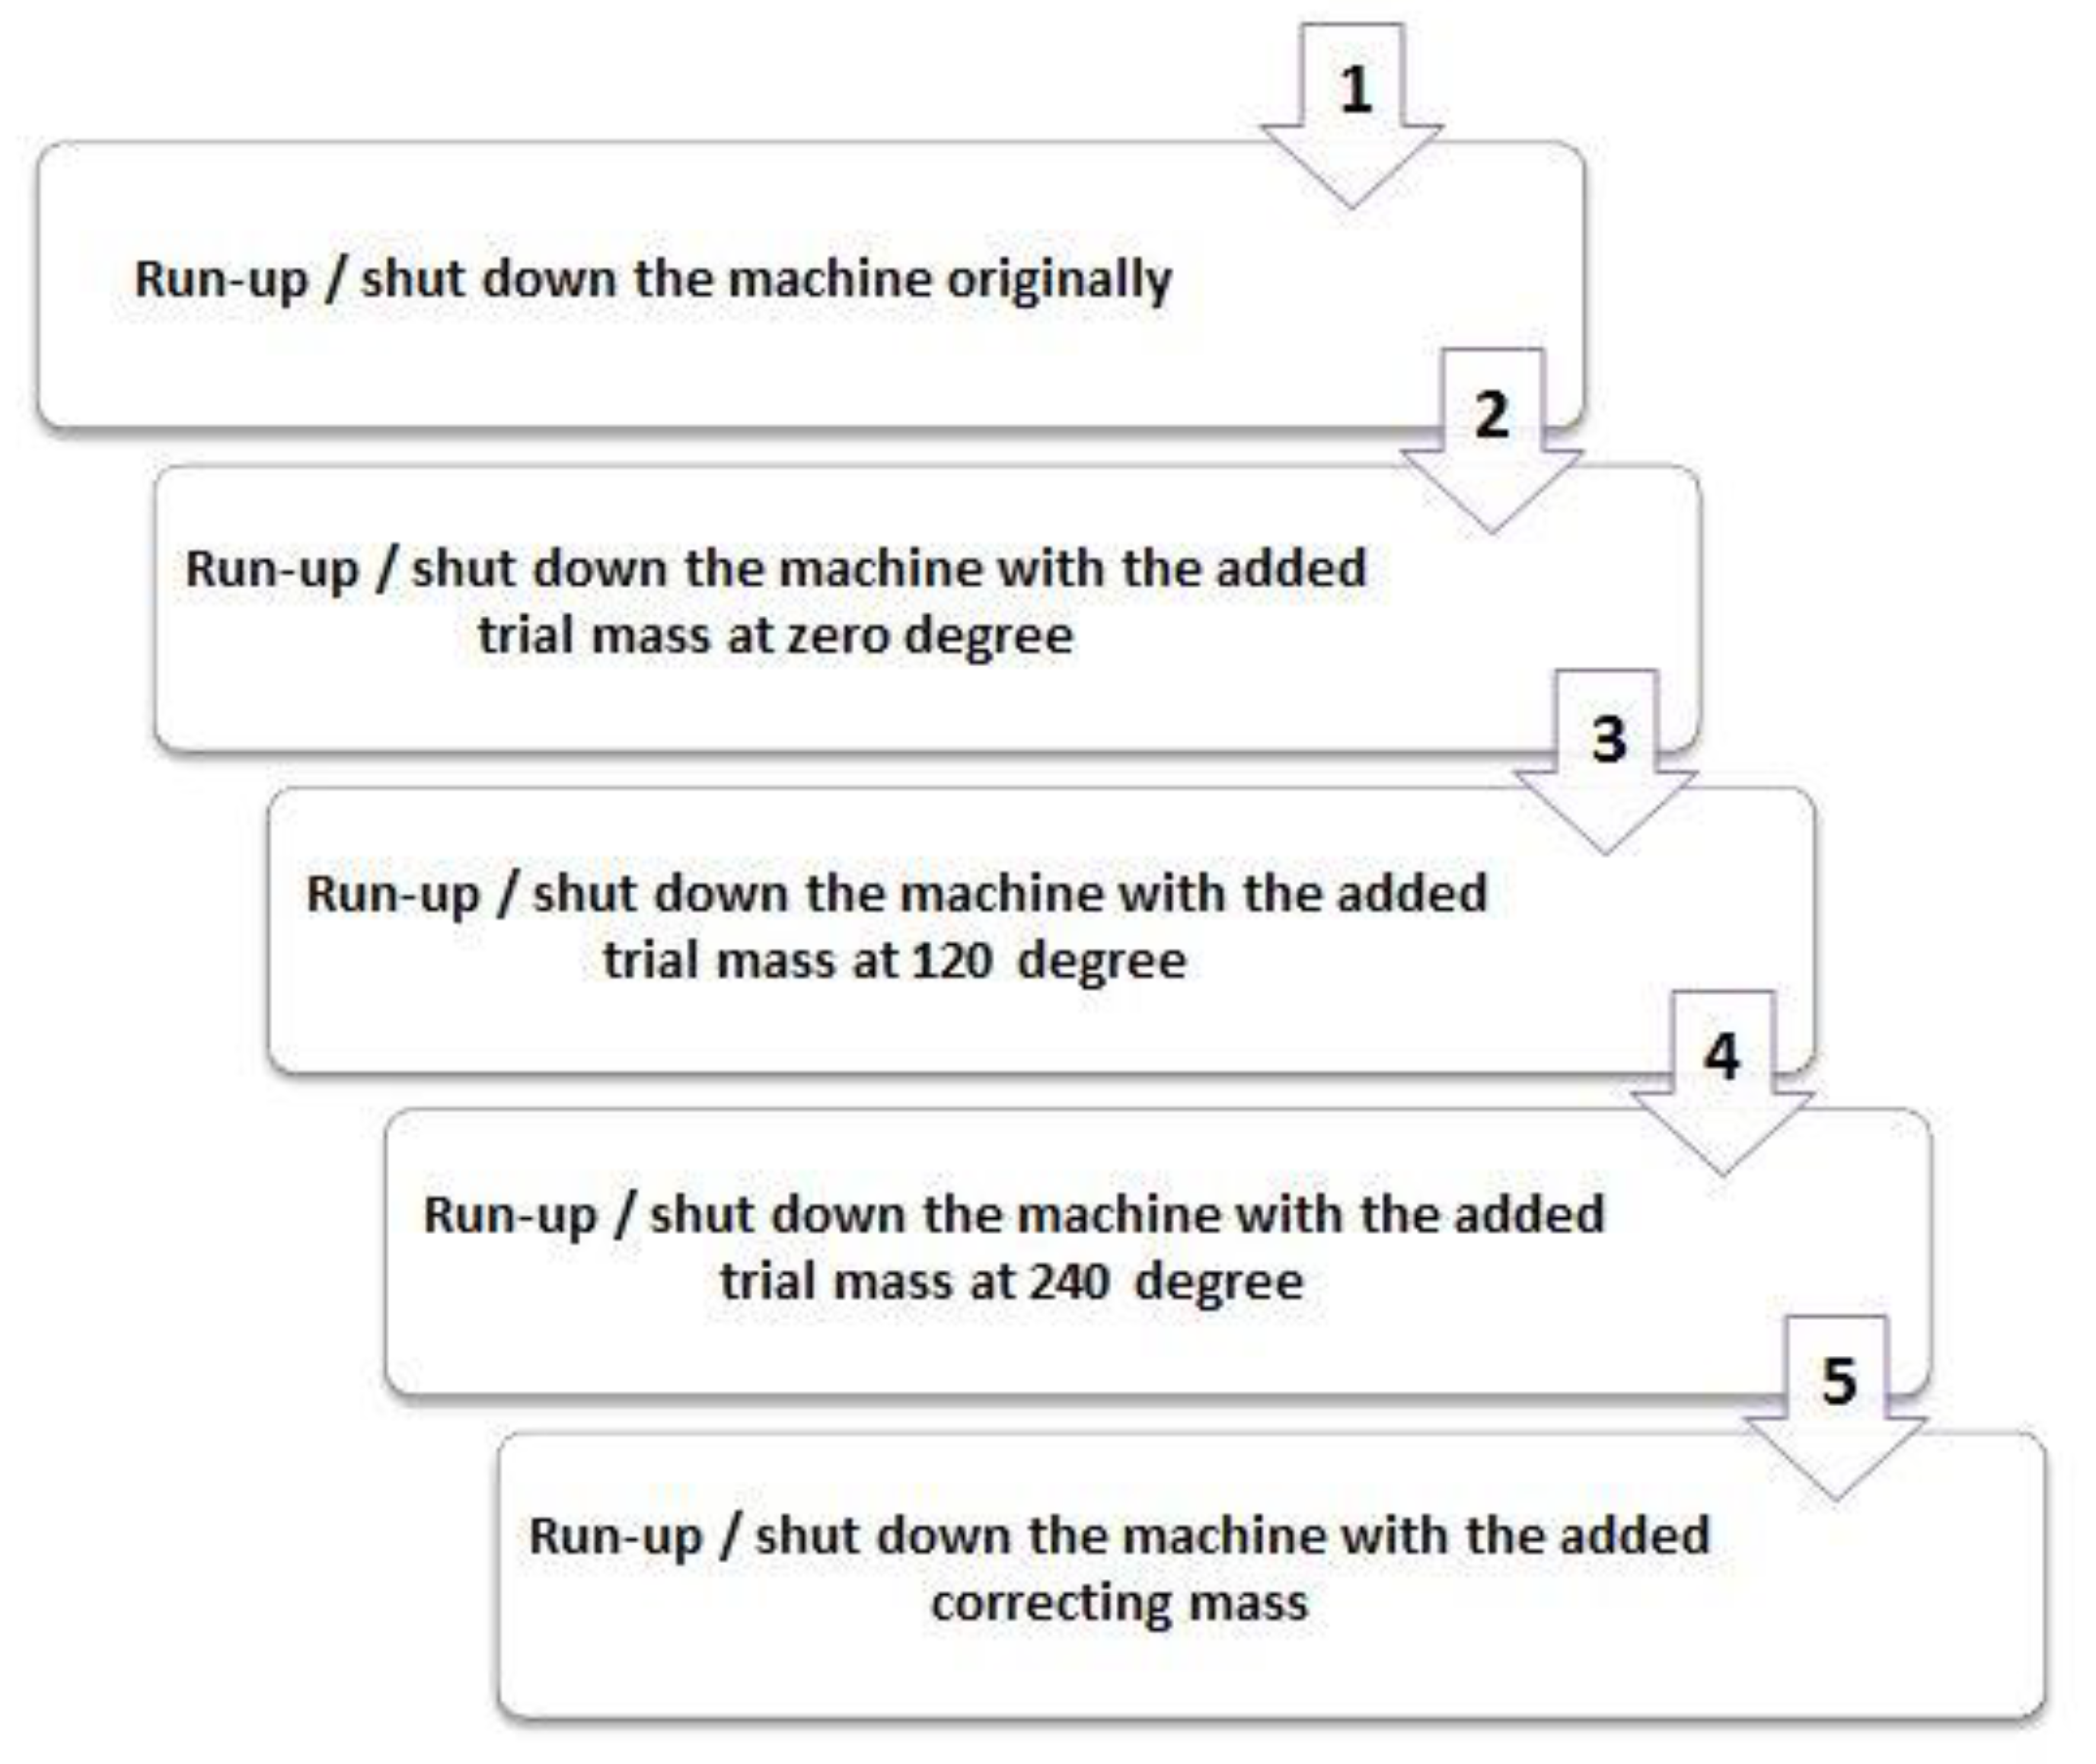
The proposed PPCS balancing method flowchart.
It must be stressed that the machine must reach a specific speed greater than the critical speeds during run-up or shut down operation. The acoustic response data of the machine could be considered from the run-up area, zone A or zone B of shut down process, according to Figure 2. Zone A is related to the time from the beginning of the shut-down process to the time when the third and second critical speeds have been excited. Zone B consists of the time between excitation of the first and second critical speeds of the machine. Here, the root mean square (rms) values have been calculated within the response periods and considered as the representative values for the magnitude of the vibration and acoustic responses.
At the first step, a modal analysis test has been done to clarify the critical speeds of the machine. Then, the (faulty) device of interest is started normally and after reaching a specific speed higher than the critical speeds, the device is then switched off. Then, the root mean square of the amplitude of the machine response during the selected time range is calculated. Here, the acoustic response of the device is recorded via microphone. This type of recording also applies to the following steps. At the second run-up or shut-down test, a trial mass is added to a certain point of the rotating part. The process is repeated, and rms values are recorded. In the third and fourth run-up or shut-down tests, the same process is repeated but the trial mass is placed at angular positions which respectively differ by 120 and 240 degrees from the original point at the same radius.
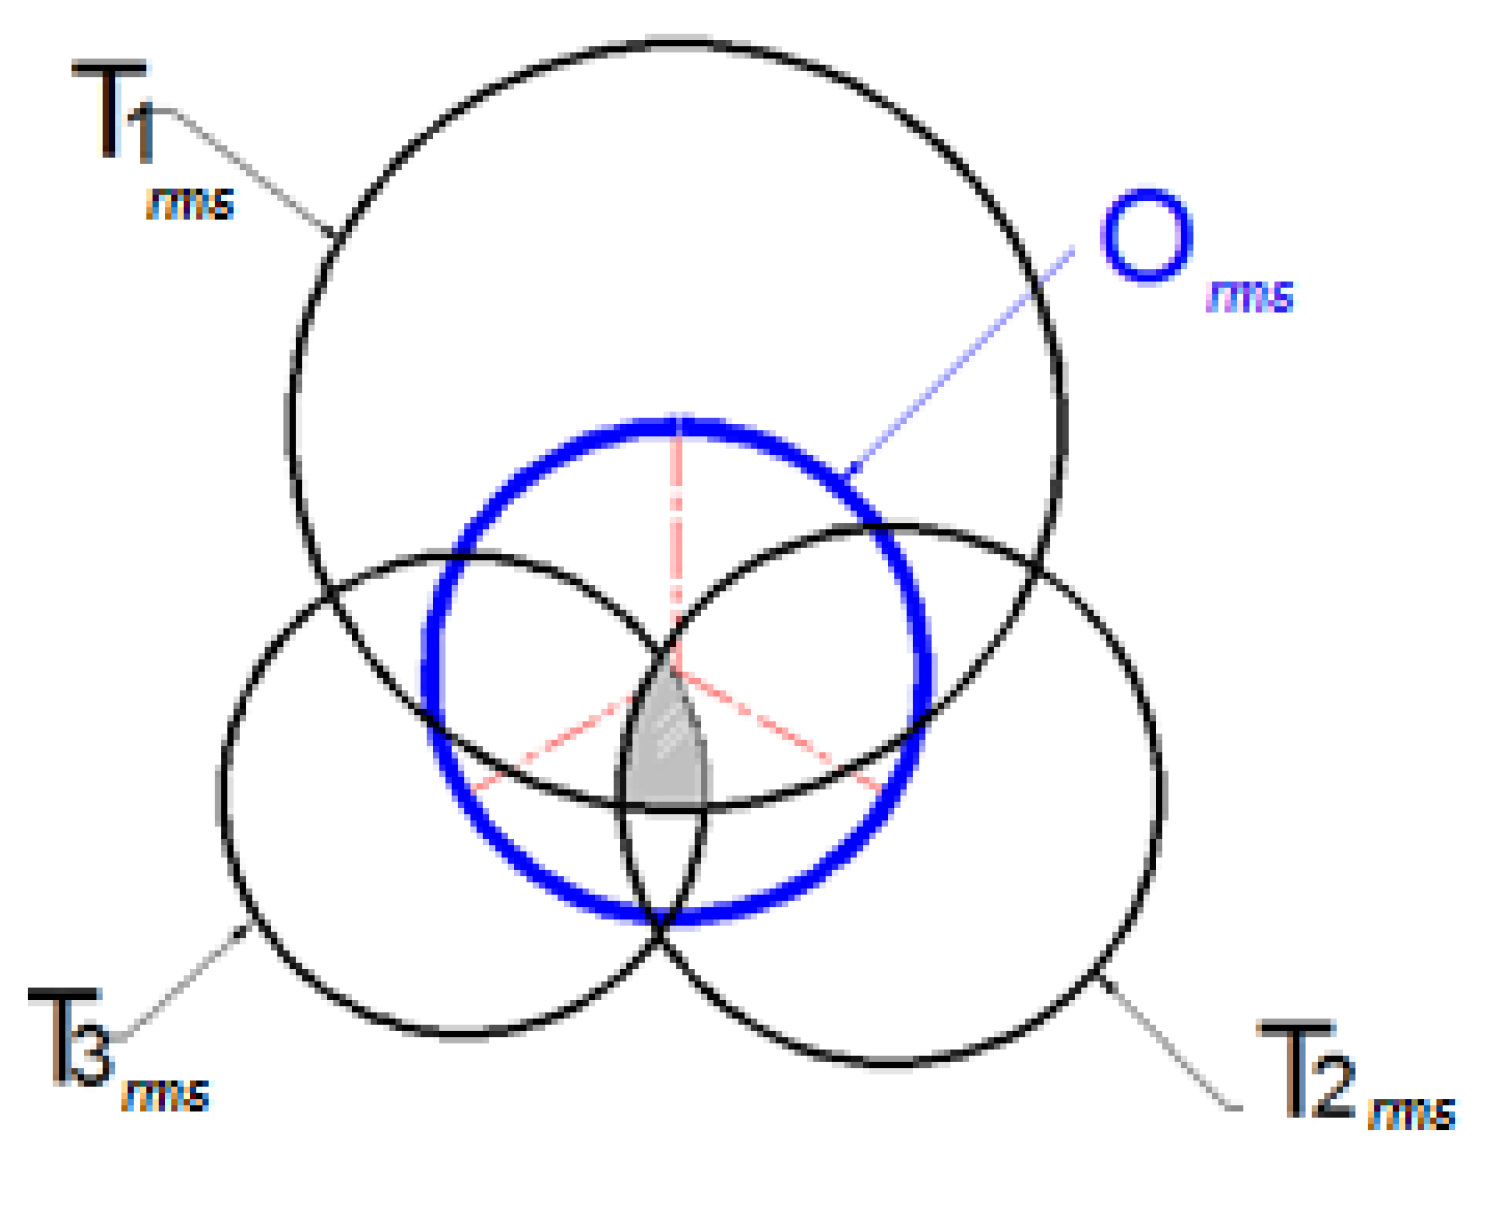
For calculating the position of a correcting mass which can, in principle, along with the zero-angle origin, be arbitrary, the first step is drawing a circle with the radius at the rms value of the vibration/acoustic response. By connecting the trial mass at zero position and acquiring the response, the next circle is drawn on the perimeter of the first circle at zero degree with the radius equal to the rms value of the second step. The third and fourth circles are drawn on the perimeter of the first circle at and respectively with the rms values related to third and fourth run-up or shut-down tests.
It should be noted that if there is no enclosed area between these four circles, the procedure must be done again with a heavier trial mass. The center of this enclosed area between circles is an important point to calculate the position and the final mass of the correcting mass. A schematic of drawn circles is shown in Figure 4 and related information as listed in Table 1. This schematic format is used to present the results of the experimental tests in this paper for both vibration and acoustic responses.
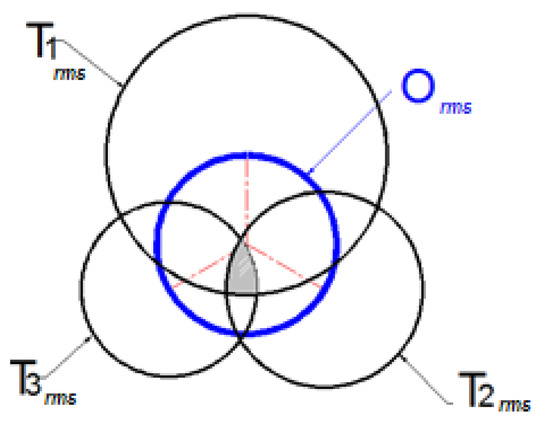
Figure 4.
Schematic of drawn circles from vibration or acoustic response assessment. See text for description and explanation of various circles. The final reference point is located at the center of the grey shaded area.

Table 1.
The measurement parameters.
It should be added that, although the position of the trial mass at the second Run-up or Shut-down test is completely arbitrary, after selecting a zero angle the following positions are located based on this zero-angle point.
2.2. Case Study Setup
The case study example comprises a 750-Watt double plate grinding machine where the grindstone is replaced by a graded aluminum disk (aluminum series 5000), Figure 5. The maximum rotating speed for the machine is 3000 RPM. Since this machine is a very common rotary multi-plate device which has a wide range of industrial applications, manned by one person and works under different speeds and loads, this type and size of rotary machine was selected as the case study. In principle, the methodology expressed here can be extended to much larger or faster rotating machines but in these cases assessing the appearance of critical speeds may be difficult and the use of acoustic microphones may not be relevant due to directivity for a large radiating plate and higher frequency sound radiation modes. The disk has a thickness of 10 mm, an outer diameter of 150 mm and an inner diameter of 35 mm. The plate is drilled at two different radii of 50 and 100 mm, each 30 degrees from the 0-degree line. The accelerometer sensor was PCB-352C33 type (103.7 mV/g), the 1/2” microphone PCB-HT378B20 (50 mV/Pa) and the data acquisition (DAQ) system is a NI-PXI-4462 unit (National Instruments, Tehran, Iran). The data acquisition rate was set to 2000 samples per second (2000 Hz). According to the Nyquist Criterion, the sampling rate results to observer frequencies less than 1000 Hz, and measurements were performed so that a frequency resolution down to 0.3 Hz was possible. In some measurements it was not possible to achieve this fine resolution even after many attempts but the best possible frequency domain results, in terms of resolution, are shown here.
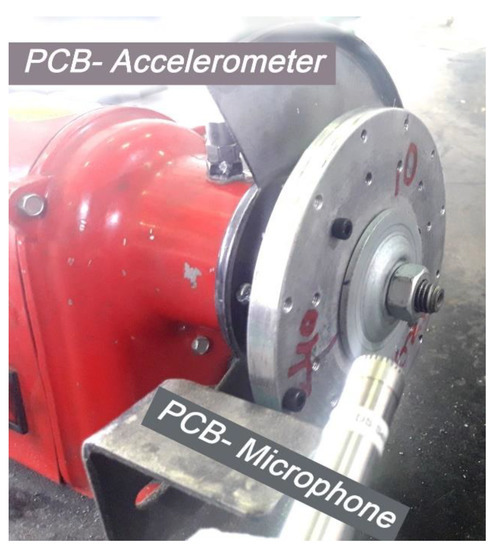
Figure 5.
Test setup showing the rotating machine with accelerometer placed on the top and microphone placed approximately 100 mm from the grinder surface.
3. Results
Before presenting the results of the experimental balancing process, as the first and main assumption, it is critical to ensure the load of the machine during the balancing process is set constant for all phases of the procedure. It should also be noted well that by filtering, such as high order, low or band pass filters, the effect of ambient noise can be neglected unless there is a nearby noise source radiating at a critical frequency, in which case it should be switched off. Here, the Blackman–Harris windowing and low-pass filter at 200 Hz were employed.
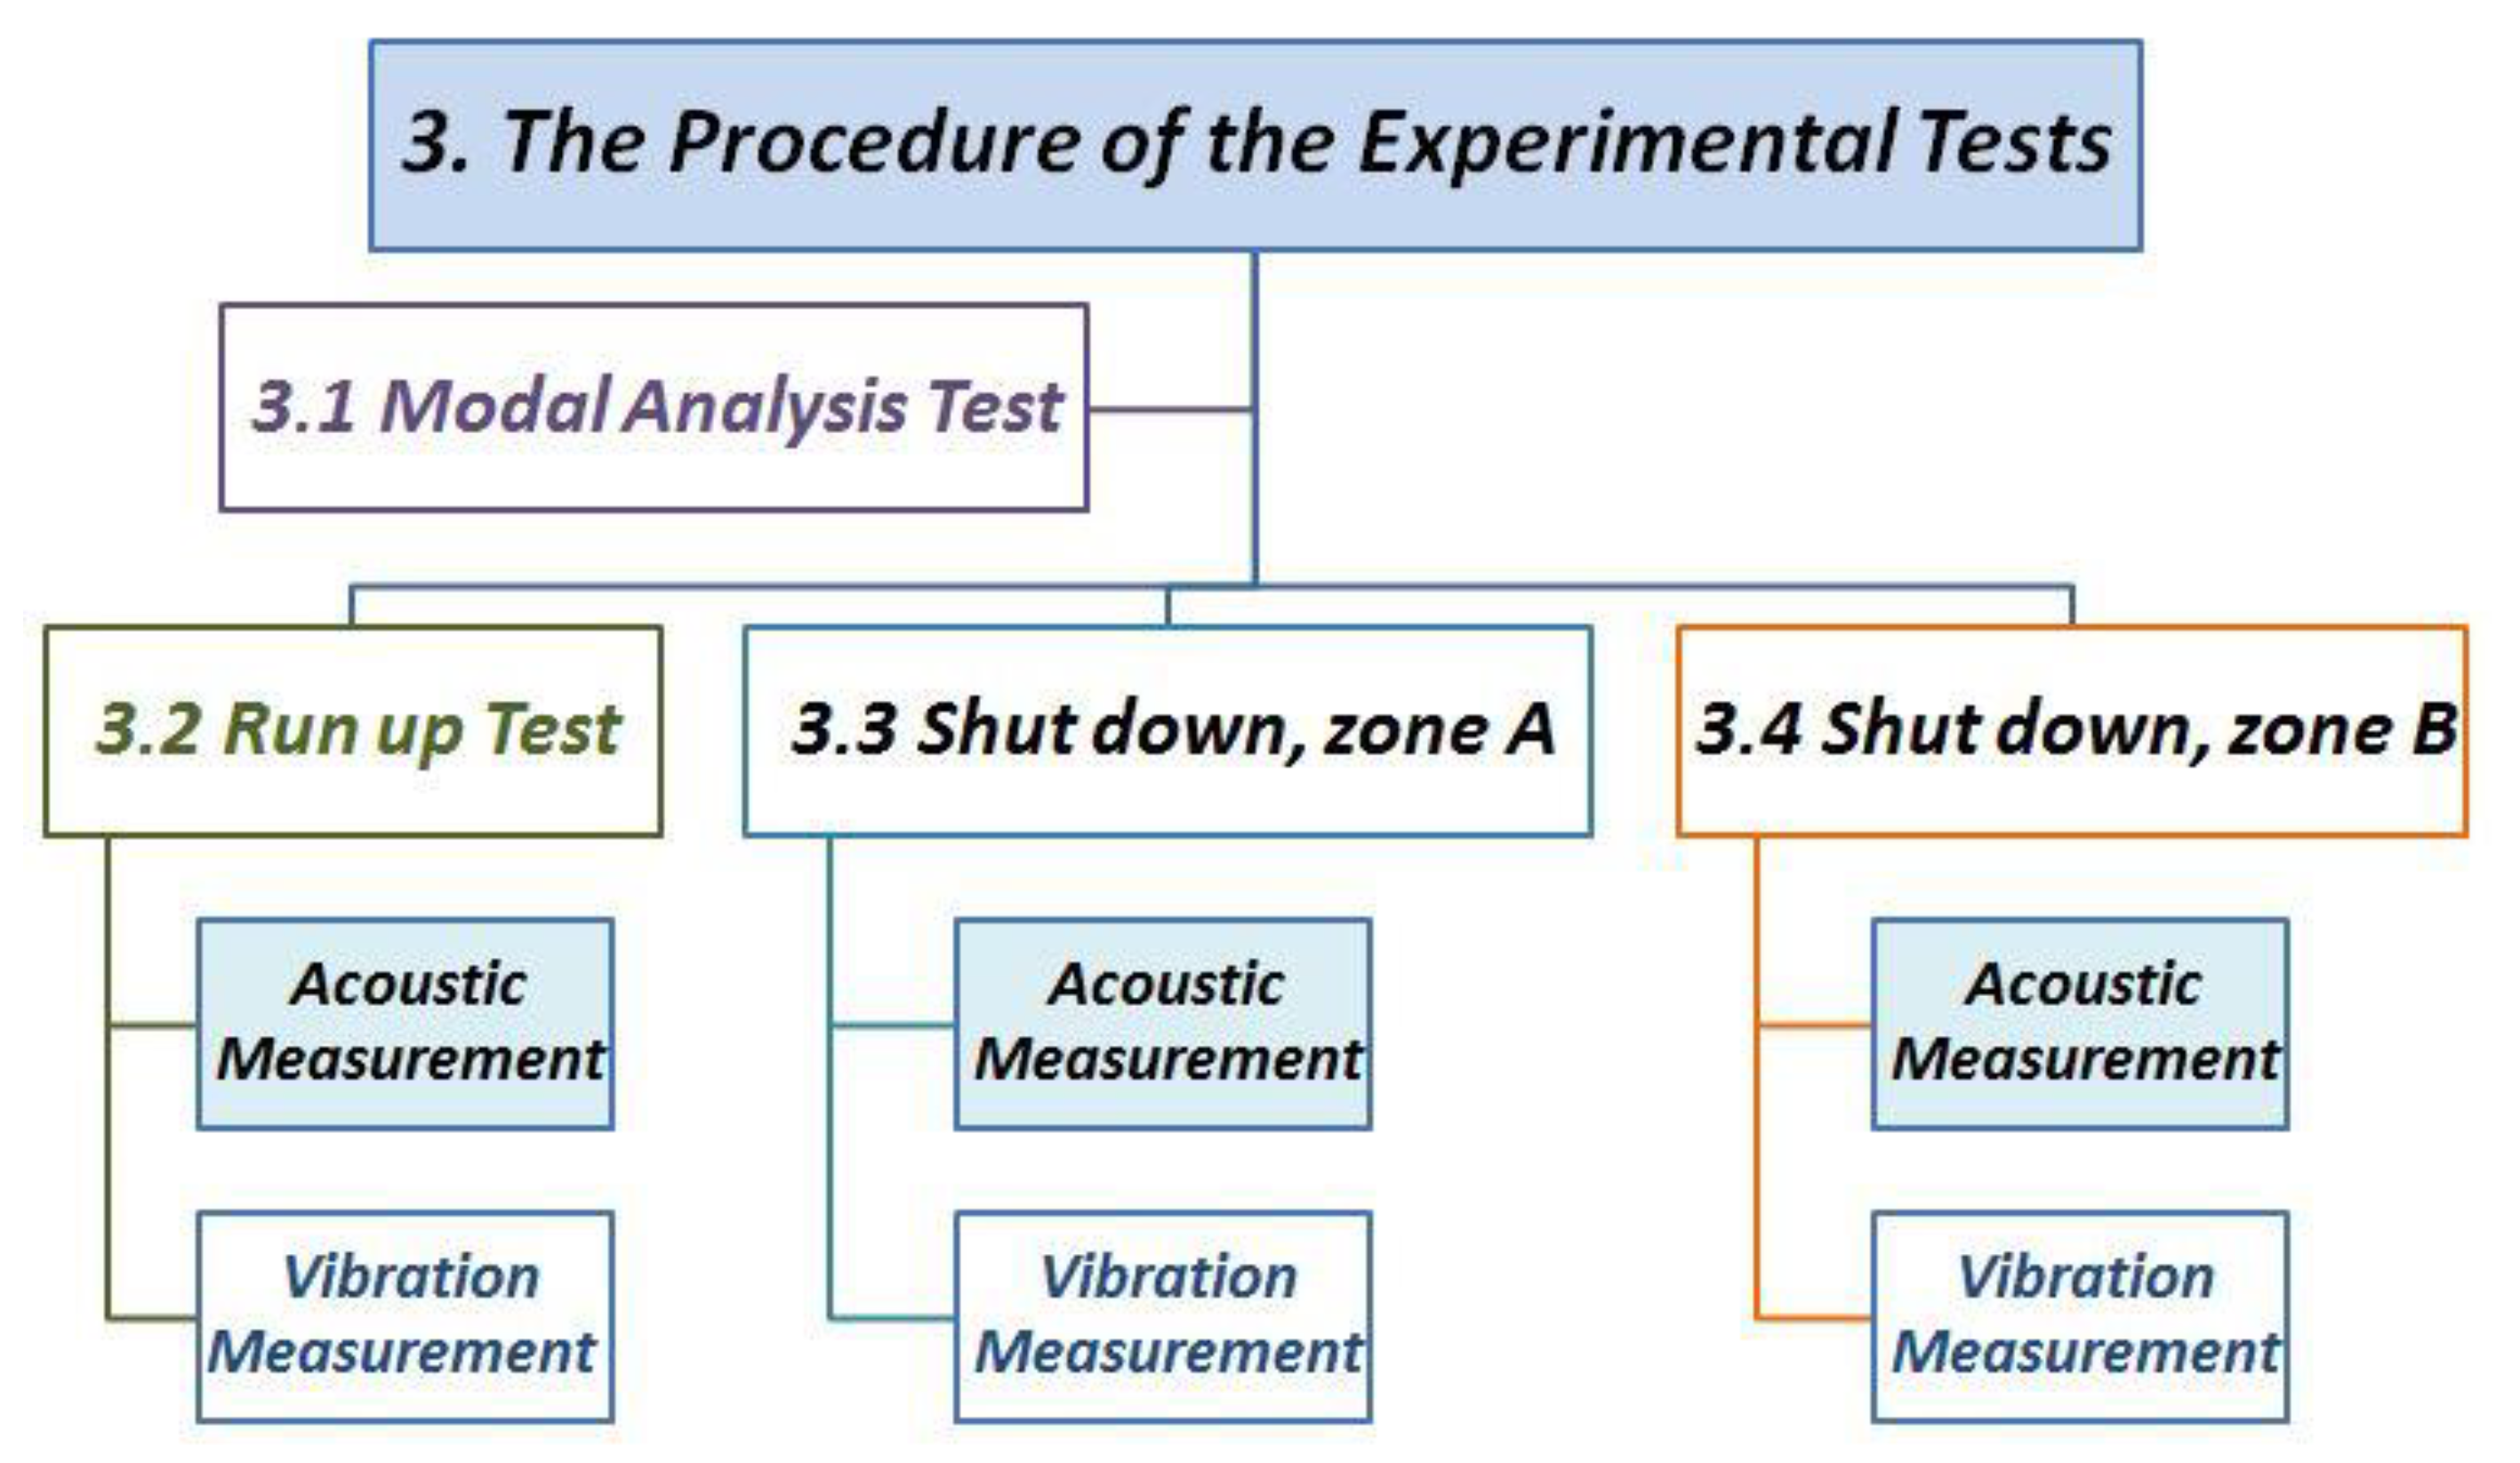
As shown in Figure 6, the test procedure is divided into different steps. The results of the preliminary modal test are presented in Section 3.1 and the PPCS experimental measurements and results for the device run-up are given in Section 3.2. Respectively, the results related to the shut-down process in zones A and B are highlighted in Sections 3.3 and 3.4. Note that the shut-down procedure is commonly performed in two stages.
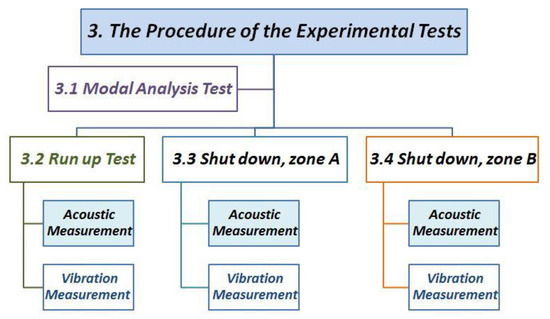
Figure 6.
The experimental test procedure, from vibration modal analysis test to the three testing stages, run-up, shut-down Zone A and shut-down zone B.
It should be noticed that these three types of proposed PPCS methods including run-up, shut-down in zone A and shut-down in zone B, Figure 2, are run in parallel. This means all variants of the methods would result in the same correcting mass and position.
3.1. Modal Analysis Test
In this section, results are presented from a simple (one accelerometer) modal analysis test conducted on the machine where the unit is in switched off mode. An impulse- response method has been employed, Shamsah et al., [27] and Sinha et al., [36], in order to obtain the first few natural frequencies. By using a hard plastic-tip impact hammer, the machine has been excited in the frequency range of interest.
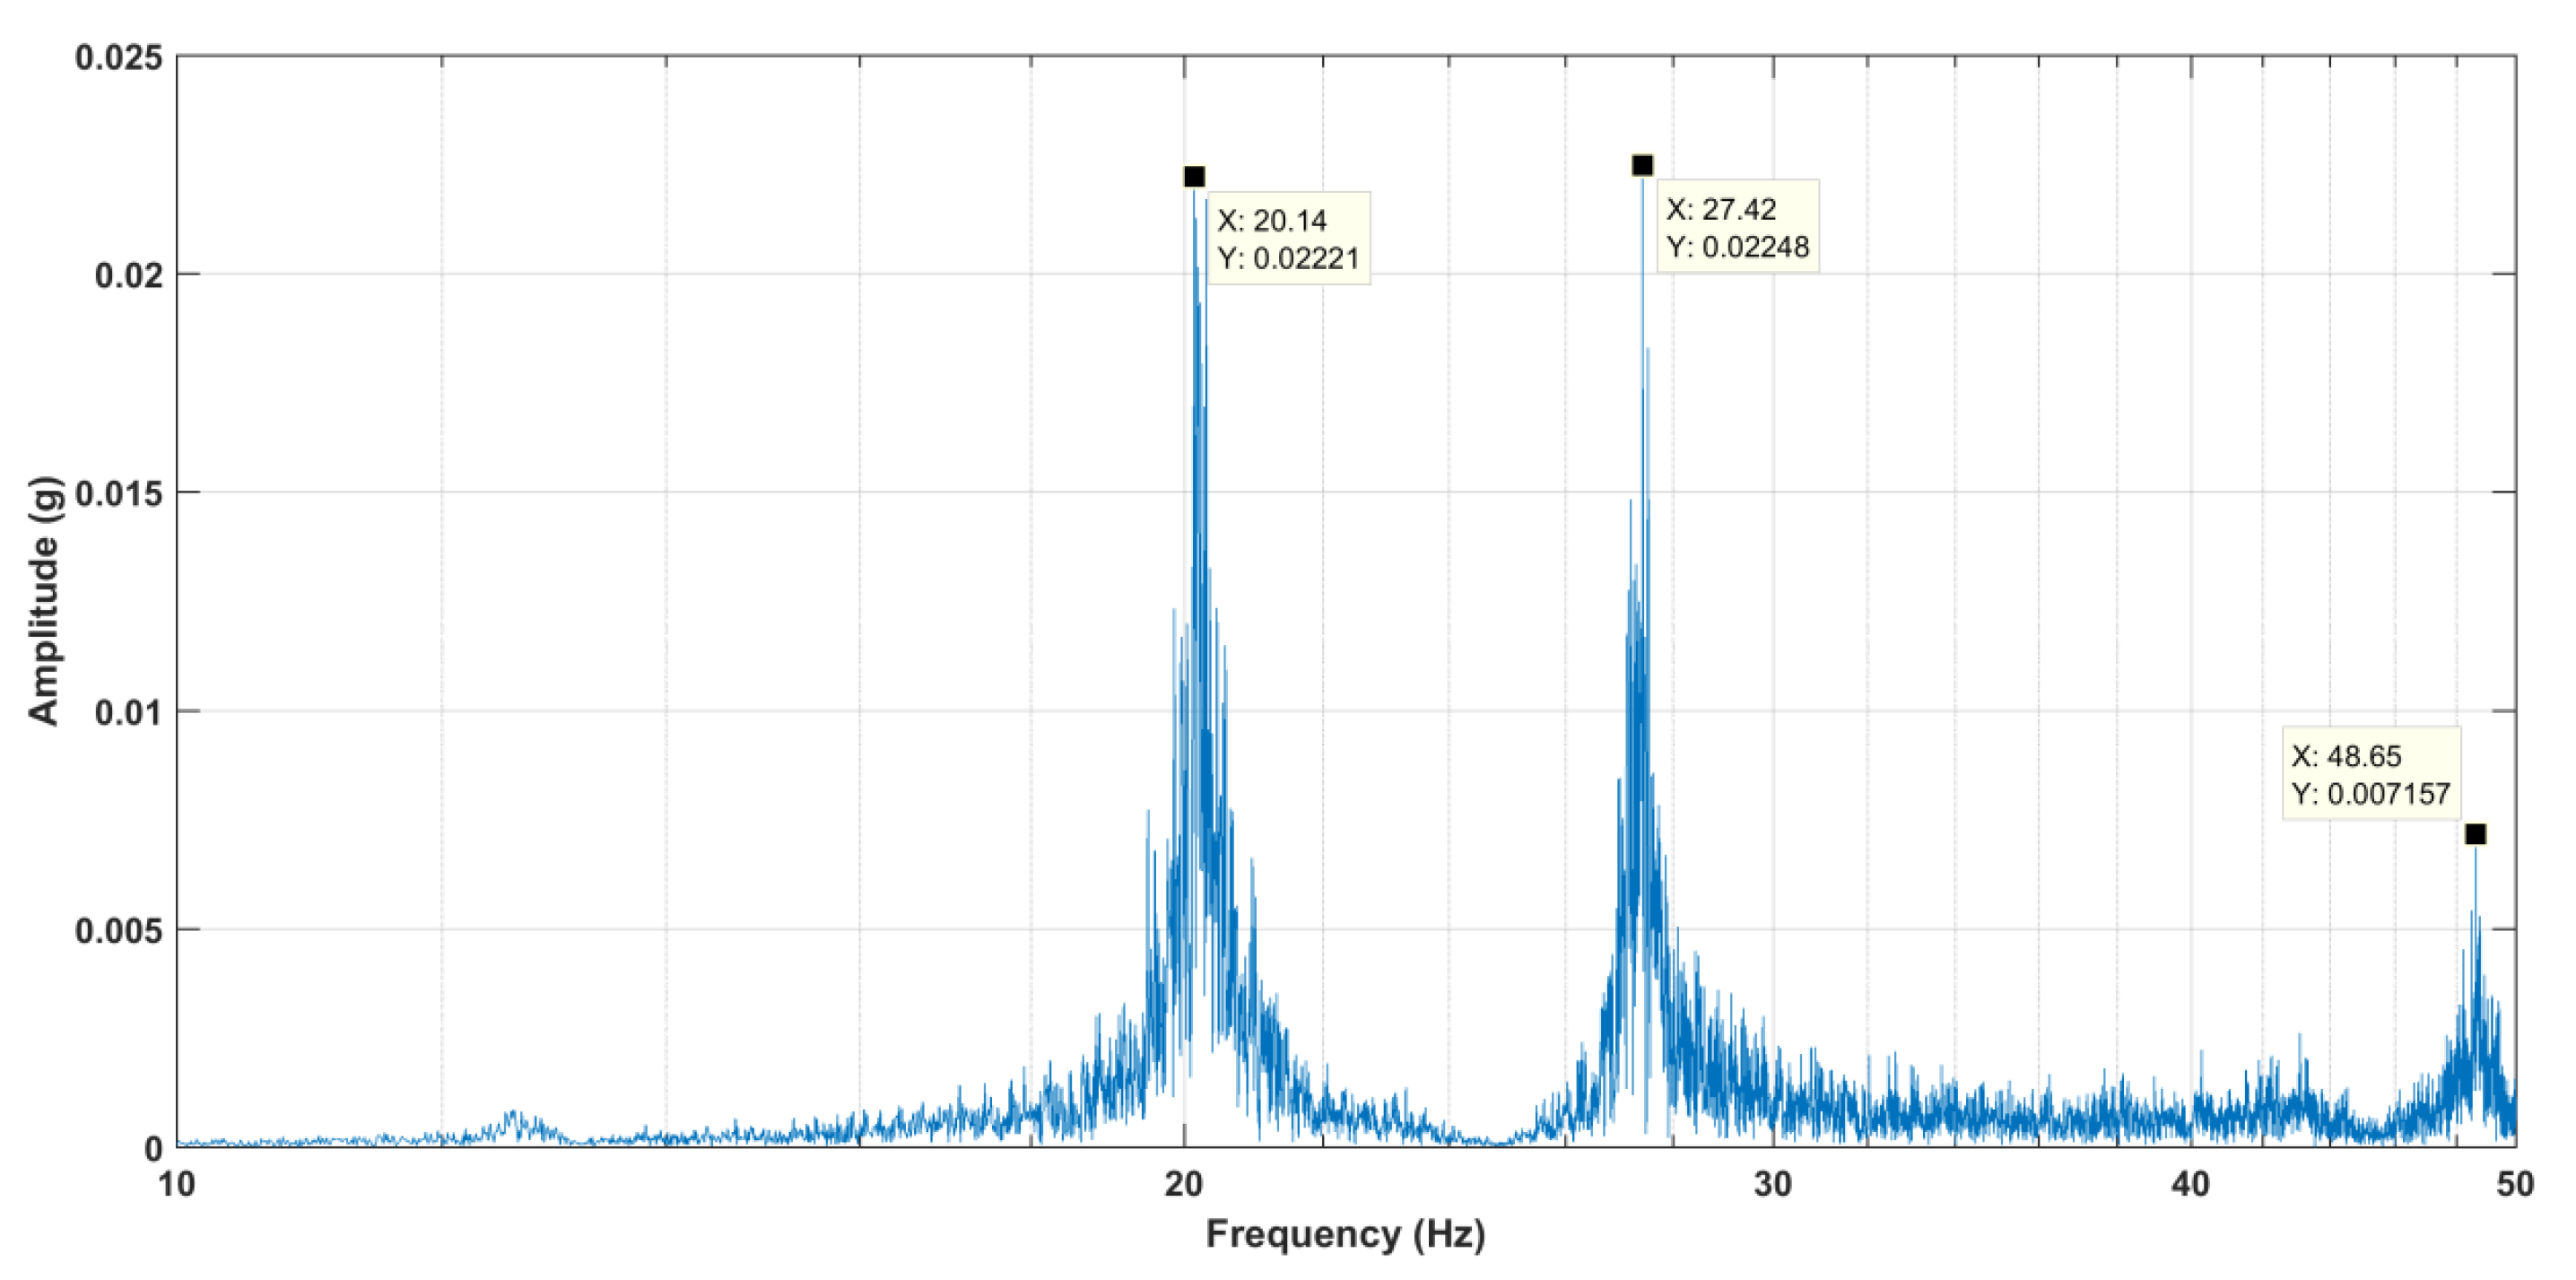
Figure 7 presents the identified natural frequencies and Table 2 lists the natural frequencies and their associated critical speeds in RPM.
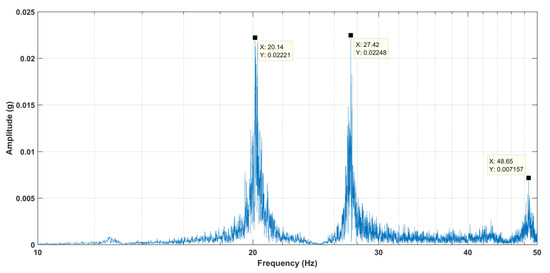
Figure 7.
Results for a simple vibration modal test. An impact hammer and one accelerometer employed, see Figure 5 for position of accelerometer.
Table 2.
Natural frequencies and related critical speeds resulting from modal analysis test.
3.2. Experimental Results
In this part of the study, the run-up state of the machine under study, Figure 5, is assessed. The first three critical speeds excite the object at the first three resonant frequencies in sequence. According to the proposed PPCS method presented earlier, the responses of the machine between the peaks of the first and third critical speeds studied. At the first step, the rotating machine should be started in original condition and after reaching a specific speed which is higher than the third critical speed is then switched off. Then the rms values of the vibration and acoustic responses can be determined during the selected time. As mentioned earlier, the placement of accelerometer or microphone must be fixed during all steps of the test to ensure valid results. The results of the first run-up in addition to the results of the remaining runs in the presence of a 1.6 g trial mass installed at three angular positions of 0, and are presented in Table 3.
Table 3.
The measured parameter in the run-up test.
This table presents the vibrational and acoustical results of the run-up test. By running the machine without the trial mass, the rms value of the vibration is 0.3544 grms and it corresponds to an acoustical pressure of 0.2886 Parms. Adding the trial mass in a 0-degree position (12 O’clock) results in the rms value of the vibrational response decreasing to 0.3280grms, equivalent to the acoustic response of 0.2540 Parms. By rotating the trial mass to 4 O’clock position, the vibration of the machine increased to 0.6639grms and the acoustical response rose from 0.2540 Parms to 0.5472 Parms. In following step, a decreasing trend could be observed in vibrational and acoustical responses. By rotating the trial mass another 120 degrees, the rms values of the vibrational and acoustical responses acquired 0.3462 grms and 0.2789 Parms, respectively. As shown in Figure 8, the vibration and acoustic response circles are drawn in accordance with the results presented at Table 3.
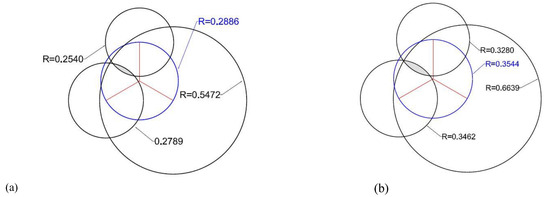
Figure 8.
The response circles based on (a) acoustic, (b) vibration responses for the run-up test.
According to the Four-Run method [32] and the proposed speed-variant PPCS balancing method, the calculated correction mass is 3.2 g and should be installed at 57 counter-clockwise (CCW) degree based on vibration measurements (3.2gr@570) and, by considering the acoustic data, the mass of the correcting mass is 3.2 g at the 55 CCW degree position (3.2gr@550). Finally, the 3.2 g correcting mass was added to the machine at the 10 O’clock position (3.4gr@600). The concluding results after all vibrational and acoustical responses after installation of the correction mass are shown in Table 4. As presented in the table, the rms values of the amplitudes of the vibrational and acoustical responses for the machine have decreased noticeably.
Table 4.
The rms value of the acoustic and vibration response for the balanced case in the run-up.
In this part of the study, the shut-down state analysis of the machine was restricted to zone A, as shown in Figure 2. After reaching a speed higher than the third critical speed, the machine was switched off. The rms values of the vibration and acoustic responses should be determined between the peaks of the third and the second critical speeds. The results of the first shut-down in zone A, in addition to the results of the remaining runs in the presence of a 1.6 g trial mass installed at three angular positions are shown in Table 5.
Table 5.
The measured parameter at the first shut-down test.
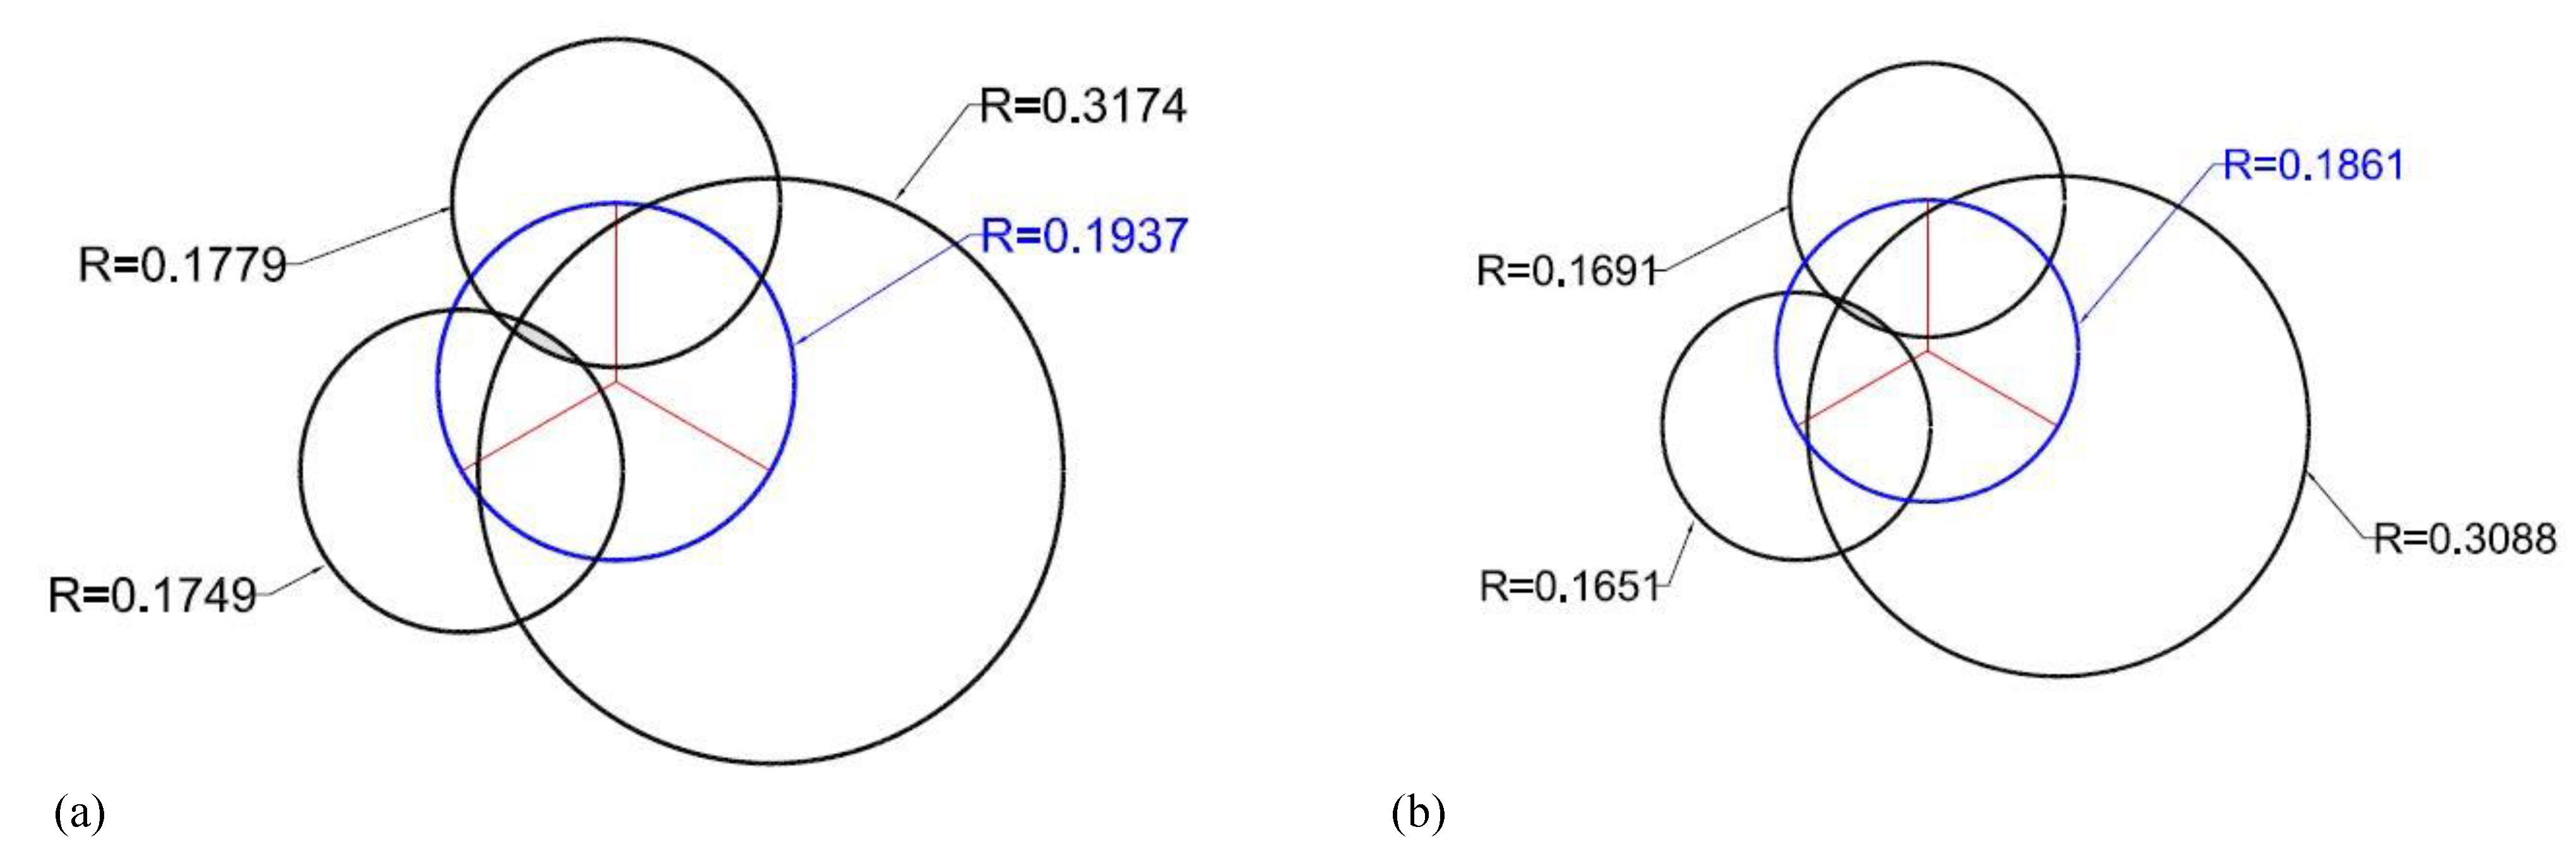
The original RMS value of the vibration response of the rotating machine in the Shut-down test in zone A is 0.1861 grms. The relative value for the acoustic measurements is 0.1937 Parms. Finally, by following a similar procedure for the run-up tests by rotating the trial mass the eventual relevant vibration and acoustic responses to 0.1651 grms and 0.1749 Parms. In Figure 9, the vibration and acoustic response circles are drawn according to the data of the shut-down test in zone A.
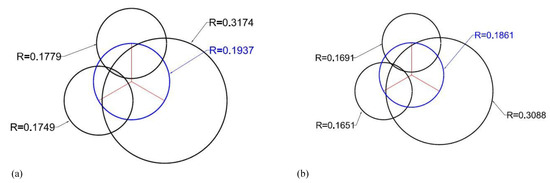
Figure 9.
The response circles based on (a) acoustic, (b) vibration responses for the shut-down test in zone A.
By using the proposed PPCS method, the correcting mass is calculated 3.2 g at position 61 degrees CCW based on vibration response, and the results are the same based on acoustic response (3.2gr@610). Finally, 3.4 g was installed at the 10 O’clock position (3.4gr@600) as the correcting mass. The concluding results of the rms values for the vibrational and acoustical responses, after installation of the correction mass, are shown in Table 6. It is clear the vibrational and acoustical responses of the machine have decreased considerably.
Table 6.
The overall rms acoustic and vibration response magnitudes after completion of the balancing procedure at the shut-down test in zone A.
Now the shut-down stage of the machine is restricted to zone B, where the first and the second critical speeds are excited. For the benefit of the study the rms values for the vibration and acoustic responses are recorded between the peaks of the second and the first critical speeds. The results of the first shut-down test in zone B, in addition to the results of the remaining runs in the presence of a 1.6 g trial mass installed at three angular positions are presented in Table 7.
Table 7.
The measured parameter at the second shut-down test in zone B.
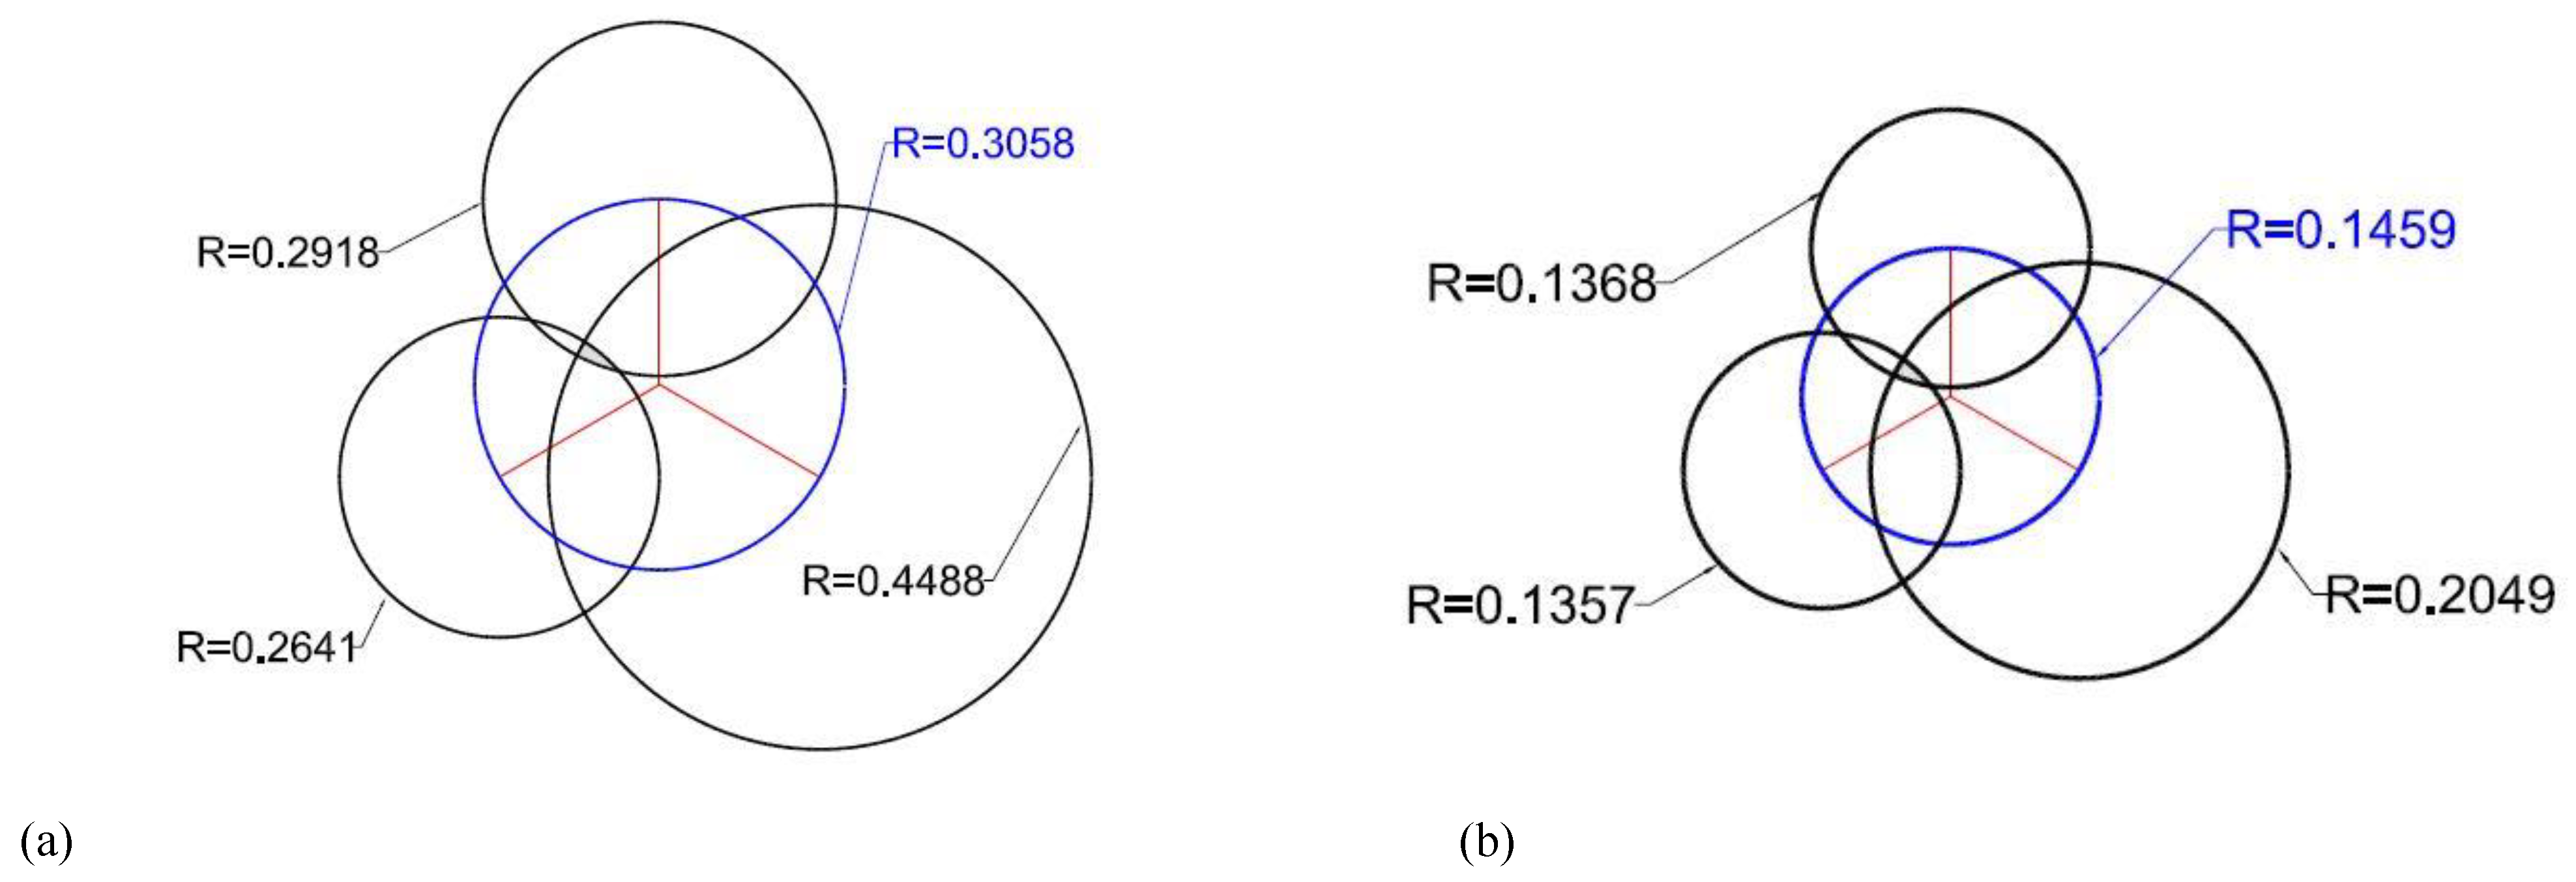
In Figure 10 the vibration and acoustic response circles are drawn according to the data of the shut-down test in zone B.
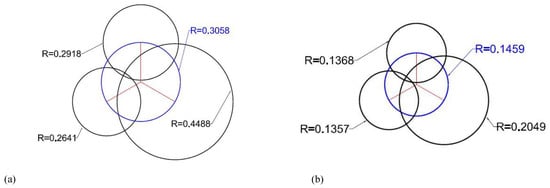
Figure 10.
The response circles based on (a) acoustic or (b) vibration responses for the shut-down test in zone B.
The final values of the root mean square values of the vibrational and acoustical responses after installation of the correction mass (3.4gr@600) are shown in Table 8. It is clearly demonstrated that the residual unbalance is lower than the original and the amplitude of the vibrational and acoustical response for the machine have decreased significantly.
Table 8.
The overall rms acoustic and vibration response magnitudes after completion of the balancing procedure at the shut-down test in zone B.
4. Discussion
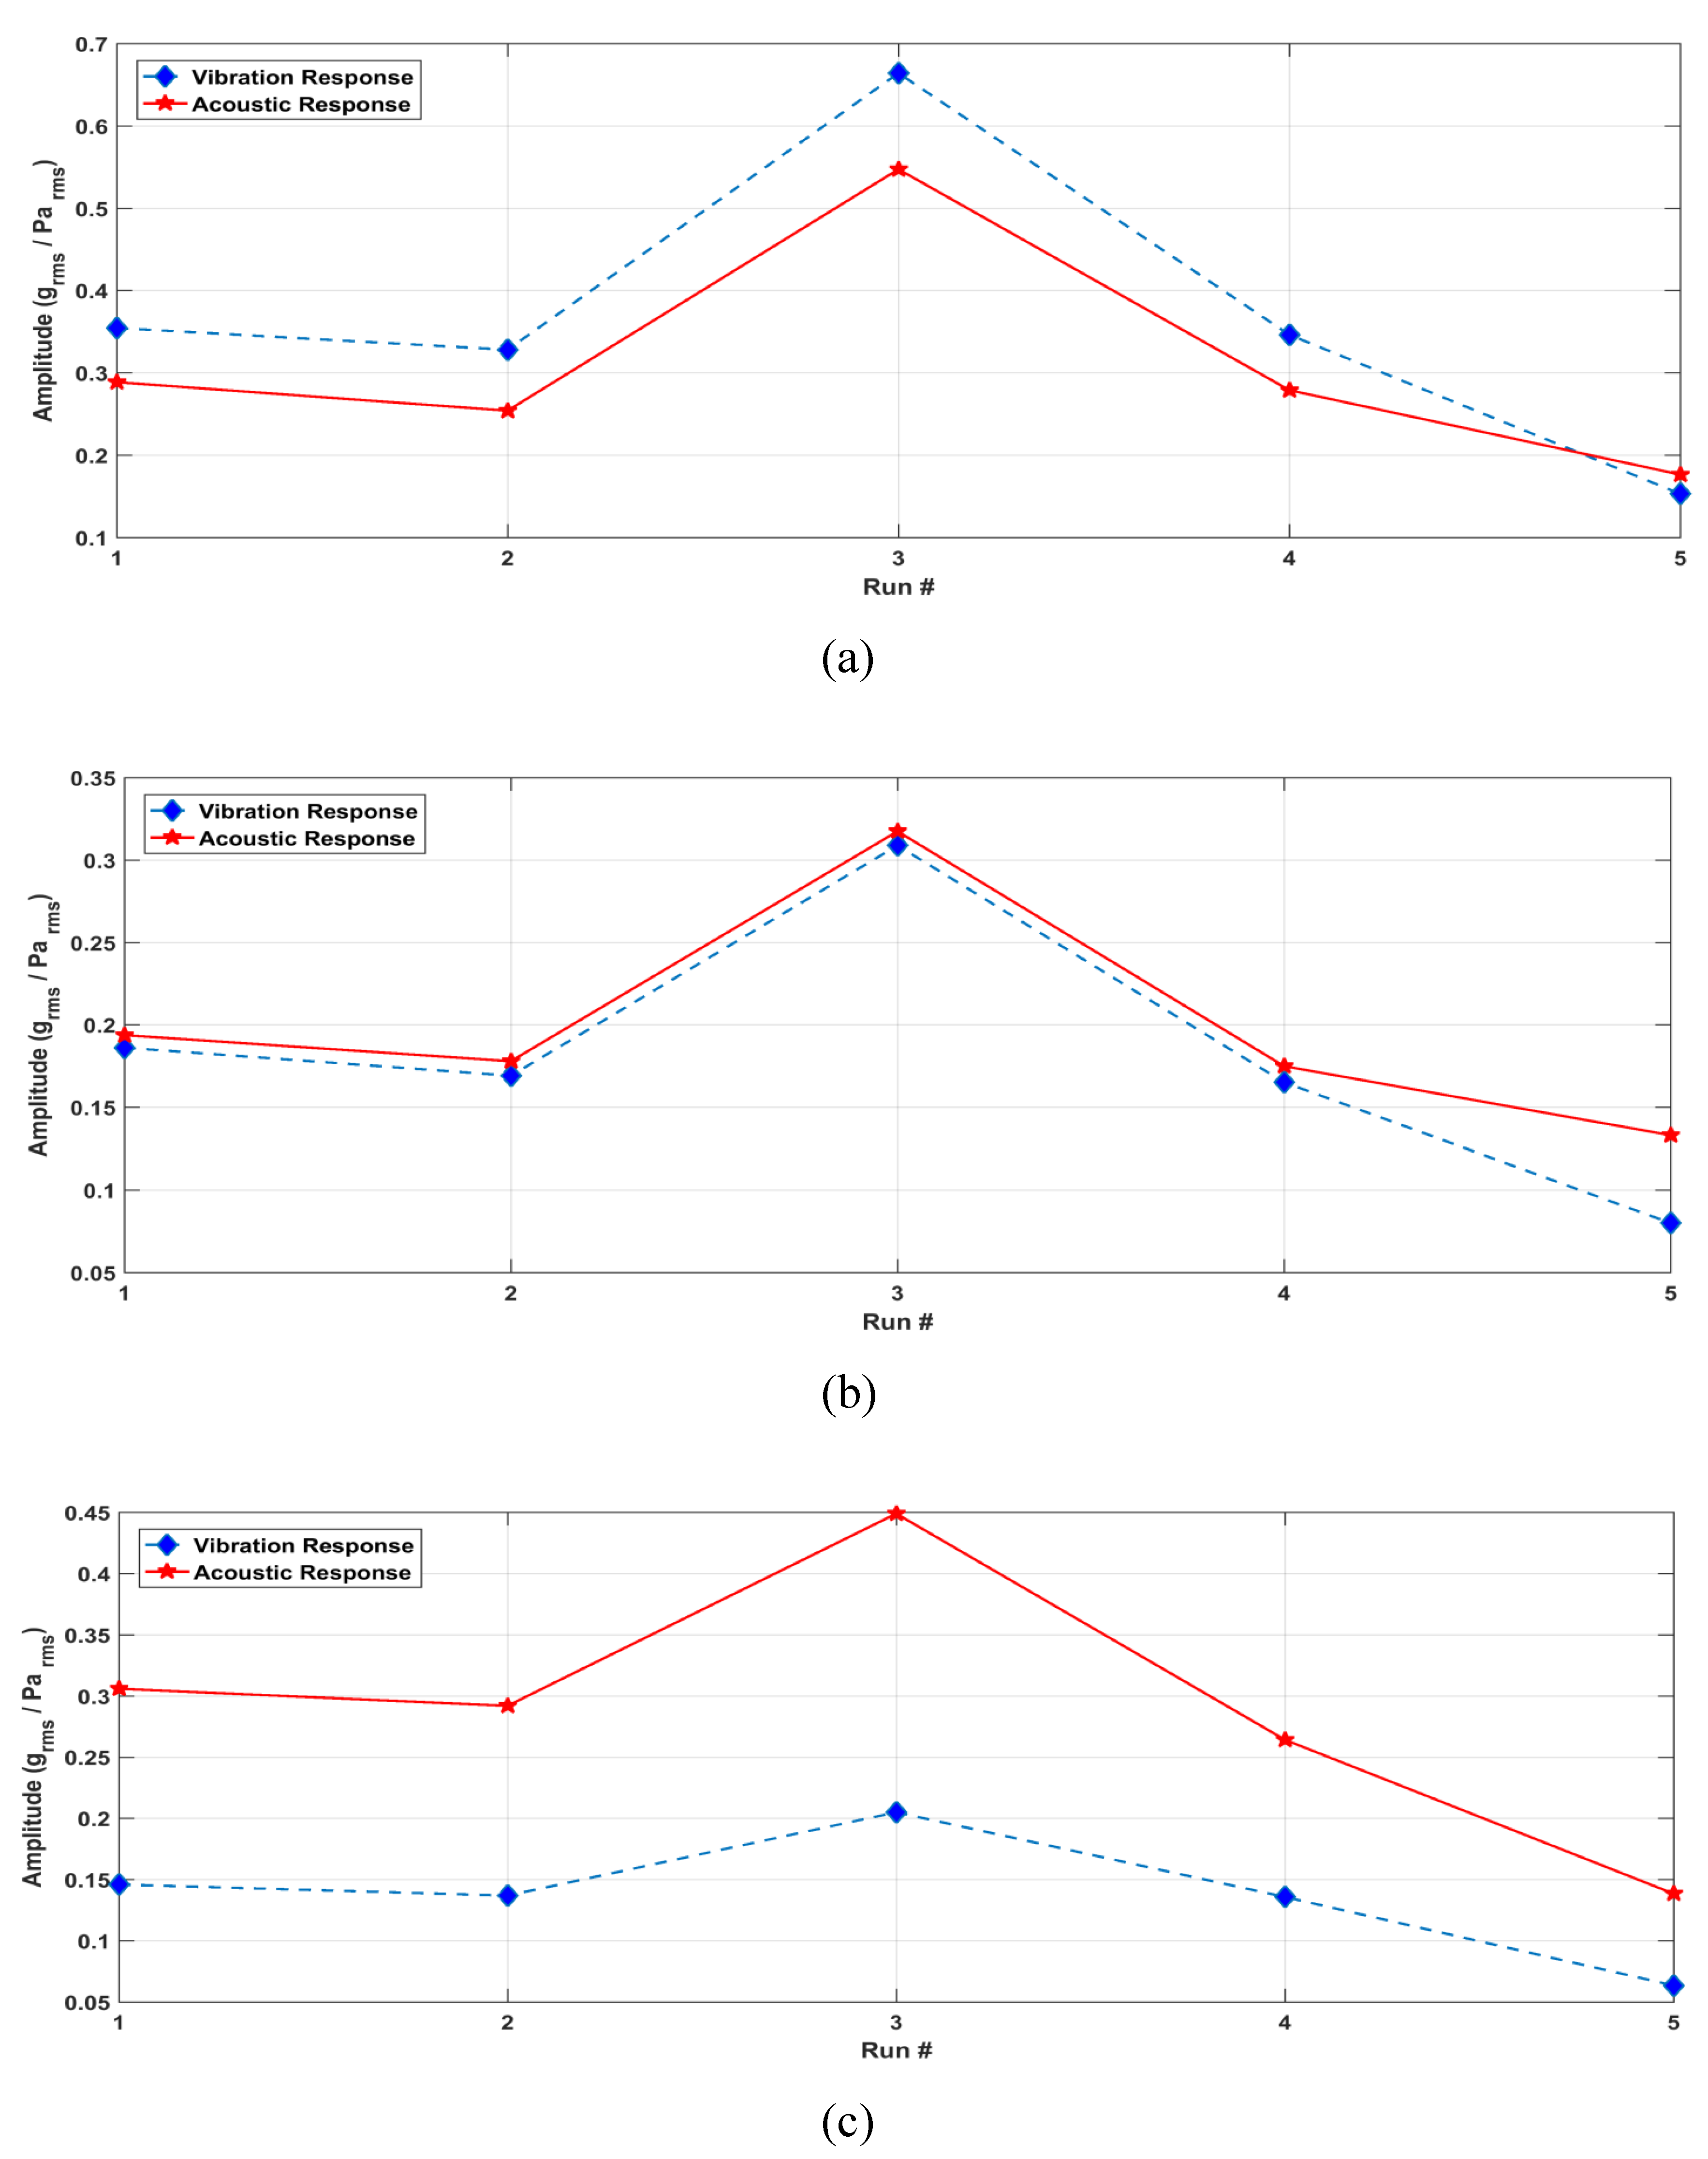
Figure 11 presents the relation for the in run-up, shut-down in zone A and shut-down in zone B stages by using the proposed PPCS balancing method. What is immediately striking is the increase in response value, at first, but this is then followed by an improvement.
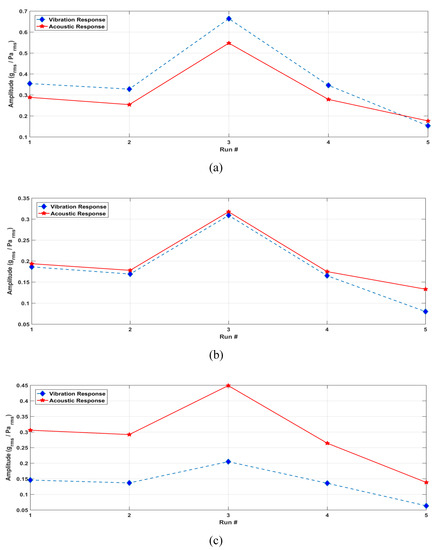
Figure 11.
Comparison of rms vibration and acoustic response behavior at all stages: (a) run-up, (b) shut-down zone A, and (c) shut-down zone B, given by balancing the rotating object case study, Figure 5.
The horizontal axis of Figure 11 signifies the step number of the proposed method where number 1 is a reference to the original working condition. Numbers 2 to 4 are related to the response of the machine after adding the trial mass at the 12, 4 and 8 O’clock positions, respectively. Finally, number 5 represents the responses of the machine after adding the correction mass to the rotating disk. It appears that vibration or acoustic responses speed-variant balancing process follow a similar trend, but beyond this a quantitative analysis is not realistic. Note that the outcome of either process is the removal of operational imbalance, which implies a reduction in vibration response.
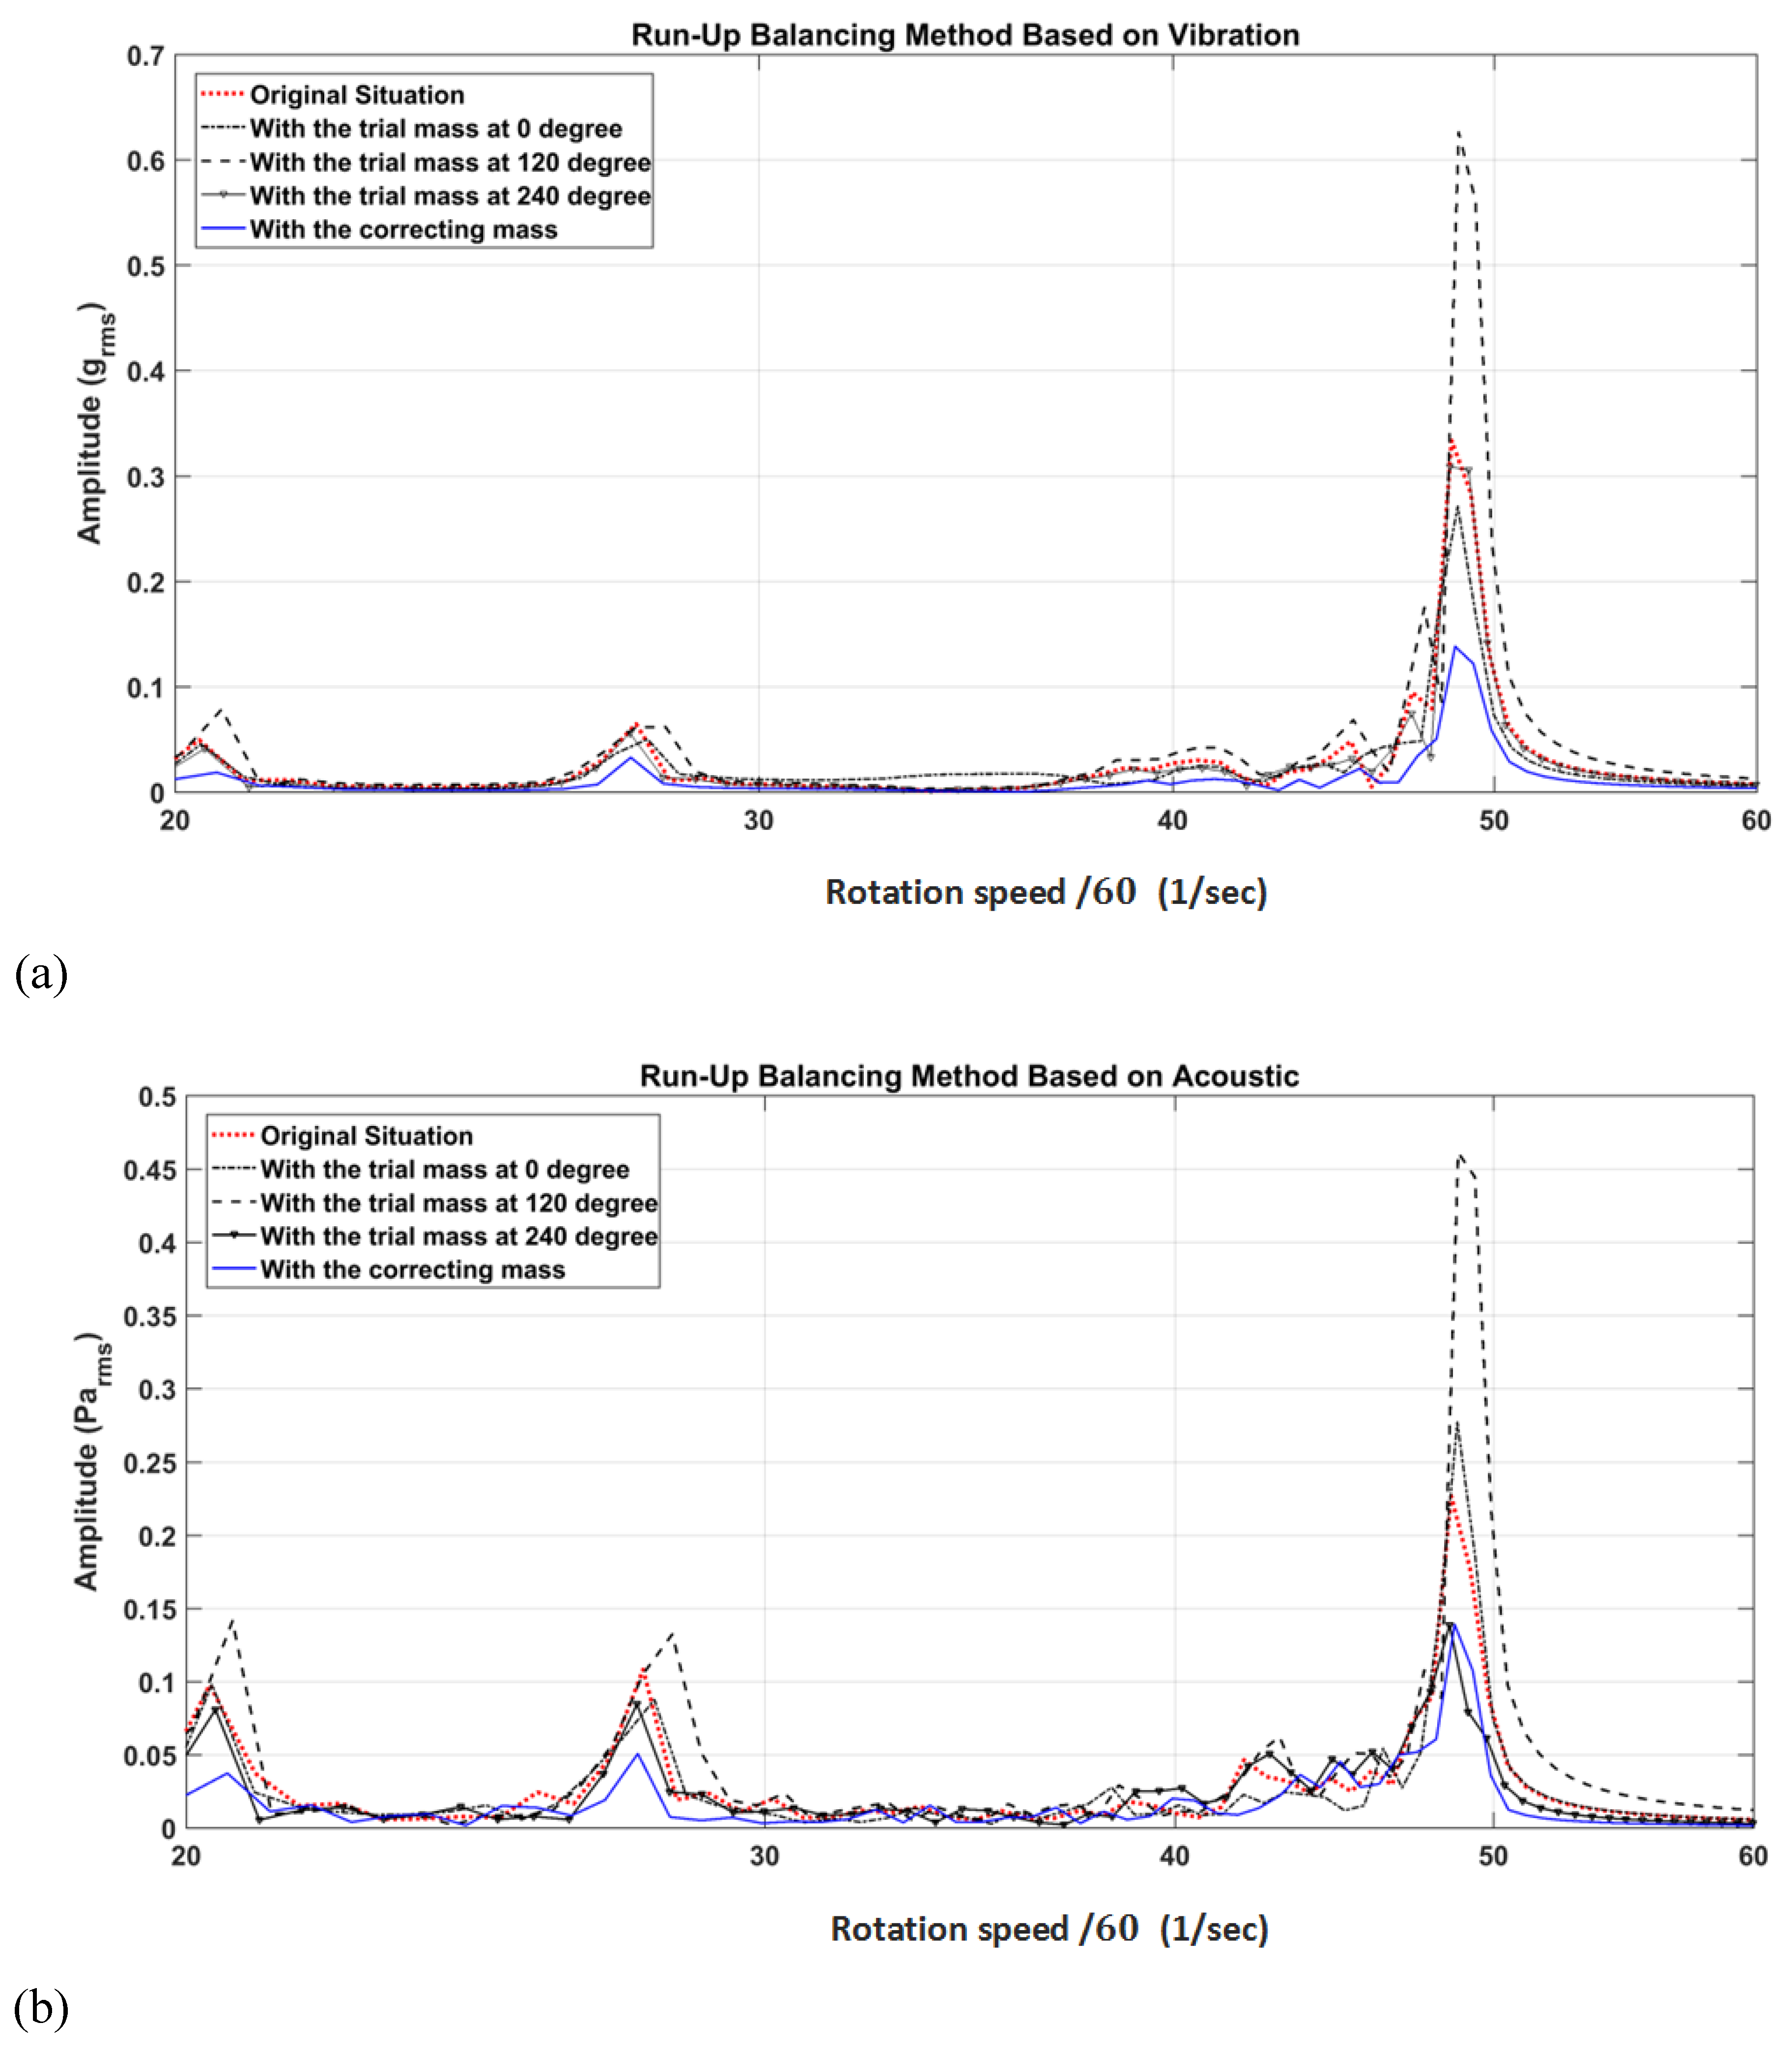
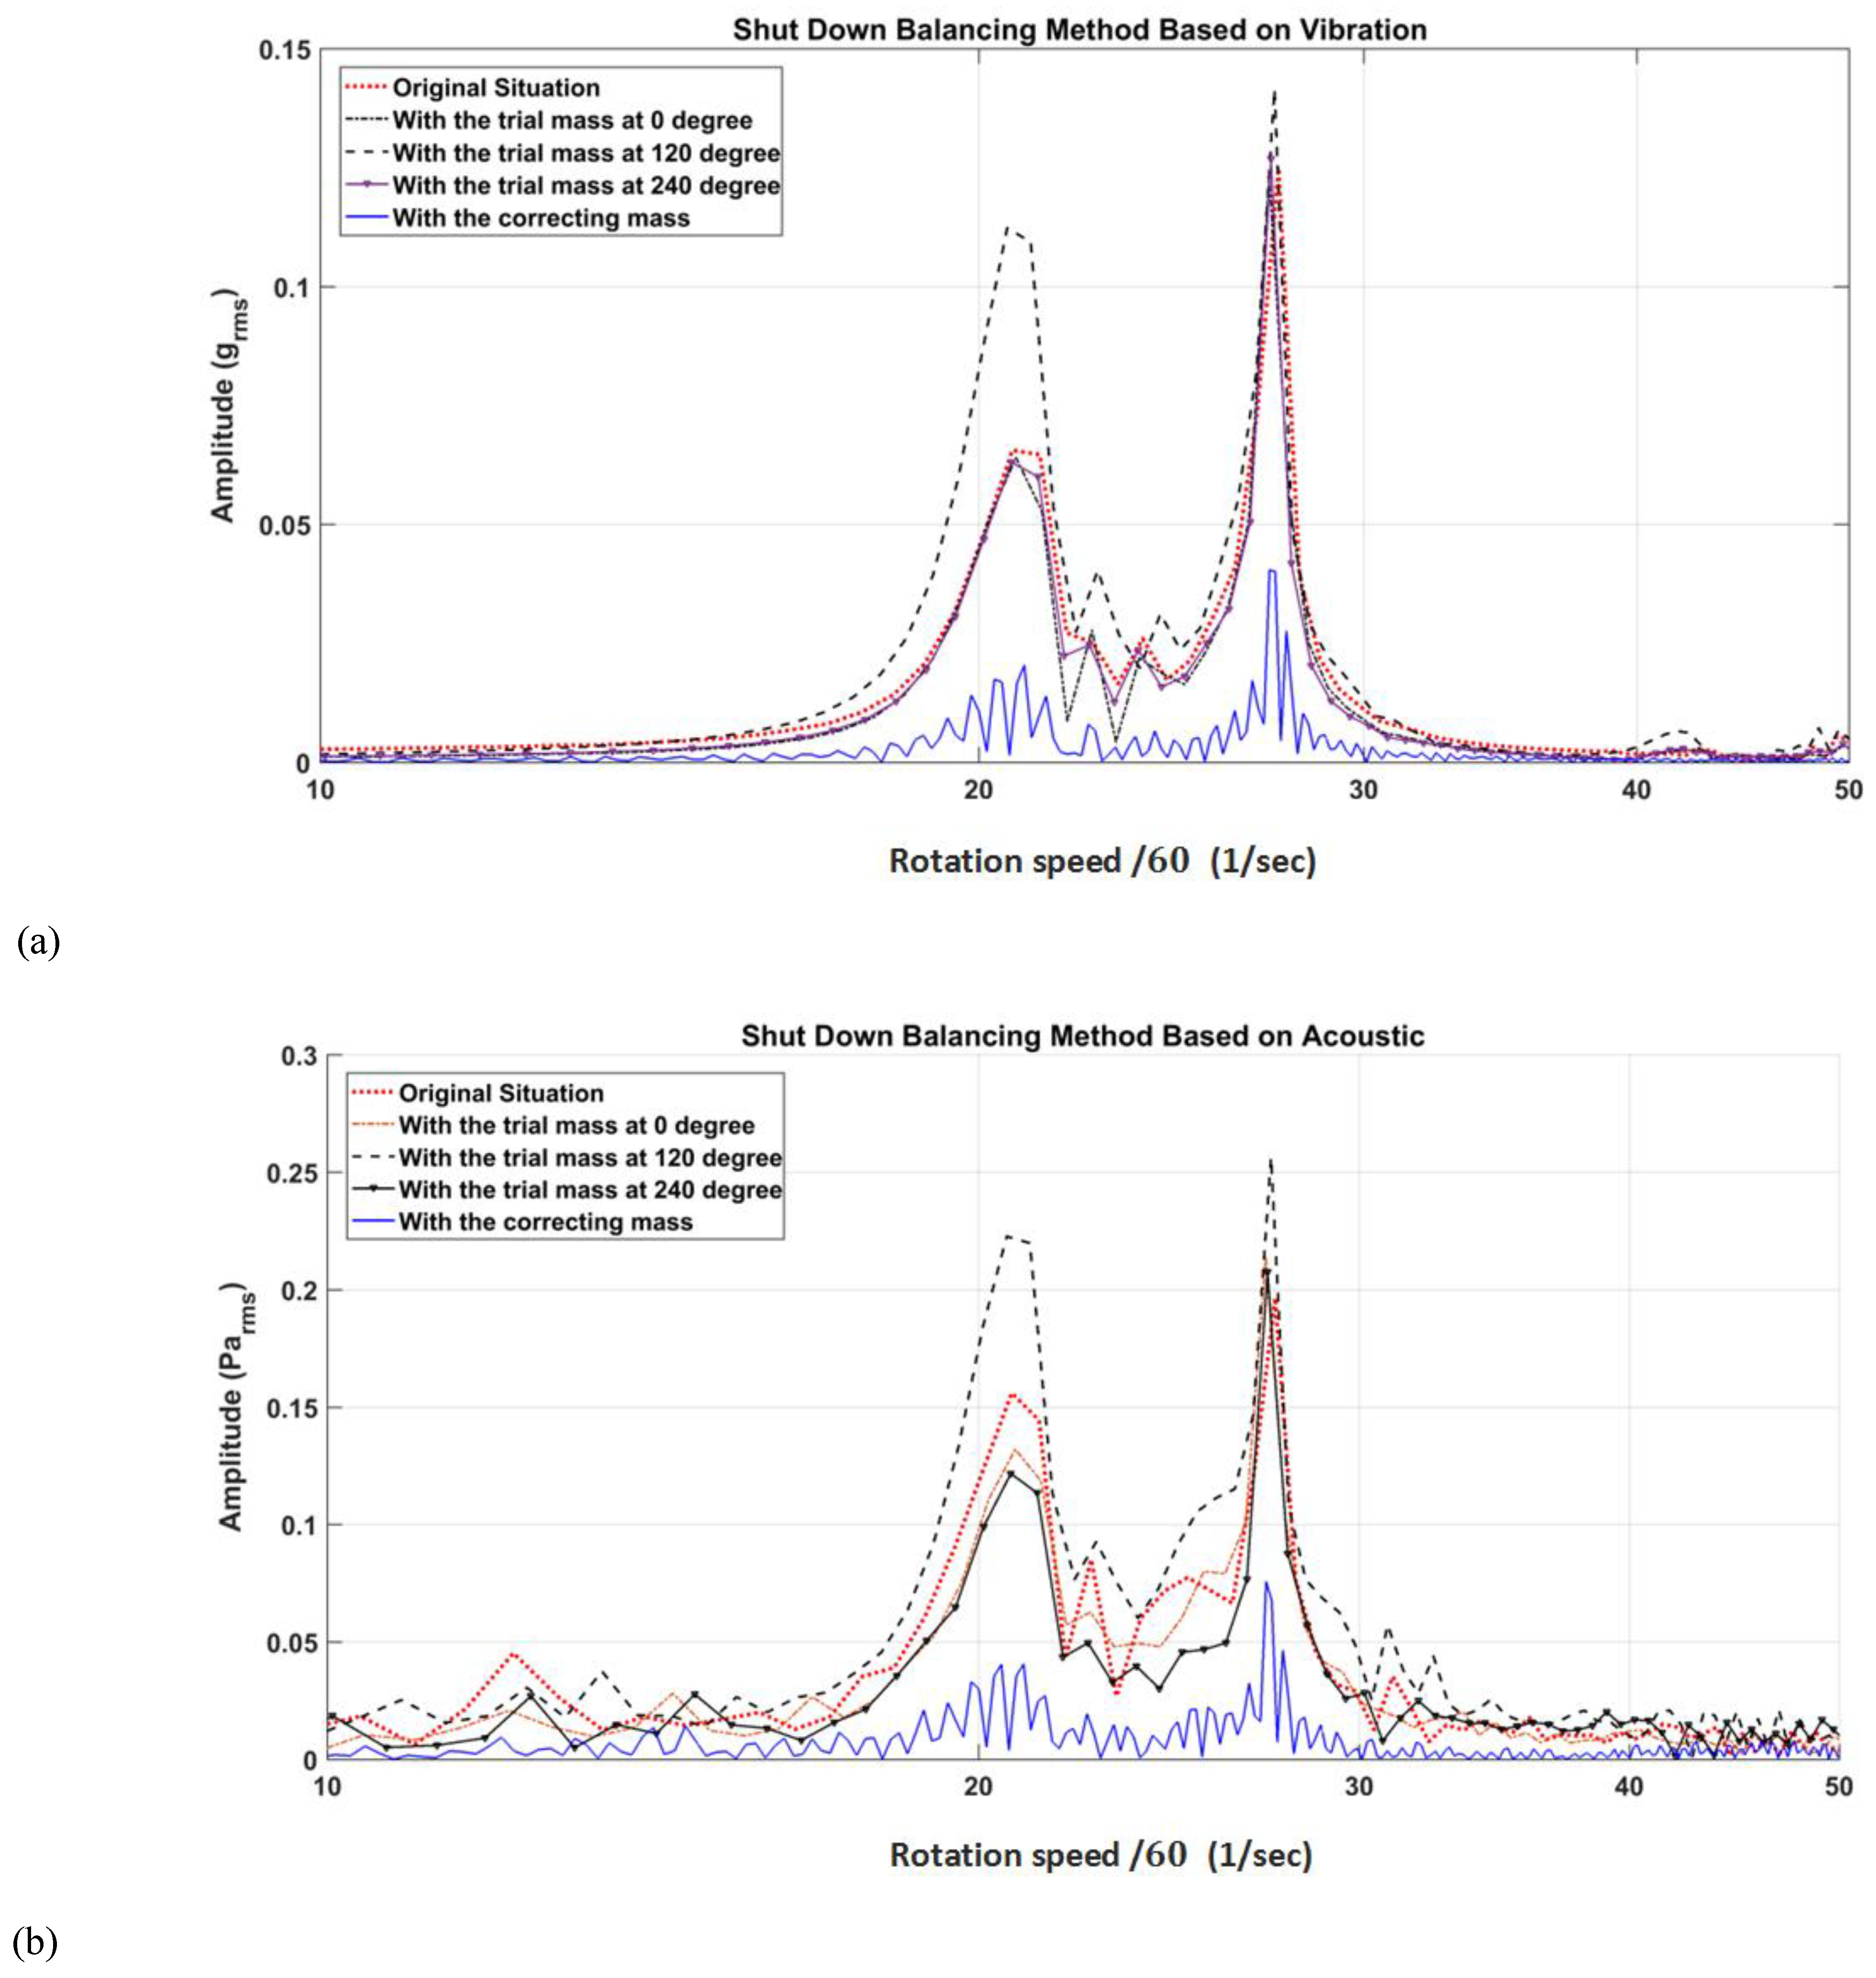
By applying the discrete Fourier operation to the vibration and acoustic responses of the machine, with a frequency resolution of 0.6 Hz, the frequency domain of the acoustic and vibration response for all steps of the proposed PPCS balancing process are presented in the run-up stages in Figure 12. This plot illustrates response against rotation speed/60, which is equivalent to frequency, i.e., number of cycles per second (Hz). Evidence of excitation of the rotating object by all three critical speeds are evident in the plots in both vibration and acoustic measurements. The third resonant frequency causes the most significant deflection. At this frequency reductions of the order of 66% and 50% for vibration response and acoustic responses, respectively, are observed.
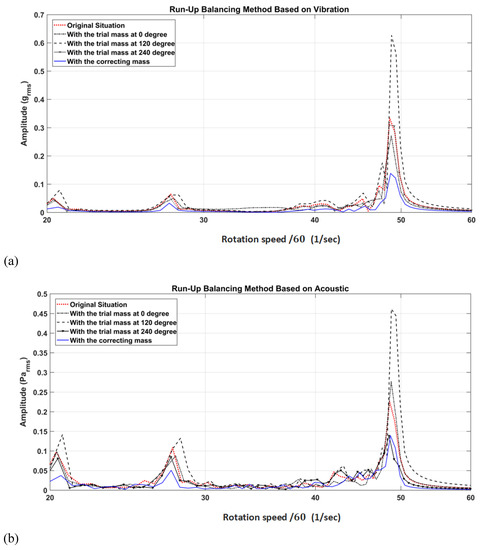
Figure 12.
(a) Acoustic and (b) vibration rms response against rotation speed (equivalent to frequency, Hz) in the run-up stage test.
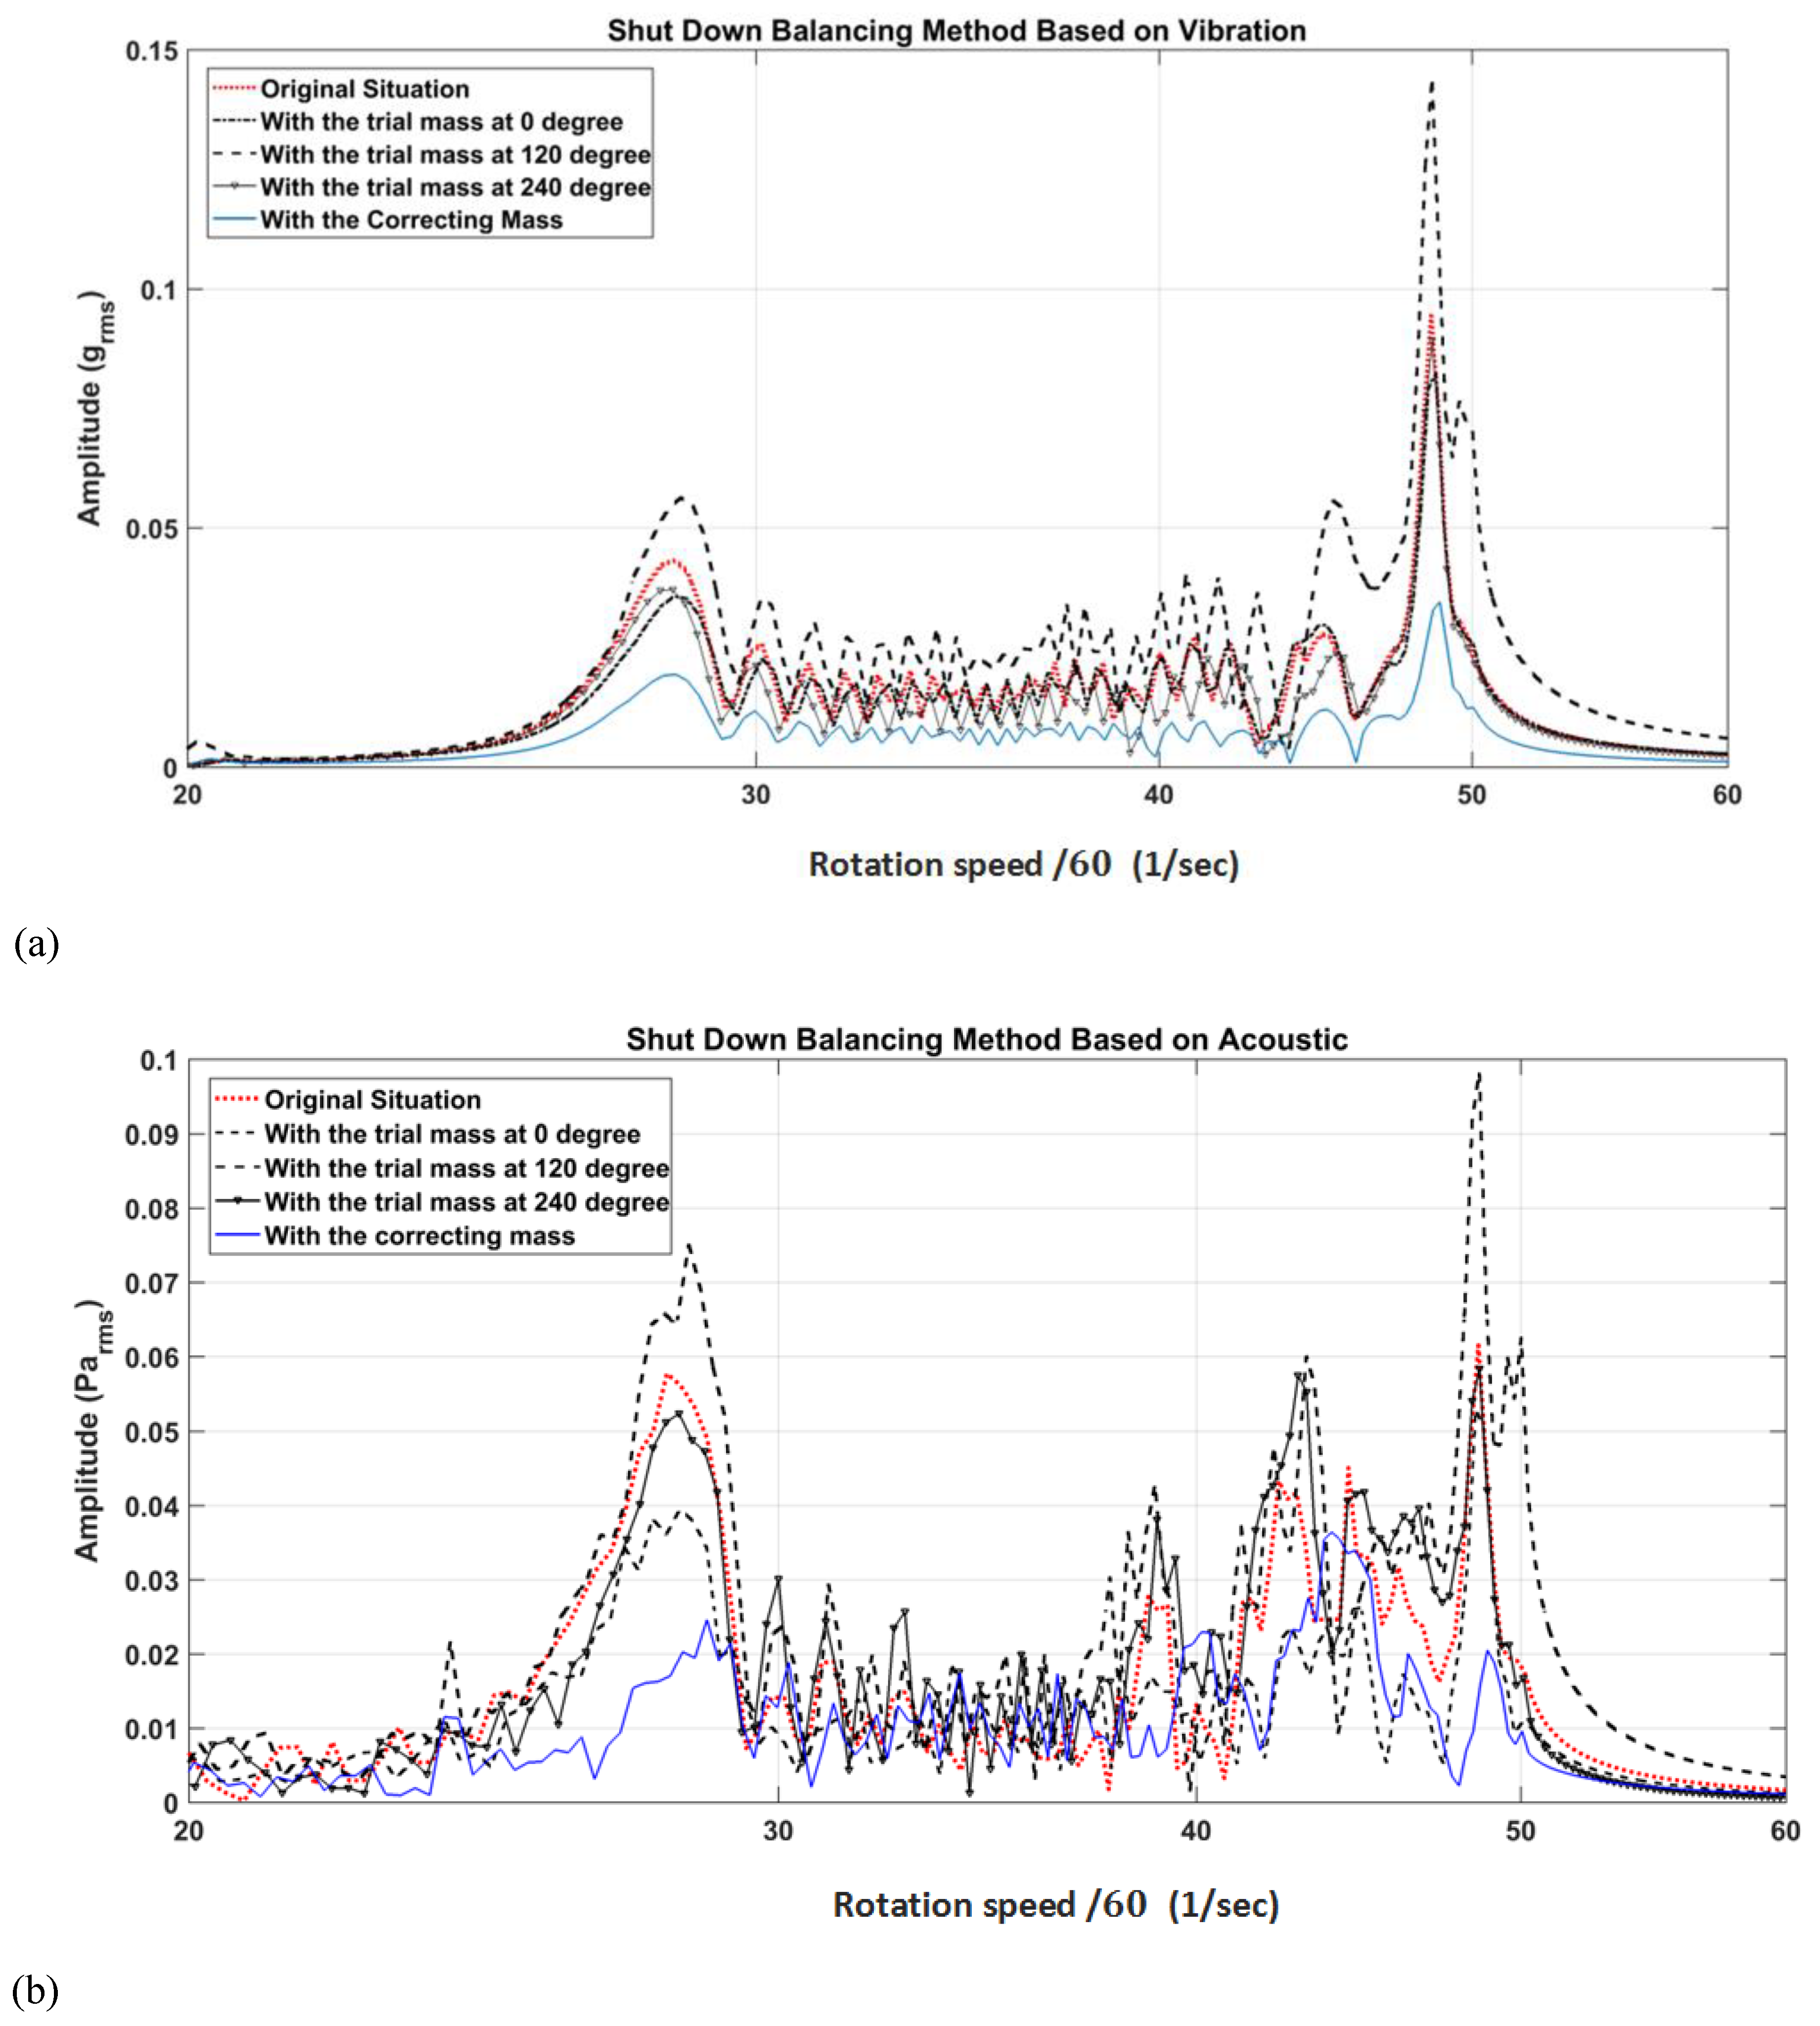
For the first shut-down case, zone A, shown in Figure 13, it appears that the first critical speed is absent in the diagram. This is because the selected rotational speed data set is only related to the peak of the third critical speed down to the peak of the second. Note that the first resonance mode is excited slightly with the mass located at 120 degrees. At the third resonant frequency, improvements of the order of 66% for both vibration response and acoustic responses are observed.
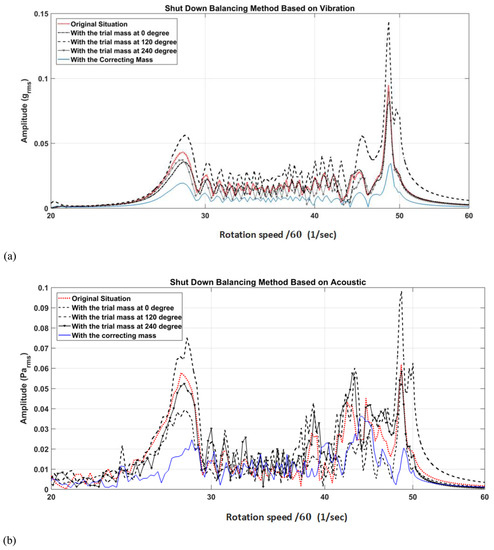
Figure 13.
(a) Acoustic and (b) vibration rms response against rotation speed (equivalent to frequency, Hz) in the zone A shut-down stage test.
Generally, the object is rotating with less speed and therefore deflecting less; see Figure 2. Hence, both responses in acoustic and vibration amplitudes are lower in shut-down Zone, B compared to Zone A shut-down. As shown in Figure 14, the third critical speed or equivalently the resonance frequency, is absent in the diagram. The rotational speed data set for zone B is strongly related to the peaks at the second and first critical speeds, like the behavior experienced by the rotation speeds in zone A. At the first and second resonant frequencies, improvements of the order of 66% for both vibration response and acoustic responses are observed again.
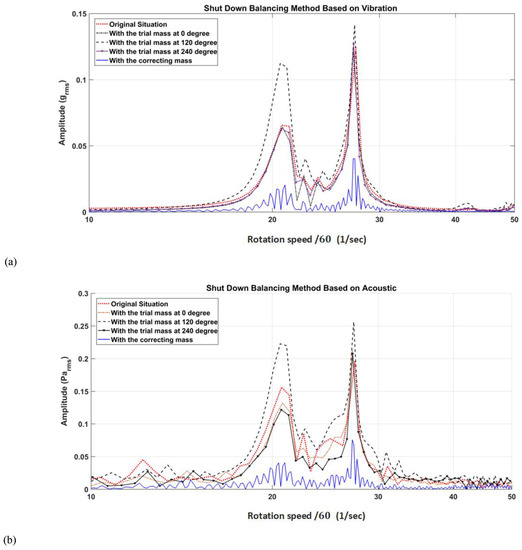
Figure 14.
(a) Acoustic and (b) vibration rms response against rotation speed (equivalent to frequency, Hz) in the shut-down zone B.
It is clearly shown that the residual unbalance of the machine is the minimal curve in all diagrams. The associated correcting masses and related positions based on using various types of the PPCS balancing method are hence presented in Table 9.
Table 9.
Comparison between the methods in proposed mass and angle.
On review, these results suggest that an acoustic-only procedure could reveal comparable imbalance results versus if tests were performed using a traditional accelerometer approach. It is worth mentioning that the main objective of the current research is presentation of the PPCS method. However, it still may be judged by users to employ a vibration assessment after proceeding with the acoustic only balancing procedure. Although uncertainties are important enough to be established in further research, to benefit the focus of the subject presented here, the analysis of these is excluded in this work. It is expected that during future examination of uncertainties, these will be prominent in the acoustic response, as shown in the mid-frequency range in Figure 13b and also taking into account ambient noise and position of microphones relative to the sound radiating feature.
In addition, it should be noted that there are a few limitations against the use of the PPCS method. One concern is the machine-dependency on run-up and shut-down, which can be prone to avoiding or limiting to exciting unwanted or non-critical critical speeds. Another concern regards acoustical responses. Regarding very low speed machines, these could generate only a very low frequency response located below the microphone frequency threshold, typically 25 Hz. The existence of more than one external noise source and low-frequency room acoustic modes, especially within large hard-walled workshop spaces should be considered before implementation of this method in acoustical mode. Finally, although the PPCS method is presented to balance speed-variant rotary machines, this method can be used for flexible constant speed machines. Although vibration mode-shapes related to the rotating object will have provided more in-depth information on the dynamics of the problem, it was decided to proceed no further in this direction, but modal analysis on rotating machines is recommended for future investigations.
5. Conclusions
Presenting a phase-less balancing method for a flexible speed-variant rotary machine was the main concern in this research. Using acoustic as an alternative to the traditional vibration response method, this paper presents an innovative method which works in balancing machines between different critical speeds. The proposed Peak-to-Peak for Critical Speeds (PPCS) balancing method was performed on a sample rotating machine in run-up and shut-down states and, the data for vibration and acoustic responses in all steps were compared in detail in time and frequency domains. Based on the acoustic response, it was observed across the run-up and shut-down stages a reduction of the order of 40% in the response compared to 56% based on conventional vibration methodology. Although conventional wisdom, and typically accuracy, favors a vibration/acceleration approach, the acoustic/microphone contactless method shows promise if this procedure is required for various reasons, including environmental constraints for example. It should be noted that the machine was considered with constant load during the tests, and ambient noises were controlled. The results show similarity for both vibration and acoustic responses in all balancing phases and ability to use them separately for balancing the machine. In this way, it can be concluded that the balance process of a speed-variant rotating machine could be performed based on just acoustic responses as an alternative and contactless method to classical utilization of vibration response data. Being phase-less, contactless and possessing direct access without interference can be considered as the advantages of the PPCS method based on acoustic response, also noting that the methodology is valid for both constant and variable speed machines.
Author Contributions
Conceptualization, J.I., A.K. and B.A.; methodology, J.I., A.P., A.K. and B.A.; software, J.I.; formal analysis, J.I., A.K. and B.A.; investigation J.I., A.K. and B.A.; resources, J.I.; data curation, J.I.; writing—review and editing, J.I., A.P., A.K., B.A. and D.B.-H. All authors have read and agreed to the published version of the manuscript.
Funding
This research received no external funding.
Institutional Review Board Statement
Not Applicable.
Informed Consent Statement
Not Applicable.
Data Availability Statement
Data held in digital binary format.
Conflicts of Interest
The authors declare no conflict of interest.
Abbreviations
| PPCS | Peak to Peak for Critical Speeds |
| DAQ | Data Acquisition System |
| rms | root mean square |
| RPM | Revolutions Per Minute |
| CCW | counterclockwise |
References
- Devendiran, S.; Manivannan, K. Vibration Based Condition Monitoring and Fault Diagnosis Technologies for Bearing and Gear Components-a Review. Int. J. Appl. Eng. Res. 2016, 11, 3966–3975. [Google Scholar]
- Chen, X.; Wang, S.; Qiao, B.; Chen, Q. Basic research on machinery fault diagnostics: Past, present, and future trends. Front. Mech. Eng. 2018, 13, 264–291. [Google Scholar] [CrossRef] [Green Version]
- de Castelbajac, C.; Ritou, M.; Laporte, S.; Furet, B. Monitoring of distributed defects on HSM spindle bearings. Appl. Acoust. 2014, 77, 159–168. [Google Scholar] [CrossRef] [Green Version]
- Norfield, D. Practical Balancing of Rotating Machinery; Elsevier BV: Amsterdam, The Netherlands, 2005. [Google Scholar]
- Rao, J.S. History of Rotating Machinery Dynamics; Springer Science and Business Media LLC: Berlin, Germany, 2011; Volume 20, pp. 185–242. [Google Scholar]
- Adams, M.L. Rotating Machinery Vibration: From Analysis to Troubleshooting, 2nd ed.; CRC Press: Boca Raton, FL, USA, 2010; ISBN 0-203-90216-5. [Google Scholar]
- International Standard Organization. ISO 21940-11:2016 Mechanical Vibration-Rotor Balancing, Part 11: Procedures and Tolerances for Rotors with Rigid Behavior; International Standard Organization: Geneva, Switxerland, 2016. [Google Scholar]
- Goodman, T.P. A Least-Squares Method for Computing Balance Corrections. J. Eng. Ind. 1964, 86, 273–277. [Google Scholar] [CrossRef]
- Lund, J.W.; Tonnesen, J. Analysis and Experiments on Multi-Plane Balancing of a Flexible Rotor. J. Eng. Ind. 1972, 94, 233–242. [Google Scholar] [CrossRef]
- Tessarzik, J.M.; Badgley, R.H.; Anderson, W.J. Flexible Rotor Balancing by the Exact Point-Speed Influence Coefficient Method. J. Eng. Ind. 1972, 94, 148–158. [Google Scholar] [CrossRef]
- Vania, A.; Pennacchi, P. Experimental and theoretical application of fault identification measures of accuracy in rotating machine diagnostics. Mech. Syst. Signal Process. 2004, 18, 329–352. [Google Scholar] [CrossRef] [Green Version]
- Pennacchi, P.; Vania, A.; Bachschmid, N. Increasing the robustness of fault identification in rotor dynamics by means of M-estimators. Mech. Syst. Signal Process. 2007, 21, 3003–3029. [Google Scholar] [CrossRef] [Green Version]
- Sinha, J.; Lees, A.; Friswell, M. Estimating unbalance and misalignment of a flexible rotating machine from a single run-down. J. Sound Vib. 2004, 272, 967–989. [Google Scholar] [CrossRef]
- Friswell, M.I.; Penny, J.E.; Garvey, S.D.; Lees, A.W. Dynamics of Rotating Machines; Cambridge University Press: Cambridge, MA, USA, 2015; ISBN 0-521-85016-9. [Google Scholar]
- Zheng, W.; Rui, C.; Yang, J.; Liu, P. Research on Dynamic Balancing Simulation of Rotary Shaft Based on ADAMS; IOP Publishing: Hong Kong, China, 2018; Volume 307, p. 012002. [Google Scholar]
- Xia, Y.; Ren, X.; Qin, W.; Yang, Y.; Lu, K.; Fu, C. Investigation on the transient response of a speed-varying rotor with sudden unbalance and its application in the unbalance identification. J. Low Freq. Noise Vib. Act. Control. 2020, 39, 1065–1086. [Google Scholar] [CrossRef] [Green Version]
- Shrivastava, A.; Mohanty, A. Estimation of single plane unbalance parameters of a rotor-bearing system using Kalman filtering based force estimation technique. J. Sound Vib. 2018, 418, 184–199. [Google Scholar] [CrossRef]
- Kol’Tsov, A.G.; Rechenko, D.S. Dynamic rotary balancing in metal-cutting machines. Russ. Eng. Res. 2012, 32, 179–181. [Google Scholar] [CrossRef]
- Fournier, E.; Picot, A.; Regnier, J.; Yamdeu, M.T.; Andrejak, J.-M.; Maussion, P. Current-Based Detection of Mechanical Unbalance in an Induction Machine Using Spectral Kurtosis with Reference. IEEE Trans. Ind. Electron. 2015, 62, 1879–1887. [Google Scholar] [CrossRef] [Green Version]
- Yongfeng, Y.; Qinyu, W.; Yanlin, W.; Weiyang, Q.; Kuan, L. Dynamic characteristics of cracked uncertain hollow-shaft. Mech. Syst. Signal Process. 2019, 124, 36–48. [Google Scholar] [CrossRef]
- Fu, C.; Xu, Y.; Yang, Y.; Lu, K.; Gu, F.; Ball, A. Response analysis of an accelerating unbalanced rotating system with both random and interval variables. J. Sound Vib. 2020, 466, 115047. [Google Scholar] [CrossRef]
- Bertoneri, M.; Forte, P. Turbomachinery High Speed Modal Balancing: Modeling and Testing of Scale Rotors; Springer: Cham, France, 2015; Volume 21, pp. 15–25. [Google Scholar]
- Quartarone, C.; Beqari, J.; Detoni, J.G.; Cometti, F.; Emelli, E. Balancing of Turbomolecular Pumps: Modal Balancing Approach and Experimental Results. In Proceedings of the 10th International Conference on Rotor Dynamics–IFToMM, IFToMM; Springer: Berlin/Heidelberg, Germany, 2018. [Google Scholar]
- Carvalho, V.N.; Rende, B.F.R.; Silva, A.D.G.; Ap Cavalini, A.; Steffen, V. Robust Balancing Approach for Rotating Machines Based on Fuzzy Logic. J. Vib. Acoust. 2018, 140, 051018. [Google Scholar] [CrossRef]
- Yue, C.; Ren, X.; Yang, Y.; Deng, W. Unbalance Identification of Speed-Variant Rotary Machinery without Phase Angle Measurement. Shock. Vib. 2015, 2015, 1–11. [Google Scholar] [CrossRef]
- Edwards, S.; Lees, A.; Friswell, M. Experimental identification of excitation and support parameters of a flexible rotor-bearings-foundation system from a single run-down. J. Sound Vib. 2000, 232, 963–992. [Google Scholar] [CrossRef]
- Shamsah, S.M.; Sinha, J.K.; Mandal, P. Estimating rotor unbalance from a single run-up and using reduced sensors. Measurement 2019, 136, 11–24. [Google Scholar] [CrossRef]
- Sudhakar, G.; Sekhar, A. Identification of unbalance in a rotor bearing system. J. Sound Vib. 2011, 330, 2299–2313. [Google Scholar] [CrossRef]
- Walker, R.B.; Vayanat, R.; Perinpanayagam, S.; Jennions, I.K. Unbalance localization through machine nonlinearities using an artificial neural network approach. Mech. Mach. Theory 2014, 75, 54–66. [Google Scholar] [CrossRef]
- Tiwari, R.; Chakravarthy, V. Identification of the Bearing and Unbalance Parameters from Rundown Data of Rotors. In Proceedings of the IUTAM Symposium on Multiscale Modelling of Fatigue, Damage and Fracture in Smart Materials; Springer Science and Business Media LLC: Berlin/Heidelberg, Germany, 2011; Volume 1011, pp. 479–489. [Google Scholar]
- Mao, Q.; Zhong, H. Sound Power Estimation for Beam and Plate Structures Using Polyvinylidene Fluoride Films as Sensors. Sensors 2017, 17, 1111. [Google Scholar] [CrossRef] [Green Version]
- Isavand, J.; Peplow, A.; Kasaei, A. Performing building vibration assessments by acoustic measurements. Build. Acoust. 2019, 27, 21–33. [Google Scholar] [CrossRef]
- Isavand, J.; Kasaei, A.; Peplow, A.; Afzali, B.; Shirzadi, E. Comparison of vibration and acoustic responses in a rotary machine balancing process. Appl. Acoust. 2020, 164, 107258. [Google Scholar] [CrossRef]
- Bishop, R.E.D.; Parkinson, A.G. On the Isolation of Modes in the Balancing of Flexible Shafts. Proc. Inst. Mech. Eng. 1963, 177, 407–423. [Google Scholar]
- Kellenberger, W. Should a Flexible Rotor Be Balanced in N or (N + 2) Planes? J. Eng. Ind. 1972, 94, 548–558. [Google Scholar] [CrossRef]
- Sinha, J.K. Vibration Analysis, Instruments, and Signal Processing, 1st ed.; CRC Press: Boca Raton, FL, USA, 2015; ISBN 978-1-4822-3145-8. [Google Scholar]


Publisher’s Note: MDPI stays neutral with regard to jurisdictional claims in published maps and institutional affiliations. |
© 2021 by the authors. Licensee MDPI, Basel, Switzerland. This article is an open access article distributed under the terms and conditions of the Creative Commons Attribution (CC BY) license (https://creativecommons.org/licenses/by/4.0/).