Article

Implications for Sustainability of the Joint Application of Bioeconomy and Circular Economy: A Worldwide Trend Study

by
Emilio Abad-Segura
1,
Ana Batlles-delaFuente
1,*,
Mariana-Daniela González-Zamar
2 and
Luis Jesús Belmonte-Ureña
1,3
1
Department of Economics and Business, University of Almeria, 04120 Almeria, Spain
2
Department of Education, University of Almeria, 04120 Almeria, Spain
3
Research Centre CIAIMBITAL, University of Almeria, 04120 Almeria, Spain
*
Author to whom correspondence should be addressed.
Sustainability 2021, 13(13), 7182; https://doi.org/10.3390/su13137182
Submission received: 24 May 2021 / Revised: 21 June 2021 / Accepted: 23 June 2021 / Published: 26 June 2021

Abstract

:
The joint application of bioeconomy (BE) and circular economy (CE) promotes the sustainable use of natural resources, since by applying a systemic approach, it improves the efficiency of these resources and reduces the impact on the environment. Both strategies, which belong to the area of green economy, provide a global and integrated approach towards environmental sustainability, as regards the extraction of biological materials, the protection of biodiversity and even the primary function of food production in agriculture. The objective was to analyze the implications for sustainability of BE and CE joint application. A systematic and bibliometric review has been applied to a sample of 1961 articles, selected from the period 2004–May 2021. A quantitative and qualitative advance is observed in this field of study. The expansion of scientific production is due to its multidisciplinary nature, since it implies technical, environmental and economic knowledge. The main contribution of this study is to understand the state of research on the implications for sustainability that BE and CE have when combined, in relation to their evolution, the scientific collaboration between the main driving agents, and the identification of the main lines of research developed.

1. Introduction

1.1. Background

For the last two decades, based on the work of the promoters of sustainable policies, a large fraction of society has become more aware of the climate emergency that challenges the future of the planet [1,2]. In a globalized world threatened by climate change, promoting an economy that respects the environment is considered an obligation [3,4]. Global warming and the depletion of natural resources requires the adoption of a new production and consumption system that certifies its own sustainability.
Actions like (1) the 2030 Agenda and the United Nations (UN) Sustainable Development Goals (SDGs) [5,6]; (2) the Paris Agreement within the framework of the United Nations Framework Convention on Climate Change (UNFCCC), effective as of November 4, 2016, to regulate the increase in global temperature [7,8]; or (3) the commitments of the European Union (EU) to achieve a climate neutral coalition by 2050, represent opportunities in the transition process towards a more sustainable economy [9,10].
The generation of biomass through agriculture, livestock, fishing, and forestry, among others, depends on natural resources and the environment; thus, the depletion of these resources below sustainable limits would undermine the future of the generating sectors, directly influencing the benefits and functions that these perform for society [11,12,13]. Hence, the current situation demonstrates the fragility of the systems and values on which a civilization rests. In this environment, the sustainable and joint application of concepts such as bioeconomy (BE) and circular economy (CE) is a cross-cutting condition that affects all economic sectors.

1.2. Definition of Basic Concepts: Circular Economy, Bioeconomy and Sustainability

CE refers to the economic concept incorporated in the framework of sustainable development with the aim of producing goods and services while reducing consumption and waste of raw materials, water and energy sources [14,15,16]. The CE principles (reuse, repair and recycle) are a key part of the biological economy; thus, by reusing, repairing and recycling, the impact and total sum of waste is reduced [17,18]. Thereby, CE is modifying the current production and consumption systems towards regenerative ones, maintaining the value of resources and products but limiting the input of raw materials and energy. This scheme (1) prevents the generation of waste to a certain extent, (2) obviates the increase of the derived negative impact, and (3) reduces the unfavorable impact on the environment, climate and human health [19,20,21,22]. Achieving a CE model where the full value of the biomass resources obtained sustainably is used is the way to ensure economic growth, job creation and environmental sustainability [23].
Likewise, the BE concept spread in the 2000s after its acceptance by the EU and the Organization for Economic Cooperation and Development (OECD) to promote the use of biotechnology so as to obtain new products and markets [24,25]. BE emerges as a way of consuming, which responds to environmental and social challenges while generating opportunities for economic development and employment [26,27]. This concept describes knowledge-based production and the use of biological resources, processes, and methods to provide goods and services in a sustainable way in all economic sectors, according to the Food and Agriculture Organization (FAO) of the UN. BE refers to the production, use and conservation of biological resources containing related knowledge, science, technology and innovation to provide information, products, processes and services to all economic sectors, with the aim of advancing towards a sustainable economy [28,29].
In this context, BE provides solutions to current global challenges, highlighting that: (1) it guarantees food safety, (2) reduces water stress, (3) manages natural resources in a sustainable way to avoid their overuse, (4) decreases dependence on fossil fuels and boost renewable energy, (5) generates green jobs, and (6) maintains productivity and competitiveness [30,31,32]. The development of BE requires an action plan in which local and national governments and supranational organizations participate, in relation to (1) increased investment in research, innovation and training; (2) establishing synergies between policies, proposals and economic sectors; and (3) the improvement of markets and competitiveness, based on providing the knowledge base for BE sectors to be more sustainable, and promoting the development of clean energies [33,34].
Conceptually, sustainability suggests the ability to meet the needs of the present generation without compromising the ability of future generations to meet their own needs, to ensure a balance between economic growth, environmental protection and social inclusion [35]. Sustainable development is the progress mode that maintains this current balance without endangering it in the future [36]. The UN SDGs are tools derived from the 2015 agreement by the UN Member States. These are made up of 17 SDGs and 169 targets applied in the 2030 Agenda, which covers aspects of the social, economic and environmental challenges facing the world [37,38,39,40]. According to FAO, the SDGs can benefit from the application of BE, since (1) it impacts the achievement of the end of poverty, zero hunger and the decrease of disparities [41]; (2) it is related to the objectives of clean water and sanitation, sustainable cities and communities, and responsible consumption and production [42]; (3) it promotes sustainable industry and infrastructure [43]; (4) it encourages economic growth and honest work [44]; and (5) it endorses health and well-being together with climate action, which benefits underwater life and life in terrestrial ecosystems [45,46].

1.3. Sustainable Effects of the Joint Application of Bioeconomy and Circular Economy

The strategic integration of BE and CE favors both the transformation of the economic model and changes in current consumption habits. Hence, the joint practice of CE and BE encourages the sustainable use of natural resources; therefore, by applying a systems approach (the purpose of which is to study the principles applicable to systems at any level in all fields of research), the efficiency of natural resources is improved and the burden on the environment is reduced. If the planet continues to be based on a high consumption of natural resources (knowing that these are finite), the ecological crisis will be aggravated by the scarcity of said natural resources. Consequently, the excessive demand for food, feed, biomaterials and bioenergetic resources will lead to the overexploitation of natural resources [46,47,48].
By extending the useful life of recycled products and materials, a BE-based circular approach allows us to maintain the value/use of materials and avoid the waste of non-recycled natural waste [49]. Both CE and BE, as green economy activities, must pay global and integrated attention to environmental sustainability, in the sense that the removal of biological materials should not be detrimental to the protection of biodiversity and they should not change the primary food production function of agriculture [50,51]. In this sense, the concept of Circular Bioeconomy (CB) attempts to promote both sustainable development and circularity. The tendency towards CB, where biological resources are kept longer in the production chain to ensure that they do not go unused, will increase the efficient and sustainable use of biomass, circularly replacing those resources based on fossil fuels so that more sustainable products are achieved and by-products and waste in the chain are minimized [52,53].

1.4. Motivation, Research Issues, Objective and Main Contribution of This Research

The motivation of this research was to record the evolution of scientific knowledge on the implications for sustainability of BE and CE’s joint application, and to provide a critical analysis of the scientific production carried out to date. Hence, this study seeks to answer the following research questions:
  • How has scientific production evolved during the period analyzed?
  • In which subject areas have the published articles been classified?
  • What have been the most productive journals, authors, research institutions and countries?
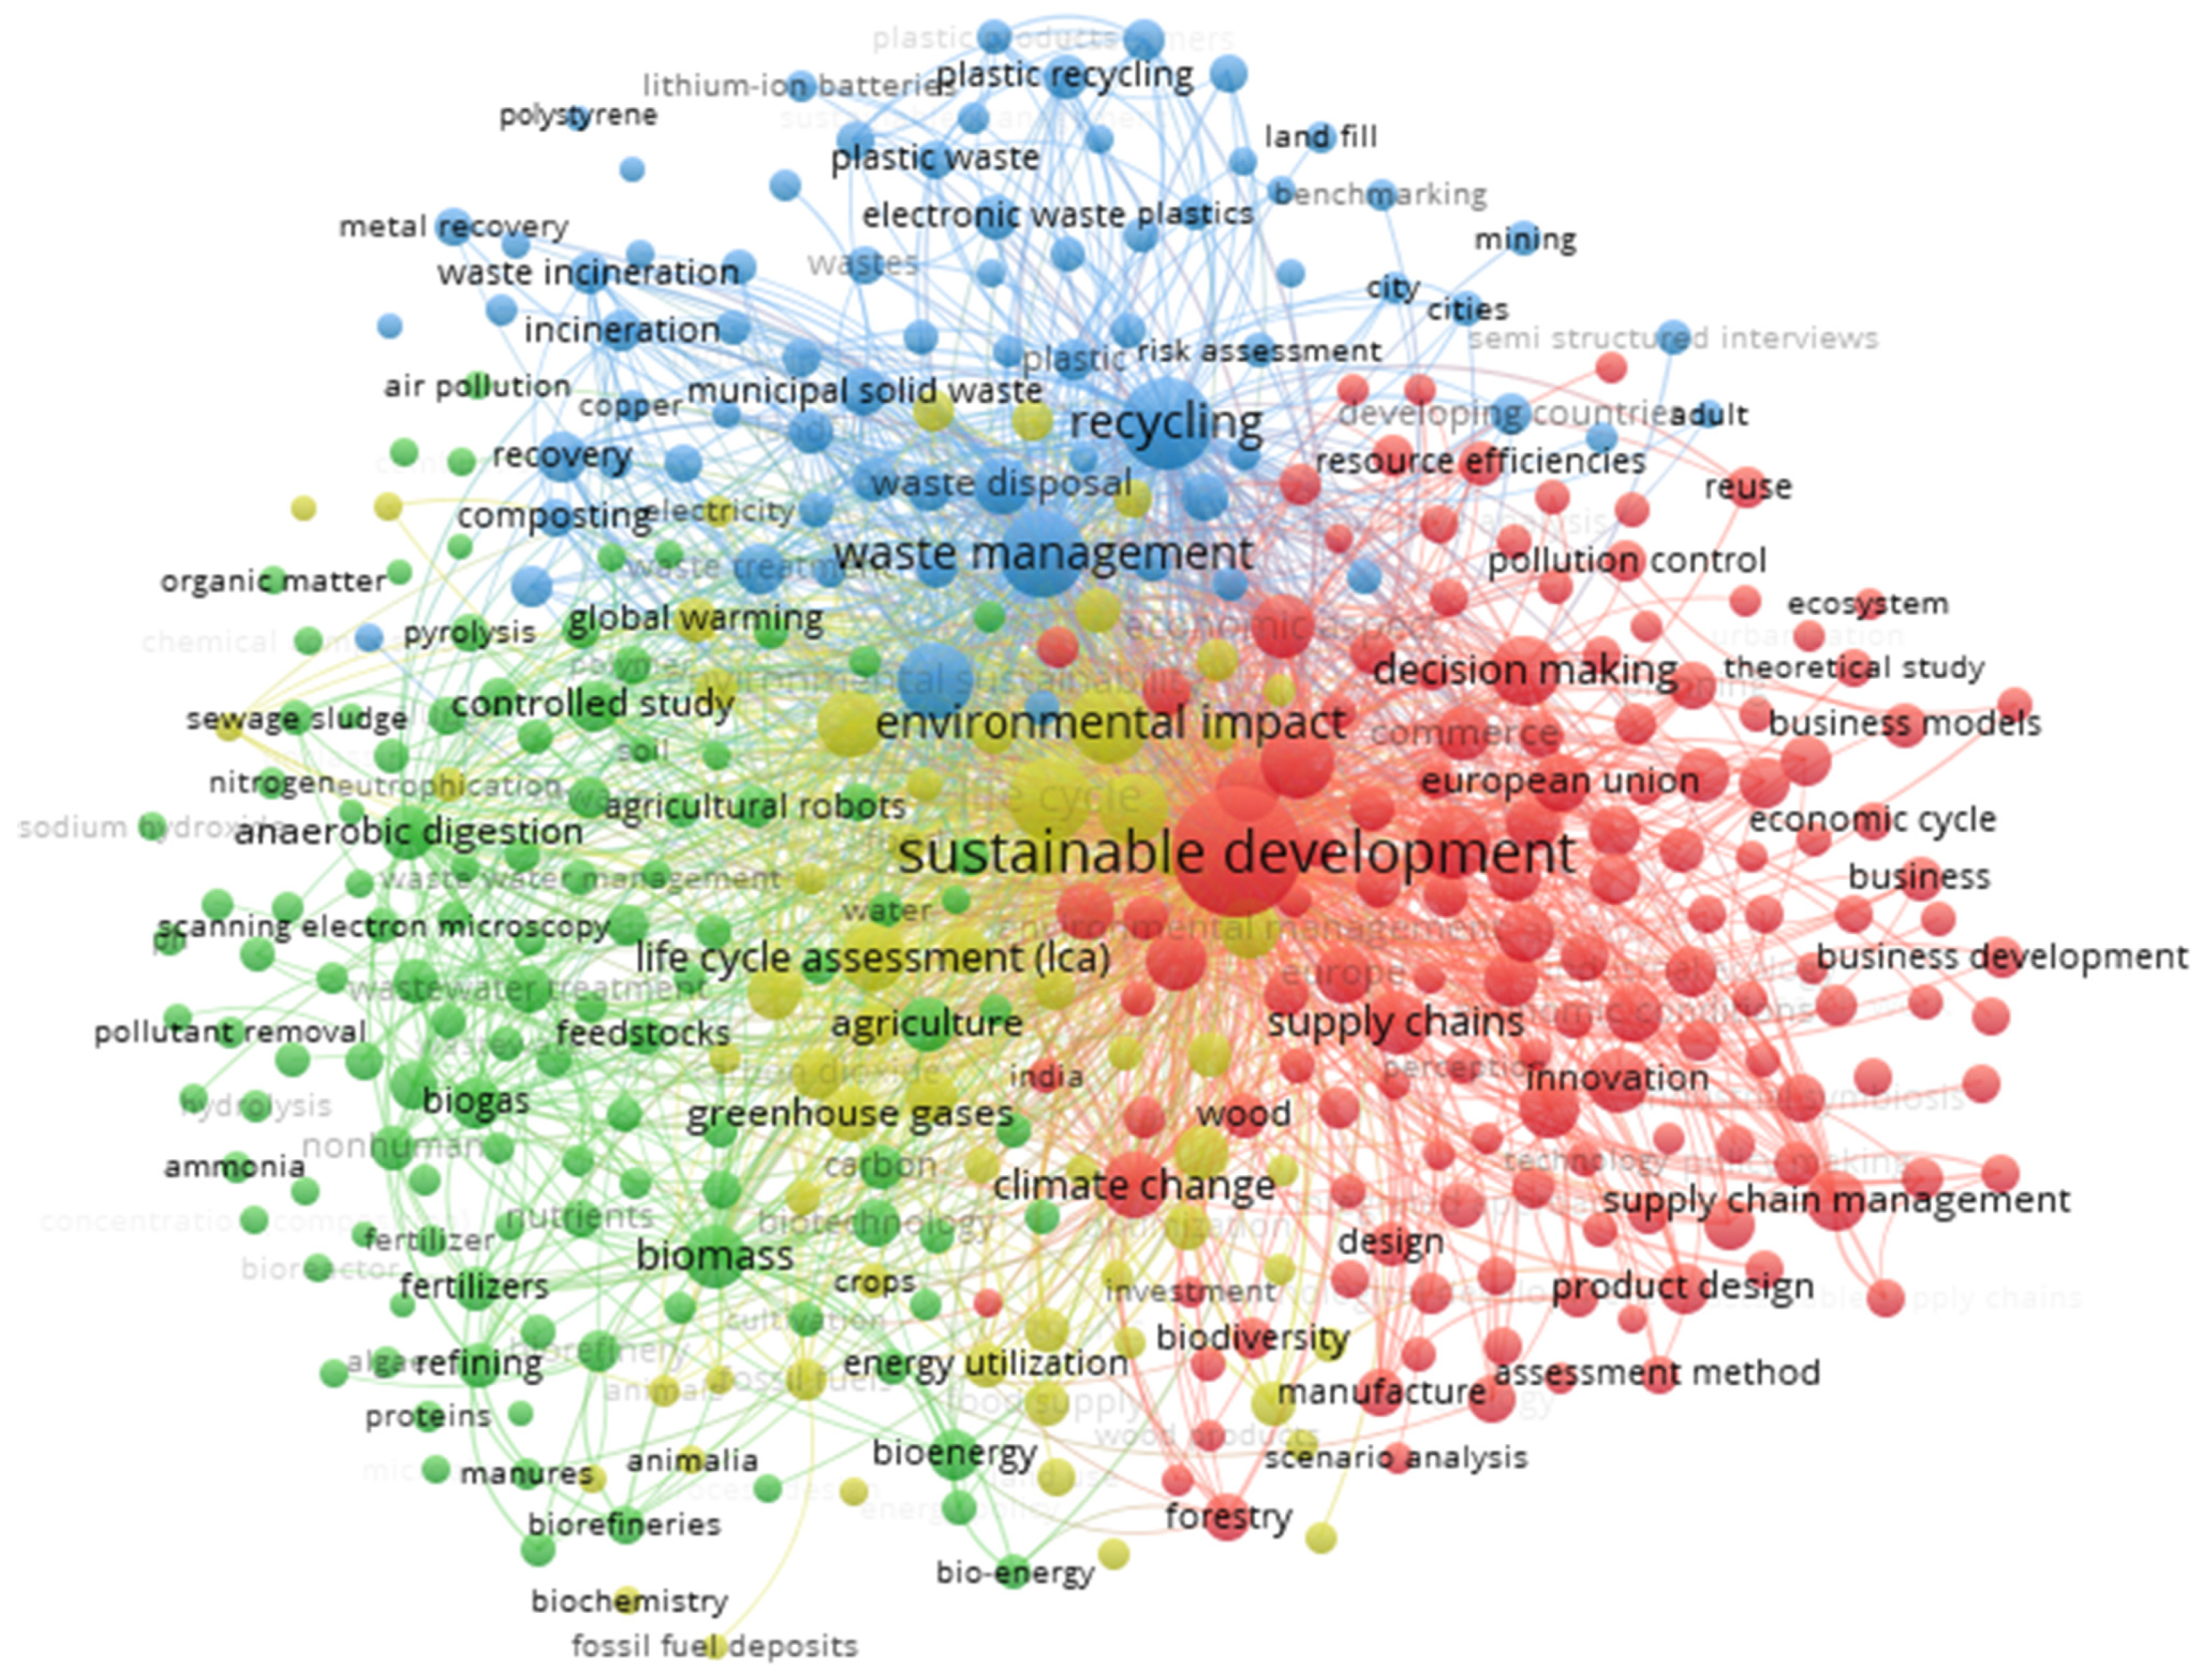
  • What were the main lines of research developed?
Accordingly, the objective is to examine the implications for sustainability of the joint application of BE and CE at an international level during the period between 2004 and May 2021. To obtain answers to the previous issues, a systematic and bibliometric review of 1961 selected articles was carried out from the Scopus database to gather a synthesis of knowledge on this topic.
Data analysis has made it possible to identify the main drivers and trends in this research. The identified research lines have studied: (1) sustainable development, (2) the study of water treatment and the alternatives available to improve the agricultural context in a sustainable way, (3) the environmental impact of processes or products throughout their entire life cycle, and (4) alternatives for managing plastics and products derived from industrial activity and their correct management.
This research has mainly contributed to detecting the main agents advancing research on the joint contribution of BE and CE to sustainability, carrying out a critical analysis of the results in a broad context, and identifying the main lines of research developed.

2. Materials and Methods

A systematic review has been carried out to ascertain the current state of scientific production on the implications for sustainability of BE and CE’s joint application. These qualitative reviews focus on synthesizing the state of the art in a specific field of study, based on publications of primary studies [54]. Nowadays, this type of analysis has been extended to all disciplines of study, and thus research in various categories can be found [55,56,57]. With the information gathered from this process, a theoretical framework has been developed that has served as a precedent for the second part of the study. In this sense, in order to achieve the stated objectives, the second analysis consisted of a quantitative bibliometric review [58]. Said reviews allowed us to identify the relative importance of publications, as well as the evolution and trends of a specific research field. Moreover, they are also widely used in different fields of study [36,37,59,60,61,62].
The Scopus database has been chosen to support this research since it is easy to access, allows for the download of all the information available in different formats and is considered the largest repository of citations and abstracts [63,64]. In addition, many researchers favor said database to perform bibliometric analyses, such as Janssen et al. and Greenhalgh et al. [65,66]. The sample period covers 16 years of scientific production, that is, from 2004 to 2021. [TITLE-ABS-KEY (Bioeconomy OR “Circular Economy”) AND TITLE-ABS-KEY (Sustainability)] are the parameters that define the search carried out in May 2021. The sample obtained from said search was subjected to a filtering process, limited only to original articles. In this way, books, conference papers, book chapters and review articles were excluded to avoid duplications in the study [67,68]. The result provided 1961 articles for analysis. The sample was downloaded in RIS format to filter the information and avoid repeated information due to the different registration options in the references, author names or keywords. Once the sample was refined, the data for the study were selected and the different graphs and tables necessary for a correct visualization and understanding of the results were elaborated. In this case, the variables to consider were the number of annual publications, the most prolific authors, the authors’ institutions of affiliation, the main journals, the most active countries, the main subject areas, and keywords that define the trend in the research.
What is more, in order to evaluate the relative importance of research in this area, quality indicators such as the impact factor of the Scimago Journal Rank, the h-index or the citations received have been analyzed [69,70,71,72,73,74]. Finally, elaboration of the network maps, has been carried out using VOSviewer [75,76]. The particularity of this tool is that the download of the sample in CSV format is required for correct processing of the data. The reasons behind the choice of this tool are its recurrent use and suitability for this type of analysis and its proven robustness for mapping scientific results [77]. The methodology is summarized in Table 1.

3. Results and Discussion

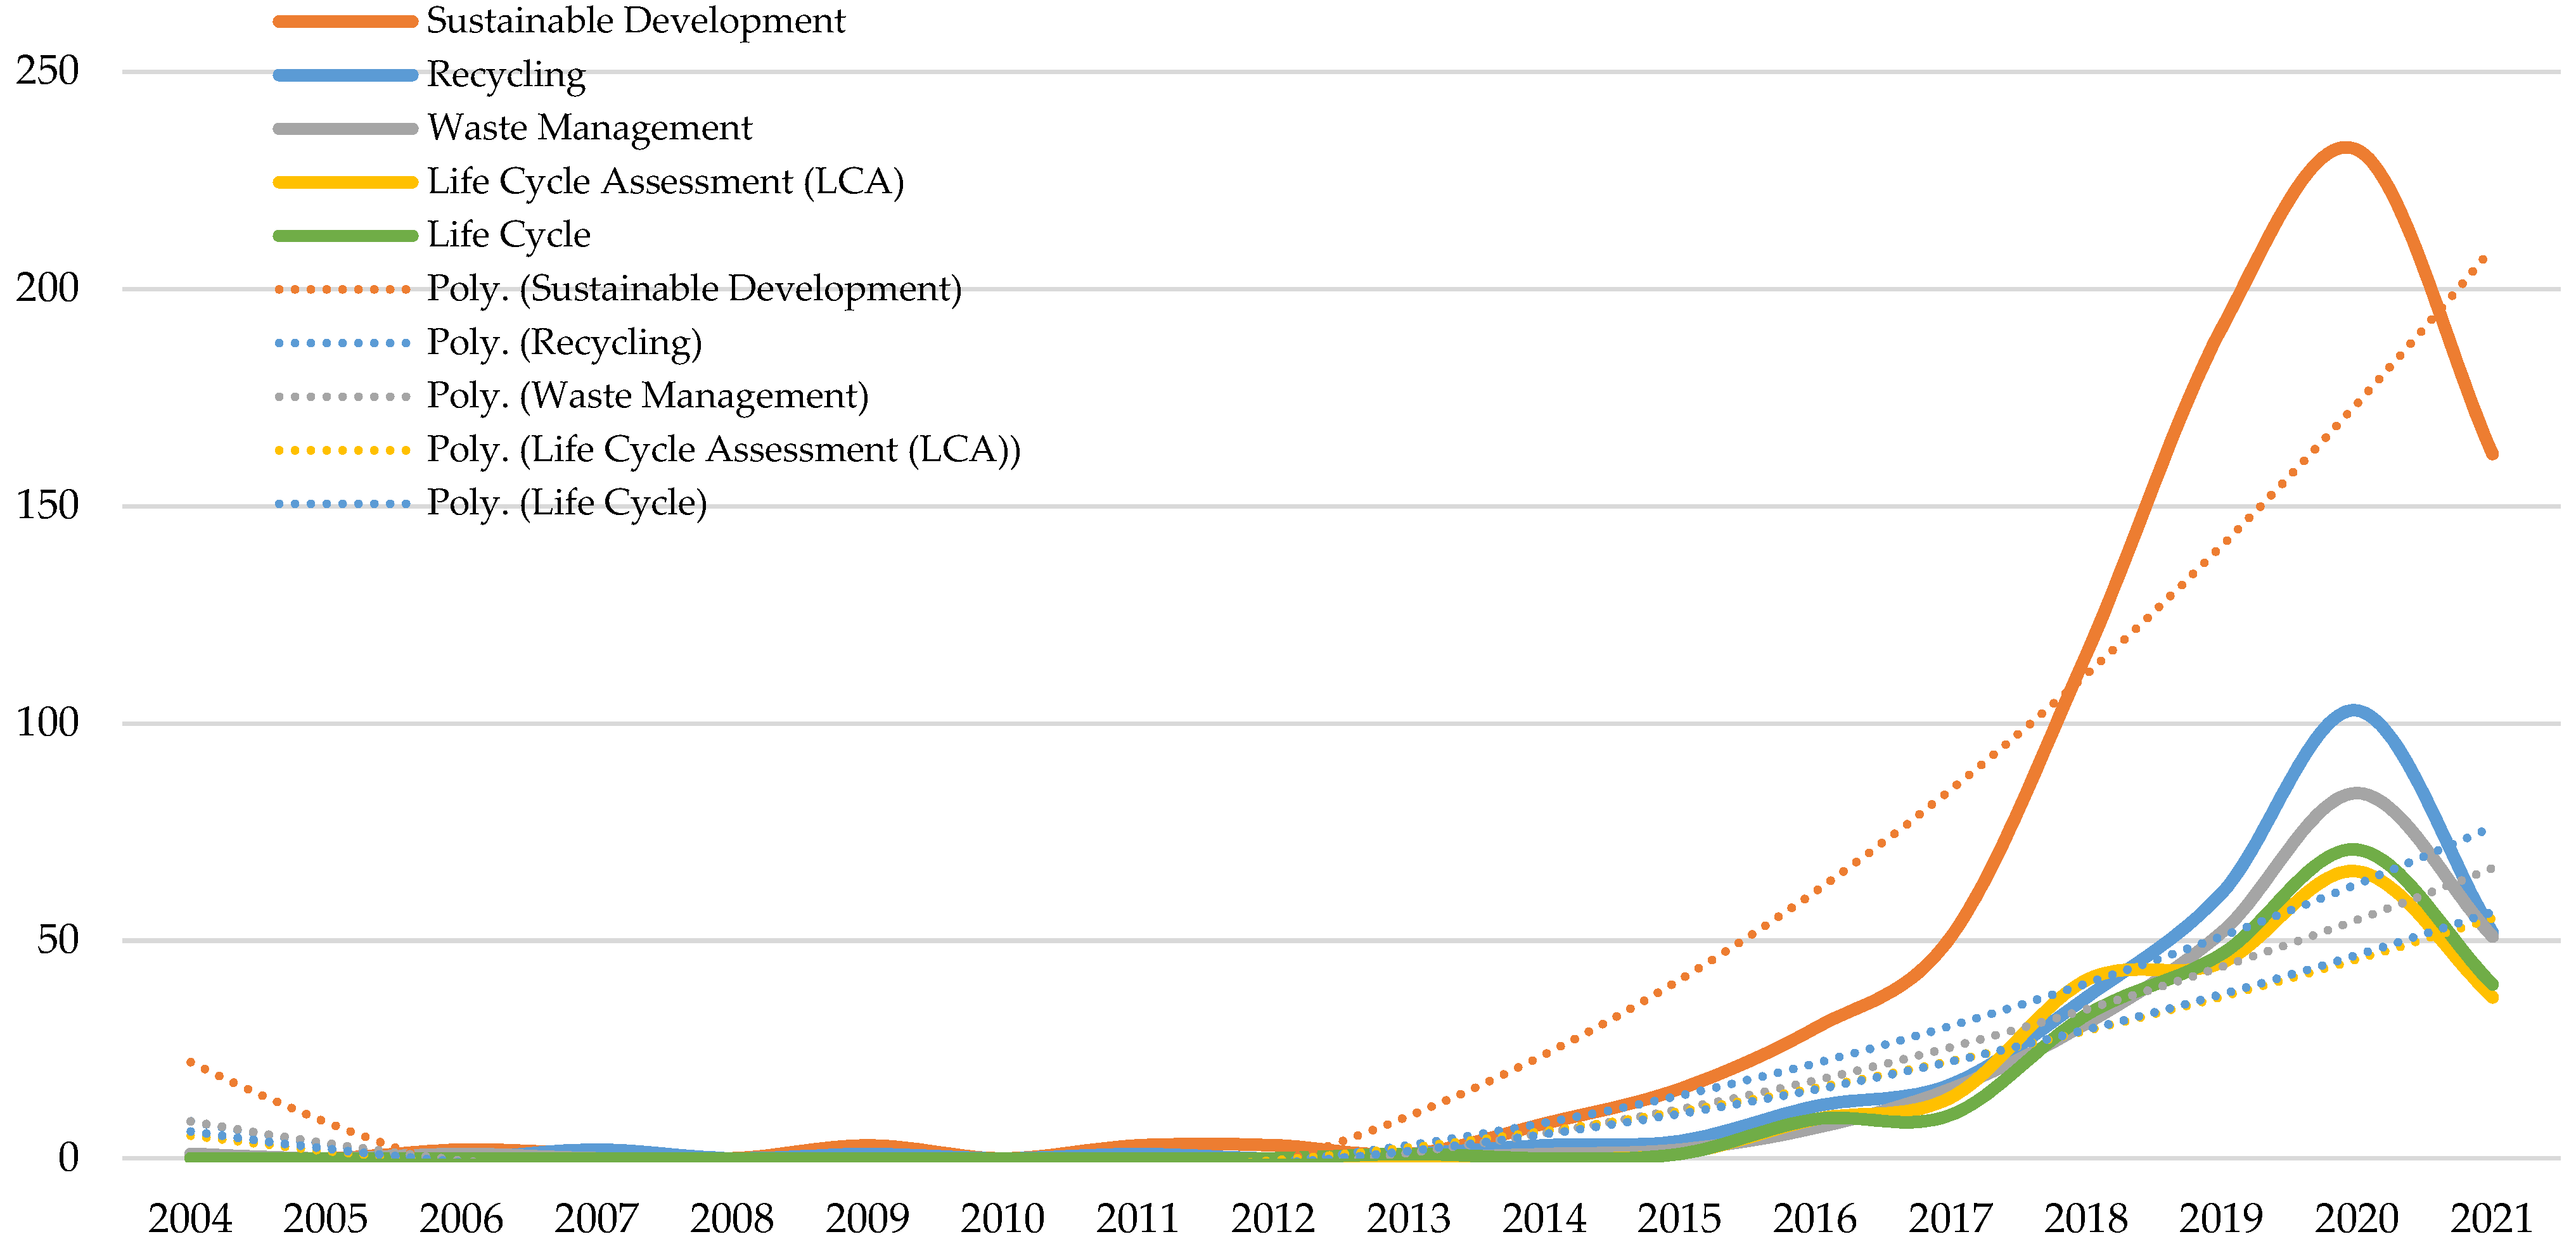
3.1. Evolution of Scientific Production

All the scientific production related to BE and CE terms in the framework of sustainability is considered in this section. The study covers all the publications on that subject up to the present, specifically sixteen years of scientific production. In this case, to understand the evolution and exponential growth experimented along the years, the information presented has been divided into six different periods, with three years of research in each. Therefore, Table 2 shows the main characteristics of each period, such as the number of articles published, the authors who published research, the number of countries that are active in this line of research, the total number of citations by period, the number of citations by article or the number of active journals for each period.
The sample encompasses a total of 1961 articles. In the first period analyzed, between 2004 and 2006, there is a total of 3 publications, while between 2019 and May 2021, the research published amounts to a total of 1428 publications. Thus, the first period represents 0.15% of the total production, compared with 72.82%, which symbolizes the last period of research. In this sense, as is possible to see in the table, the rest of the periods also reflect a growth, with the fourth period (2016–2018) standing out because of its highest percentage variation (771%). The year with the highest number of articles is 2020, with 657 publications in total. This study was not able to consider 2021, but the tendency of this year shows that it might turn out to be the most productive at the end. The sample registers a total of 6399 authors across all scientific production. The research started with 9 authors between 2004 and 2006, which represents 0.14% of the total, whilst the last period (2019–May 2021), with 4947 authors, amounts to 77.31% from the total sample of authors. On the other hand, the average of authors by articles in both periods is 3 and 3.46, respectively. This average has not grown significantly, as the number of authors has increased at the same rate as the number of research papers. Furthermore, the highest variation among the periods registered occurred between 2016 and 2018, with an increase of 851% from 163 authors in 2013–2015 to 1550 authors in the fifth period (2016–2018).
The countries that are involved in scientific production have grown from 3 between 2004 and 2006 to 87 during the last period analyzed (2019–May 2021). Moreover, the total number of countries in the whole sample is 87, which means that all countries have published in this line of research in the last period. The periods 2010–1012 (120%), 2013–2015 (109%) and 2016–2018 (178%) have the highest percentage variation in the number of countries per period. Additionally, during the first period of research (2004–2006), there are 2 citations registered, which means a total of exactly 0.67 citations per article. Since then, the number of citations has risen until it reached a total of 23,412 in the last period, which represents 83.71% of the total citations obtained. Finally, the sample has been published in a total of 588 journals. During the first period (2004–2006), 3 journals published papers on the implications for sustainability of BE and CE, which represents an average of one article per journal. Between 2019 and May 2021, there is a total of 450 journals registered, which means an exact average of 3.17 articles were published per journal. As is considered in the table, all variables have experienced an exponential growth during the periods analyzed, highlighting the last period because of its higher values in comparison with the rest.
Figure 1 shows the number of articles published annually (orange) and the variation experienced throughout the entire time horizon (blue). The first investigation of the entire period analyzed is called “Interorganisational cooperation for sustainable management in industry: on industrial recycling networks and sustainability networks” [78]. This research was published in 2004 and presents the concept of industrial recycling networks as a form of inter-organizational collaboration that leads to a sustainable management of resources and that supports CE. Over the next nine years, there were occasional drops in the amount of published research. However, as of 2014, the number of publications began to increase annually without experiencing any decrease.
In 2015, the 2030 Agenda in favor of the planet was approved, and it was at the beginning of 2016 that it began to be officially implemented together with the SDGs [79]. This is one of the reasons for the increase experienced in 2016. As the first to exceed 100 annual investigations, 2017 stands out, specifically with a total of 132 research articles. In addition, as mentioned above, the value in the number of investigations in 2021 results from the fact that it has not been considered in its entirety since there are still ongoing investigations. Regarding the variation percentage in the number of annual publications, the year with the lowest is 2010 (−83%), from 6 publications in 2009 to 1 in 2010. On the contrary, 2011 stands out with a value of 400%, going from 1 publication in the previous year to 5 publications in 2011.

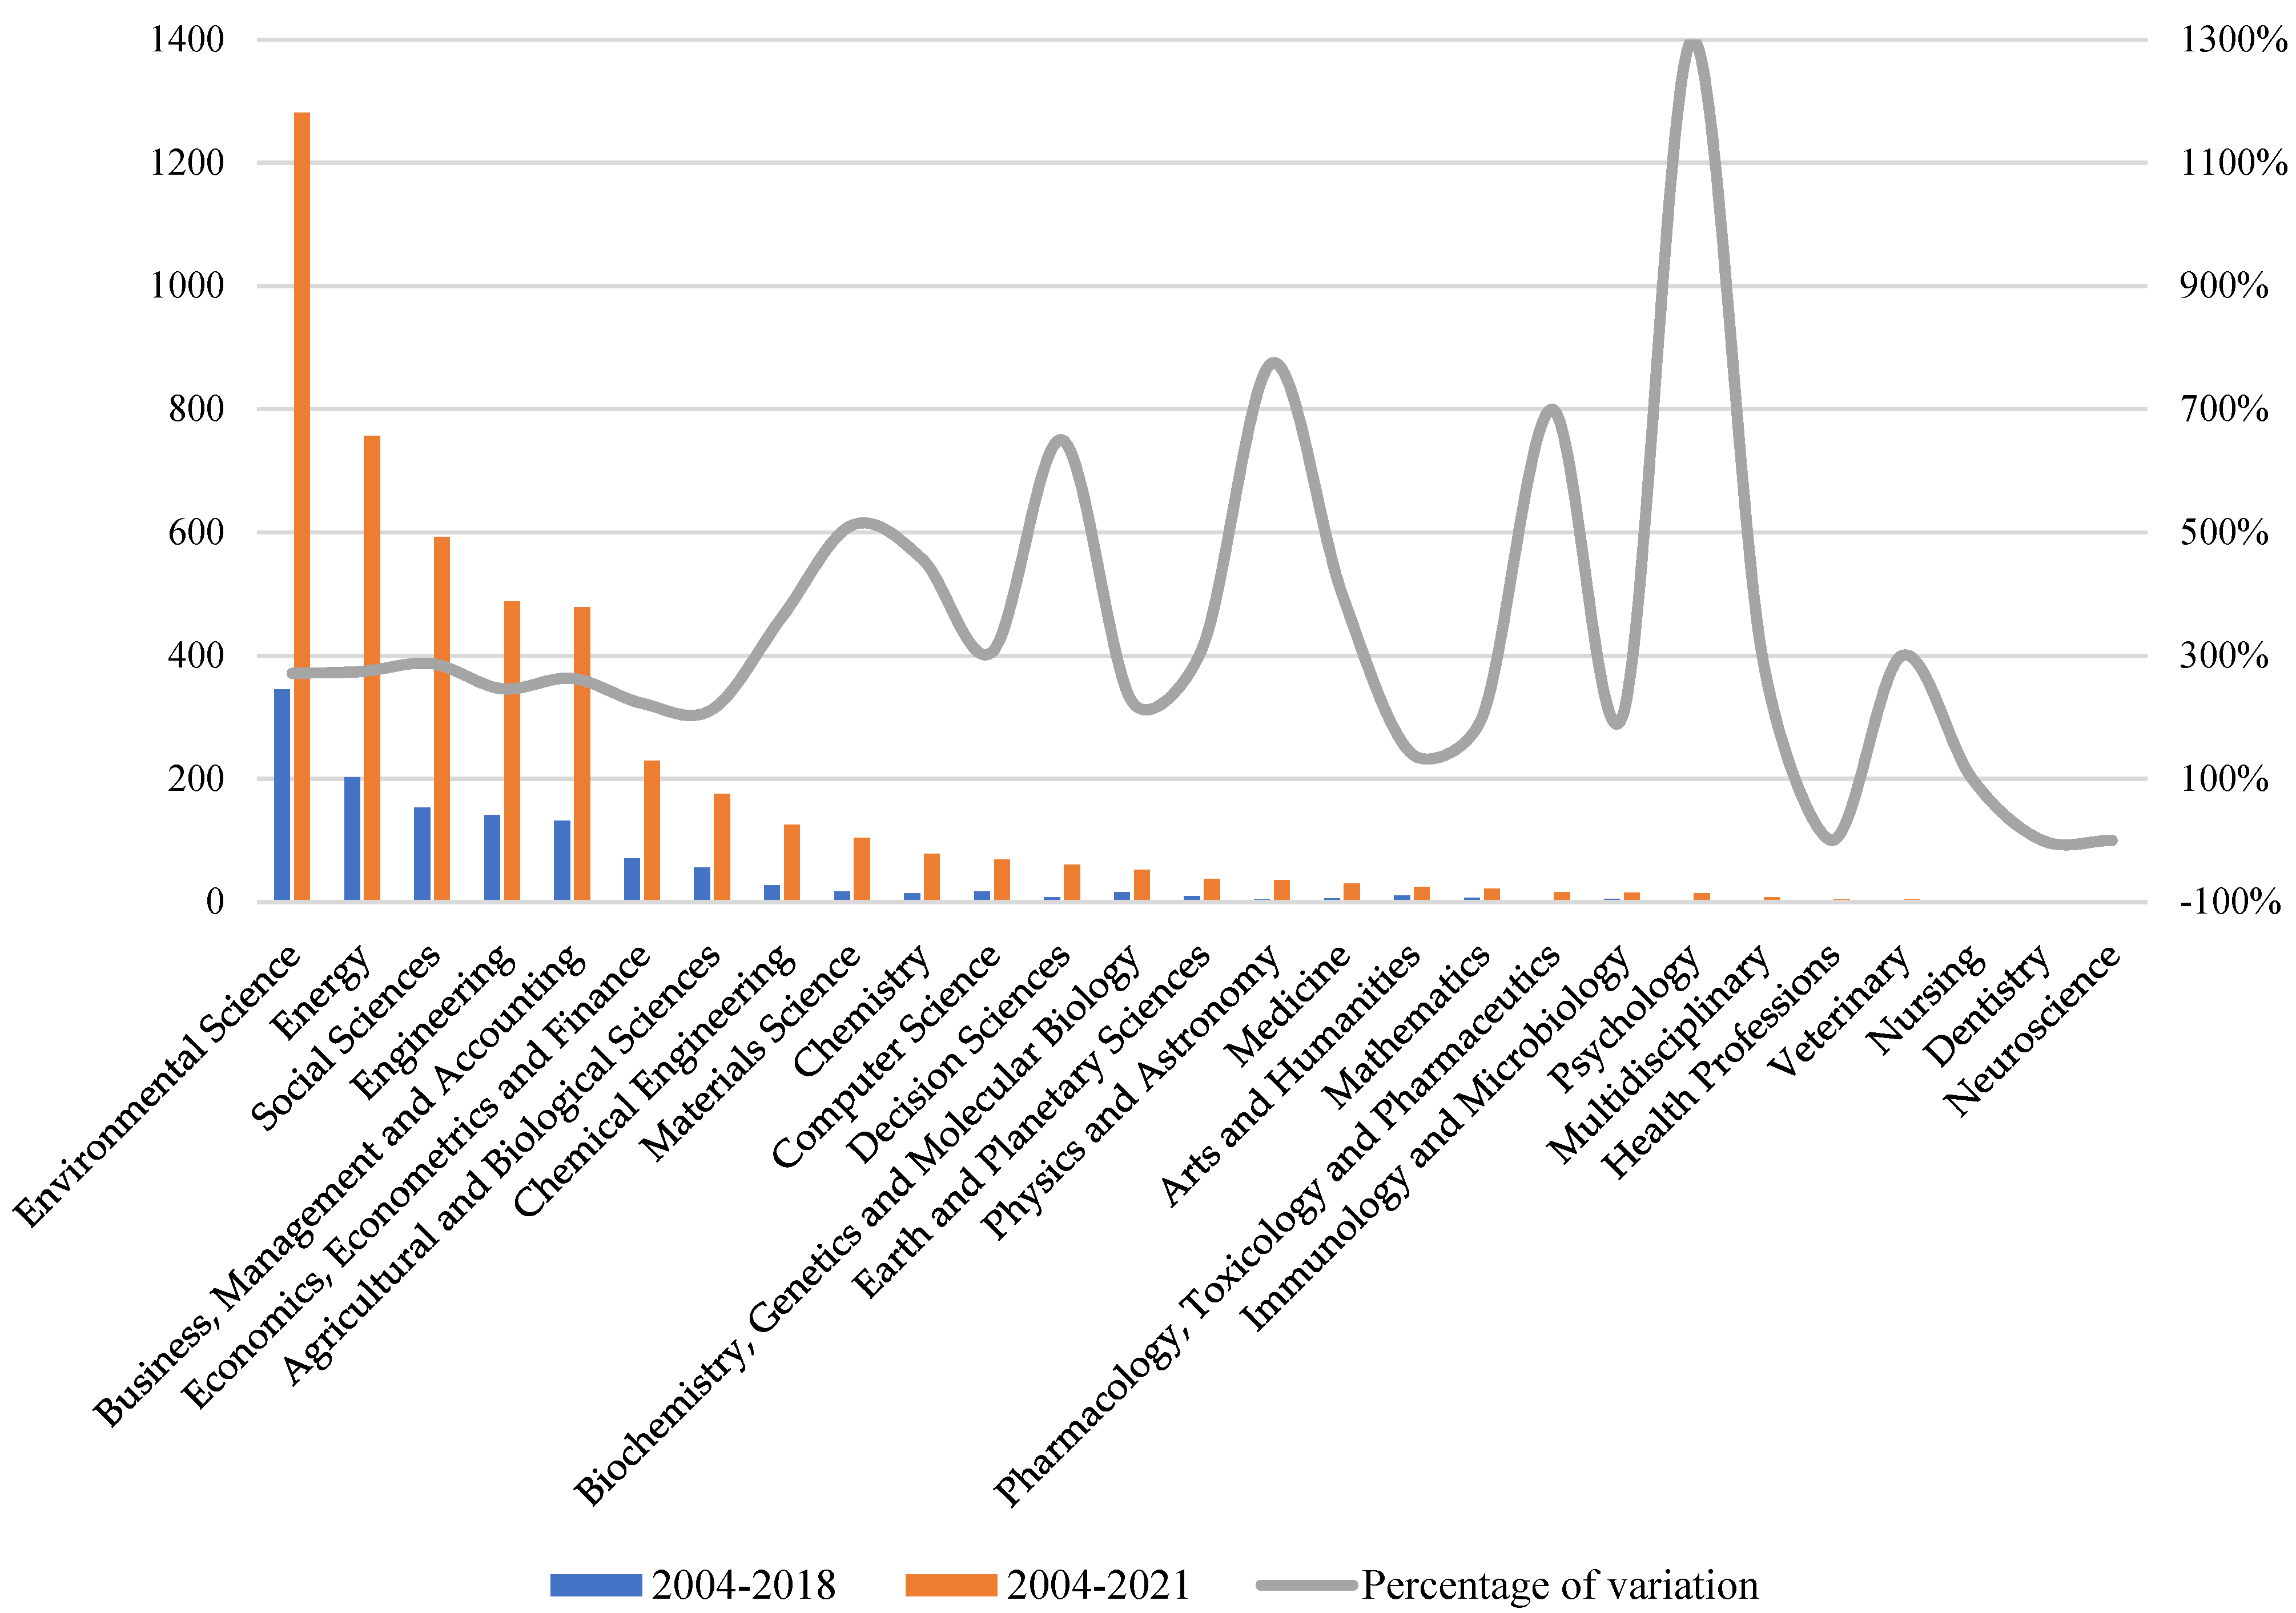
3.2. Analysis of Scientific Production by Subject Area

The Scopus [80] database allows for the research of the sample to be classified into 27 different categories according to the subject area of study. In this case, the total sample of 1961 investigations falls within the 27 available disciplines, reaching a total of 4700 documents, a value higher than the sample (1961). This is because each investigation can be considered in one or more subject area at the same time, depending on the interest of the authors and the publishers themselves.
Figure 2 mentions the 27 disciplines available in Scopus, as well as the number of publications that are part of each. The exponential increase registered in the last period analyzed (2019–May 2021) directly affects the number of publications associated with each topic, as well as their order. Therefore, to better understand how this last period has affected the line of research studied, three colors have been used. Blue represents the research published in the first five periods, which covers the period from 2004 to 2018. On the other hand, publications from the six periods that make up the sample are indicated in orange. Finally, grey signals the percentage of variation experienced between both periods.
In the 2004–2018 period, the number of disciplines framed in this line of research was 24, since there were no investigations in the categories of Health Professions, Dentistry and Neuroscience. Among the other categories that registered publications, Environmental Science with 345 investigations, Energy with 202, Social Science with 153, Engineering with 141 and Business, Management and Accounting with 132 stand out due to their higher values when compared with the rest of the disciplines. In total, these five disciplines represented 78.03% of the total sample and encompassed 973 publications. In the entire period, 2004–May 2021, these aforementioned five categories were still the main disciplines, with a 76.51% representation of the total sample. Thus, Environmental Science has registered 1281 publications to date, Energy 756, Social Science 592, Engineering 488 and Business, Management and Accounting 479. Additionally, in relation to the three thematic areas that did not register any research in the period above, they begin to gain popularity, with four publications in Health Professions and one publication in Dentistry and Neuroscience. Finally, all the categories have positive variation percentages. Psychology is worth mentioning for having the highest value (1300%), passing from 1 investigation in 2004 to 2018 to 14 publications in the full period (2004–May 2021). This discipline is followed by Physics and Astronomy with a 775% variation and Decision Sciences with 650%.
Figure 3 shows the annual evolution of the five main categories. The last year (2021) is noteworthy since it has lower values than the previous year (2020). However, this is because the year has not yet ended, so there is still research to be carried out in these disciplines. Even so, there is an increasing trend in all of them, which indicates that the number of publications in each discipline should rise.
The most representative discipline, Environmental Science, registered its first article in 2004, and from 2011 onwards, publications have been recorded annually until reaching a total of 265 articles in 2021. Environmental Science brought together a total of 1281 investigations, which represents 27% of the sample. The second category, Energy, registered its first publication in 2006, and since 2012, it has been part of annual investigations. In the last year analyzed (2021), it has had 165 publications, and in total, it has conducted 756 investigations, which represents 16% of the total scientific production. The third position is occupied by Social Science. This thematic area registered an investigation in 2004 and stands out in 2011 for being the year in which publications begin to be framed annually. In total, it represents 13% of the sample and encompasses 592 publications.
Finally, Engineering and Business, Management and Accounting are notable, with 488 and 479 publications, respectively. Both disciplines represent 10% of the total sample and have had similar documents since 2014. The remaining 22 categories are not included in the figure since they all represent less than 5% of the analyzed sample. Even so, their late incorporation into this line of research is remarkable since it is from 2017 that investigations began to be linked to most of them.

3.3. Identification of the Most Prolific Journals

Table 3 shows the 20 most prolific journals in BE and CE research in a sustainable context. This table collects the main characteristics of the research, such as the number of total citations [81], the average number of citations per article, and the h-index or the period in which they have been published. In addition, the characteristics of the journals are also indicated, such as the number of articles published, the h-index [73], the quartile to which they belong in the Scimago Journal Rank (SJR) [69] and the country of origin. These 20 journals represent 3.40% of the total number of journals that make up the sample (588). However, their high productivity makes it possible for them to represent 49.16% of the total scientific production.
Of the 20 journals considered, 70% belong to the first quartile, 25% to the second quartile and only one of them (Procedia Environmental Science Engineering and Management) to the third quartile of the SJR 2019. Nationality is not very diverse, since 85% of the journals belong to the United States (USA), the Netherlands and Switzerland.
Sustainability leads the chart due to the high values it registers. This journal has 291 research papers, 2796 total citations and an h-index for articles and journals of 24 and 68, respectively. Its first publication [27] appeared in 2013, and coincidentally, it is the article with the highest number of citations.
Journal of Cleaner Production ranks second in the table, with a total of 254 investigations and 7060 total citations, resulting in 27.80 citations per article. It has a h-index of 173 and is ranked in the first quartile, with an impact factor of 1.89. This journal stands out for having the highest h-index in articles (40) and for being the only journal that published in the first period analyzed.
Ecological Economics, in twelfth position, deserves special mention for having the highest average number of citations per article in the table, with a value of 72.65. This is due to the total number of citations received in the research, especially with regards to the publication “Circular Economy: The Concept and its Limitations” [82], which has 587. What is more, it defines the concept of CE and performs a critical analysis from the perspective of environmental sustainability.
Additionally, Renewable and Sustainable Energy Reviews is worth highlighting for having the highest values in the h-index of the journal (258) and in the impact factor (3.63). Moreover, this journal from The Netherlands registers the highest percentage of variation in the last two periods since it increased from 1 publication between 2016 and 2018 to a total of 13 publications from 2019–May 2021.
Finally, as far as the position that each journal occupies according to its publications is concerned, Applied Sciences Switzerland stands out for registering its first research in the last period (2019–May 2021).

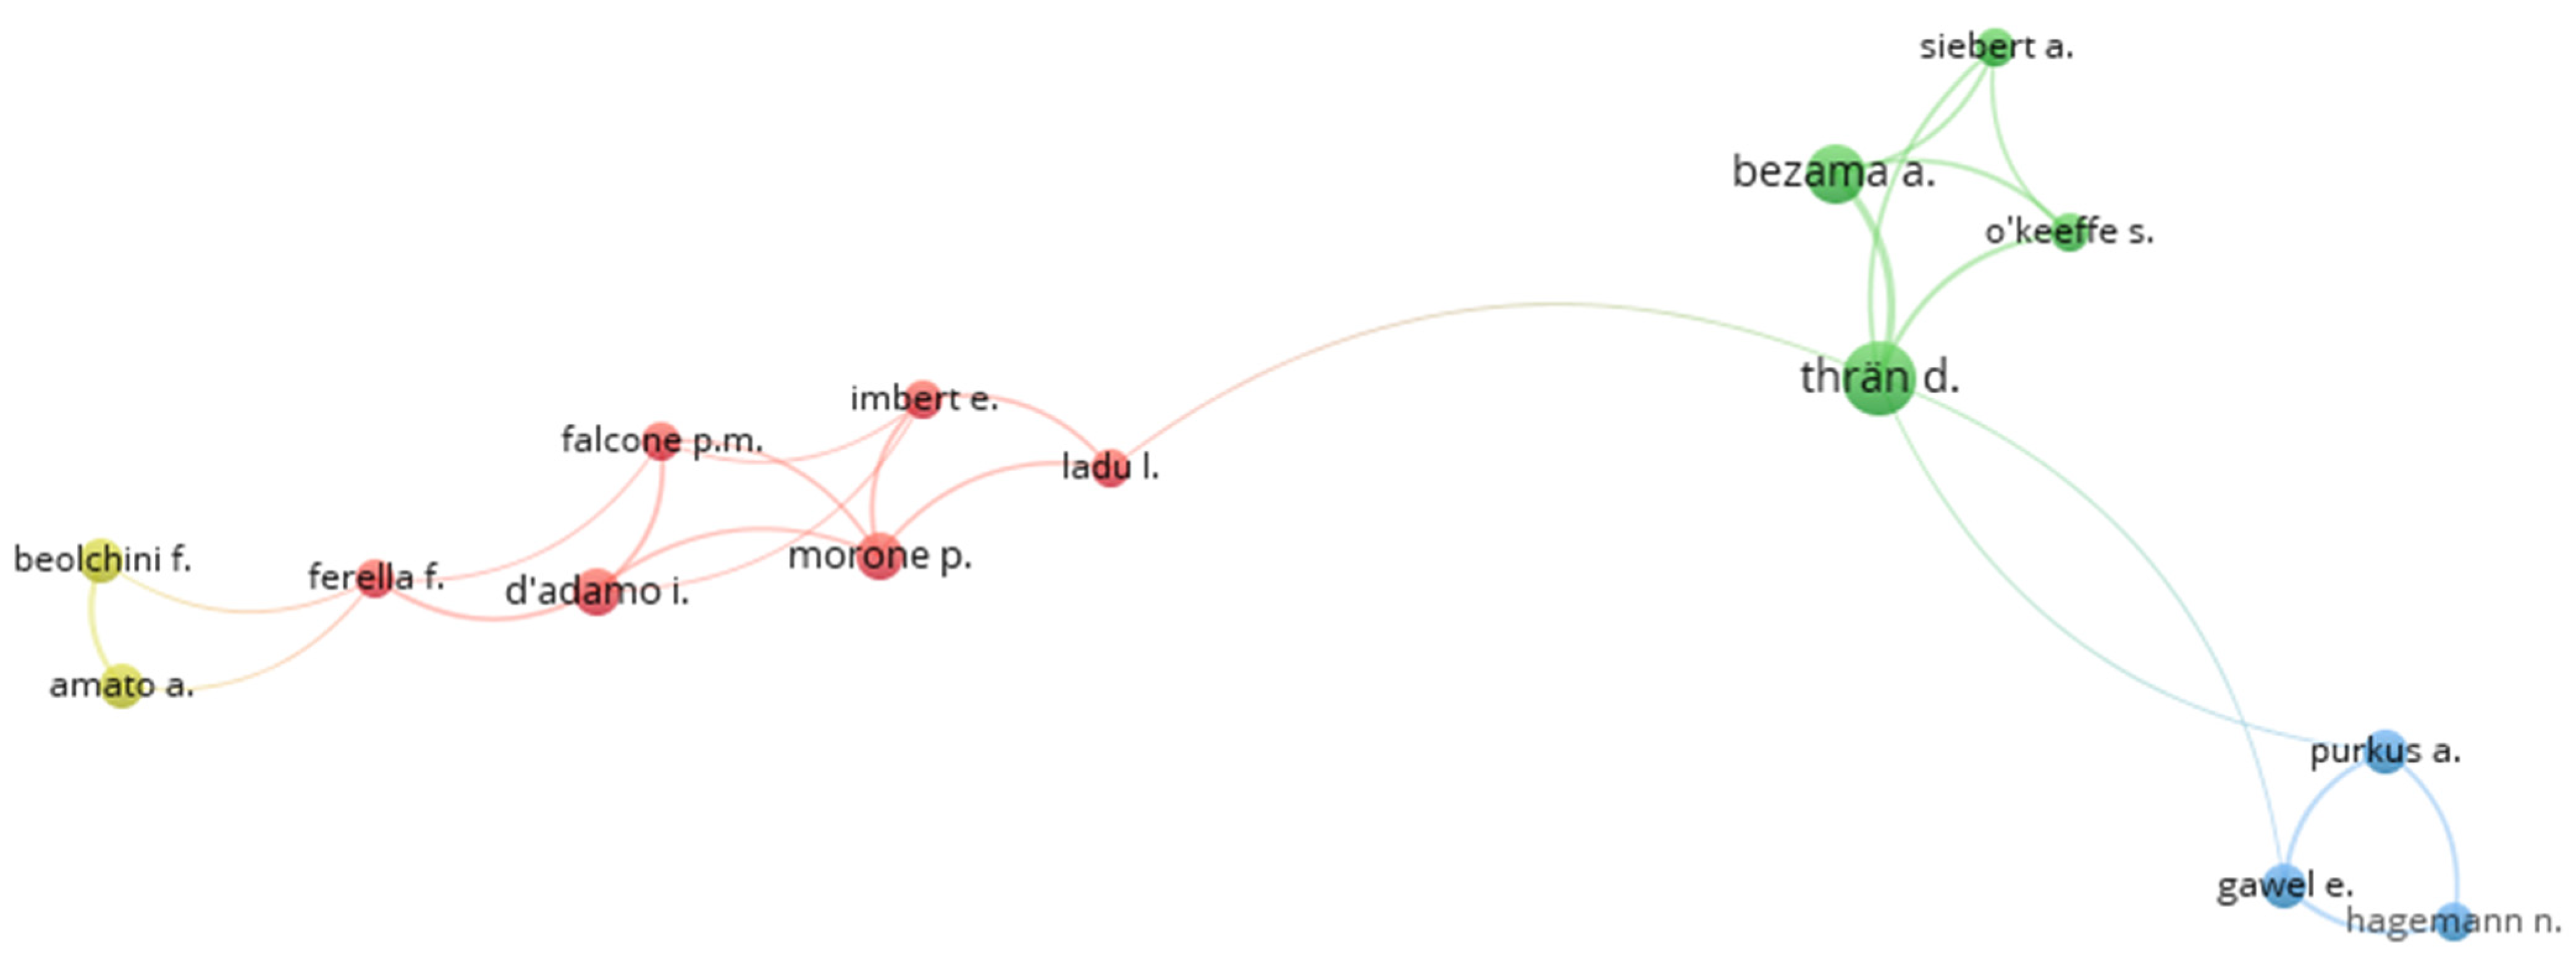
3.4. Productivity of the Most Prolific Authors from 2004 to May 2021

Table 4 shows the 10 most prolific authors, encompassing a total of 90 investigations and representing 4.59% of the total sample analyzed. This table, which displays 0.16% of the total number of active authors, indicates the number of publications, the total number of citations received, the average of citations per article, the institution to which each author belongs, their country of origin, their h-index [70] and the date of their first and last publication. In general terms, the most prolific authors started publishing research in 2014 at the earliest. In addition, 60% of the authors have published in the last year analyzed, which indicates the latent interest in this topic.
Regarding nationality, the UK and Germany possess the highest representation, both with 20%. In fact, in the case of Germany, both country of origin and institution (Helmholtz Zentrum für Umweltforschung) are repeated for the authors in the first and third positions.
Daniela Thrän is the leading author, with 14 documents, 206 total citations, and an average of 14.71 citations per research. This German author made her first contribution to this line of research in 2017 and has an h-index of 9. The second position is occupied by Anne Toppinen, with 11 research papers. She belongs to the Helsingin Yliopisto institution and is the second author on the table with the highest value both in total citations (554) and in average citations per article (50.36). She is one of the authors who has published in the last year analyzed, her most cited research being “Green, circular, bio economy: A comparative analysis of sustainability avenues” [83], published in 2017, with a total of 226 citations; it a study that offers a comparative analysis to determine the diversity within and between those concepts (Green Economy, CE and BE). Apart from this, Sergio Ulgiati appears in the fifth position, having the highest value of total citations and average of citations in the table, with 1523 and 169.22, respectively. This Chinese author belongs to the Beijing Normal University and is well-known for the publication of “A review on circular economy: The expected transition to a balanced interplay of environmental and economic systems” [15], which has a total of 1325 citations. Moreover, this publication focuses on presenting a global review of EC’s main characteristics and thus on determining to what extent it could be a solution to the need for a reduction in environmental impact. Finally, Adisa Azapagic ranks among the most prolific authors in the field of BE and CE in the framework of sustainability.
After identifying the 10 most active authors, the cooperation network based on co-authorship is shown below. Figure 4 graphically represents the relationship between authors through the VOSviewer tool [75]. The analysis was carried out for the 142 most prolific authors and concluded that only 15 of them established relationships with other authors. Four different clusters are differentiated among the established co-authorship. The size of the circles indicates the number of documents published by each author, and the lines specify the degree of cooperation between the indicated authors.
The first cluster, in yellow, is represented by Alessia Amato and Francesca Beolchini. These authors belong to the Università Politecnica delle Marche and have five investigations, sharing co-authorship in all of them [84,85,86,87]. Likewise, in “Sustainability analysis of innovative technologies for the rare earth elements recovery” [88], demonstrating the environmental and economic benefits derived from the production of rare earth elements from waste, a co-author of the red cluster (Francesco Ferella) is located.
The second cluster, in red, includes Idiano D’Adamo, Piergiuseppe Morone, Pasquale Marcello Falcone, Luana Ladu, Enrica Imbert, and Francesco Ferella. This collaboration group stands out for being the widest and for having authors of Italian and German nationality. Furthermore, based on this international collaboration between Italian and German authors, research is carried out for both countries [89].
The third cluster, in green, includes the prolific authors Daniela Thrän, Alberto Benguria Bezama, Anke Siebert and Sinéad O’Keeffe. All of them belong to the same institution, Helmholtz Zentrum für Umweltforschung, [90] and register joint investigations such as “Social life cycle assessment indices and indicators to monitor the social implications of wood-based products” [45] or “Social life cycle assessment: in pursuit of a framework for assessing wood-based products from bioeconomy regions in Germany” [91]. The first publication focuses on developing a set of social indices and related indicators to be applied to wood production systems in Germany, and the second focuses on establishing a Specific Regional Social Life Cycle Assessment to inform producers about the possible social effects of the product.
Finally, the blue cluster to the right of the figure includes Alexandra Purkus, Erik Gawel and Nina Hagemann. All three authors are German, and therefore their research on BE and CE within the sustainability framework focuses on their country, Germany. Some of their articles are “Towards a sustainable innovation system for the German wood-based bioeconomy: Implications for policy design”, which reviews the role of policies in supporting innovation systems, particularly in the case of the German wood-based bioeconomy, and “Possible futures towards a wood-based bioeconomy: A Scenario Analysis for Germany”, which focuses on identifying the wood-based bioeconomy as an alternative that has the potential to be developed [43,92].
It is worth highlighting that out of the 15 authors that make up Figure 4, seven are Italian and eight are German. Thus, this analysis of international cooperation not only shows the scarce collaboration that exists among the most prolific authors but also the non-existent international collaboration among the rest of the active authors from other countries.

3.5. Characteristics of the Main Institutions Throughout the Investigation

Table 5 shows the 10 most productive institutions for the period analyzed (2004–May 2021). The table details the country to which these institutions belong, the number of research papers, the total citations received, the average number of citations per article and their h-index. The total sample is made up of 4666 institutions, and thus the 10 listed in the table represent 0.21%. However, they have a total of 246 publications, which is a 12.54% representation of the total scientific production. The 10 most prolific institutions share a European origin, although those from The Netherlands have a greater presence, specifically with 30% representation.
Delft University of Technology is the institution at the top of the table, with 47 publications and 1985 total citations. In this sense, this institution from The Netherlands has an average of 42.23 citations per article and an h-index of 16. It is followed by Parthenope University of Naples and Alma Mater Studiorum Università di Bologna, with similar values in total citations: 1616 and 1577, respectively. Furthermore, these same two institutions register the highest values in the table in terms of average citations per article, being 73.45 for Parthenope University of Naples and 68.57 for Alma Mater Studiorum Università di Bologna. Finally, the institution in tenth place, Helmholtz Zentrum für Umweltforschung, stands out for having the second highest h-index (13).
This table also refers to international collaboration developed among the institutions. The highest percentage of international collaboration is held by Lunds Universitet with a value of 76.2%, since it registers 16 international investigations compared with 5 national investigations. This institution is closely followed by Parthenope University of Naples and Wageningen University & Research, both with 63.6% international collaboration. Regarding the number of total citations, Alma Mater Studiorum Università di Bologna has the highest value (212.14) in international research and the lowest value in national publications (5.75).
On the other hand, the institution with the lowest value in international research is Danmarks Tekniske Universitet: it records 11.75 total citations. In terms of citations for articles without international collaboration, Lunds Universitet has the highest value (52.60). Of the eight institutions considered in the table, only two of them have more citations in research carried out nationally.
Finally, a distinction is made between national and international publications in the first five periods (2004–2018), and the publications made internationally and nationally in the last period (2019–May 2021). This analysis shows the recent interest in this line of research and the increase in international collaboration among some institutions.

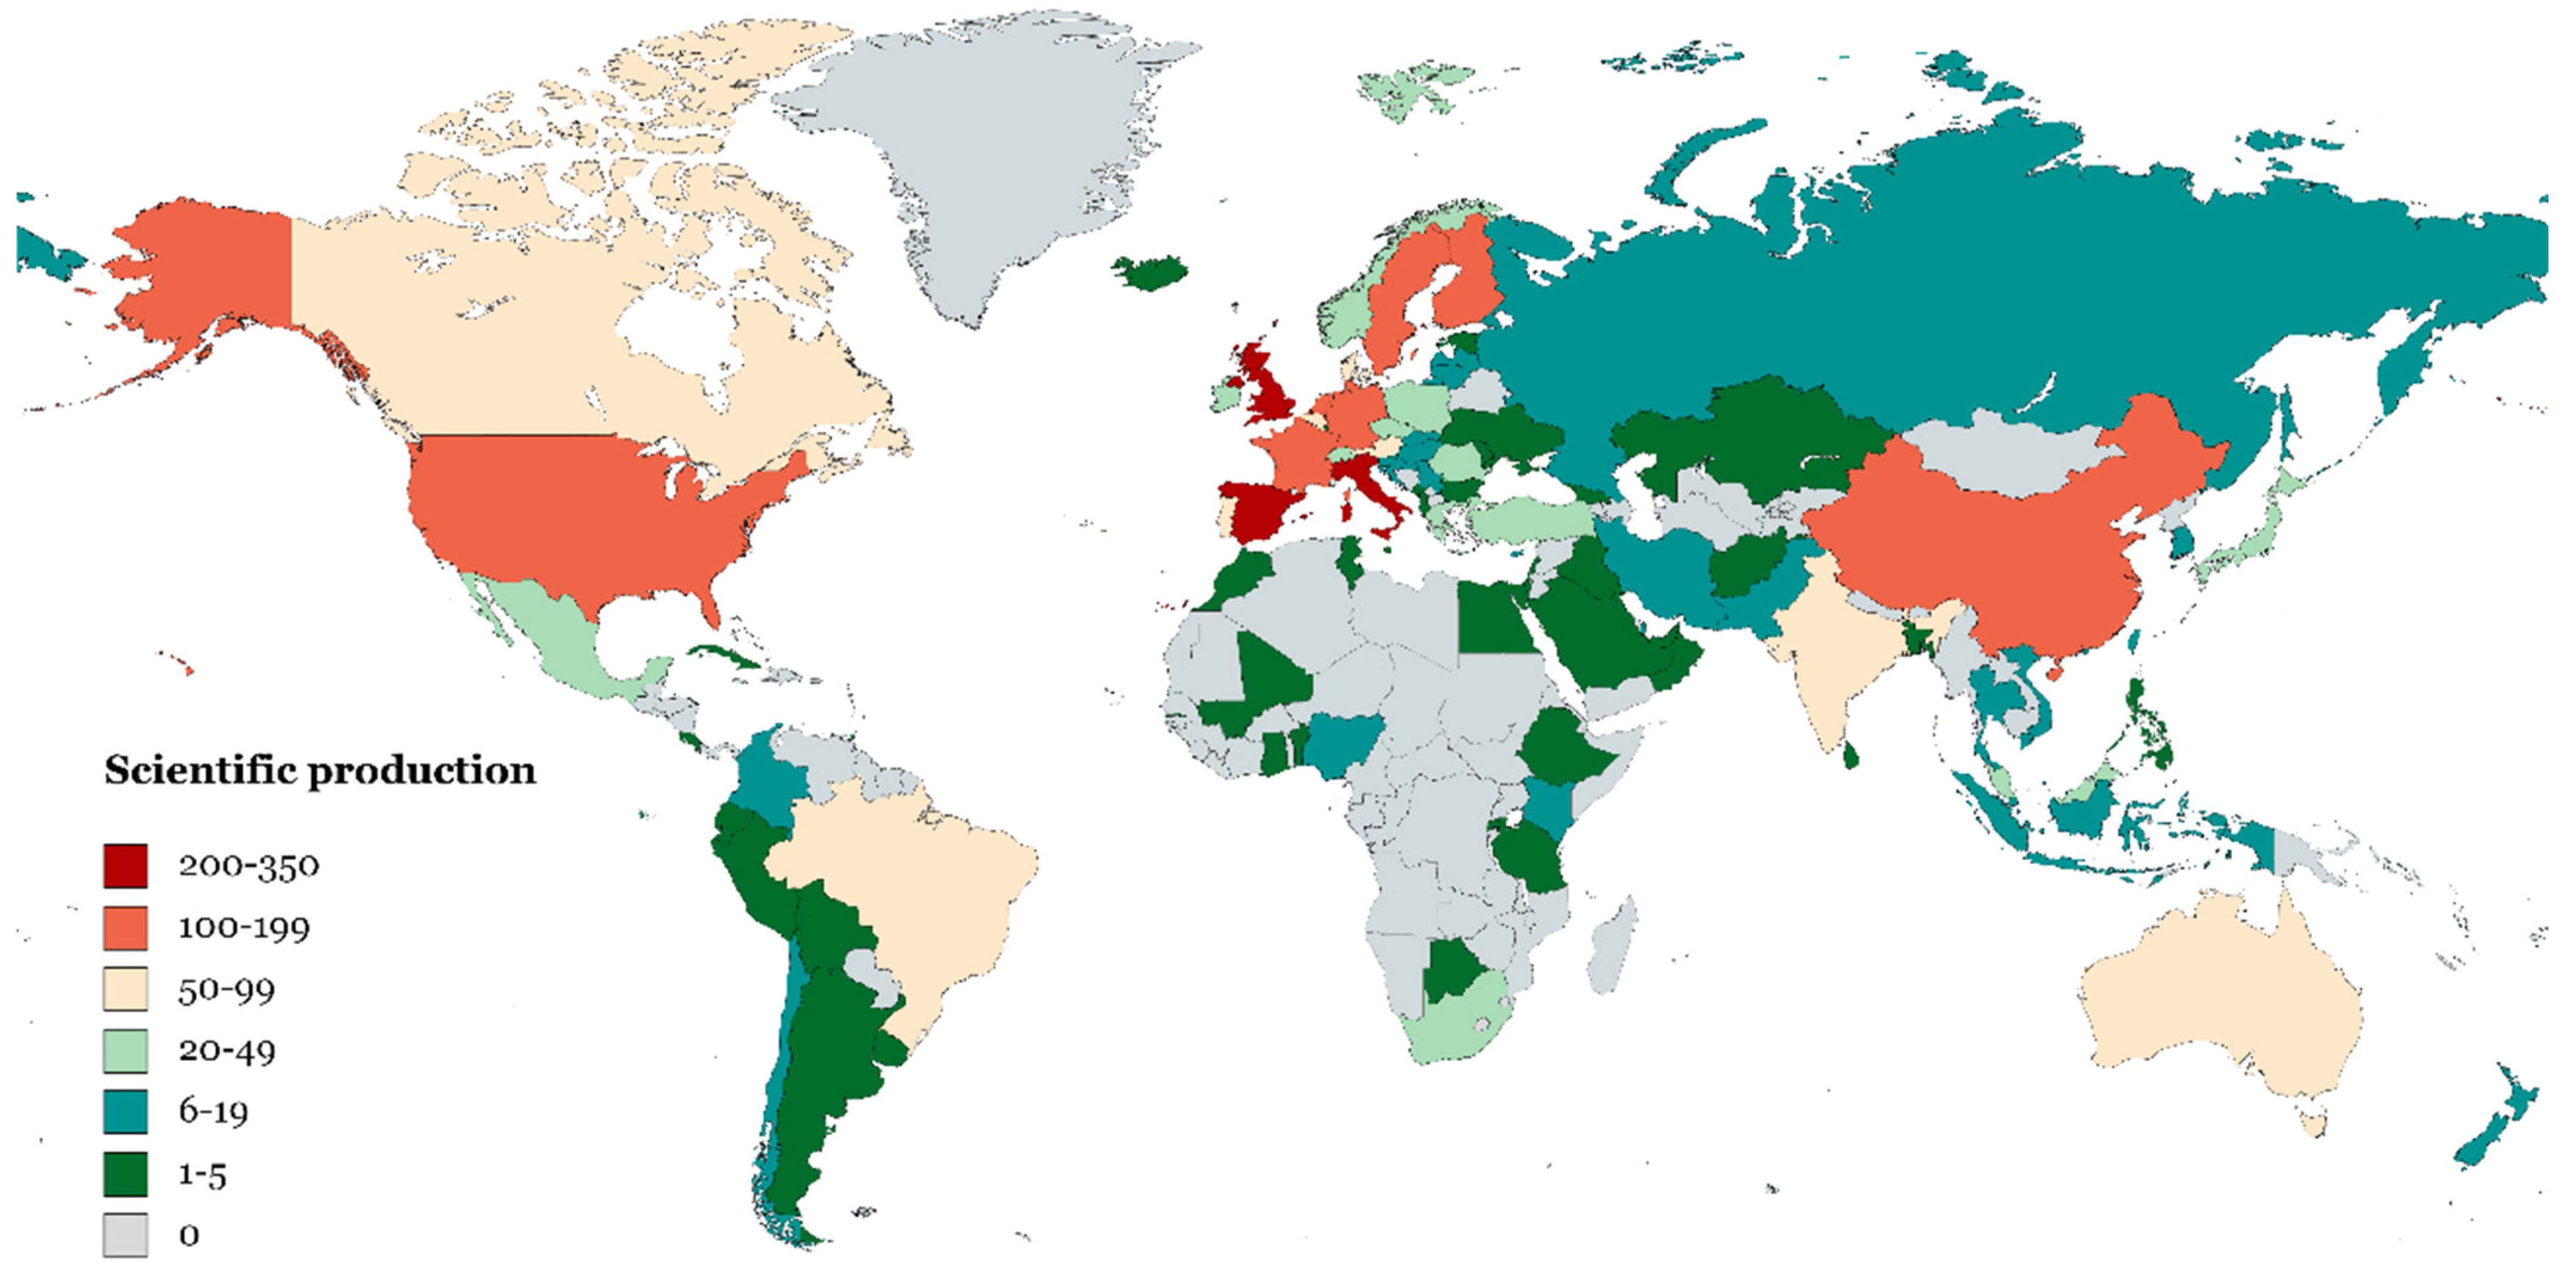
3.6. Main Countries in Scientific Production

The total sample of countries that make up the scientific production is 87. The 10 most relevant in this line of research are mentioned in Table 6. The table shows the research carried out, the total citations, the average number of citations, the h-index, and the ranking they occupy based on the articles published. In addition, the date of the first and last research highlights current interest in this line of research, as all 10 countries were still publishing in the last period analyzed (May 2021).
Italy leads the table with 331 investigations, 5057 total citations and an average of 15.28 citations per article. Moreover, this country has an h-index of 30 and is still publishing today. UK, with 232 investigations, appears second. This country has the highest values in total citations (6295) and h-index (37). “The Circular Economy: An Interdisciplinary Exploration of the Concept and Application in a Global Context” [93] and “Product design and business model strategies for a circular economy” [94] are among the most cited publications for this country, with more than 500 citations each. The first publication traces CE’s conceptualizations and origins, while the second provides information on the strategies that should be introduced throughout the business model to move from a line economy to a CE.
China is the country with the longest research trajectory as its first research entitled “Education for regional sustainable development: experiences from the education framework of HHCEPZ Project” [95] was published in 2006. In addition, this research studied the ability to achieve successful awareness and an expansion of knowledge about sustainable development from an educational framework. On the other hand, the countries with the shortest history due to their late incorporation into this line of research are Spain, Germany and France, since they published their first investigations in the period 2013–2015.
Finally, Sweden registers the highest average number of citations per article (35.58). This value is due to the research “A review on circular economy: The expected transition to a balanced interplay of environmental and economic systems” [15], which has 1325 total citations, being the most cited of all the articles produced by the most prolific countries.
Figure 5 represents the world map with the countries that have contributed to scientific production from 2004 to the present. This map provides information about the countries that occupy an advantageous position in scientific production and those that still have research to do.
The countries in dark red are those that have published between 200 and 350 research papers. Italy, UK and Spain can be found in this classification. The second ranking, in orange, is represented by the remaining seven most prolific countries. Therefore, the 10 most active countries in BE and CE research in the context of sustainability can be found between these two phases. There are eight countries, which have published between 50 and 99 articles (India, Brazil, Portugal, Denmark, Belgium, Austria, Australia and Canada), in third place. In the fourth classification, indicated in light green, there is a total of 12 countries that register between 20 and 49 publications. Finally, for the last two categories, the number of countries rises to 24, having produced between 6 and 19 articles, and 42 countries for those that have published between one and five investigations on this subject.
Table 7 details the collaborative activity of the 10 most prolific countries. This table indicates the number of collaborators, the main collaborators, the collaboration index, and the average of total citations received for national and international articles.
Italy, which is the most prolific country in terms of number of publications, registers 46 collaborators and has a total collaboration index of 42%. Spain, Germany, France, Sweden and The Netherlands are the countries with which it cooperates the most. The UK, the second country in the table, has the highest number of collaborators (61). In addition, this country has the highest average number of citations in national articles, with a value of 30.53. France, in the last position on the table, is the second country with the highest number of collaborators (57) and registers the highest index of international collaboration (76%). This is the main reason why this country has the lowest total citations in national articles as well, specifically 5.96. China and Sweden closely follow France in terms of collaboration index, with 64.9% and 64.3%, respectively. On the other hand, Spain registers the lowest value of total citations (10.60) in international research, while Sweden has the highest (42.42). Finally, Spain, Germany and China have collaborators from countries that are not among the 10 most prolific.

3.7. Analysis of the Keywords Used during 2004–May 2021

Table 8 shows the 20 main keywords used in scientific production. The table classifies the terms according to the number of articles in which they are mentioned as well as the ranking in which they are positioned for each period. The total number of terms included in the sample is 11,594, since different interests in this line of research have arisen in the period analyzed.
Sustainable Development ranks first for its high number of occurrences. In the first period (2004–2006), it registers three documents, which places it at the top of the ranking. This first term differs from the rest due to its high values, since throughout the entire time horizon, it registers occurrences higher than the rest. In fact, in the last period analyzed (2019–May 2021), it occupies the first position in the ranking, almost tripling the value of the second keyword with the most occurrences.
Taking into account the year in which the terms are framed in the investigations, Waste Management stands out, together with Sustainable Development, as the only ones that register publications for the first period analyzed (2004–206). On the other hand, if attention is paid to the number of occurrences that each term in the table receives, Recycling, Life Cycle Assessment (LCA) and Life Cycle occupy the main positions together with the two terms mentioned above. These five main terms offer a glimpse of the latent interest in this line of research. In fact, as mentioned throughout the results, much of the scientific production is based on offering sustainable alternatives and processes to improve the current environmental situation. Finally, of the 15 remaining concepts in Table 8, those with the terms Environmental and Economic stand out, since they have a representation percentage greater than 50%. These data allow us to intuit the close relationship established between BE and CE and economic and environmental variables.
The high volume of keywords used in scientific production makes it difficult to visualize the evolution of the main terms. Therefore, Figure 6 shows the number of publications in which the five keywords with the highest number of occurrences over the period studied appear and their trend line.
The first term, Sustainable Development, is represented in orange in the figure. The year with the highest percentage variation (700%) was 2014, since it went from one occurrence in the previous year to eight. The recycling term, in blue, registers the greatest variations in the years 2014 and 2016, both with a variation of 200%. In grey, Waste Management registers the highest percentage variation in 2016 with an increase in publications from two to seven. Finally, Life Cycle Assessment (LCA) and Life Cycle, in yellow and green, respectively, register the highest percentage of representation in 2016 and describe a similar trend line. These data show the greatest interest that these terms began to receive from 2016, a year that coincides precisely with the official implementation of the 2030 Agenda and the SDGs.
Figure 7 represents a network map with the main keywords. This analysis has been carried out for the 400 terms with the highest number of occurrences. In this case, each color refers to a group of terms that share a scope of study, for which a total of four clusters are differentiated.
The first cluster, in red, includes 145 keywords and is represented by the term Sustainable Development. In this field of study, the words with the highest number of occurrences are Economic Analysis, Economic Conditions, Decision Making, Planning, Governance Approach and Implementation Process. As can be seen, this group of concepts refers to the process of moving towards a more sustainable model, mainly from economic and governmental perspectives. In fact, there are numerous publications that choose to carry out research on this field of study [2,11,96,97,98].
The second cluster, in green, contains a total of 112 keywords. This cluster refers to the study of water treatment and the alternatives available to improve the agricultural context in a sustainable way. The terms with the highest number of occurrences and which define the study interest are Biomass, Bioenergy, Biogas, Fertilizers, Water, Sewage Sludge and Wastewater Treatment. Regarding the scientific production of these types of studies, “Sewage sludge disposal strategies for sustainable development” stands out for the citations received [99] among numerous investigations in this field [48,100,101,102].
The third cluster, with a total of 72 concepts, is shown in yellow. This cluster is led by the term Life Cycle Assessment (LCA) and includes other concepts such as Environmental Impact, Energy Consumption and Footprint. This group of words represents research that analyzes the environmental impact of processes or products throughout their entire life cycle. An example of this cluster is “Guidelines for evaluating the environmental performance of Product/Service-Systems through life cycle assessment” [20].
The last cluster, in blue, is represented by the terms Waste Management and Recycling. This cluster encompasses a total of 71 terms, and Waste Disposal, Municipal Solid Waste, Plastic Waste and Plastic Recycling are the ones that register the most occurrences. In this way, this group of words is associated with research that focuses on alternatives for managing plastics and products derived from industrial activity and their correct management as its main theme [103,104,105,106,107].

3.8. Discussion

Both the literature review and the quantitative analysis provide revealing data on the global interest in progressing towards sustainability. The results show an exponential increase in the last years analyzed, since 73% of the total sample has occurred in the last period (2019–May 2021). This is due to the current great commitment to providing encouraging results that can serve as a precedent for future research and that favor a more sustainable economy in all sectors [26,52]. However, the expansion experienced in scientific production may also be due to the multidisciplinary nature of the field of study since research requires knowledge from various disciplines. In this context, the main thematic areas associated with this line of research (Energy, Social Sciences, Engineering and Business, Management and Accounting) are in line with the varied interests of the SDGs, which promote sustainable production processes, support climate action and promote economic growth, among other things [42,44,45,46]. Furthermore, some recent research indicates that it is necessary to maintain a balance between resources so as not to compromise those in the future [11,12,13]. In this sense, it is necessary to take into account the global tendency to integrate sustainable measures in all the processes that conform the economic models, insomuch as leaving resources or wasting stages may reduce or slow down the implementation. In the same way, among the research currently being carried out, CE and BE are considered tools that enhance sustainability as they can promote their development based on their main functions of conservation of biological resources and regenerative systems.
Among the rest of the data provided, Daniela Thrän is noteworthy for being the most prolific author and the Delft University of Technology for leading the ranking with the highest values in number of publications (47), total citations (1985) and H index (16). Furthermore, in geographical terms, Italy, the United Kingdom and Spain register the highest number of publications. Regarding journals, Sustainability stands out for leading the ranking with a total of 291 publications, which represents 14.84% of the total scientific production. This journal presents case studies that expand the available scientific knowledge and that support the effectiveness of these terms in response to environmental and social challenges that may arise [7,41].
Analysis of the keywords reveals that Economic Analysis, Economic Conditions, Decision Making, Planning, Governance Approach and Implementation Process are the most used in scientific production. This analysis of terms allows us to determine the wide scope of study that includes CE and BE as these can contribute positively to an environmental improvement from different study disciplines. In this context, the governance approach and decision-making receive special importance in this matter since adequate political involvement is necessary for progress in sustainable matters [43]. On the other hand, referring to the keywords that contain economic terms, the latent interest in planning a correct and viable activity based on BE and CE is clarified. Finally, taking into account the analysis of the literature review, the low percentage of research that focuses on specific case studies that can serve as a precedent for other countries or sectors is mentioned [91], since a large part of the publications dedicate their efforts to clarifying and delimiting the functions of each concept.

4. Conclusions

The aim of this study was to show the current state and evolution of research on CE and BE, as well as to analyze the implications on sustainability of joint implementation. A double systematic and bibliometric review was carried out for all the published scientific production, which made it possible to identify the main driving agents of the research and the disciplines in which the published publications are framed.
Studies indicate that the strategic integration of BE and CE favors both the transformation of the economic model and changes in current consumption habits. However, environmental policies that allow for the transition from linear to circular models are necessary. In fact, the multidisciplinary approach discussed in thematic areas makes it possible to locate the numerous categories in which political actions must exercise influence to favor sustainability. Therefore, future research should carry out an analysis of the sustainable results obtained from current environmental policies.
This research has some limitations, which could lay the groundwork for future studies. The results addressed in this research have been obtained through quantitative techniques, and consequently they could be completed with additional information obtained from other qualitative or quantitative tools. On the other hand, future publications could delve into the implications and key points of the sustainability of other concepts, since this would allow us to determine which current measures have a more positive environmental impact. Finally, the study might be expanded with research registered in other databases.
The contribution of this research focuses on providing quantitative and qualitative knowledge in the field of CE and BE together with sustainability. For this reason, the results of this work are of great interest to researchers who wish to obtain a global and updated vision of the state of the research. In addition, the results may be useful for policy makers, especially when designing programs and strategies aimed at contributing to sustainability in production processes and specific activities.

Author Contributions

Conceptualization, E.A.-S. and L.J.B.-U.; Data curation, E.A.-S., A.B.-d., M.-D.G.-Z. and L.J.B.-U.; Formal analysis, E.A.-S., A.B.-d., M.-D.G.-Z. and L.J.B.-U.; Funding acquisition, L.J.B.-U.; Investigation, E.A.-S., A.B.-d., M.-D.G.-Z. and L.J.B.-U.; Methodology, E.A.-S., A.B.-d., M.-D.G.-Z. and L.J.B.-U.; Project administration, E.A.-S. and L.J.B.-U.; Resources, E.A.-S., A.B.-d., M.-D.G.-Z. and L.J.B.-U.; Software, E.A.-S., A.B.-d., M.-D.G.-Z. and L.J.B.-U.; Supervision, E.A.-S., A.B.-d., M.-D.G.-Z. and L.J.B.-U.; Validation, E.A.-S. and L.J.B.-U.; Visualization, E.A.-S., A.B.-d., M.-D.G.-Z. and L.J.B.-U.; Writing—original draft, E.A.-S., A.B.-d., M.-D.G.-Z. and L.J.B.-U.; Writing—review and editing, E.A.-S. and A.B.-d. All authors have read and agreed to the published version of the manuscript.

Funding

This work was supported by the University of Almeria in the form of a Research Grant for the development of a Ph.D. thesis and therefore of this article.

Data Availability Statement

Data were obtained from Elsevier’s Scopus database (www.scopus.com, accessed on 21 June 2021).

Acknowledgments

The authors would like to gratefully acknowledge the Pre-doctoral Contract for the Training of Research Staff under the 2019 Research and Transfer Plan (PPIT2019).

Conflicts of Interest

The authors declare no conflict of interest.

References

  1. Gorissen, L.; Vrancken, K.; Manshoven, S. Transition Thinking and Business Model Innovation—Towards a Transformative Business Model and New Role for the Reuse Centers of Limburg, Belgium. Sustainability 2016, 8, 112. [Google Scholar] [CrossRef] [Green Version]
  2. Slorach, P.C.; Jeswani, H.K.; Cuéllar-Franca, R.; Azapagic, A. Environmental and Economic Implications of Recovering Resources from Food Waste in a Circular Economy. Sci. Total Environ. 2019, 693, 133516. [Google Scholar] [CrossRef] [PubMed]
  3. Greyson, J. An Economic Instrument for Zero Waste, Economic Growth and Sustainability. J. Clean. Prod. 2007, 15, 1382–1390. [Google Scholar] [CrossRef]
  4. Khoshnevisan, B.; Tabatabaei, M.; Tsapekos, P.; Rafiee, S.; Aghbashlo, M.; Lindeneg, S.; Angelidaki, I. Environmental Life Cycle Assessment of Different Biorefinery Platforms Valorizing Municipal Solid Waste to Bioenergy, Microbial Protein, Lactic and Succinic Acid. Renew. Sustain. Energy Rev. 2020, 117, 109493. [Google Scholar] [CrossRef]
  5. de Villiers, C.; Kuruppu, S.; Dissanayake, D. A (New) Role for Business—Promoting the United Nations’ Sustainable Development Goals through the Internet-of-Things and Blockchain Technology. J. Bus. Res. 2021, 131, 598–609. [Google Scholar] [CrossRef]
  6. Brilha, J.; Gray, M.; Pereira, D.I.; Pereira, P. Geodiversity: An Integrative Review as a Contribution to the Sustainable Management of the Whole of Nature. Environ. Sci. Policy 2018, 86, 19–28. [Google Scholar] [CrossRef] [Green Version]
  7. Hoehn, D.; Laso, J.; Margallo, M.; Ruiz-Salmón, I.; Amo-Setién, F.J.; Abajas-Bustillo, R.; Sarabia, C.; Quiñones, A.; Vázquez-Rowe, I.; Bala, A.; et al. Introducing a Degrowth Approach to the Circular Economy Policies of Food Production, and Food Loss and Waste Management: Towards a Circular Bioeconomy. Sustainability 2021, 13, 3379. [Google Scholar] [CrossRef]
  8. Sampedro, J.; Smith, S.J.; Arto, I.; González-Eguino, M.; Markandya, A.; Mulvaney, K.M.; Pizarro-Irizar, C.; Van Dingenen, R. Health Co-Benefits and Mitigation Costs as per the Paris Agreement under Different Technological Pathways for Energy Supply. Environ. Int. 2020, 136, 105513. [Google Scholar] [CrossRef]
  9. Ramcilovic-Suominen, S.; Pülzl, H. Sustainable Development—A ‘Selling Point’ of the Emerging EU Bioeconomy Policy Framework? J. Clean. Prod. 2018, 172, 4170–4180. [Google Scholar] [CrossRef]
  10. Janssens, C.; Havlík, P.; Krisztin, T.; Baker, J.; Frank, S.; Hasegawa, T.; Leclère, D.; Ohrel, S.; Ragnauth, S.; Schmid, E.; et al. Global Hunger and Climate Change Adaptation through International Trade. Nat. Clim. Chang. 2020, 10, 829–835. [Google Scholar] [CrossRef]
  11. Moosmann, D.; Majer, S.; Ugarte, S.; Ladu, L.; Wurster, S.; Thrän, D. Strengths and Gaps of the EU Frameworks for the Sustainability Assessment of Bio-Based Products and Bioenergy. Energy Sustain. Soc. 2020, 10, 22. [Google Scholar] [CrossRef]
  12. Millward-Hopkins, J.; Purnell, P. Circulating Blame in the Circular Economy: The Case of Wood-Waste Biofuels and Coal Ash. Energy Policy 2019, 129, 168–172. [Google Scholar] [CrossRef]
  13. Abad-Segura, E.; Morales, M.E.; Cortés-García, F.J.; Belmonte-Ureña, L.J. Industrial Processes Management for a Sustainable Society: Global Research Analysis. Processes 2020, 8, 631. [Google Scholar] [CrossRef]
  14. Timko, M.T. A World Without Waste. IEEE Eng. Manag. Rev. 2019, 47, 106–109. [Google Scholar] [CrossRef]
  15. Ghisellini, P.; Cialani, C.; Ulgiati, S. A Review on Circular Economy: The Expected Transition to a Balanced Interplay of Environmental and Economic Systems. J. Clean. Prod. 2016, 114, 11–32. [Google Scholar] [CrossRef]
  16. Kalmykova, Y.; Sadagopan, M.; Rosado, L. Circular Economy—From Review of Theories and Practices to Development of Implementation Tools. Resour. Conserv. Recycl. 2018, 135, 190–201. [Google Scholar] [CrossRef]
  17. Chen, T.-L.; Kim, H.; Pan, S.-Y.; Tseng, P.-C.; Lin, Y.-P.; Chiang, P.-C. Implementation of Green Chemistry Principles in Circular Economy System towards Sustainable Development Goals: Challenges and Perspectives. Sci. Total Environ. 2020, 716, 136998. [Google Scholar] [CrossRef] [PubMed]
  18. Elia, V.; Gnoni, M.G.; Tornese, F. Measuring Circular Economy Strategies through Index Methods: A Critical Analysis. J. Clean. Prod. 2017, 142, 2741–2751. [Google Scholar] [CrossRef]
  19. Zijp, M.C.; Waaijers-van der Loop, S.L.; Heijungs, R.; Broeren, M.L.M.; Peeters, R.; Van Nieuwenhuijzen, A.; Shen, L.; Heugens, E.H.W.; Posthuma, L. Method Selection for Sustainability Assessments: The Case of Recovery of Resources from Waste Water. J. Environ. Manag. 2017, 197, 221–230. [Google Scholar] [CrossRef]
  20. Kjaer, L.L.; Pigosso, D.C.A.; McAloone, T.C.; Birkved, M. Guidelines for Evaluating the Environmental Performance of Product/Service-Systems through Life Cycle Assessment. J. Clean. Prod. 2018, 190, 666–678. [Google Scholar] [CrossRef] [Green Version]
  21. Fisher, O.; Watson, N.; Porcu, L.; Bacon, D.; Rigley, M.; Gomes, R.L. Cloud Manufacturing as a Sustainable Process Manufacturing Route. J. Manuf. Syst. 2018, 47, 53–68. [Google Scholar] [CrossRef]
  22. Vandewalle, D.; Antunes, V.; Neves, J.; Freire, A.C. Assessment of Eco-Friendly Pavement Construction and Maintenance Using Multi-Recycled Rap Mixtures. Recycling 2020, 5, 17. [Google Scholar] [CrossRef]
  23. D’Amato, D.; Droste, N.; Winkler, K.J.; Toppinen, A. Thinking Green, Circular or Bio: Eliciting Researchers’ Perspectives on a Sustainable Economy with Q Method. J. Clean. Prod. 2019, 230, 460–476. [Google Scholar] [CrossRef]
  24. Meyer, R. Bioeconomy Strategies: Contexts, Visions, Guiding Implementation Principles and Resulting Debates. Sustainability 2017, 9, 1031. [Google Scholar] [CrossRef] [Green Version]
  25. Istudor, L.G.; Suciu, M.C. Bioeconomy and Circular Economy in the European Food Retail Sector. Eur. J. Sustain. Dev. 2020, 9, 501–511. [Google Scholar] [CrossRef]
  26. Jander, W.; Grundmann, P. Monitoring the Transition towards a Bioeconomy: A General Framework and a Specific Indicator. J. Clean. Prod. 2019, 236, 117564. [Google Scholar] [CrossRef]
  27. Staffas, L.; Gustavsson, M.; McCormick, K. Strategies and Policies for the Bioeconomy and Bio-Based Economy: An Analysis of Official National Approaches. Sustainability 2013, 5, 2751–2769. [Google Scholar] [CrossRef] [Green Version]
  28. Tsolakis, N.; Niedenzu, D.; Simonetto, M.; Dora, M.; Kumar, M. Supply Network Design to Address United Nations Sustainable Development Goals: A Case Study of Blockchain Implementation in Thai Fish Industry. J. Bus. Res. 2021, 131, 495–519. [Google Scholar] [CrossRef]
  29. D’Amato, D.; Korhonen, J.; Toppinen, A. Circular, Green, and Bio Economy: How Do Companies in Land-Use Intensive Sectors Align with Sustainability Concepts? Ecol. Econ. 2019, 158, 116–133. [Google Scholar] [CrossRef]
  30. Dimic-Misic, K.; Barceló, E.; Brkić, V.S.; Gane, P. Identifying the Challenges of Implementing a European Bioeconomy Based on Forest Resources: Reality Demands Circularity. FME Trans. 2019, 47, 60–69. [Google Scholar] [CrossRef]
  31. Gatto, F.; Re, I. Circular Bioeconomy Business Models to Overcome the Valley of Death. A Systematic Statistical Analysis of Studies and Projects in Emerging Bio-Based Technologies and Trends Linked to the SME Instrument Support. Sustainability 2021, 13, 1899. [Google Scholar] [CrossRef]
  32. Ryabchenko, O.; Golub, G.; Turčeková, N.; Adamičková, I.; Zapototskyi, S. Sustainable Business Modeling of Circular Agriculture Production: Case Study of Circular Bioeconomy. J. Secur. Sustain. Issues 2017, 7, 301–309. [Google Scholar] [CrossRef]
  33. Liobikiene, G.; Chen, X.; Streimikiene, D.; Balezentis, T. The Trends in Bioeconomy Development in the European Union: Exploiting Capacity and Productivity Measures Based on the Land Footprint Approach. Land Use Policy 2020, 91, 104375. [Google Scholar] [CrossRef]
  34. Liobikiene, G.; Balezentis, T.; Streimikiene, D.; Chen, X. Evaluation of Bioeconomy in the Context of Strong Sustainability. Sustain. Dev. 2019, 27, 955–964. [Google Scholar] [CrossRef]
  35. Stewart, R.; Niero, M. Circular Economy in Corporate Sustainability Strategies: A Review of Corporate Sustainability Reports in the Fast-Moving Consumer Goods Sector. Bus. Strategy Environ. 2018, 27, 1005–1022. [Google Scholar] [CrossRef] [Green Version]
  36. Abad-Segura, E.; Cortés-García, F.J.; Belmonte-Ureña, L.J. The Sustainable Approach to Corporate Social Responsibility: A Global Analysis and Future Trends. Sustainability 2019, 11, 5382. [Google Scholar] [CrossRef] [Green Version]
  37. Belmonte-Ureña, L.J.; Plaza-Úbeda, J.A.; Vazquez-Brust, D.; Yakovleva, N. Circular Economy, Degrowth and Green Growth as Pathways for Research on Sustainable Development Goals: A Global Analysis and Future Agenda. Ecol. Econ. 2021, 185, 107050. [Google Scholar] [CrossRef]
  38. Leal Filho, W.; Azeiteiro, U.; Alves, F.; Pace, P.; Mifsud, M.; Brandli, L.; Caeiro, S.S.; Disterheft, A. Reinvigorating the Sustainable Development Research Agenda: The Role of the Sustainable Development Goals (SDG). Int. J. Sustain. Dev. World Ecol. 2018, 25, 131–142. [Google Scholar] [CrossRef] [Green Version]
  39. Bebbington, J.; Unerman, J. Achieving the United Nations Sustainable Development Goals: An Enabling Role for Accounting Research. Account. Audit. Account. J. 2018, 31, 2–24. [Google Scholar] [CrossRef]
  40. Le Blanc, D. Towards Integration at Last? The Sustainable Development Goals as a Network of Targets. Sustain. Dev. 2015, 23, 176–187. [Google Scholar] [CrossRef]
  41. Zeug, W.; Bezama, A.; Moesenfechtel, U.; Jähkel, A.; Thrän, D. Stakeholders’ Interests and Perceptions of Bioeconomy Monitoring Using a Sustainable Development Goal Framework. Sustainability 2019, 11, 1511. [Google Scholar] [CrossRef] [Green Version]
  42. Rosegrant, M.W.; Ringler, C.; Zhu, T.; Tokgoz, S.; Bhandary, P. Water and Food in the Bioeconomy: Challenges and Opportunities for Development. Agric. Econ. 2013, 44, 139–150. [Google Scholar] [CrossRef]
  43. Hagemann, N.; Gawel, E.; Purkus, A.; Pannicke, N.; Hauck, J. Possible Futures towards Awood-Based Bioeconomy: A Scenario Analysis for Germany. Sustainability 2016, 8, 98. [Google Scholar] [CrossRef] [Green Version]
  44. Cristóbal, J.; Matos, C.T.; Aurambout, J.P.; Manfredi, S.; Kavalov, B. Environmental Sustainability Assessment of Bioeconomy Value Chains. Biomass Bioenergy 2016, 89, 159–171. [Google Scholar] [CrossRef]
  45. Siebert, A.; Bezama, A.; O’Keeffe, S.; Thrän, D. Social Life Cycle Assessment Indices and Indicators to Monitor the Social Implications of Wood-Based Products. J. Clean. Prod. 2018, 172, 4074–4084. [Google Scholar] [CrossRef]
  46. Calicioglu, Ö.; Bogdanski, A. Linking the Bioeconomy to the 2030 Sustainable Development Agenda: Can SDG Indicators Be Used to Monitor Progress towards a Sustainable Bioeconomy? New Biotechnol. 2021, 61, 40–49. [Google Scholar] [CrossRef]
  47. Dodson, J.R.; Parker, H.L.; García, A.M.; Hicken, A.; Asemave, K.; Farmer, T.J.; He, H.; Clark, J.H.; Hunt, A.J. Bio-Derived Materials as a Green Route for Precious & Critical Metal Recovery and Re-Use. Green Chem. 2015, 17, 1951–1965. [Google Scholar] [CrossRef]
  48. Zabaniotou, A. Redesigning a Bioenergy Sector in EU in the Transition to Circular Waste-Based Bioeconomy-A Multidisciplinary Review. J. Clean. Prod. 2018, 177, 197–206. [Google Scholar] [CrossRef]
  49. Krishnan, R.; Agarwal, R.; Bajada, C.; Arshinder, K. Redesigning a Food Supply Chain for Environmental Sustainability—An Analysis of Resource Use and Recovery. J. Clean. Prod. 2020, 242, 118374. [Google Scholar] [CrossRef]
  50. Guan, Z.; Lu, X.; Yang, W.; Wu, L.; Wang, N.; Zhang, Z. Achieving Efficient and Privacy-Preserving Energy Trading Based on Blockchain and ABE in Smart Grid. J. Parallel Distrib. Comput. 2021, 147, 34–45. [Google Scholar] [CrossRef]
  51. Alhola, K.; Ryding, S.O.; Salmenperä, H.; Busch, N.J. Exploiting the Potential of Public Procurement: Opportunities for Circular Economy. J. Ind. Ecol. 2019, 23, 96–109. [Google Scholar] [CrossRef] [Green Version]
  52. Bröring, S.; Laibach, N.; Wustmans, M. Innovation Types in the Bioeconomy. J. Clean. Prod. 2020, 266, 121939. [Google Scholar] [CrossRef]
  53. Sheridan, K. Making the Bioeconomy Circular: The Biobased Industries’ Next Goal? Ind. Biotechnol. 2016, 12, 339–340. [Google Scholar] [CrossRef]
  54. Jonnalagadda, S.R.; Goyal, P.; Huffman, M.D. Automating Data Extraction in Systematic Reviews: A Systematic Review. Syst. Rev. 2015, 4, 78. [Google Scholar] [CrossRef] [PubMed] [Green Version]
  55. Duque-Acevedo, M.; Belmonte-Ureña, L.J.; Cortés-García, F.J.; Camacho-Ferre, F. Agricultural Waste: Review of the Evolution, Approaches and Perspectives on Alternative Uses. Glob. Ecol. Conserv. 2020, 22, e00902. [Google Scholar] [CrossRef]
  56. Greenhalgh, T.; Robert, G.; Macfarlane, F.; Bate, P.; Kyriakidou, O. Diffusion of Innovations in Service Organizations: Systematic Review and Recommendations. Milbank Q. 2004, 82, 581–629. [Google Scholar] [CrossRef] [Green Version]
  57. Janssen, I.; LeBlanc, A.G. Systematic Review of the Health Benefits of Physical Activity and Fitness in School-Aged Children and Youth. Int. J. Behav. Nutr. Phys. Act. 2010, 7, 40. [Google Scholar] [CrossRef] [Green Version]
  58. Gutiérrez-Salcedo, M.; Martínez, M.Á.; Moral-Munoz, J.A.; Herrera-Viedma, E.; Cobo, M.J. Some Bibliometric Procedures for Analyzing and Evaluating Research Fields. Appl. Intell. 2018, 48, 1275–1287. [Google Scholar] [CrossRef]
  59. Abad-Segura, E.; de la Fuente, A.B.; González-Zamar, M.D.; Belmonte-Ureña, L.J. Effects of Circular Economy Policies on the Environment and Sustainable Growth: Worldwide Research. Sustainability 2020, 12, 5792. [Google Scholar] [CrossRef]
  60. Velasco-Muñoz, J.F.; Aznar-Sánchez, J.A.; Batlles-delaFuente, A.; Fidelibus, M.D. Sustainable Irrigation in Agriculture: An Analysis of Global Research. Water 2019, 11, 1758. [Google Scholar] [CrossRef] [Green Version]
  61. Duque-Acevedo, M.; Belmonte-Ureña, L.J.; Plaza-Úbeda, J.A.; Camacho-Ferre, F. The Management of Agricultural Waste Biomass in the Framework of Circular Economy and Bioeconomy: An Opportunity for Greenhouse Agriculture in Southeast Spain. Agronomy 2020, 10, 489. [Google Scholar] [CrossRef] [Green Version]
  62. Herrera-Franco, G.; Montalván-Burbano, N.; Carrión-Mero, P.; Jaya-Montalvo, M.; Gurumendi-Noriega, M. Worldwide Research on Geoparks through Bibliometric Analysis. Sustainability 2021, 13, 1175. [Google Scholar] [CrossRef]
  63. Harzing, A.W.; Alakangas, S. Google Scholar, Scopus and the Web of Science: A Longitudinal and Cross-Disciplinary Comparison. Scientometrics 2016, 106, 787–804. [Google Scholar] [CrossRef]
  64. Mongeon, P.; Paul-Hus, A. The Journal Coverage of Web of Science and Scopus: A Comparative Analysis. Scientometrics 2016, 106, 213–228. [Google Scholar] [CrossRef]
  65. Vatananan-Thesenvitz, R.; Schaller, A.-A.; Shannon, R. A Bibliometric Review of the Knowledge Base for Innovation in Sustainable Development. Sustainability 2019, 11, 5783. [Google Scholar] [CrossRef] [Green Version]
  66. Liu, F.; Lai, K.H.; Cai, W. Responsible Production for Sustainability: Concept Analysis and Bibliometric Review. Sustainability 2021, 13, 1275. [Google Scholar] [CrossRef]
  67. Cossarini, D.M.; MacDonald, B.H.; Wells, P.G. Communicating Marine Environmental Information to Decision Makers: Enablers and Barriers to Use of Publications (Grey Literature) of the Gulf of Maine Council on the Marine Environment. Ocean. Coast. Manag. 2014, 96, 163–172. [Google Scholar] [CrossRef]
  68. Gusmão Caiado, R.G.; Leal Filho, W.; Quelhas, O.L.G.; Luiz de Mattos Nascimento, D.; Ávila, L.V. A Literature-Based Review on Potentials and Constraints in the Implementation of the Sustainable Development Goals. J. Clean. Prod. 2018, 198, 1276–1288. [Google Scholar] [CrossRef]
  69. Cahn, E.S. Journal Rankings. Int. J. Inf. Syst. Serv. Sect. 2014, 6, 92–103. [Google Scholar] [CrossRef]
  70. Hirsch, J.E. An Index to Quantify an Individual’s Scientific Research Output. Proc. Natl. Acad. Sci. USA 2005, 102, 16569–16572. [Google Scholar] [CrossRef] [Green Version]
  71. Bar-Ilan, J. Which H-Index?—A Comparison of WoS, Scopus and Google Scholar. Scientometrics 2008, 74, 257–271. [Google Scholar] [CrossRef]
  72. Costas, R.; Bordons, M. The H-Index: Advantages, Limitations and Its Relation with Other Bibliometric Indicators at the Micro Level. J. Informetr. 2007, 1, 193–203. [Google Scholar] [CrossRef] [Green Version]
  73. Hodge, D.R.; Lacasse, J.R. Evaluating Journal Quality: Is the H-Index a Better Measure than Impact Factors? Res. Soc. Work Pract. 2011, 21, 222–230. [Google Scholar] [CrossRef] [Green Version]
  74. Cronin, B. Bibliometrics and beyond: Some Thoughts on Web-Based Citation Analysis. J. Inf. Sci. 2001, 27, 1–7. [Google Scholar] [CrossRef]
  75. van Eck, N.J.; Waltman, L. Software Survey: VOSviewer, a Computer Program for Bibliometric Mapping. Scientometrics 2010, 84, 523–538. [Google Scholar] [CrossRef] [PubMed] [Green Version]
  76. Waltman, L.; van Eck, N.J.; Noyons, E.C.M. A Unified Approach to Mapping and Clustering of Bibliometric Networks. J. Informetr. 2010, 4, 629–635. [Google Scholar] [CrossRef] [Green Version]
  77. Rafols, I.; Porter, A.L.; Leydesdorff, L. Science Overlay Maps: A New Tool for Research Policy and Library Management. J. Am. Soc. Inf. Sci. Technol. 2010, 61, 1871–1887. [Google Scholar] [CrossRef] [Green Version]
  78. Strebel, H.; Posch, A. Interorganisational Cooperation for Sustainable Management in Industry: On Industrial Recycling Networks and Sustainability Networks. Prog. Ind. Ecol. 2004, 1, 348–362. [Google Scholar] [CrossRef]
  79. United Nations The Sustainable Development Agenda—United Nations Sustainable Development. Available online: https://www.un.org/sustainabledevelopment/development-agenda/ (accessed on 11 June 2021).
  80. Burnham, J.F. Scopus Database: A Review. Biomed. Digit. Libr. 2006, 3, 1–8. [Google Scholar] [CrossRef] [Green Version]
  81. Eysenbach, G. Citation Advantage of Open Access Articles. PLoS Biol. 2006, 4, e157. [Google Scholar] [CrossRef] [PubMed]
  82. Korhonen, J.; Honkasalo, A.; Seppälä, J. Circular Economy: The Concept and Its Limitations. Ecol. Econ. 2018, 143, 37–46. [Google Scholar] [CrossRef]
  83. D’Amato, D.; Droste, N.; Allen, B.; Kettunen, M.; Lähtinen, K.; Korhonen, J.; Leskinen, P.; Matthies, B.D.; Toppinen, A. Green, Circular, Bio Economy: A Comparative Analysis of Sustainability Avenues. J. Clean. Prod. 2017, 168, 716–734. [Google Scholar] [CrossRef]
  84. Amato, A.; Beolchini, F. End-of-Life CIGS Photovoltaic Panel: A Source of Secondary Indium and Gallium. Prog. Photovolt. Res. Appl. 2019, 27, 229–236. [Google Scholar] [CrossRef]
  85. Amato, A.; Becci, A.; Mariani, P.; Carducci, F.; Ruello, M.L.; Monosi, S.; Giosuè, C.; Beolchini, F. End-of-Life Liquid Crystal Display Recovery: Toward a Zero-Waste Approach. Appl. Sci. 2019, 9, 2985. [Google Scholar] [CrossRef] [Green Version]
  86. Amato, A.; Bigi, G.P.; Baldini, C.; Beolchini, F. Sustainable Reduction of the Odor Impact of Painting Wooden Products for Interior Design. Appl. Sci. 2020, 10, 8124. [Google Scholar] [CrossRef]
  87. Amato, A.; Mastrovito, M.; Becci, A.; Beolchini, F. Environmental Sustainability Analysis of Case Studies of Agriculture Residue Exploitation. Sustainability 2021, 13, 3990. [Google Scholar] [CrossRef]
  88. Amato, A.; Becci, A.; Birloaga, I.; De Michelis, I.; Ferella, F.; Innocenzi, V.; Ippolito, N.M.M.; Pillar Jimenez Gomez, C.; Vegliò, F.; Beolchini, F. Sustainability Analysis of Innovative Technologies for the Rare Earth Elements Recovery. Renew. Sustain. Energy Rev. 2019, 106, 41–53. [Google Scholar] [CrossRef]
  89. Imbert, E.; Ladu, L.; Morone, P.; Quitzow, R. Comparing Policy Strategies for a Transition to a Bioeconomy in Europe: The Case of Italy and Germany. Energy Res. Soc. Sci. 2017, 33, 70–81. [Google Scholar] [CrossRef]
  90. Helmholtz-Centre for Environmental Research. Internships. Available online: https://www.ufz.de/index.php?en=36937 (accessed on 11 May 2021).
  91. Siebert, A.; Bezama, A.; O’Keeffe, S.; Thrän, D. Social Life Cycle Assessment: In Pursuit of a Framework for Assessing Wood-Based Products from Bioeconomy Regions in Germany. Int. J. Life Cycle Assess. 2018, 23, 651–662. [Google Scholar] [CrossRef] [Green Version]
  92. Purkus, A.; Hagemann, N.; Bedtke, N.; Gawel, E. Towards a Sustainable Innovation System for the German Wood-Based Bioeconomy: Implications for Policy Design. J. Clean. Prod. 2018, 172, 3955–3968. [Google Scholar] [CrossRef]
  93. Murray, A.; Skene, K.; Haynes, K. The Circular Economy: An Interdisciplinary Exploration of the Concept and Application in a Global Context. J. Bus. Ethics 2017, 140, 369–380. [Google Scholar] [CrossRef] [Green Version]
  94. Bocken, N.M.P.; de Pauw, I.; Bakker, C.; van der Grinten, B. Product Design and Business Model Strategies for a Circular Economy. J. Ind. Prod. Eng. 2016, 33, 308–320. [Google Scholar] [CrossRef] [Green Version]
  95. Gao, C.; Hou, H.; Zhang, J.; Zhang, H.; Gong, W. Education for Regional Sustainable Development: Experiences from the Education Framework of HHCEPZ Project. J. Clean. Prod. 2006, 14, 994–1002. [Google Scholar] [CrossRef]
  96. Ribeiro Siman, R.; Yamane, L.H.; de Lima Baldam, R.; Pardinho Tackla, J.; de Assis Lessa, S.F.; Mendonça de Britto, P. Governance Tools: Improving the Circular Economy through the Promotion of the Economic Sustainability of Waste Picker Organizations. Waste Manag. 2020, 105, 148–169. [Google Scholar] [CrossRef] [PubMed]
  97. Dietz, T.; Börner, J.; Förster, J.J.; von Braun, J. Governance of the Bioeconomy: A Global Comparative Study of National Bioeconomy Strategies. Sustainability 2018, 10, 3190. [Google Scholar] [CrossRef] [Green Version]
  98. Cullen, U.A.; De Angelis, R. Circular Entrepreneurship: A Business Model Perspective. Resour. Conserv. Recycl. 2021, 168, 105300. [Google Scholar] [CrossRef]
  99. Kacprzak, M.; Neczaj, E.; Fijałkowski, K.; Grobelak, A.; Grosser, A.; Worwag, M.; Rorat, A.; Brattebo, H.; Almås, Å.; Singh, B.R. Sewage Sludge Disposal Strategies for Sustainable Development. Environ. Res. 2017, 156, 39–46. [Google Scholar] [CrossRef]
  100. Egle, L.; Rechberger, H.; Zessner, M. Overview and Description of Technologies for Recovering Phosphorus from Municipal Wastewater. Resour. Conserv. Recycl. 2015, 105, 325–346. [Google Scholar] [CrossRef]
  101. Molina-Moreno, V.; Leyva-Díaz, J.C.; Llorens-Montes, F.J.; Cortés-García, F.J. Design of Indicators of Circular Economy as Instruments for the Evaluation of Sustainability and Efficiency in Wastewater from Pig Farming Industry. Water 2017, 9, 653. [Google Scholar] [CrossRef]
  102. Cavicchi, B.; Palmieri, S.; Odaldi, M. The Influence of Local Governance: Effects on the Sustainability of Bioenergy Innovation. Sustainability 2017, 9, 406. [Google Scholar] [CrossRef] [Green Version]
  103. Hahladakis, J.N.; Iacovidou, E. An Overview of the Challenges and Trade-Offs in Closing the Loop of Post-Consumer Plastic Waste (PCPW): Focus on Recycling. J. Hazard. Mater. 2019, 380, 120887. [Google Scholar] [CrossRef] [PubMed]
  104. Vanapalli, K.R.; Sharma, H.B.; Ranjan, V.P.; Samal, B.; Bhattacharya, J.; Dubey, B.K.; Goel, S. Challenges and Strategies for Effective Plastic Waste Management during and Post COVID-19 Pandemic. Sci. Total Environ. 2021, 750, 141514. [Google Scholar] [CrossRef] [PubMed]
  105. Dahlbo, H.; Poliakova, V.; Mylläri, V.; Sahimaa, O.; Anderson, R. Recycling Potential of Post-Consumer Plastic Packaging Waste in Finland. Waste Manag. 2018, 71, 52–61. [Google Scholar] [CrossRef] [PubMed]
  106. Ferronato, N.; Gorritty Portillo, M.A.; Guisbert Lizarazu, E.G.; Torretta, V.; Bezzi, M.; Ragazzi, M. The Municipal Solid Waste Management of La Paz (Bolivia): Challenges and Opportunities for a Sustainable Development. Waste Manag. Res. 2018, 36, 288–299. [Google Scholar] [CrossRef] [PubMed]
  107. Srivastava, V.; Vaish, B.; Singh, R.P.; Singh, P. An Insight to Municipal Solid Waste Management of Varanasi City, India, and Appraisal of Vermicomposting as Its Efficient Management Approach. Environ. Monit. Assess. 2020, 192, 191. [Google Scholar] [CrossRef] [PubMed]
Figure 1. Comparison between the number of articles published and their variation percentage (2004–May 2021).
Sustainability 13 07182 g001
Figure 2. Comparison of the growth trends and the percentage variation of the subject areas (2004-May 2021).
Sustainability 13 07182 g002
Figure 3. Comparison of the growth trends for the main subject areas in the period studied (2004-May 2021).
Sustainability 13 07182 g003
Figure 4. Cooperation based on co-authorship between authors (2004–May 2021).
Sustainability 13 07182 g004
Figure 5. Publications made by each country (2004–May 2021).
Sustainability 13 07182 g005
Figure 6. Evolution of the five main keywords (2004-May 2021).
Sustainability 13 07182 g006
Figure 7. Network map with the main keywords from 2004 to May 2021.
Sustainability 13 07182 g007
Table 1. Methodology carried out for this study.
StageProcessResult
Search definitionDefine concepts that refer to the field of study.
Design the search with the appropriate parameters to enter in Scopus.
[TITLE-ABS-KEY (Bioeconomy OR “Circular Economy”) AND TITLE-ABS-KEY (Sustainability)]
Sample processingFilter the sample to only articles.
Download the sample in RIS format and process in SciMAT to avoid duplication.
Sample of 1961 articles without duplications
Analysis of the resultsDownload the sample in CSV format to work in VOSviewer.
Load data into Excel to analyze variables.
Graphs and tables of the bibliometric study
Table 2. CE and BE research: major characteristics (2004–May 2021).
PeriodAAUCTCTC/AJ
2004–2006393213
2007–20091228519212
2010–201213451182611
2013–20155216323289644
2016–201845315506441639187
2019–2021 (*)142849478723,41216450
A = articles per period; AU = number of authors; C = number of countries, TC = total citations in articles; TC/A = total citations per article; J: number of journals per period; (*): until May 2021.
Table 3. The most active journals in CE and BE (2004–May 2021).
JournalATCTC/AHi (A)Hi (J)SJRCR(A)
2004–20062007–20092010–20122013–20152016–20182019–2021 (*)
Sustainability Switzerland29127969.6124680.58(Q2)Switzerland0001(4)2(58)1(229)
Journal of Cleaner Production254706027.80401731.89(Q1)Netherlands1(1)6(1)6(1)3(2)1(73)2(176)
Resources Conservation and Recycling99230323.26251192.22(Q1)Netherlands0005(2)3(19)3(78)
Science of the Total Environment3753214.38152241.66(Q1)Netherlands00005(8)5(29)
Business Strategy and the Environment3334510.4510941.83(Q1)USA000027(3)4(30)
Journal of Environmental Management2729610.96101611.32(Q1)USA000018(4)6(23)
Waste Management2737814.00101451.63(Q1)UK00006(7)7(20)
Journal of Industrial Ecology2364127.8712951.81(Q1)USA08(1)8(1)019(4)9(17)
Sustainable Production and Consumption20834.154200.97(Q1)Netherlands00042(1)52(2)10(17)
Applied Sciences Switzerland18402.223350.42(Q1)Switzerland000008(18)
ACS Sustainable Chemistry and Engineering171015.946851.77(Q1)USA000010(4)11(13)
Ecological Economics17123572.65101891.72(Q1)Netherlands00008(6)13(11)
Procedia Environmental Science Engineering and Management15432.87450.16(Q3)Romania0004(2)4(9)55(4)
Renewable and Sustainable Energy Reviews1418213.0082583.63(Q1)Netherlands0000168(1)12(13)
Energies1314311.007780.64(Q2)Switzerland0002(2)38(2)19(9)
Environmental Science and Pollution Research12433.585980.79(Q2)Germany000042(2)16(10)
International Journal of Environmental Research and Public Health12806.675920.74(Q2)Switzerland0000121(1)14(11)
Resources12937.756240.72(Q2)Switzerland000033(3)20(9)
Technological Forecasting and Social Change1228924.0861031.82(Q1)USA0000177(1)15(11)
Forest Policy and Economics1120118.278641.13(Q1)Netherlands000030(3)21(8)
A = number of articles; TC = total citations for all articles; TC/A = number of citations by article; Hi (A) = h-index articles; Hi (J) = h-index journal; SJR = Scimago Journal Rank (Quartile); C = country; UK = United Kingdom; USA = United States; R = rank position by the number of articles published; (*) until May 2021.
Table 4. The most prolific authors among scientific production (2004–May 2021).
AuthorATCTC/AInstitutionC1st ALast AH-Index
Thrän, D.1420614.71Helmholtz Zentrum für UmweltforschungGermany201720209
Toppinen, A.1155450.36Helsingin YliopistoFinland201420219
Bezama, A.916518.33Helmholtz Zentrum für UmweltforschungGermany201720207
Molina-Moreno, V.921824.22Universidad de GranadaSpain201720217
Ulgiati, S.91523169.22Beijing Normal UniversityChina201420216
Bocken, N.825632.00The International Institute for Industrial Environmental EconomicsSweden201820215
Dewulf, J.828035.00Universiteit GentBelgium201720205
Kopnina, H.814117.63The Hague University of Applied SciencesNetherlands201420207
Azapagic, A.713819.71The University of ManchesterUK201920207
Iacovidou, E.725937.00Brunel University LondonUK201720215
A = number of articles; TC = number of citations for all; TC/A = number of citations by article; C = Country; UK = United Kingdom.
Table 5. Characteristics of the most productive institutions.
InstitutionCATCTC/AH-IndexIC (%)TCICTCNIC2004–20182019–2021 (*)
ICNICICNIC
Delft University of TechnologyNetherlands47198542.231655.3%63.6515.711351316
Aalto UniversityFinland2527410.96948.0%13.758.384687
Danmarks Tekniske UniversitetDenmark2431313.04850.0%11.7514.3323109
Alma Mater Studiorum Università di BolognaItaly23157768.57830.4%212.145.7544312
Helsingin YliopistoFinland2277935.411050.0%55.1815.645368
Wageningen University & ResearchNetherlands2257025.911063.6%37.006.505197
Parthenope University of NaplesItaly22161673.45963.6%110.798.137177
Lunds UniversitetSweden2170233.431276.2%27.4452.607392
Utrecht UniversityNetherlands2058629.30845.0%32.0027.091289
Helmholtz Zentrum für UmweltforschungGermany2070435.201320.0%98.5019.3825211
C = country, A = number of articles; TC = total number of citations for all articles; TC/A = number of citations per article; IC = percentage of articles made with international collaboration; TCIC = number of citations in articles with international collaboration; TCNIC = number of citations in articles without international collaboration; IC = articles with international collaboration; NIC = articles without international collaboration; (*): until May 2021.
Table 6. The most outstanding countries in number of articles (2004-May 2021).
CountryATCTC/AH-IndexR(A)
2004–20062007–20092010–20122013–20152016–20182019–2021 (*)
Italy331505715.283005(1)6(1)3(7)1(74)1(248)
UK232629527.133703(3)10(1)2(9)2(72)3(147)
Spain22320869.35230006(4)3(49)2(170)
Germany177242413.69250008(3)5(43)4(131)
USA168249614.862801(4)3(2)4(7)6(43)5(112)
Netherlands151391725.9428008(1)5(4)4(45)6(101)
China134338025.22262(1)2(3)1(4)1(10)9(25)7(91)
Finland114296526.012600014(1)7(38)11(75)
Sweden112398535.5824009(1)9(3)8(30)10(78)
France100137513.752300015(1)10(21)9(78)
A = number of articles; TC = total citations for all articles; TC/A = number of citations by article; R = rank position by the number of articles published; (*): until May 2021.
Table 7. International collaboration from the most prolific countries (2004–May 2021).
CountryNCMain CollaboratorsIC (%)TC/A
ICNIC
Italy46Spain. Germany. France. Sweden. Netherlands.42.0%23.099.63
UK61Spain. USA. Netherlands. China. France.57.3%24.6130.53
Spain49Italy. UK. Germany. Portugal. Belgium.46.6%10.608.27
Germany51Italy. Netherlands. Austria. Finland. France.46.9%15.8611.79
USA42China. France. UK. Italy. Finland.58.9%17.2711.39
Netherlands38Germany. Belgium. Italy. UK. France.59.6%33.2115.21
China43USA. Italy. UK. Malaysia. Australia.64.9%32.2212.28
Finland30Sweden. Germany. USA. Austria. France.50.9%37.2614.36
Sweden36Finland. Italy. UK. Netherlands. France.64.3%42.4223.28
France57Italy. USA. Netherlands. Germany. UK.76.0%16.215.96
NC = number of collaborators; IC = percentage of articles with international collaboration; TC/A = total citations per article; IC = with international collaboration; NIC = without international collaboration.
Table 8. Main keywords from 2004 to May 2021.
Keyword2004–20212004–20062007–20092010–20122013–20152016–20182019–2021 (*)
A%R (A)%R (A)%R (A)%R (A)%R (A)%R (A)%
Sustainable Development82042%1 (3)100%1 (4)33%1 (6)46%1 (25)48%1 (197)43%1 (585)41%
Recycling29415%00%4 (3)25%101 (1)8%2 (8)15%2 (66)15%2 (216)15%
Waste Management24713%2 (2)67%00%00%31 (3)6%4 (54)12%3 (188)13%
Life Cycle Assessment (LCA)21311%00%00%00%371 (1)2%3 (65)14%5 (147)10%
Life Cycle21211%00%00%00%64 (2)4%5 (52)11%4 (158)11%
Environmental Impact1789%00%00%56 (1)8%26 (3)6%7 (43)9%6 (131)9%
Environmental Sustainability1658%00%00%00%27 (3)6%8 (38)8%7 (124)9%
Environmental Economics1538%00%00%00%9 (5)10%9 (32)7%8 (116)8%
Economics1528%00%56 (1)8%45 (1)8%5 (6)12%6 (48)11%9 (96)7%
Decision Making1206%00%46 (1)8%29 (1)8%44 (2)4%17 (25)6%10 (91)6%
Life Cycle Analysis1206%00%99 (1)8%00%65 (2)4%10 (32)7%11 (85)6%
Climate Change1146%00%35 (1)8%19 (1)8%8 (5)10%18 (24)5%12 (83)6%
Biomass1045%00%26 (1)8%15 (1)8%7 (5)10%16 (25)5%14 (72)5%
Economic Aspect1015%00%00%00%47 (2)4%22 (19)4%13 (80)6%
Supply Chains985%00%00%00%78 (2)4%13 (27)6%16 (69)5%
Innovation975%00%00%00%10 (5)10%11 (29)6%17 (63)4%
Economic and Social Effects905%00%00%00%46 (2)4%15 (26)6%18 (62)4%
Industrial Economics884%00%00%00%14 (4)8%12 (27)6%20 (57)4%
Supply Chain Management824%00%00%113 (1)8%00%21 (20)4%19 (61)4%
Environmental Management804%00%00%57 (1)8%56 (2)4%19 (23)5%22 (54)4%
A = number of articles; R: rank; (*): until May 2021.
Publisher’s Note: MDPI stays neutral with regard to jurisdictional claims in published maps and institutional affiliations.

