
Data-Driven Methodology for Sustainable Urban Mobility Assessment and Improvement


1
Faculty of Transport and Traffic Sciences, University of Zagreb, Vukelićeva 4, 10000 Zagreb, Croatia
2
Ericsson Nikola Tesla, Krapinska 45, 10000 Zagreb, Croatia
*
Author to whom correspondence should be addressed.
Sustainability 2021, 13(13), 7162; https://doi.org/10.3390/su13137162
Submission received: 5 May 2021
/
Revised: 6 June 2021
/
Accepted: 23 June 2021
/
Published: 25 June 2021
(This article belongs to the Special Issue Intelligent Mobility: Technologies, Applications and Services)
Abstract
:The transport system is sensitive to external influences generated by various economic, social and environmental changes. The society and the environment are changing extremely fast, resulting in the need for rapid adjustment of the transport system. Traffic system management, especially in urban areas, is a dynamic process, which is why transport planners are in need of a proven and validated methodology for fast and efficient transport data collection, fusion and analytics that will be used in sustainable urban mobility policy creation. The paper presents a development of a methodology in data rich reality that combines traditional and novel data science approach for transport system analysis and planning. The result is overall process consisting of 150 steps from first desktop research to final solution development. It enables urban mobility stakeholders to identify transport problems, analyze the urban mobility situation and to propose dedicated measures for sustainable urban mobility strengthening. The methodology is based on a big data research and analysis on anonymized big data sets originating from mobile telecommunication network, where the extraction of mobility data from the big dataset is the most innovative part of the proposed process. The extracted mobility data were validated through a “conventional” field research. The methodology was, for additional testing, applied in a pilot study, performed in the City of Rijeka in Croatia. It resulted in a set of alternative measures for modal shift from passenger cars to sustainable mobility modes, that were validated by the local public and urban mobility stakeholders.
1. Introduction
Urban transport has been facing a paradigm shift for several decades that fosters the transition from Traditional Transport Planning (TTP) towards Sustainable Urban Mobility Planning (SUMP). Compared to TTP, SUMP focuses on people (TTP focuses on traffic), and primary objectives are accessibility, quality of life, sustainability, health and environmental quality (whereas TTP’s primary objectives are traffic flow capacity and speed), and an overall SUMP goal is balanced development of all the relevant transport modes and a shift towards cleaner and more sustainable transport modes [1].
In order to support the shift towards SUMP, the understanding of urban mobility in general is crucial, and to understand it, it has to be measured and assessed [2]. The base for urban mobility assessment is input data. Traditional transport research relies on archaic data acquisition methods (surveys, census or other conventional data) that have become inefficient compared to the emerging data sources that have the ability to improve transport research input data quality and accuracy and that have the potential to complement the conventional data [3]. Additionally, the availability of input data depends on the existence of data sources, which limits the objective and comparable assessment of the mobility of cities where such data do not exist.
An emerging novel, non-traditional data source, which exists in the majority of urban environments is mobile communication network big data (in 2020 more than 93% of world population lived in areas covered by mobile communication services) [4]. This kind of data is perceived as a potential source of knowledge that is relevant not just for its size, but also for the unprecedented operational opportunities it provides. Big data related to urban mobility phenomena are spatially and temporally extensive and detailed, contributing to an enhanced understanding of urban phenomena [5].
This research proposes a development of the methodology in data rich reality that combines traditional and novel data science approach for transport system analysis and planning. The methodology provides the process consisting of 150 steps from the first desktop research to the final sustainable mobility solution development. It enables digital transformation of the existing analytic methodologies by novel utilization of mobile network infrastructure as urban mobility data sources (anonymized spatio-temporal data on population migrations gathered from anonymized mobile network logs) and data science capabilities.
The methodology enables transport planners to use novel data sources, tools, and methods in order to effectively collect and process the real-world data for planning sustainable urban mobility.
The research initiates collaborative action among multi-sectoral stakeholders and will propose measures that will improve the cities’ urban mobility. The proposed methodology will be reusable and applicable in other cities as well. The proposed method will give the relevant stakeholders the ability to understand the mobility patterns at a spatial and temporal resolution that was previously not possible.
The methodology will be then tested and implemented in a pilot city (City of Rijeka in Croatia), and the results will be presented. The City of Rijeka, as majority of other cities in the world, are trying to encourage citizens to use sustainable mobility modes as a replacement for currently most prevalent mode—passenger car. In this research, costly, time-consuming and possibly inaccurate conventional measurement with the aim of identifying the origin–destination zone pairs, where the usage of passenger cars is above average, are substituted with data science methodology using anonymized telecom big dataset analysis. Those have been proven to be accurate, cost-effective, easy to process and rich with valuable information. The identification of origin–destination pairs where the usage of passenger car is above average (from big datasets) indirectly implies that on those origin–destination zone pairs certain shortcomings (infrastructure, organizational, etc.) are most probably limiting people in using sustainable transport modes and that additional transport (urban policy) measures should be considered and implemented in order to enable a shift towards sustainable transport modes. Therefore, the urban mobility stakeholders and decision makers can have an insight in transport demand based on objective, accurate and easily repeatable, automated methodology based on a large population sample.
The application of methodology in the pilot City will include elements of the entire process, including anonymized big data collection and processing, conventional desktop and field research in order to validate big data analysis findings, identification of urban mobility issues, identification of possible solutions, validation of solutions by general public and local urban mobility stakeholders and, finally, the most appropriate selection of the sustainable mobility solution.
2. Overview of Previous Research
Digital technologies have transformed the economy and society, affecting all sectors, activities and the daily lives, and the data are at the center of this transformation [6]. Urban mobility stakeholders traditionally plan, manage and evaluate their services relying on costly and unreliable manual data collection systems. However, the development of ICT has changed the amount, type, and quality of available data. Data are getting generated at an extraordinary scale, leading to their growing amounts. This massive generation of data provides new opportunities for discovering new values. It raises the challenges in terms of management and analysis and has given rise to a new concept, referred to as Big Data [7]. Big Data has been and can be defined in numerous ways (e.g., “any data that cannot fit into an Excel spreadsheet” [8]), but the authors have chosen the following as most appropriate: “Big Data is the Information asset characterized by such a High Volume, Velocity and Variety to require specific Technology and Analytical Methods for its transformation into Value” [9].
Depending on their originating source, Big Data can be divided into six categories which are: (a) data stemming from the transactions of government, for example, tax and social security systems; (b) data describing official registration or licensing requirements; (c) commercial transactions made by individuals and organizations; (d) internet data, deriving from search and social networking activities; (e) tracking data, monitoring the movement of individuals or physical objects subject to movement by humans; and (f) image data, particularly aerial and satellite images but including land-based video images [10].
Of particular interest for the authors of this paper is category E (tracking data), which includes mobile network data, since the application of those data is subject of this research. Mobile network data originate from the mobile network. Mobile network is a type of telecommunication networks with a collection of terminals, entities and nodes connected to each other through links that enable telecommunication between the users of the terminals [11]. Mobile networks have become both generators and carriers of big data, since an enormous amount of data is generated as a result of both user- and network-related activities [12]. This type of data usually originates from two potential data sources within the mobile network. The first set of data consist of database containing logs of telecommunication activities initiated by the users and is referred to as CDR (Call Data Record) data. The second set is generated as a result of constant communication between network elements (including terminals) and is referred to as signaling data. CDR represents the data generated by events and represents the records that are created when some telecommunication activities are performed by subscribers in the network. Events include activities such as voice calls, SMS or MMS services, data traffic usage, roaming information, etc. Signaling data include events that are generated by mobile devices or by the network itself. Such dataset contains data logs on several types of events like (a) communication events (i.e., calls, SMS, data transfer), (b) itinerancy events like handover (i.e., cell changes during a communication) and Location Area (LA) update and (c) attachment/detachment events. Those events can be considered as network-driven data comparing to event-driven data (e.g., CDR). Unlike Call Detail Record (CDR) data that rely only on the phone usage, signaling data include all the network-based records providing higher spatio-temporal granularity. Therefore, network-driven data logs are preferred for this research. Usually, excerpt from those datasets might include the following information: anonymized user ID, the timestamp, type of event, duration of event, information about cellular network antenna or the location of the network antenna.
Both mentioned data sources contain the location information that can be used, together with the timestamp of event, for analytical applications in urban mobility domain. The location data available in raw form are very sparse and have to be preprocessed through prior usage in urban mobility-related analytics.
The location information obtained from the mobile network is not as precise as the GNSS location data, but those location uncertainties can be, to some extent, mitigated by a large amount of data. The mobile network data are low-cost alternative to traditional GPS data since the network data can provide anonymous information for millions of users [13]. The mobile network positioning accuracy might vary from 50 to 500 m with median value of 250 m in densely populated urban areas [14], and that is considered acceptable for urban mobility use cases. For different positioning methodology used in mobile networks consult the literature [15].
There are several cases of application of mobile network data in transportation systems that were subject of various studies that take advantage of the fact that besides the fact that these data are not captured for transport applications they have significant relevance to their understanding.
The majority of studies have been performed in order to determine the Origin–Destination Matrix (ODM) from those types of data [3,16,17,18,19,20,21,22]. The Origin–Destination (O-D) matrix is a known indicator of individual and group mobility in the transport science, as well as an invaluable input for socio-economic assessment of the community and a tool for strategic planning and policy developments [23]. ODM reflects the mobility in an area of study during a particular period of time. Each cell in the matrix indicates the number of trips that depart from each origin zone to each destination zone. The authors showed that it is feasible to estimate ODM from mobile network data, and that the resulting matrices are similar to the ones produced via the travel survey-based method, which provides accurate information about the interviewees’ trips, but are costlier and time-intensive. The authors used both CDR and signaling data. The general conclusion is that mobile data can be used to draw a complete and representative picture of mobility flows over a region, especially when the zoning system is rolled up to a lower granularity. The advantages include potential reduction in error due to larger sampling, the ability to estimate dynamic OD matrices, day-specific OD estimates and the ability to re-estimate the OD on a periodic basis as the demand patterns in a city change over time. The authors have also identified the shortcomings in terms of both spatial and temporal scale, since the results might by affected by the size of the sampled data, validity of traffic probes, and privacy issues. When compared to surveys, as a main tool used for ODM creation using traditional methodology, the authors have concluded that mobile phone data can be used to augment or complement the traditional survey data, which provides detailed information about a respondent and the trip but is more costly and onerous to collect.
Beside origin–destination matrices, multiple studies are dealing with the application of telecom big data in public transport planning [24,25,26,27], urban mobility planning [28,29], transport mode detection [27,30,31,32], urban mobility estimation [33], traffic flow analysis [34,35,36,37] and the reconstruction of human mobility in general [38,39,40,41,42].
On the other hand, very few papers are dealing with the potential of the integration of big data into sustainable mobility planning support systems, and they are on a conceptual level investigating how big data can innovate urban mobility policy [5]. The general conclusion is that, while heuristic relevance of big data is increasingly investigated, the contribution of this new knowledge source to the policy processes still requires deeper analysis. Besides, the implementation of data-driven planning support system can have multiple implications in favor of improved quality of life and smart and sustainable growth of the future urban agglomerations [43].
Therefore, the conclusion resulting from the literature review is that there is a significant potential of mobile network data in the transportation domain, especially when compared to traditional data acquisition methods. Several usage cases have already been studied for decades, well elaborated and proven (especially ODM determination), but the application in urban mobility planning and mobility policy creation is still rather an unexploited domain with a significant space for improvements.
3. Research Methodology
No two cities in the world are the same and that is why urban mobility analysis requires a different approach and input data for the targeted area that might vary in time and space (big dataset, traditional traffic measurements, spatial decomposition, existing traffic polices, etc.). Therefore, the defined methodology should be used as a process and should be observed as a guideline for the implementation of the proposed methodology in any identified targeted area. The paper presents a development of a methodology (toolbox) in data rich reality that combines traditional and novel data science approach for transport system analysis and planning. The primary goal of the research is to provide a universal methodology suitable for any city to create a sustainable transport system.
The methodology is based on the utilization of anonymized big datasets originating from mobile communication network as primary data source. The secondary datasets are obtained through classical desktop and field research, which are used for validation. Therefore, the analysis of mobility is to be performed in parallel studies (desktop, in-field and big data). Each of the research streams are defined as a separate process that have to be conducted independently and then compared. When observed as a process, the proposed methodology includes roughly 150 steps in five logical sections: project preparation, project planning, analysis (desktop, field research, big data analysis), solution preparation and measures creation.
The methodology proposes a process which provides urban mobility stakeholders with a toolbox that will enable them to identify transport problems and analyze the urban mobility situation (using telecom big datasets as primary data sources) and to propose measures for its improvement.
The methodology involves the relevant modules (for example, big data analysis modules with the appropriate algorithms, the detection of mobility patterns, visualization, reporting, etc.) that can be used and reused to determine the key findings and propose appropriate measures in the urban mobility domain. Besides the definition and description of activities that must be performed within the SumBoost Toolbox, the process includes the definition of the required input data, the definition of the expected result data, the definition of the deliverables and the information on the expected validation steps. SumBoost Toolbox combines both traditional and novel methodologies for the analysis of spatial characteristics of population migration.
3.1. Project Preparation and Planning
In the preparation phase it is necessary to indicate the project values, strengths and benefits for the stakeholders. This phase should include stakeholders’ identification and engagement, identification and onboarding of institutional stakeholders, domain expertise partners and technology partner. The optimal execution team consists of three partners: institutional, domain expertise (academia), technology (mobile data gathering—mobile Operator and analytics) with participations of end-beneficiaries—citizens/commuters. Each partner has its own role in the project execution but in some project phases they work together (i.e., in data fusions, results comparisons, verification, validation, etc.). The second phase includes project planning. It includes high-level project goal/scope identification, definition of the geographic scope and project timeline, definition of the work plan, project budget and project resources.
3.2. Analysis—Desktop Research and Field Research
Desktop research includes review of the existing research for the information relevant to the project needs. The purpose of desktop research is to identify specific or useful qualitative or quantitative data relevant to the project needs, to develop an understanding of the current policy and business needs, to identify gaps in the existing data requiring further research, and to understand how a project may contribute in return to a larger body of knowledge. The research results are inputs for a field research and a proposal of solutions.
The purpose of the field research is to validate the results of big dataset analyses. Field research includes surveys, traffic flow distribution analysis and traffic counting:
- Traffic flow measurements—The analysis of traffic flow on the representative number of locations to gain valid and relevant input data;
- Surveys—Surveys are needed to gain info on mobility behavior within the households. The survey is to be conducted on a representative number of citizens. Additionally, the survey should be equally distributed within the coverage area in accordance with the number of inhabitants in each of the district of the coverage area;
- Traffic counting—The analysis of intensity and structure of traffic flow (automatic traffic counting) for the calibration and validation of the big data;
- Interview with stakeholders—The presentation of the work plan to the relevant stakeholders and collecting feedback;
- Data collection (traffic flow measurements)—Based on the project requirements, the results of the analysis in textual, graphical and tabular format should be available in a report;
- Data collection (survey)—Based on project requirements, the results of the analysis in textual, graphical and tabular format should be available in a report.
3.3. Analysis—Big Data Analysis
This part of methodology is dedicated to Big Data Analysis. This methodology uses anonymized Big datasets originating from mobile telecommunication network that comply with GDPR regulations. The results of the analysis will allow urban mobility stakeholders to make better and faster decisions using data that are up-to-date, data that cover large population over the entire observed area and all the neighboring areas. The high-level overview of the process of Big Data Analytics is presented in Figure 1.
The overall process consists of 10 key steps. The first step (Step 1—Identification of data source/provider) includes identification of the mobile network operator with significant market share and technical and operational capabilities to provide the required anonymized data for the defined geographical (spatial) and temporal scope.
The second step (Step 2), called Temporal and spatial zoning definition (broader coverage area) aims at identification of the project coverage zone. The observed area is segmented into areas (spatial fragmentation) in accordance with the traffic zoning and mobile network topology. The neighboring areas are large segments along the observed area border.
The third step (Step 3) includes data collection and anonymization. The mobile network operator collects records from mobile network nodes over a predefined time period. All the log files from the network are recorded in an encrypted format. During data collection, sensitive data that could be used to identify individuals (IMSI, IMEI) are automatically encrypted and further anonymized. Each encrypted record is replaced with a randomly generated sequence after which all the originally encrypted records are permanently deleted. Further analysis is performed on data containing exclusively randomly generated IMSI and IMEI sequences. The extraction of the necessary dataset, pseudonymization and substitution of encrypted IMSI and IMEI random sequences are performed sequentially. In the process no one from the Operator or data processor has the possibility to view the data. After analyzing and processing the full range of data, at delivery, all random sequences that were used to identify movement were deleted and the records are grouped and separated. The final delivery of such aggregated results was delivered in tabular (trip matrix, statistics) and graphical statistical views. In this way, it has been made impossible to identify directly or indirectly any person based on the outputs, which are then considered completely anonymous. All personal information that is used within this project has been handled in accordance with the General Data Protection Regulation (EU) 2016/679 (GDPR), which regulates data protection and privacy in the European Union (EU) and the European Economic Area (EEA).
Following the successful collection and anonymization process, the data are ready for processing as described in Step 4 (Anonymized data processing). In order to be useful for urban mobility-related research, the goal of this process is to prepare the data and determine the most accurate anonymized user location, that should be the base for all mobility-related analyses. Data preparation is a process of cleaning and transforming raw data prior to processing and analysis. It is a step that occurs prior to processing and involves reformatting data, making corrections to data and removing the outliers. This process consists of outlier detection and removal and data smoothing. Data (Position) smoothing improves spatial precision by readjusting each location point with regard to the previous and following positions within a well-chosen time window. It also reduces noise by smoothing oscillations. The underlying assumption is that whenever a device oscillates between several nearby antennas, this reveals that the real device position is probably between the oscillating cells.
The initial positioning data delivered from the mobile network operator are now refined (Step 5), following the data preparation and filtering process. This step includes data validation with data from the external source. This action should evaluate the mobile device positioning accuracy, by comparing and analyzing locations gathered from anonymized telecom big datasets, compared to control (reference) location data. The analysis should address different use cases (defined above), different network types (3G, LTE), different data aggregation parameters (hundreds of geolocation events may be recorded in one second with different user locations, so the average location has to be calculated), different location environments, and other. The distribution positioning error values should be characterized using Root Mean Square Error (RMSE). The result should point to the evaluation of mobile device positioning accuracy compared to reference (GNSS) dataset, under specific use cases and conditions. The public mobile network operator enables non-anonymized recording of telecommunication logs for a predefined set of test users (at least ten active terminals). If this option/action is not possible, then the recording of both mobile network characteristics (Cell ID, TA…) and GNSS data should be performed on mobile terminals only. The terminals should be carried by volunteers in all transport modes in order to obtain as much data as possible.
The following step (Step 6) includes identification of user “stay locations”. A location can be identified as a stay location if the predefined set of spatial and temporal criteria are fulfilled that will indicate that the user has spent a predefined amount of time in the predefined geographical area, that should lead to the conclusion that the user was stationary. Based on the predefined rules and criteria “stay locations” can be labelled as “home location”, “work location”, and “other location”. Those stay locations are then clustered using agglomerative clustering which is a hierarchical approach where locations are merged depending on the distance threshold. In order to identify the purpose of the stay at that location (e.g., shopping, leisure, dining, visiting hospital, etc.) additional input dataset should be introduced, like Point Of Interest data (POI). POI includes information on mapped locations which might be significant for the mobility analysis. Point of Interest dataset is introduced to help identify the transport mode, purpose of the trips and to identify the type of “other location”.
In order to better understand the mobility patterns, the trip purpose, especially for trips that are not linked to travelling home and to work, should be determined. There are at least six main categories (but not limited to) of the trip purpose like traveling to or from: work, school, shopping and personal care, leisure, business, transport of goods, etc. Therefore, other locations than “home” and “other” should be labelled as “others”, and that concludes this step.
The results of this process can be validated using ground truth data. After determining the home locations, they are used for validating the big data analysis by comparing the given results with census data. The precondition for this type of validation is the usage of identical spatial decomposition sectors.
The next step (Step 7) is related to trip extraction. A trip involves movement of a user between two stay locations with a specific purpose, where prerequisites regarding the trip distance, duration and speed are met. Those prerequisites are called trip-related parameters/criteria that will be defined in the following steps. The temporal threshold defines the time values that will be used for trip determination. The minimum and maximum trip duration will be defined in order to discard potential trips that last too long or too short and are therefore, not likely to occur. The spatial threshold defines spatial values that should be used for trip determination. The minimum and maximum trip lengths should be defined in order to discard the potential trips for which the distance is too short or too long or cannot be determined, and are therefore, not likely to occur. The speed threshold defines speed values that should be used for trip determination. The minimum and maximum trip speed should be defined in order to discard the potential trips where average speed value is too low or too high, and therefore not likely to occur. All trips that do not fulfil the expected criteria are discarded. All the remaining trips are being considered as “real” trips that really occurred, and therefore should be used in further steps for mobility analysis.
The trips are defined with the following attributes: start location, start timing, end location, end timing, trip duration, purpose distance and mode. Regarding trip distance, each trip should be defined by two distances. The first one is the Euclidian distance, and the second one is the road distance. Road network data are the input data required for the identification of the road distance of a trip. Road network data are used by the routing algorithm (internal tool or external service) in order to calculate the possible routes among two locations based on the defined criteria. The data on the trip start location and the trip end location are assigned to the nearest point of road network. Based on the defined criteria, the routing algorithm services should calculate the possible route of the trip using the shortest possible trajectories. This value should be used as an approximation of the road distance travelled within the trip. The second distance is the Euclidean distance, as a measure of the true straight-line distance between two points representing the beginning and the end of a trip. This distance can be used as an option for trip distance approximation in case the calculation of the road distance is not possible.
The trip mode is identified using the trip speed, and spatial and temporal patterns. The trip modes can be identified by spatial and temporal patterns of the trip, including PoI. Important PoIs for trip mode determination include the identification and availability of the relevant infrastructure (public transport terminals, public transport stations, availability of cycling infrastructure, etc.). The spatial and temporal patterns may include information about the number of stops during the trip, availability of certain transport modes during the different parts of the day, and similar.
The next step (Step 8) is used to determine the spatial decomposition. The project coverage area is divided into research zones as defined in the previous steps (base zones). Those zones are defined by administrative areas or census areas and they are identified as base zones for the urban mobility analysis. The beginning and the end of each trip have to be mapped to those zones. Using spatial analysis tools and processes, the telecommunication sectors (base station antenna coverage area) have been mapped to the research zone, and those research zones should be used for trip representation and statistics calculation in the final delivery. All trips are calculated based on the telecommunication zones. Following the trip extraction and spatial decomposition, Step 9 is used to generate a list of all identified and extracted trips. The list of all trips can be used for various types of analysis and visualization (Step 10). The analysis can include determination of origin–destination matrices for all types of transport modes, identification of origin–destination matrices for specific transport modes, calculation of the trip related statistics (e.g., average speed among pairs of zones for predefined time period, etc.). Since all trip-related data contain a geographical identifier, data can be visualized on a map for reporting and better presentation.
3.4. Analysis of Findings
After the completion of desktop research, field research and Big Data analysis, the following steps are dedicated to the identification and analysis of mobility-related problems in the coverage zone. The first step is the identification of origin and destination zones of migrations. The Big Data analytics is used to identify the origin–destination matrix for the coverage area. The results obtained from the Big Data analysis should be validated using data from the field research. Based on the project scope and requirements, the matrices can be created for an arbitrary time period. After identification of all migrations, the following step was to identify the zones (origin/destination pairs) with the significant number of commuter trips (transport demand) and origin–destination pairs will be sorted based on those values.
After this part of the process, a dedicated analysis has to be performed, and it will differ based on the project goal. In this particular project, the next step includes identification of origin–destination pairs with a significant number of passenger car trips where the big data analytics will be used to identify the transport mode for the identified trips. The result will be an origin-matrix similar to the one prepared in the previous steps. The key difference will be that this matrix consists only of the trips that were performed by a passenger car. Following the creation of the matrices of origin, the destinations of the passenger car trips, this step will be used to identify the zones (origin/destination pairs) with a significant number of car trips. Those car trips will be proposed for the shift to sustainable modes in the next steps. The origin–destination pairs will be sorted based on the number of migrations between them, which will lead to the identification of targeted origin–destination zones and time frames for detailed analysis.
3.5. Solution Preparation and Project Finalization
The following part of the process includes the development of urban mobility solutions and scenarios for the improvement of sustainable mobility among pairs of targeted zones. Besides defining solutions and measures, it should include the evaluation of measures by both citizens and stakeholders focus groups in order to prioritize and rank the proposed measures and actions. The proposed measures will be discussed with citizens and stakeholders. The involvement and participation of citizens and stakeholders in the sustainable urban mobility planning process is necessary in order to obtain public legitimacy and to create a plan that satisfies the people’s mobility needs. Each proposed solution will be evaluated by the public and key stakeholders and feedback will be received from the stakeholder focus groups and citizens’ survey. Following the citizens and focus groups feedback on the proposed measures, the selection of measures from the original pool that have received their support will be identified and further processed for prioritization.
The final result of the methodology application is a selection of focused urban mobility measures created by using the new process, by applying digital transformation of the existing (traditional, ingrained) analytic methodologies and by novel utilization of telecom big data and data science capabilities for urban mobility planning.
4. Methodology Application
The methodology was implemented in the City of Rijeka with all the steps defined in the previous Section. The City of Rijeka is the principal seaport and the third-largest city in Croatia (after Zagreb and Split) with a population of 128,624 inhabitants. Primarily used transport modes are passenger cars, public transport and walking. The public transport system is organized by buses, and due to the land configuration cycling has not been developed. From three sides, Rijeka is surrounded by mountains which limits the possibility of spreading and causes high population density of 2727 inhabitants/km2 (twice as large compared with the capital of Zagreb with the population density of 1265) [44].
The City of Rijeka was selected due to the fact that based on the existing studies about the population in the city of Rijeka and the number of registered vehicles in the area shows that the degree of motorization is 1.29, i.e., that every inhabitant of the city of Rijeka owns more than one motor vehicle, that measures are needed to improve the overall image of the current negative condition of vehicle emission concentrations in the city of Rijeka [45]. Additionally, due to the accelerated development of new technologies in connection with all forms of traffic and movement, projects in the field of smart mobility are particularly emphasized and supported by the City government, where the City of Rijeka represents the leading Croatian city in terms of the volume and quality of available datasets. The commuter patterns were obtained from two separate datasets, big dataset and field research dataset. Desktop research was also conducted as the basis for the field research, where local characteristics and the existing documentation were analyzed [45,46,47].
4.1. Big Data Analysis
Big Data research was performed on anonymized big datasets originating from mobile telecommunication network operator with significant market share of 35%. A total of 2653 TB of compressed data was gathered by using this method. The data were anonymized and checked for GDPR compliance, and then transferred for processing. After performing the first step of big data analytics, the set of 890,101 trips (non-pondered value based on 35% sample) were extracted for broader coverage area and one-week time period. Further analysis was performed on 286,290 (non-pondered value) trips identified for the narrower coverage zone. The process included developing of methodology for the identification of trips and its characteristics including trip distance, speed, duration, origin, destination, and transport mode for every trip. This analysis resulted in 62,240 (non-pondered value) representative daily trips for a characteristic working day.
Test device GPS data were obtained for the validation of mobile network positioning. One dozen mobile terminals were used in the coverage zone during the telecommunication logs recording. They were carried by volunteers in order to obtain as much data as possible. The 3rd party GPS logger with logging frequency of <5 s was used. The analysis was performed on 44,000 data pairs, and 14,000 data pairs were analyzed within a narrower coverage zone. A data pair consists of the information on location obtained from the mobile phone GPS unit and refined mobile network position data for the same terminal and for the same time stamp. The statistical analysis showed that the average position error for a refined user position compared to GPS data is 419 m. The minimum average positioning error is 6 m, maximum average positioning error is 4808 m, median value is 322, RMSE error is 576.95 and MAE error is 605.15 error. The positioning error can be observed as either total positioning error, but it can also be observed in terms of displacement based on the axes of the coordinate system as longitude (x) and latitude (y) error. The result of the comparison of mobile network positioning location and test device GPS positioning are presented in Table 1.
A histogram presenting the total distance value error (left) and scatter of longitude and latitude error is presented in Figure 2. The analysis confirmed the fact that the refined user location data information can be used for large-scale mobility-related analysis, since this positioning uncertainty is acceptable for such analysis. The example of GPS location points (red marks) and the corresponding network-based refined user data (green marks) for the test user is shown in Figure 3.
The next part of the process includes the determination of the stay location, with the aim of identifying primarily users’ “home” and “work” locations. Home and work locations are determined depending on the stay locations that lasted longer than 15 min. The locations that are not being identified as home or work locations are labelled as “others”. Excerpt of identified stay locations is presented in Figure 4. This location can then be used for trip purpose identification, to identify trips home–work, home–other, work–other and vice versa. The home location information has also been used for the validation purposes since the share of population of a particular zone in relation with the data from the census have been compared. The relationship between the shares of the population of a zone in relation to the narrower coverage area: census data vs. identified “home locations” is presented in Figure 5.
The result of the comparison of identified “home location” obtained from Big Data analysis and data from census, compared per sector, confirms that the “home” location methodology is valid since the results vary from 0.09% to 3.47%, with an average value of 1.20%, as presented in Figure 6. The following steps include trip extraction. Each trip is identified with the trip start location, trip start timestamp, trip end location, trip end timestamp, trip duration, trip Euclidian speed, trip road speed, trip Euclidian distance, trip road distance, trip purpose, etc. These identified parameters, trip duration, trip speed (road speed) and trip distance (road distance), together with additional criteria will be used for the trip mode detection.
A methodology is developed that can identify most common transport modes and assign them to a trip. For targeted travel modes (walking, car, public transport, etc.), trip speed, trip duration and trip distance are considered. For each trip mode the expected values (thresholds) are defined, and all trips are analyzed using the developed scoring system. Scoring system scores each trip based on those three values, and gives them either appropriate value (0,1), or discards that mode as not appropriate (value −1). If based on any criteria, the travel mode has at least one (−1) value, it is automatically discarded as possible travel model (for example, trip with average speed of 50 km/h will be scored with value (−1) for speed for walking trip and cannot be identified as walking trip even if other criteria for walking trip are fulfilled). Besides speed, the duration and distance, the additional two criteria are introduced for public transport detection. The first one is based on the time of day (whether public service is available in that part of the day), and the second is based on the existence of public service in a specific sector (for example, if the specific sector does not have any public transport line crossing that sector).
Based on the trip data, origin–destination matrix has been created for that characteristic day. It contains absolute values of all trips (non-pondered values) for one day (24 h period). Further OD matrices were created for peak hour (07:00–08:00), as well as for the respective transport modes. All those matrices were then relativized to identify the zones with significant transport demand among others. The relativization was performed on the base of one zone, and on the base of the entire coverage zone. In the first case, the sum of all trips for one specific zone was used to relativize the value of trips from those zones to all other zones. In the second case, the sum of all trips for the entire coverage area (34 zones) was used to relativize each field in the matrix, in order to determine to what extent each origin–destination pair contributes to the number of travels in the entire zone. An example of origin–destination matrix for one day with absolute (non-pondered values), matrix for one day relativized on the base of one zone and a matrix for one day relativized on the base of the entire coverage zone is presented in Figure 7. Additional coloring has been introduced for visual presentation of relativized matrices, where the values are colored in range from red (smallest value) to green (highest value).
The list of all trips can be used for various types of analysis and visualization. The analysis can include the determination of origin–destination matrices for all types of transport modes, identification of origin–destination matrices for specific transport modes, calculation of trip-related statistics (e.g., average speed among pair of zones for predefined time period, etc.). Since all trip-related data contain a geographical identifier, the data can be visualized on a map for reporting and further analysis. Using the transport mode data from the trip information, similar OD matrices can be generated for particular transport mode of interest. In this project, the goal was to identify the zone pairs that have above-average usage of passenger cars compared to the entire coverage zone.
4.2. Field Research
The field research is conducted simultaneously to Big Data collection. Traffic counting on the representative number of locations, trip distribution analysis by recording the license plates and surveying the local population set the basis for validation of the mobility data extracted from the big dataset. The field research also resulted in commuter patterns which are to be compared with the patterns extracted from the big dataset. Validation of data collected by the analysis of a big dataset was conducted based on the results of traditional research. The subject of the validation is the origin–destination matrix, modal split and traffic intensity, all extracted from the big dataset with the application of data science. To verify the big data extracted matrix, traditional field research is also conducted with the same goal, to get the origin–destination matrix and compare it with the one from the big dataset.
Field research includes traditional methods of transport research used in the process of transport planning as well as in the development of transport models of urban areas. Accordingly, for the purposes of validation of matrix gathered from data science, the following field research was conducted:
- Survey on commuter patterns and modal split;
- Analysis of traffic flow distribution based on ALPR;
- Analysis of intensity and structure of traffic flow (traffic counting).
The aim of conducting the survey was to collect the data on commuter patterns of the users of the transport system in the City of Rijeka and their travel mode (modal split). Due to the challenges caused by COVID-19 pandemic, classical street screen line surveys could not be done. This survey was replaced by two types of alternative surveys (online survey and household survey). The survey was conducted on a stratified sample based on the local communities and their population share. According to the population size, the sample size was defined in a way to allow the estimation of the population with the error margin of 2.5%, with a confidence level of 95%. The response distribution is 50%. According to the set conditions, the research included 1585 respondents who voluntarily participated in the survey and shared their mobility habits. Prior and during the survey, participants were given appropriate project information, including legally required data protection information. Participants had the opportunity to ask questions, and participants’ consent was obtained. No personal data has been collected or processed. Data collection for the additional validation of the origin–destination matrix was carried out by traffic flow spatial distribution based on the Automatic License Plate Recognition method (ALPR). License plates were recorded on different locations in the city of Rijeka during morning peak hours (from 7 a.m. to 9 a.m.) and afternoon peak hours (from 3 p.m. to 5 p.m.). The license plates were recorded using four traffic cameras with ALPR. To determine the traffic volume and its daily distribution, automatic traffic counting was performed. The counting was performed on 12 locations for 24 h.
4.3. Comparison of Results from Big Data Analysis and Field Research
The modal split comparison resulted in a difference for passenger vehicles of 2.49%, public transport 2.56% and active modes of transport of about 0.70% (Table 2). Comparison of travel demand (survey and ALPR vs. Big data analysis) resulted in conclusion that the average deviation in trip distribution from the analyzed zones towards the city center was determined in the amount of about 7.5%. A comparative analysis of daily distribution during the characteristic day of the week also revealed the existence of a strong connection between the two sets of mobility patterns (R2 = 96%). The deviations of the results are satisfactory, and they prove that the extraction of the mobility data from the big dataset is conducted properly and successfully.
A comparative analysis of the results of the travel distribution showed a strong correlation between the results obtained from ALPR in relation to the results obtained by the analysis of big datasets. According to the results obtained from ALPR, a minimum of 40% of trips gravitates to the city center, while according to the data from big datasets, that amount is approximately 46%, which makes a difference of about 6%. When it comes to local community of Draga, the difference between the methodologies is only about 1%.
A comparative analysis of the daily distribution of transport demand (a characteristic day of the week) is presented in Figure 8 and comparative analysis of daily unevenness of transport demand (correlation analysis) is presented in Figure 9, which presents the correlation analysis of the results of Big data and field research in a particular zone (e.g., Big Data analysis—field research in Zametska zone, etc.).
The conclusion of the validation is that the deviations of the results are satisfactory, and they prove that the extraction of the mobility data from the big dataset is conducted properly and successfully.
After the proven feasibility of the methodology and the possibility of obtaining relevant mobility data from big datasets, the zones with high share of passenger car trips are determined with the goal of providing those areas with alternative travel options to reduce the unsustainable forms of transportation.
According to the previously presented assumptions, the average deviation in travel from the analyzed zones to the city center was determined in the amount of about 7.5%. The biggest differences are recorded in the local communities of Turnić and Podmurvice. The analysis of those local communities found that these are smaller zones on the edge of the city center that as such have higher share of trips to the neighboring zones, as well as higher share of shorter trips (for example walking), which do not have any impact on the traffic system but do have an impact on the overall result of the origin–destination travel matrix of the zones. The analysis of the results presented below shows that the travel distribution of big datasets follows the distribution trend obtained from the traditional field research. The analysis of several validation scenarios identified the possibility for further improvement of big datasets by creating better quality filters which will determine which trips are important for the traffic system, and which are not. Additionally, in a lot of cities, the zones are divided according to administrative borders that are not in line with the traffic function or telecommunication infrastructure, so it should be compensated by additional filters. The analysis of travel distribution from a big dataset has confirmed the above mentioned.
Considering the complexity of collecting and processing a big dataset as well as the differences from the previous traditional methods of collecting information about habits and modal split, several validation scenarios were performed, during which the optimal scenario was selected. The optimal scenario is based on several assumptions. There are numerous small zones in the city center that are merged into one zone that marks the city center, with the aim of reducing the probability of error (for example, the respondent did not know where the borders of the zone are, the mobile device connected to the base of a neighboring zone, etc.). For the validation purpose, the period from 7 a.m. to 9 a.m. was used from a big dataset (during that period, about 22% of trips for work and education reasons occur, which accounts for about 85% of such trips at the daily level). This is necessary due to the methodological differences in data collection, and the different sets of the collected data. The analysis of a big dataset detected all trips that the user made during the day, while the classical research detected the most common trips, according to the work activity of the respondent. Collecting travel diaries of the respondents by traditional household survey requires significantly greater financial and time resources, and in practice, it is not performed frequently. The reason for this comes from the fact that other trips have significantly smaller impact on the peak hours/congestion in the transport system. In the period from 7 a.m. to 9 a.m. almost all respondents made only one trip, which reduces the probability of error in comparative analysis with traditional field research. The validation objectivity and accuracy are greater when comparing the trips in zones that are spatially more distant.
4.4. Identification of Transport Problems and Proposal of Measures
Based on big data and traditional analysis, five zones with significant usage of passenger cars for daily commuting have been determined and those are Grbci, Draga, Zamet, Srdoči and Drenova (Figure 10). The average percentage of passenger car usage for daily commuting in the City of Rijeka is 72% while those five zones have a higher percentage. Due to the identified negative trend, solutions are proposed to increase sustainable transport mode share. Each of the defined zones is analyzed in detail to identify the reasons leading to high share of unsustainable transport. After the detection of the reasons for transport issues, the solutions are proposed for each zone and validated by the public and by the key stakeholder. The reason for the increased usage of passenger cars is mostly the unsuitability or the lack of public transport and the hilly terrain with a lack of appropriate footpaths or cycling lanes that restricts the use of bicycles or walking.
After additional analysis of Draga zone, the optimization of the existing public bus transport and the introduction of the new public transport system—railways are proposed. The solution is based on the fact that there is only one public transport in the zone. That line connects the city center with the business zone Kukuljanovo. Low frequency of bus departures encourages the residents to use passenger cars for the trips to the center. More frequent departures would create double positive effect for the residents of Draga, as well as for those working in the business zone Kukuljanovo. During the surveys of the residents of the city of Rijeka, it was found that many people complained about the poor public transport connection of the city center with the business zone Kukuljanovo.
Local inhabitants within the target zones were surveyed in order to gain the insight in their willingness to use sustainable modes of transport and to validate the acceptability of the defined solutions.
Seventy percent of the respondents are willing to change their mode of transport if the adequate sustainable solutions are given and 79–90% (varies depending on the proposed measure) consider the proposed solutions as needed for their community.
Grbci zone faces similar problems with the lack of adequate public transport lines. In the zone Grbci, there is currently only one line, which during peak hours has only 15 passengers (according to the conducted research for the Masterplan for the development of transport system of the North Adriatic functional region). The reason for this is that the existing line only touches the zone at its final eastern part. Due to the hilly terrain and narrow streets in the zone, it is impossible for the classic bus to operate and to adjust to the households and the needs of residents, which is why the proposed solutions are the introduction of a minibus line, carpooling and car sharing system.
Phone interview survey showed that 82% of the respondents are willing to change their mode of transport if adequate sustainable solutions are given, and 78% consider proposed solutions as needed for their community.
Srdoči zone is well connected with public bus transport, but the constant traffic jams cause often delays. The advantage of the part of the zone is the proximity of the railway, which is why the arrangement of a railway stop has been proposed.
Surveys showed that 37% of the respondents are willing to change their mode of transport if adequate sustainable solutions are provided, and 46–87% consider the proposed solutions as needed for their community. The lowest positive opinion is given for the community need for more frequent public transport lines and the highest opinion is given for the need to giving priority to public transport vehicles at signalized intersections. The results of the questionnaire confirm the results of the analysis that identified delays as the main issue.
Zamet zone is well covered with public bus transport lines but there are some improvements necessary in terms of the number of departures, accuracy and shortening of travel time. Pedestrian infrastructure in the PT stops area also needs some upgrading. The advantage of the zone is in the proximity of railway that can be used as the main backbone of public transport.
Validation of the measures showed that 43% of the respondents are willing to change their mode of transport if the adequate sustainable solutions are given, and 67–76% consider proposed solutions as needed for their community.
Drenova zone has solid public transport coverage but there are some slight upgrades that can lead to the reduction of the passenger car usage. Current lines can be supplemented with a minibus line as a feeder for the main line because some of the communities do not have available bus stops. A car-sharing system is also proposed for the Drenova zone.
A phone interview survey showed that 67% of the respondents are willing to change their mode of transport if the adequate sustainable solutions are given, and 92–95% consider the proposed solutions as needed for their community
The identified reasons for unsustainable commuting set the basis for the development of measures to promote sustainable modes of transport and provide the local population with an adequate alternative to passenger car commuting. All the measures are proposed taking into account the specifics of each individual zone with high passenger car commuting and in accordance with the European, national and local development plans that encourage sustainability. All the proposed solutions have been validated by the local public to gain data on potential users of the future sustainable mobility solutions (estimated potential) and to gain general data on the acceptability of the proposed solutions. The respondents have been questioned for their willingness to use sustainable modes of transport if new sustainable modes are introduced. An overview of all the proposed measures listed by the community is shown in Figure 11.
The acceptability of the proposed solutions varies a bit based on the different area and different needs of the commuters. However, generally, the solutions are well supported by the public which confirms proper identification of transport issues and adequate answer in the form of appropriate measures.
The measures could be further classified into sub-measures for the public bus transport, public railway transport, carpooling system introduction and walking infrastructure improvement. The acceptance for the groups is shown in Figure 12.
The respondents showed a positive attitude towards all types of sustainable transport solutions. The most positive response is given to the carpooling system, which is also the easiest to implement, which means it should be a priority followed by a public bus transport improvement and walking infrastructure improvement. The public railway transport is a long-term measure and should be adapted in the stage when public bus transport system has reached the optimal condition.
The acceptability of the proposed solutions varies a bit based on the different area and different needs of the commuters, but generally, the solutions are well supported by the public. Some of the passenger car commuters are not willing to change their mode regardless of an adequate alternative, but they still support the solutions because they are aware that they contribute to the community.
5. Conclusions
The research resulted in a new methodology (toolbox) based on big data and data science, validated by traditional methodology, that can be used as a tool for identification of city challenges and the creation of sustainable urban mobility measures. The proposed methodology was applied and validated in the targeted area of the City of Rijeka in the Republic of Croatia. Simultaneously to desktop and field research, big data research was performed. Big data research was conducted on anonymized big datasets originating from mobile telecommunication network operator with a significant market share. A total of 890,101 trips (non-pondered value) was extracted for a broader coverage area that included trip info and its characteristics including origin, destination, trip distance, speed, duration, and transport mode for every trip. The comparison of the results of traditional and novel big data method showed the existence of a strong connection between the results obtained by classical field research and the results obtained by the analysis of big datasets. As a result of the analysis, five zones with significant usage of passenger cars for daily commuting have been determined. The average percentage of passenger car usage for daily commuting in the City of Rijeka is 72%, while five zones have a higher percentage. The reason for this increased usage of passenger cars is mostly the unsuitability or the lack of public transport and the hilly terrain with a lack of appropriate footpaths or cycling lanes that restricts cycling or walking. Finally, a set of possible solutions were proposed for modal shift from passenger cars to sustainable mobility modes.
The results prove that using the presented Big Data science methods can be appropriate for transport planning and that those methods can support or in some cases replace the conventional studies. The advantages of analytics based on anonymized datasets collected from mobile telephony networks are that they provide more objective results (avoidance of subjective interpretations of interviewed persons, availability of a wider picture that differs for the data obtained from measurements on sections, etc.), they utilize spatial-temporal holistic approach (analytics based on recording of the whole observed area and neighboring areas along the complete borderline continuously from 0 to 24 throughout the agreed time period). Analytics is based on very high sample (ten and more times larger than the classical representative sample) and include spatial-temporal analytics of non-residents and population that is occasionally present in the observed area (visitors and persons in transit). The application on the targeted area proved that the methodology is efficiently structured, and all the sections are logically defined, and in theory, it would be possible to universally apply the toolbox in any city.
Author Contributions
Conceptualization, M.Š. and K.V.; Data curation, M.J.; Formal analysis, M.J. and O.L.; Investigation, M.Š., K.V. and O.L.; Methodology, M.Š., K.V., M.J. and O.L.; Project administration, O.L.; Software, K.V.; Supervision, M.Š.; Validation, M.J.; Writing—original draft, K.V. and O.L.; Writing—review and editing, M.Š. and M.J. All authors have read and agreed to the published version of the manuscript.
Funding
This research has been realized as part of the project “SumBOOST”, funded by EIT Urban Mobility and supported by the EIT, a body of the European Union.
Conflicts of Interest
The authors declare no conflict of interest.
References
- Wefering, F.; Rupprecht, S.; Bührmann, S.; Böhler-Baedeker, S. Rupprecht Consult—Forschung und Beratung GmbH. Guidelines-Developing and Implementing a Sustainable Urban Mobility Plan; European Commission: Brussels, Belgium, 2014. [Google Scholar]
- Vidović, K.; Šoštarić, M.; Budimir, D. An overview of indicators and indices used for urban mobility assessment. Promet Traffic Transp. 2019, 31, 703–714. [Google Scholar] [CrossRef]
- Çolak, S.; Alexander, L.P.; Alvim, B.G.; Mehndiretta, S.R.; Gonzalez, M.C. Analyzing Cell Phone Location Data for Urban Travel: Current Methods, Limitations and Opportunities. In Proceedings of the Transportation Research Board (TRB) 94th Annual Meeting, Washington, DC, USA, 11–15 January 2015; pp. 1–17. [Google Scholar]
- Bahia, K.; Delaporte, A. The State of Mobile Internet Connectivity 2020; GSMA Connected Society: London, UK, 2020. [Google Scholar]
- Pucci, P.; Vecchio, G.; Concilio, G. Big Data and Urban Mobility: A Policy Making Perspective. In Proceedings of the World Conference on Transport Research-WCTR 2019, Mumbai, India, 26–31 May 2019. [Google Scholar]
- European Commission. Communication ‘A European Strategy for Data’ (2020); COM/2020/66 final; European Commission: Brussels, Belgium, 2020. [Google Scholar]
- Borgi, T.; Zoghlami, N.; Abed, M. Big Data for Transport and Logistics: A Review. In Proceedings of the 2017 International Conference on Advanced Systems and Electric Technologies (IC_ASET), Hammamet, Tunisia, 14–17 January 2017; pp. 44–49. [Google Scholar] [CrossRef]
- Batty, M. Big data, smart cities and city planning. Dialog. Hum. Geogr. 2013, 3, 274–279. [Google Scholar] [CrossRef]
- De Mauro, A.; Greco, M.; Grimaldi, M. A formal definition of Big Data based on its essential features. Libr. Rev. 2016, 65, 122–135. [Google Scholar] [CrossRef]
- Organization for Economic Cooperation and Development (OECD). New Data for Understanding the Human Condition: International Perspectives; OECD: Paris, France, 2013; p. 46. [Google Scholar]
- Al-Shiridah, G.; Safar, M.; Mahdi, K. Mobile Communication Networks. In Encyclopedia of Social Network Analysis and Mining; Springer: New York, NY, USA, 2014; pp. 940–950. [Google Scholar]
- He, Y.; Yu, F.R.; Zhao, N.; Yin, H.; Yao, H.; Qiu, R.C. Big Data Analytics in Mobile Cellular Networks. IEEE Access 2016, 4, 1985–1996. [Google Scholar] [CrossRef]
- Rojas, M.B.; Sadeghvaziri, E.; Jin, X. Comprehensive review of travel behavior and mobility pattern studies that used mobile phone data. Transp. Res. Rec. 2016, 2563, 71–79. [Google Scholar] [CrossRef]
- Zandbergen, P.A. Accuracy of iPhone Locations: A Comparison of Assisted GPS, WiFi and Cellular Positioning. Trans. GIS 2009, 13, 5–25. [Google Scholar] [CrossRef]
- Campos, R.S. Evolution of Positioning Techniques in Cellular Networks, from 2G to 4G. Wirel. Commun. Mob. Comput. 2017, 2017, 1–17. [Google Scholar] [CrossRef] [Green Version]
- Kim, K.; Chung, Y. Correlation Analysis Between O / D Trips and Call Detail Record: A Case Study of Daegu Metropolitan Area. J. Korean Soc. Civ. Eng. 2019, 39, 605–612. [Google Scholar]
- Caceres, N.; Romero, L.M.; Benitez, F.G. Exploring strengths and weaknesses of mobility inference from mobile phone data vs. travel surveys. Transp. A Transp. Sci. 2020, 16, 574–601. [Google Scholar] [CrossRef]
- Iqbal, M.S.; Choudhury, C.F.; Wang, P.; González, M.C. Development of origin-destination matrices using mobile phone call data. Transp. Res. Part C Emerg. Technol. 2014, 40, 63–74. [Google Scholar] [CrossRef] [Green Version]
- Calabrese, F.; Di Lorenzo, G.; Liu, L.; Ratti, C. Estimating Origin-Destination Flows Using Mobile Phone Location Data. Cell 2011, 10, 36–44. [Google Scholar] [CrossRef]
- Caceres, N.; Wideberg, N.P.J.I.; Benitez, F. Deriving origin—Destination data from a mobile phone network. IET Intell. Transp. Syst. 2007, 1, 15–26. [Google Scholar] [CrossRef] [Green Version]
- Alexander, L.; Jiang, S.; Murga, M.; González, M.C. Origin–destination trips by purpose and time of day inferred from mobile phone data. Transp. Res. Part C Emerg. Technol. 2015, 58, 240–250. [Google Scholar] [CrossRef]
- Bonnel, P.; Hombourger, E.; Olteanu-Raimond, A.M.; Smoreda, Z. Passive mobile phone dataset to construct origin-destination matrix: Potentials and limitations. Transp. Res. Procedia 2015, 11, 381–398. [Google Scholar] [CrossRef]
- Vidović, K.; Lučić, A.; Šarić, D. Methodology of O-D Matrix Determination from Telecommunication Charging Data Records. In Proceedings of the 36th Conference on Transport Systems with International Participation “Automation in Transport 2016”, Zagreb, Croatia, 9–12 November 2016. [Google Scholar]
- Zannat, K.E.; Choudhury, C.F. Emerging Big Data Sources for Public Transport Planning: A Systematic Review on Current State of Art and Future Research Directions. J. Indian Inst. Sci. 2019, 99, 601–619. [Google Scholar] [CrossRef] [Green Version]
- Holleczek, T.; Yu, L.; Lee, J.K.; Senn, O.; Kloeckl, K.; Ratti, C.; Jaillet, P. Digital breadcrumbs: Detecting urban mobility patterns and transport mode choices from cellphone networks. CoRR 2013, 1380, 1–14. [Google Scholar]
- Qu, Y.; Gong, H.; Wang, P. Transportation Mode Split with Mobile Phone Data. IEEE Conf. Intell. Transp. Syst. Proc. ITSC 2015, 2015, 285–289. [Google Scholar]
- Huang, H.; Cheng, Y.; Weibel, R. Transport mode detection based on mobile phone network data: A systematic review. Transp. Res. Part C Emerg. Technol. 2019, 101, 297–312. [Google Scholar] [CrossRef]
- Lee, S. The use of mobile phone data in transport planning. Int. J. Technol. Policy Manag. 2020, 20, 54–69. [Google Scholar] [CrossRef]
- Milne, D.; Watling, D. Big data and understanding change in the context of planning transport systems. J. Transp. Geogr. 2019, 76, 235–244. [Google Scholar] [CrossRef]
- Bachir, D.; Khodabandelou, G.; Gauthier, V.; el Yacoubi, M.; Puchinger, J. Inferring dynamic origin-destination flows by transport mode using mobile phone data. Transp. Res. Part C Emerg. Technol. 2019, 101, 254–275. [Google Scholar] [CrossRef] [Green Version]
- Semanjski, I.; Gautama, S.; Ahas, R.; Witlox, F. Spatial context mining approach for transport mode recognition from mobile sensed big data. Comput. Environ. Urban Syst. 2017, 66, 38–52. [Google Scholar] [CrossRef]
- Bachir, D.; Khodabandelou, G.; Gauthier, V.; El Yacoubi, M.; Vachon, E. Combining Bayesian Inference and Clustering for Transport Mode Detection from Sparse and Noisy Geolocation Data. Eur. Conf. Mach. Learn. Princ. Pract. Knowl. Discov. Databases 2018, 2018, 569–584. [Google Scholar]
- Vidović, K.; Šoštarić, M.; Mandžuka, S.; Kos, G. Model for Estimating Urban Mobility Based on the Records of User Activities in Public Mobile Networks. Sustainability 2020, 12, 838. [Google Scholar] [CrossRef] [Green Version]
- Wideberg, J.P.; Caceres, N.; Benitez, F.G. Deriving Traffic Data from a Cellular Network. In Proceedings of the 13th World Congress on Intelligent Transport Systems and Services, London, UK, 8–12 October 2006; pp. 1–8. [Google Scholar]
- Caceres, N.; Romero, L.M.; Benitez, F.G.; del Castillo, J.M. Traffic flow estimation models using cellular phone data. IEEE Trans. Intell. Transp. Syst. 2012, 13, 1430–1441. [Google Scholar] [CrossRef]
- Furletti, B.; Gabrielli, L.; Garofalo, G.; Giannotti, F.; Milli, L.; Nanni, M.; Pedreschi, D.; Vivio, R. Use of Mobile Phone Data to Estimate Mobility Flows. Measuring Urban Population and Inter-City Mobility Using Big Data in an Integrated Approach; SIS: Roma, Italy, 2014; pp. 1–10. [Google Scholar]
- Galloni, A.; Horváth, B.; Horváth, T. Real-time Monitoring of Hungarian Highway Traffic from Cell Phone Network Data. In Proceedings of the 18th Conference Information Technologies–Applications and Theory (ITAT 2018), Krompachy, Slovakia, 21–25 September 2018; Volume 2203, pp. 108–115. [Google Scholar]
- Ilias, L.; Lima, A.; Kwak, H.; Stanojevic, R.; Wetherall, D.; Papagiannaki, K. From Cells to Streets: Estimating Mobile Paths with Cellular-Side Data. In CoNEXT ’14: Proceedings of the 10th ACM International on Conference on Emerging Networking Experiments and Technologies; Association for Computing Machinery: New York, NY, USA, 2014; pp. 121–132. [Google Scholar]
- Jiang, S.; Ferreira, J.; Gonzalez, M.C. Activity-Based Human Mobility Patterns Inferred from Mobile Phone Data: A Case Study of Singapore. IEEE Trans. Big Data 2017, 3, 208–219. [Google Scholar] [CrossRef] [Green Version]
- Candia, J.; González, M.C.; Wang, P.; Schoenharl, T.; Madey, G.; Barabási, A.-L. Uncovering individual and collective human dynamics from mobile phone records. J. Phys. A Math. Theor. 2008, 41, 224015. [Google Scholar] [CrossRef] [Green Version]
- González, M.C.; Hidalgo, C.A.; Barabási, A.-L. Understanding individual human mobility patterns. Nature 2008, 453, 779–782. [Google Scholar] [CrossRef] [PubMed]
- Simini, F.; González, M.C.; Maritan, A.; Barabási, A.-L. A universal model for mobility and migration patterns. Nature 2012, 484, 96–100. [Google Scholar] [CrossRef]
- Semanjski, I.; Bellens, R.; Gautama, S.; Witlox, F. Integrating big data into a sustainable mobility policy 2.0 planning support system. Sustainability 2016, 8, 1142. [Google Scholar] [CrossRef] [Green Version]
- Croatian Bureau of Statistics. Statistical Yearbook of the Republic of Croatia; Croatian Bureau of Statistics: Zagreb, Croatia, 2020. [Google Scholar]
- Maglić, L.; Krljan, T.; Grubišić, N.; Maglić, L. Estimating Urban Road Transport Vehicles Emissions in the Rijeka City Streets. Promet Traffic Transp. 2021, 33, 165–178. [Google Scholar]
- Baričević, H.; Jugović, T.P.; Ljudevit, K.; Šuperina, V. The Integral Study of Urban Traffic in the County of Primorsko-Goranska and Town of Rijeka. Autom. Prometu KoREMA 2008, 2008, 5–10. [Google Scholar]
- Krpan, L.; Agatić, A.; Maršanić, R. Master Plan for Developing the Traffic System of The Functional Region of Northern Adriatic. In Proceedings of the KoREMA, 37. Skup o Prometnim Sustavima “Automatizacija u Prometu 2017”, Rijeka, Croatia, 15–18 November 2017; KoREMA: Zagreb, Croatia, 2018; pp. 1–431. [Google Scholar]
Figure 1.
Big Data analytical process.
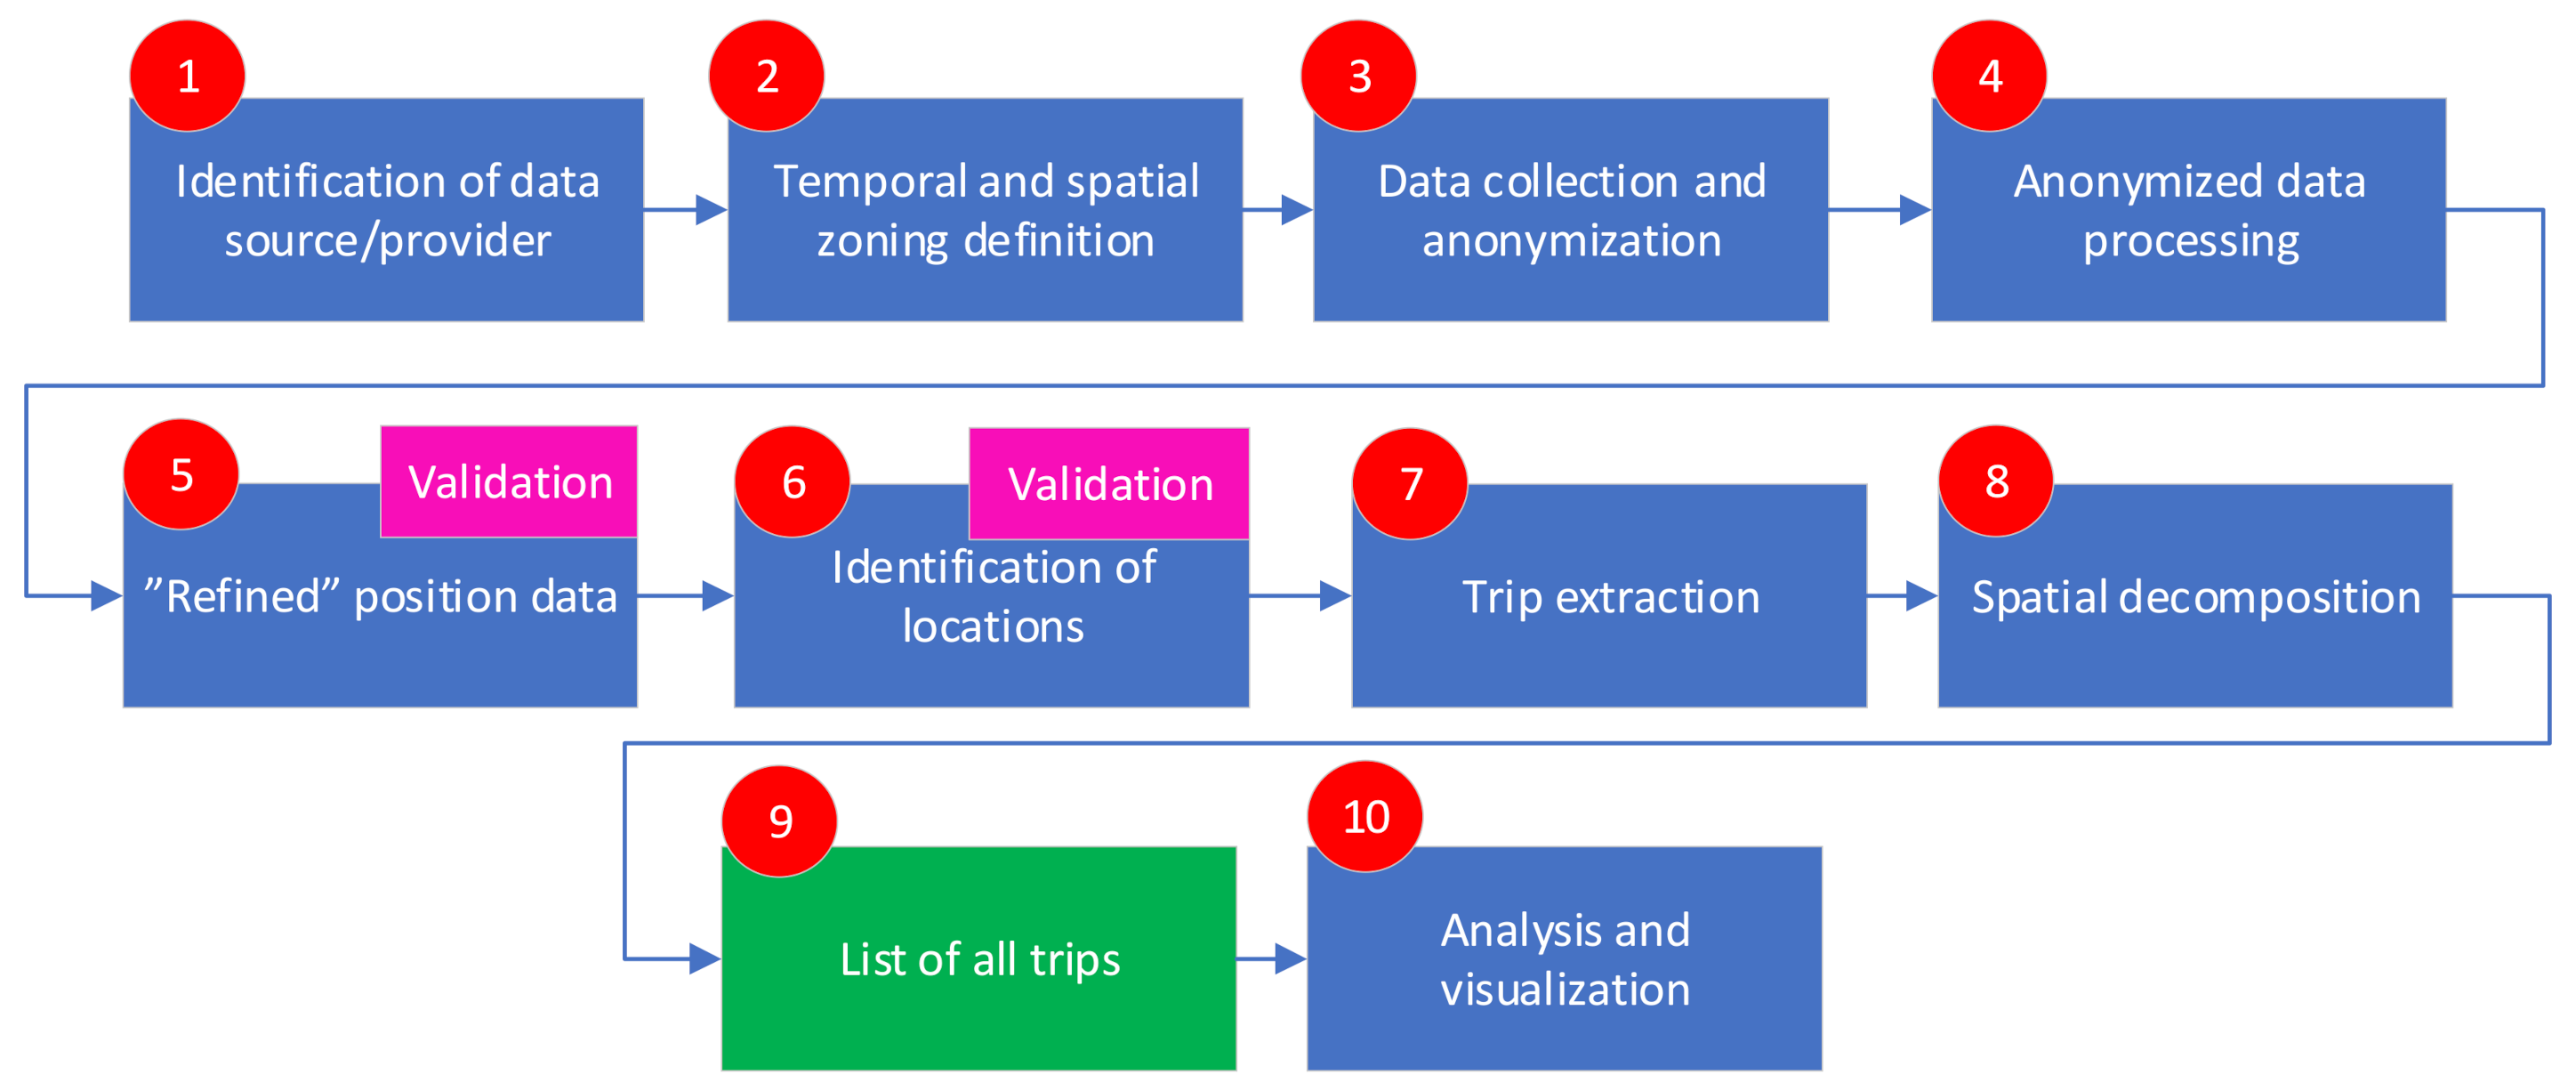
Figure 2.
Histogram presenting total distance value error (left) and scatter of longitude and latitude error (right).
Figure 2.
Histogram presenting total distance value error (left) and scatter of longitude and latitude error (right).

Figure 3.
Excerpt of GPS location points (red marks) and corresponding network-based refined user data (green marks) for test user (Scale: 1:15,000, underlaying map: OpenStreetMap).
Figure 3.
Excerpt of GPS location points (red marks) and corresponding network-based refined user data (green marks) for test user (Scale: 1:15,000, underlaying map: OpenStreetMap).

Figure 4.
Excerpt of identified stay locations (Scale: 1:15,000, underlaying map: OpenStreetMap).

Figure 5.
Share of the population of a particular zone in relation to the total population of narrower coverage area: census data vs. identified “home locations”.
Figure 5.
Share of the population of a particular zone in relation to the total population of narrower coverage area: census data vs. identified “home locations”.

Figure 6.
Difference between census data and big data derived home locations in percentage per sector.
Figure 6.
Difference between census data and big data derived home locations in percentage per sector.
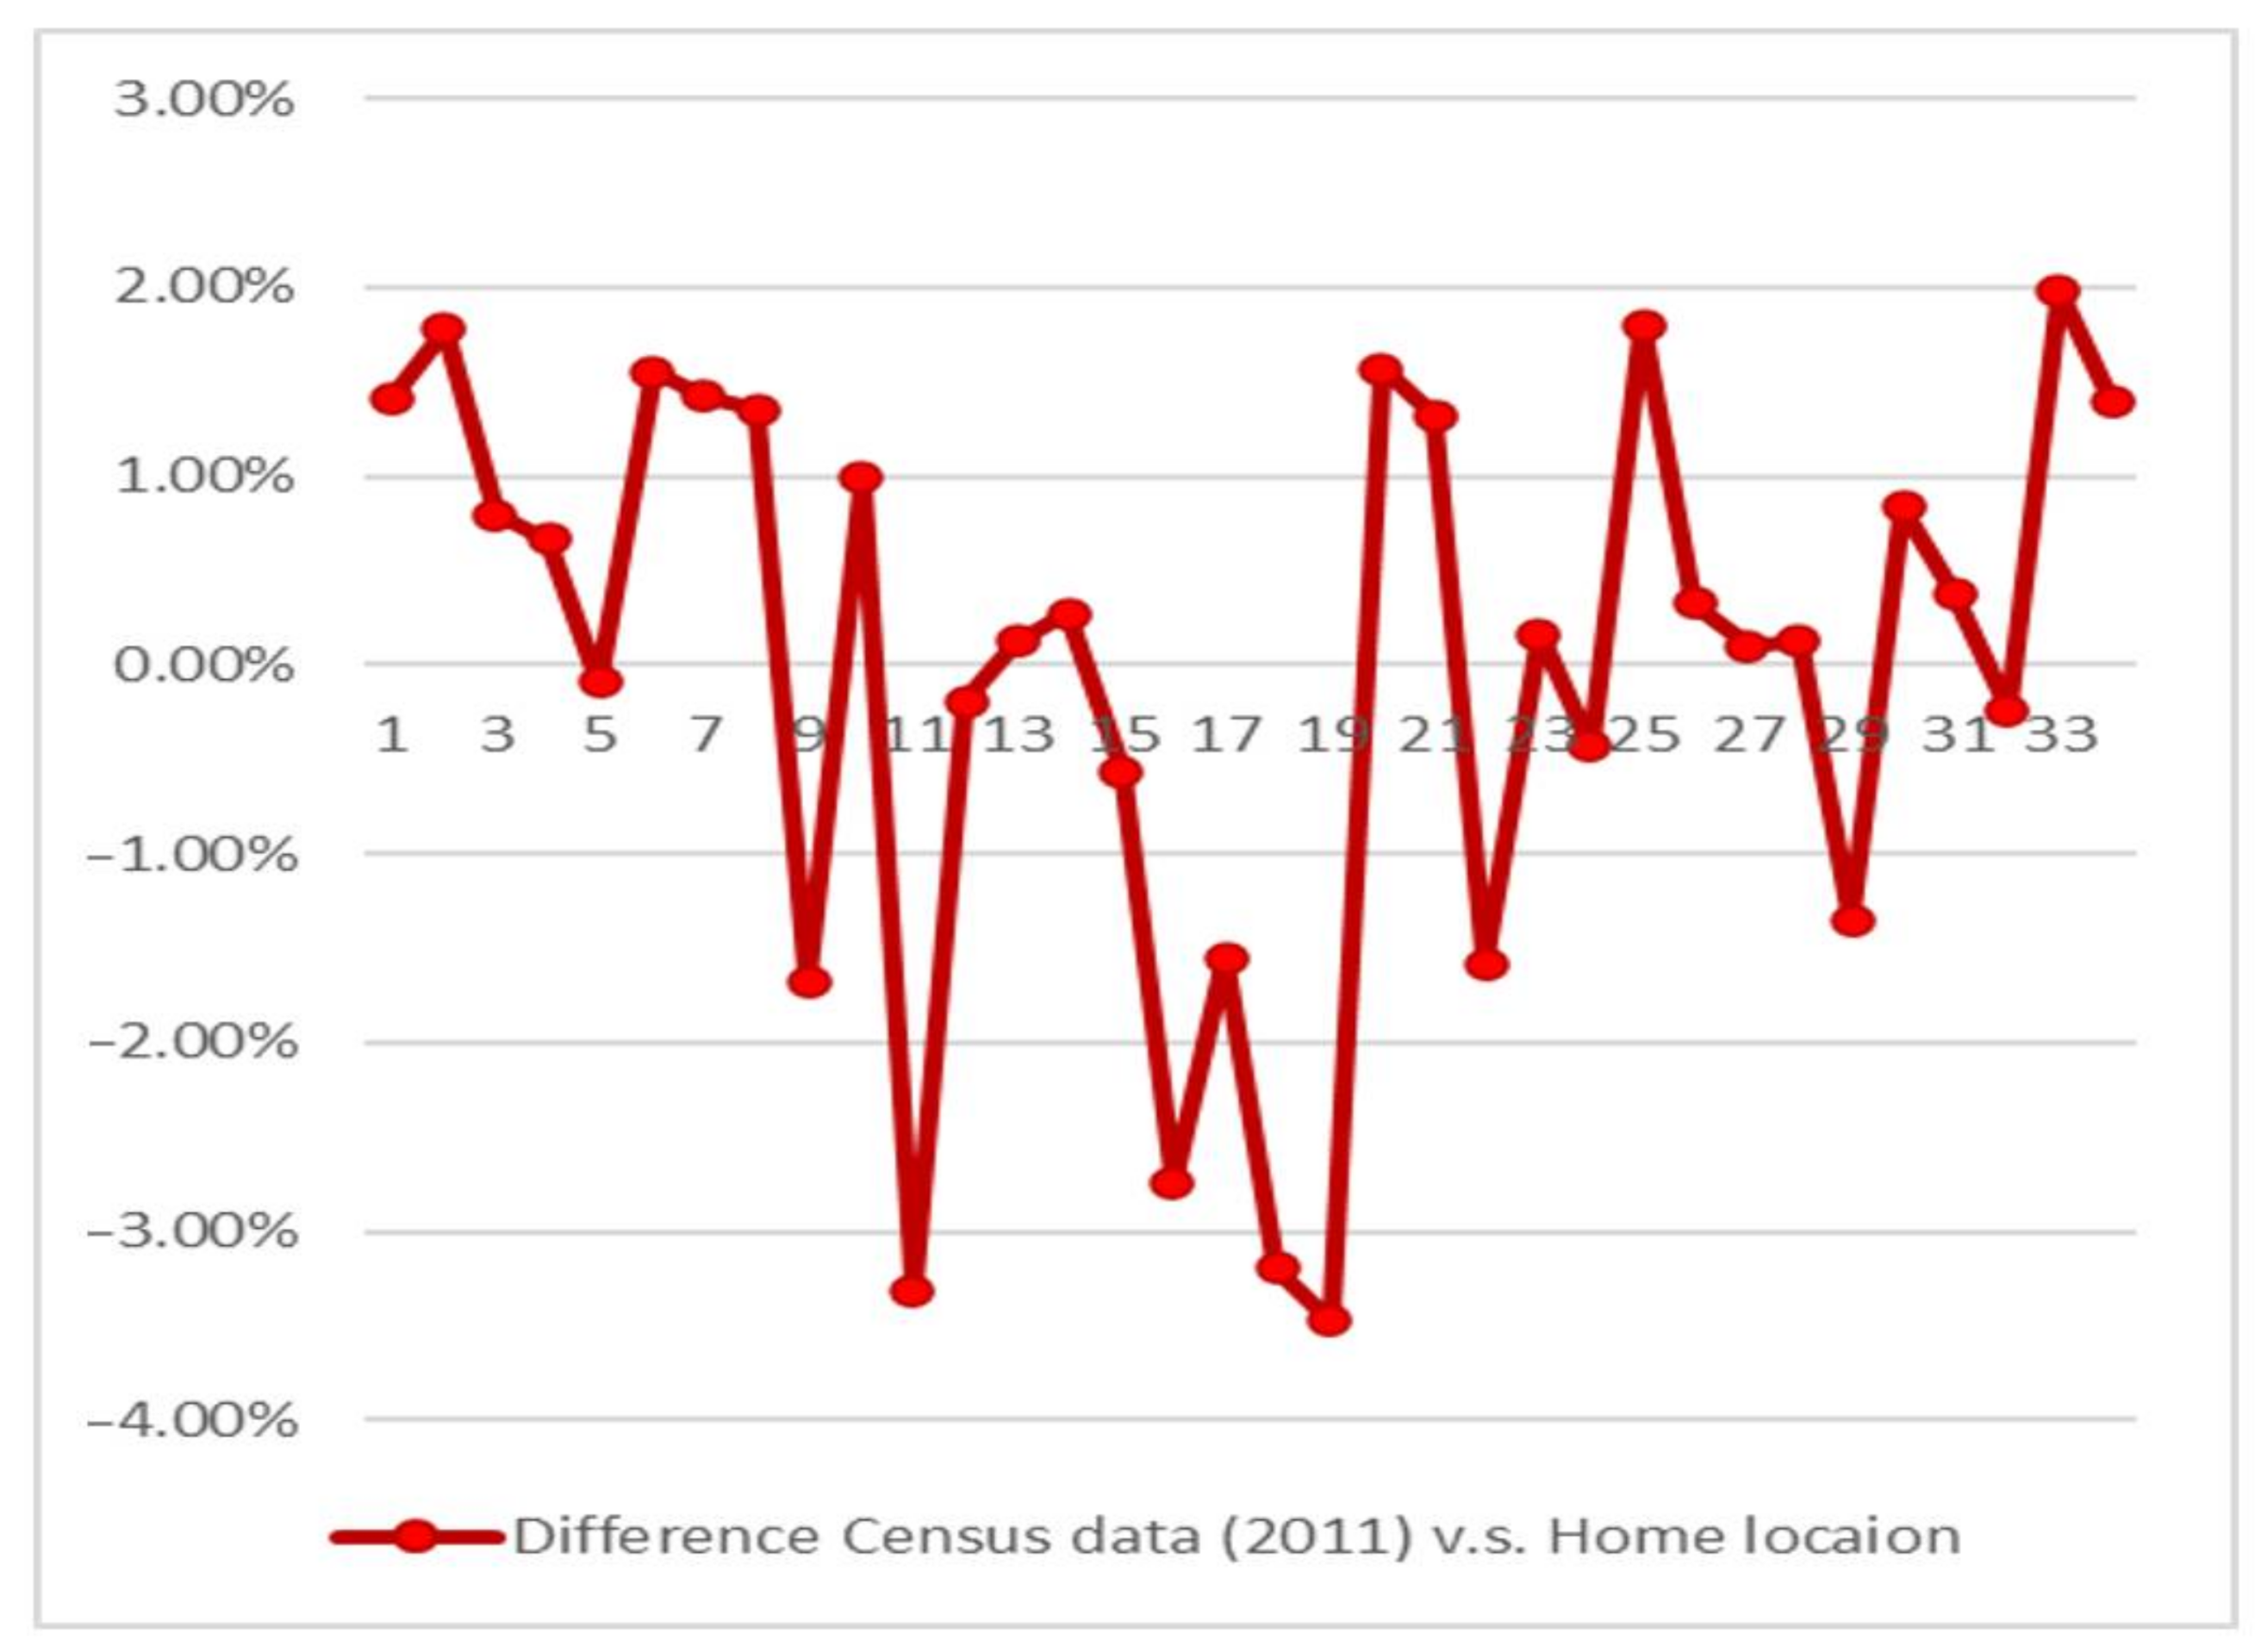
Figure 7.
Example of origin–destination matrix for one day with absolute (non-pondered values), matrix for one day relativized on the base of one zone and matrix for one day relativized on the base of the entire coverage zone.
Figure 7.
Example of origin–destination matrix for one day with absolute (non-pondered values), matrix for one day relativized on the base of one zone and matrix for one day relativized on the base of the entire coverage zone.

Figure 8.
Comparative analysis of daily distribution of transport demand (a characteristic day of the week).
Figure 8.
Comparative analysis of daily distribution of transport demand (a characteristic day of the week).

Figure 9.
Comparative analysis of daily unevenness of transport demand (correlation analysis).

Figure 10.
Target zones—five zones with significant usage of passenger cars for daily commuting (Scale: 1:45,000, underlaying map: OpenStreetMap).
Figure 10.
Target zones—five zones with significant usage of passenger cars for daily commuting (Scale: 1:45,000, underlaying map: OpenStreetMap).

Figure 11.
Overview of the proposed measures acceptability.

Figure 12.
Acceptability for groups of measures.


Table 1.
Result of comparison of mobile network positioning location and test device GPS positioning.
Table 1.
Result of comparison of mobile network positioning location and test device GPS positioning.
| Total Distance | Longitude (x) | Latitude (y) | |
|---|---|---|---|
| MIN | 6 | 0 | 0 |
| MAX | 4808 | 3655 | 4625 |
| AVERAGE | 419 | 273 | 258 |
| MEDIAN | 322 | 182 | 186 |
| RMSE | 576.95 | 429.40 | 429.40 |
| MAE | 605.15 | 394.06 | 371.84 |
Table 2.
Modal split percentages.
| Modal Split | Field Research | Big Datasets | |Difference| |
|---|---|---|---|
| Passenger car | 71.9% | 69.41% | 2.49% |
| Public transport | 21.0% | 23.56% | 2.56% |
| Walking | 6.3% | 6.96% | 0.66% |
| Cycling | 0.8% | 0.07% | 0.73% |
Publisher’s Note: MDPI stays neutral with regard to jurisdictional claims in published maps and institutional affiliations. |
© 2021 by the authors. Licensee MDPI, Basel, Switzerland. This article is an open access article distributed under the terms and conditions of the Creative Commons Attribution (CC BY) license (https://creativecommons.org/licenses/by/4.0/).
Share and Cite
MDPI and ACS Style
Šoštarić, M.; Vidović, K.; Jakovljević, M.; Lale, O. Data-Driven Methodology for Sustainable Urban Mobility Assessment and Improvement. Sustainability 2021, 13, 7162. https://doi.org/10.3390/su13137162
AMA Style
Šoštarić M, Vidović K, Jakovljević M, Lale O. Data-Driven Methodology for Sustainable Urban Mobility Assessment and Improvement. Sustainability. 2021; 13(13):7162. https://doi.org/10.3390/su13137162
Chicago/Turabian StyleŠoštarić, Marko, Krešimir Vidović, Marijan Jakovljević, and Orsat Lale. 2021. "Data-Driven Methodology for Sustainable Urban Mobility Assessment and Improvement" Sustainability 13, no. 13: 7162. https://doi.org/10.3390/su13137162
Note that from the first issue of 2016, this journal uses article numbers instead of page numbers. See further details here.