Article

Towards the Future of Sustainable Mobility: Results from a European Survey on (Electric) Powered-Two Wheelers

1
Würzburger Institut für Verkehrswissenschaften (WIVW GmbH), Robert-Bosch-Str. 4, 97209 Veitshöchheim, Germany
2
Salzburg Research Forschungsgesellschaft mbH, Jakob-Haringer-Str. 5/3, 5020 Salzburg, Austria
*
Author to whom correspondence should be addressed.
Sustainability 2021, 13(13), 7151; https://doi.org/10.3390/su13137151
Submission received: 20 April 2021 / Revised: 16 June 2021 / Accepted: 21 June 2021 / Published: 25 June 2021

Abstract

:
Personal transport is of high importance in our society and the 2020 pandemic situation has reinforced this situation. At the same time, transport contributes to local emissions, which need to be reduced in the face of climate change. Changing from vehicles with internal combustion engines to light electric vehicles could be one promising approach. Therefore, we need to understand mobility patterns and attitudes towards E-mobility to create sustainable transport solutions that will be broadly accepted. An online survey with N = 432 participants across Europe was conducted. The majority of respondents came from Germany, followed by Italy, Austria and Sweden. Generally, cars are the main vehicle for personal transport. PTWs are used for commuting as well as leisure activity. Driving experience, easier parking and lower maintenance compared to cars are major reasons to choose a PTW. No differences between younger and elderly participants were observed. E-PTWs are primarily avoided due to high costs, range anxiety and expected problems with the charging infrastructure. To support sustainable mobility, these obstacles need to be overcome. One aspect is definitely the provision of better charging infrastructure or electric vehicles with increased range. Hence, given typical trip lengths and purposes, it might seem equally important to tackle prejudices and increase the knowledge about E-mobility with all its potential benefits in the population.

1. Introduction

Powered two-wheelers (PTW) are used around the world. They are especially popular in Asia, with most of the world’s PTWs located there [1]; however, their number is also growing in Europe [2,3]. A shift towards using PTWs is attributed to an advantage in mobility and flexibility, as well as to economic and environmental benefits [4]. While, in Asian countries, the use of PTWs is usually associated with low-class or low-income status [5], it seems that, for European cities, the contributing factors for PTW use are more diverse. Marquet and Miralles–Guasch [6] analyzed the city of Barcelona, which has been experiencing a strong increase in motorcyclists. Results showed that using a motorcycle as a mode of transport was not associated with low-class or low-income status, but the affordability of a motorcycle still explained its growing popularity. In addition, for the city of Barcelona, motorcycle use was associated both with leisure and commuting [6]. With these insights, it seems that results from other countries, where PTW use is either a necessity for people with lower income or a leisure activity for an older audience [7], cannot be transferred to the new demand for PTWs in Western countries and cities, as the demand for PTWs as well as the users there seems to be more diverse.
If people are switching from cars to PTWs as a mode of personal mobility, this could help sustainability and the quality of life in cities, as PTWs use less fossil fuels. However, this effect would be more intensified if use of electric PTWs (E-PTWs) were more widespread. Being a form of more sustainable transport, E-PTWs do not contribute to local air pollution, and they have the ability to reduce CO2 emissions, as electricity can be produced from renewable energy sources [8]. The European Union’s target of a 37.5% reduction in carbon dioxide emissions by 2030 for new vehicles, as laid out in the clean mobility agenda, requires alternative mobility concepts, such as E-PTWs [9].
With the challenge to reduce fossil use and the rising popularity of PTWs in Europe with varied demands, exploring factors that impact consumer adoption of E-PTWs would mean a step towards more sustainable mobility. In this vein, the current study seeks to (1) investigate PTW rider behavior and habits across Europe (therefore not limited to a single city) and (2) explore factors that would influence adoption of E-PTWs for a European sample. Together, our findings can suggest demands and challenges that the E-PTW of the future must meet.

1.1. PTW and E-PTW Use in Europe

Almost all European countries have experienced an increase in PTW ownership for years, with a stronger increase in older riders (middle European countries are the exception here with a decrease in PTWs), whereas the age of older riders is not defined consistently, but usually starts from age 30 onwards [10]. PTWs are more frequent in southern European countries, with Greece having the highest ownership rate. In 2019, the PTW market experienced a large increase in registrations [11], with over an 8% increase in motorcycles and an 11% increase in mopeds. Similarly, E-PTWs showed a large increase in registrations (104% for motorcycles, 49% for mopeds); however, they do remain a niche market. In 2020, due to the outbreak of COVID-19, the PTW market experienced an initial decrease, but registrations rose again slightly in the second half of the year [12].
Factors for the use of PTWs differ between regions, cities and rural areas [1]. For example, in developing countries, but also in some large Western cities, PTWs are commonly used for commuting—PTWs are a good alternative for urban mobility amidst increasing prices for fuel, traffic congestion and decreasing parking possibilities [13,14]. For a number of cities, especially in Southeast Asia, PTWs are the primary means of urban transportation [15]. In other, typical high-income countries, PTWs are mainly used for leisure activities such as touring [16]. There is also evidence that PTW behavior changes with age, making PTW use a leisure activity for the older generation [7].
For PTW users in Europe, Delhaye and Marot [17] showed in a survey that people use them for both leisure and commuting, but a third of participants use the PTW only for leisure purposes. Most motorcyclists also stated that they own a car, so a PTW was not the only means of transport. In addition, an analysis of motives showed that the pleasure of riding the PTW, a feeling of freedom as well as easy parking were most important; secondary motives were advantages for mobility and the “biking spirit”. Nearly daily use of motorcycles occurs more often in Southern countries (near-daily use of motorcycles occurs most frequently in Greece and Cyprus) than in Central or Northern Countries (the lowest riding frequency is found in the Netherlands, Poland and Germany). Male riders rode their motorcycles more frequently than female riders; however, in general, the population of female riders is small (with Delhaye and Marot [17] reporting varying proportions for countries, for example, in France, only 5% of women rode a motorcycle, in Germany, 15% were female riders with an upwards trend). Regarding age, the survey showed that, while traditionally motorcycle riders have been young, there is a long-term trend towards fewer young riders and more older riders—about 75% of motorcyclists are older than 25 years. Riders of mopeds are younger than motorcyclists due to the lower required legal age.
With the diverse needs of riders, PTWs of the future will need to fulfill various requirements. Our study seeks to replicate existing findings and identify new relevant topics, especially for an older population of riders, as an ageing population in Europe [18] might pose additional and different demands (compared to younger riders) for mobility in European cities.

1.2. Consumer Adoption of E-PTWs

A number of studies describe consumer adoption and influencing factors for use of electric cars [19]. For electric vehicles in general, the biggest barriers for adoption are battery range as well as costs. People prone to trying new technologies will adopt electric vehicles early if they perceive them to be superior [20]. Adoption behavior of electric vehicles depends on attitudinal factors, pro-environmental behavior, innovation adoption behavior, symbolic behavior and emotional behavior (see Rezvani, et al. [21] for an overview). Other studies have also identified mobility patterns, experience with electric vehicles and social influence as contributing factors [22]. Similarly, Eccarius and Lu (2020) have recently investigated and categorized available studies on consumer adoption of E-PTWs [23]. Most studies have focused on the theory of planned behavior [24], some used the diffusion of innovation theory [25] or the technology acceptance model [26] as frameworks for adoption of electric PTWs. Eccarius and Lu’s analysis has identified relevant technical (e.g., ease of use), monetary (e.g., costs, monetary benefits), social and individual (e.g., environmental attitudes, symbolic meaning of E-PTW) and demographic (e.g., age, gender) factors as well as ease of use and convenience for buying and using an E-PTW. Guerra [15] found that, in Indonesia, speed, range, charging time and price mattered for choosing an E-PTW, as well as that younger PTW riders with concerns about the environment and favorable views of E-bikes were most likely to choose E-PTWs. Zhu, et al. [27] showed that, when people were interested in an E-PTW, consumers paid more attention to cost than to other features. While these results give insights into factors that are important for people choosing to use a PTW or E-PTW, studies have mainly focused on Asian countries, where most PTWs (and E-PTWs) are located and, due to the often-different PTW use in Western cities, are not easily transferable.
Building on these previous findings, this study brings together and expands on findings concerning mobility patterns with PTWs, as well as relevant factors of consumer adoption of E-PTWs for the European market. With these results, we want to identify demands that the growing PTW market will have to satisfy, not only regarding a changing PTW population (i.e., more older drivers) and diverse habits (i.e., PTW for commuting or for leisure), but also requirements for making PTWs a more sustainable form of transport; that is, a consumer orientation towards E-PTWs. The study was conducted as an online survey within the scope of the project EMotion (Electric mobility in L-category vehicles for all generations). This project seeks to develop new lightweight electrical vehicles. EMotion aims to close the gap between electric mopeds and motorcycles to enable possibilities for environmentally friendly and cost attractive commuting [28].

2. Materials and Methods

The study was conducted via an online survey (with LimeSurvey), which has the advantage that a variety of people across Europe can be reached rather easily. The survey was online between 4th June 2020 and 6th July 2020. It has been sent out to the authors’ participants panel and partners in 18 European countries. Everybody above the age of 16 (data privacy regulations and ethical standards) was welcome to contribute by filling in the online questionnaire. The survey was offered in German and English. A potential incentive to fill in the questionnaire was participation in a prize draw. The full survey took about 20 min to complete.

2.1. Development of the Questionnaire

As a first step, different questions that promised to provide valuable input to a better understanding of future (electric) transport were collected among the 10 partners of the EMotion consortium. Secondly, the questions were clustered and reduced in an iterative process to fit the online survey boundary conditions (e.g., duration for completing the survey). As a third step, the questionnaire was pre-tested by consortium members of different nationalities in order to identify issues with the question wording comprehension and duration. Lastly, these issues were solved by either changing the wording to ideally technical terms with a common understanding or by adding definitions of terms using a mouse-over function. This process had the aim to avoid misunderstandings or different understandings of the same question, which would have led to difficulties in the interpretation of the responses.

2.2. Questionnaire Structure

Depending on the provided answers on age or previous experience with motorcycles and electric vehicles, certain questions were either shown or hidden, i.e., not every question was shown to all participants. The landing page of the survey was designed as a welcome page with general information on the aim of the survey, the prize draw and the data privacy information. All participants above the age of 16 were asked to fill in basic demographic information such as gender and country of residence. To make sure that all participants have the same understanding of the study content, explanations and definitions of relevant terms and expressions were given at the beginning (e.g., Electric Powered Two-Wheeler, E-PTW).
The first block of questions asked participants about their current use of different means of transport, the following blocks of questions were randomized to avoid sequence effects. At the beginning of every block, the definitions of the most important expressions were shortly repeated. The survey closed with a thank you message.

2.3. Statistical Analysis

As described above, depending on previous experience or demographic information, participants received an individually adjusted set of questions. Additionally, the answers of participants that did not complete the survey totally are still being evaluated for the available questions in order to analyze as much data as available. This explains varying panel sizes for different questions. Consequently, visualizations such as bubble plots help to present a quick overview of data patterns, but should be interpreted with regard to the amount of data included indicated in the legend. Separate calculations were done for the following groups, following the research questions outlined above:
  • Age category/generation (2): younger vs. elderly. To assess potential differences between younger and elderly participants, a median split has been conducted that categorized “younger participants” below the age of 45 and “elderly participants” above the age of 45 (included).
  • PTW ownership (2): yes vs. no. Regardless of ownership, people without their own PTW might still have access to a PTW under certain circumstances.

3. Results

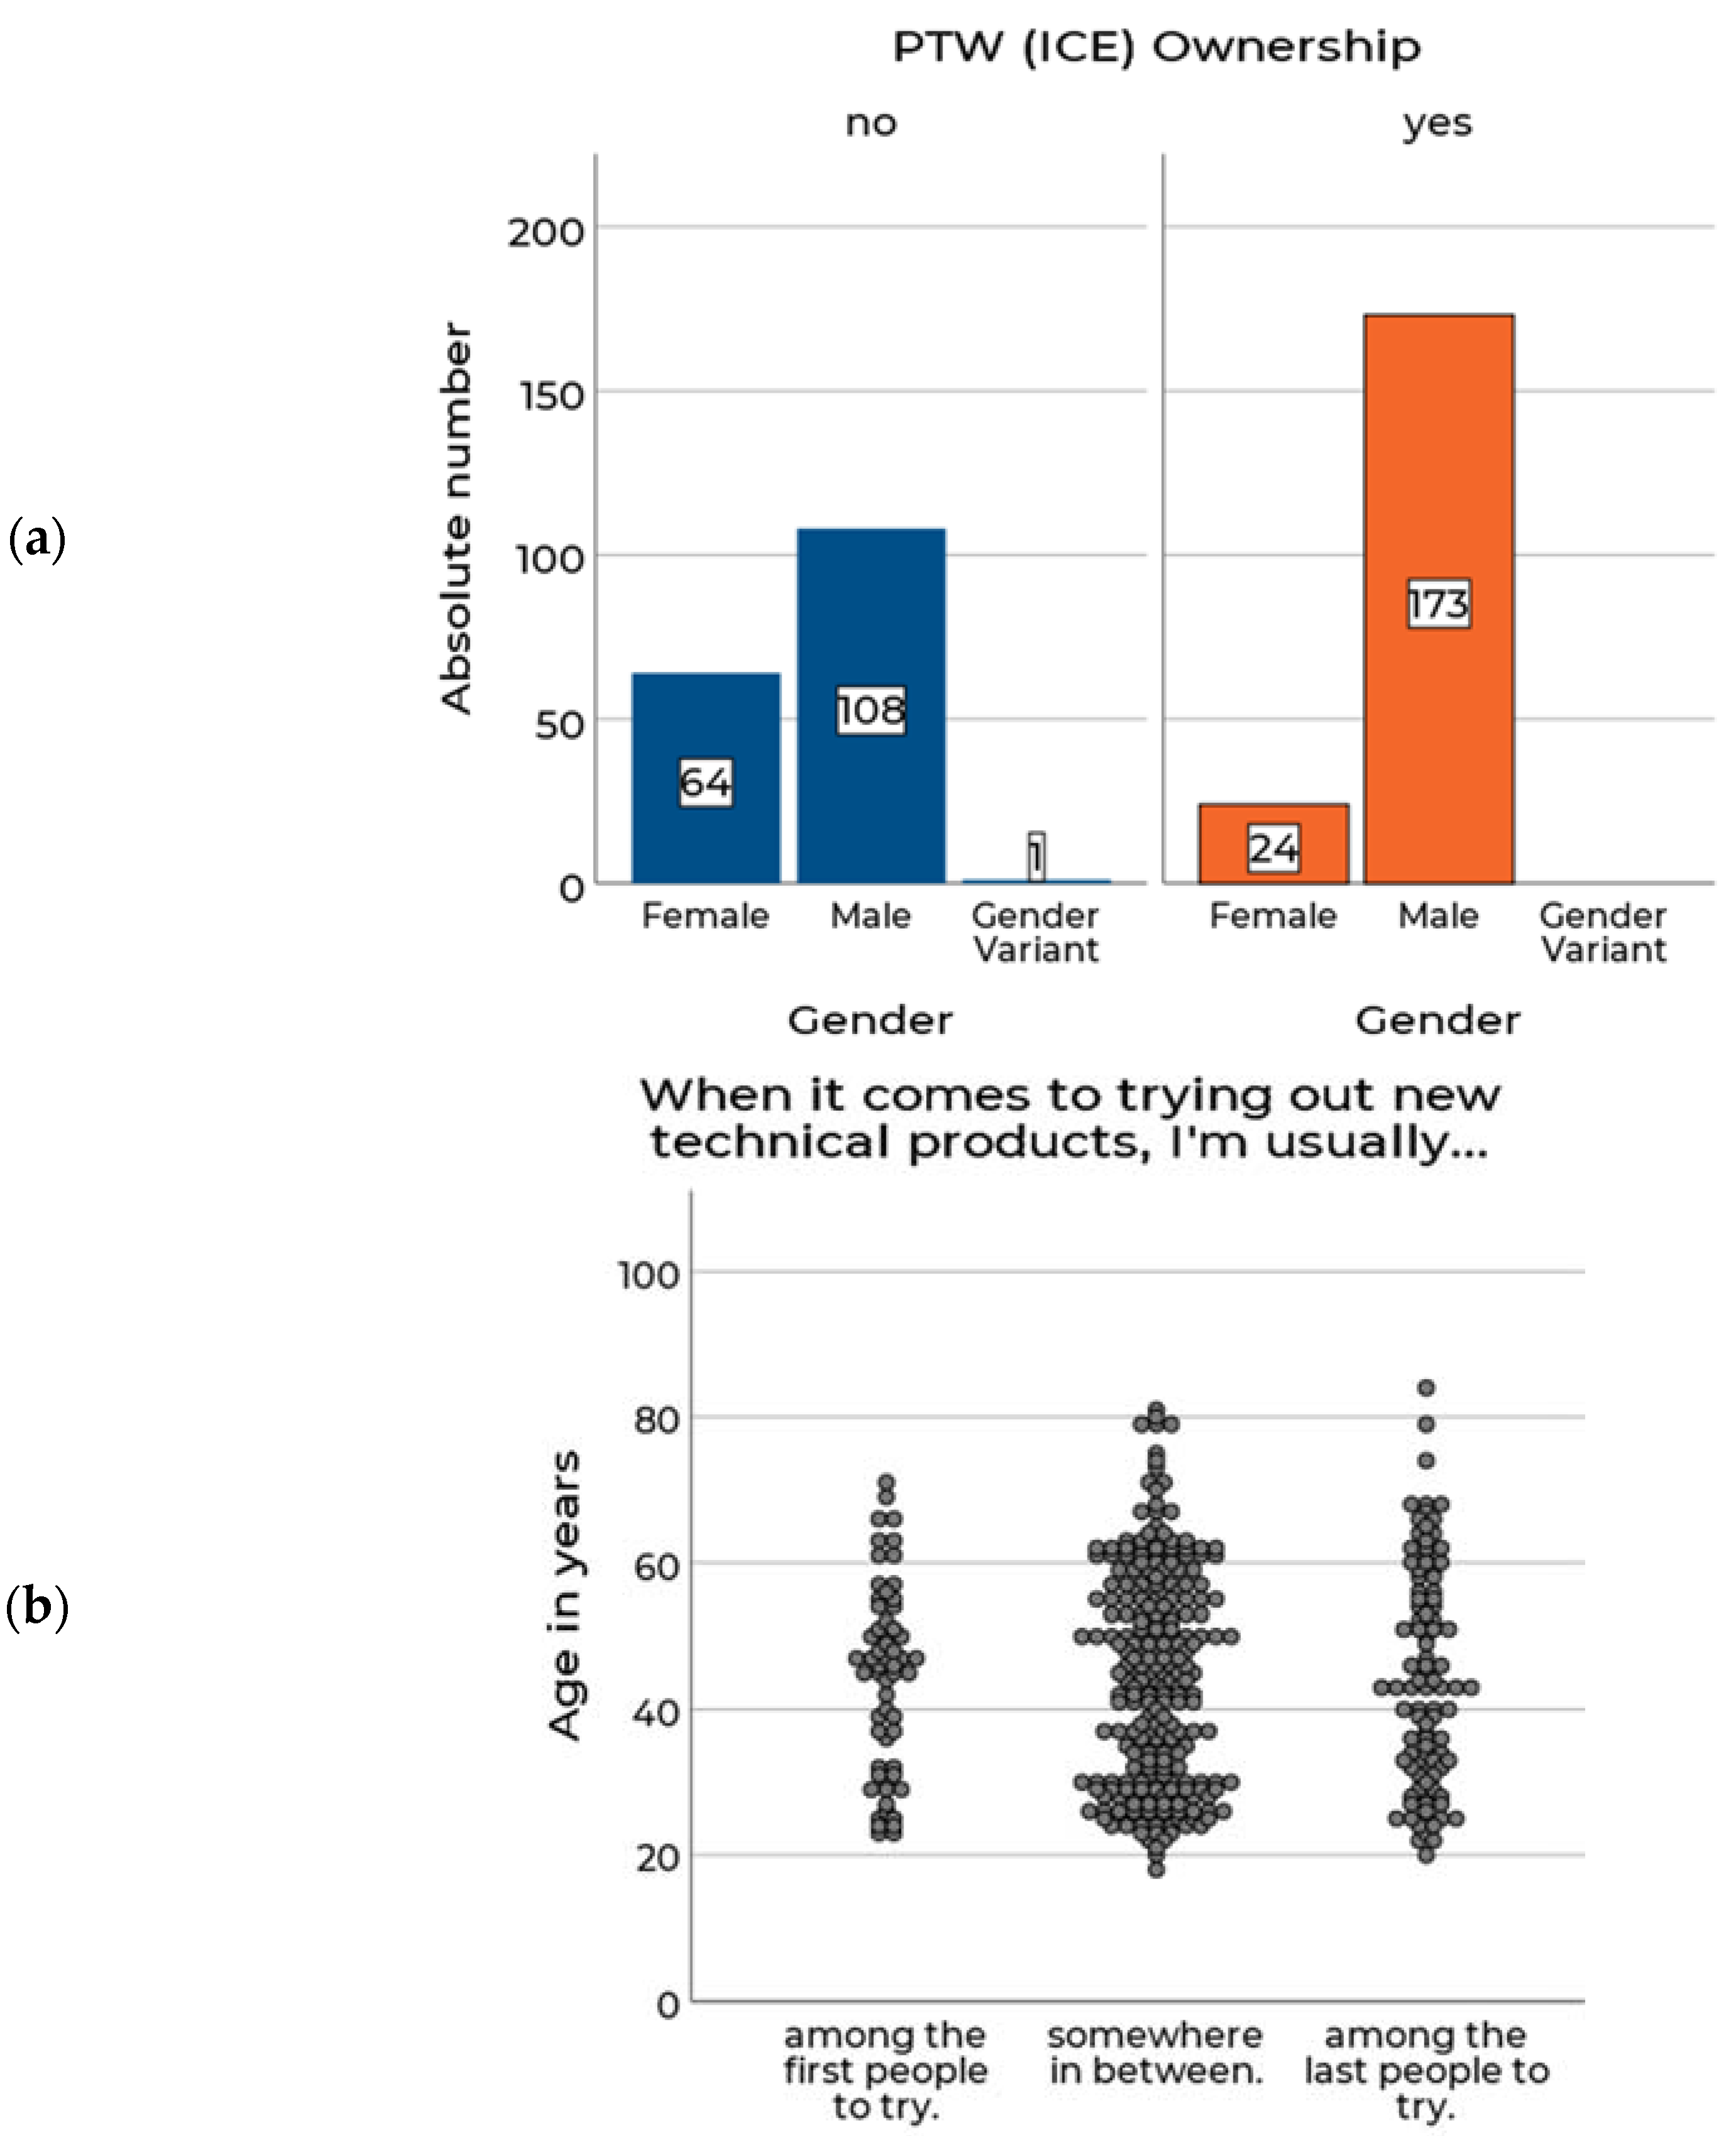
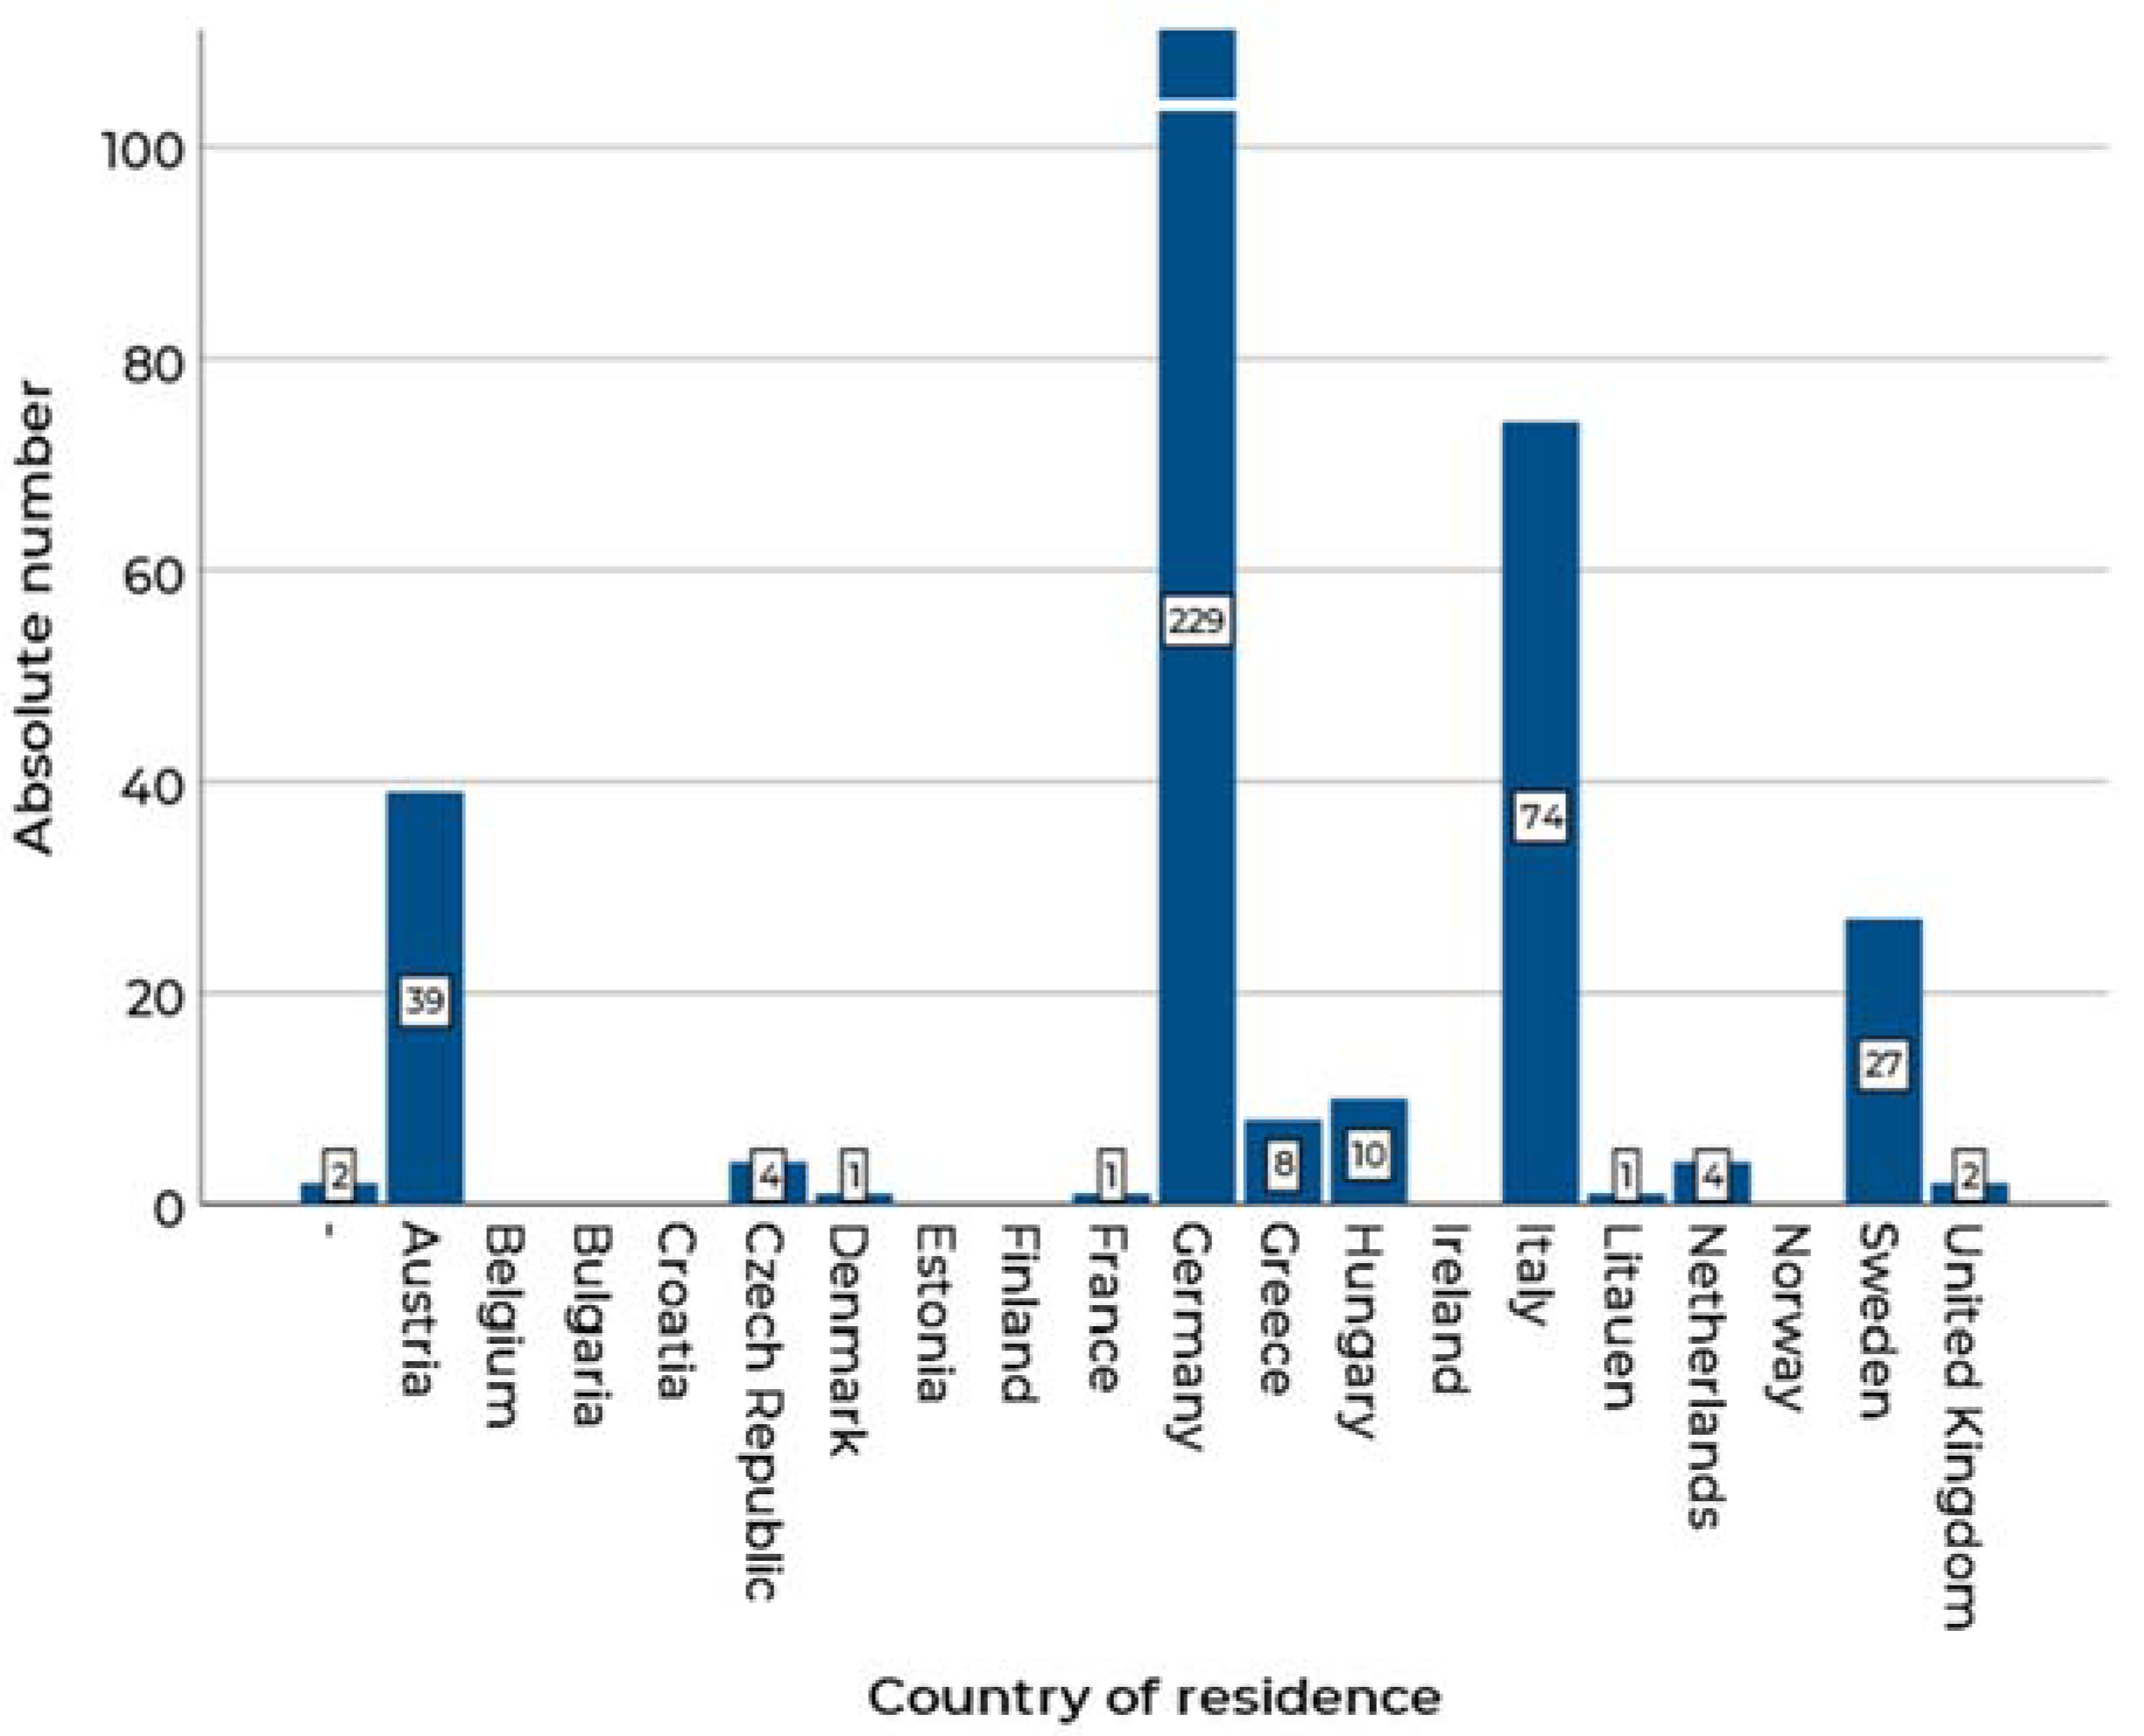
3.1. Panel Description

This section gives an overview of participants’ gender, age and country of residence. N = 432 participants started the survey, while n = 283 participants answered all questions. The average age was M = 44.72 years (Median = 45, min = 18, max = 84). Of the participants, 23.38% were female, 0.50% gender variant and 76.12% male. Among people that own a PTW (n = 197), male responders dominated (see Figure 1a). Interestingly, age does not predict whether people tend to try out new technical products early or late (see Figure 1b).
Figure 2 shows the country of residence for all survey participants. Participants of twelve different nations could be reached. However, there is a clear dominance of German respondents, followed by Italian and Austrian participants. Respondents mainly have a central European background. Hence, the dominance of German participants should always be kept in mind when interpreting the results.

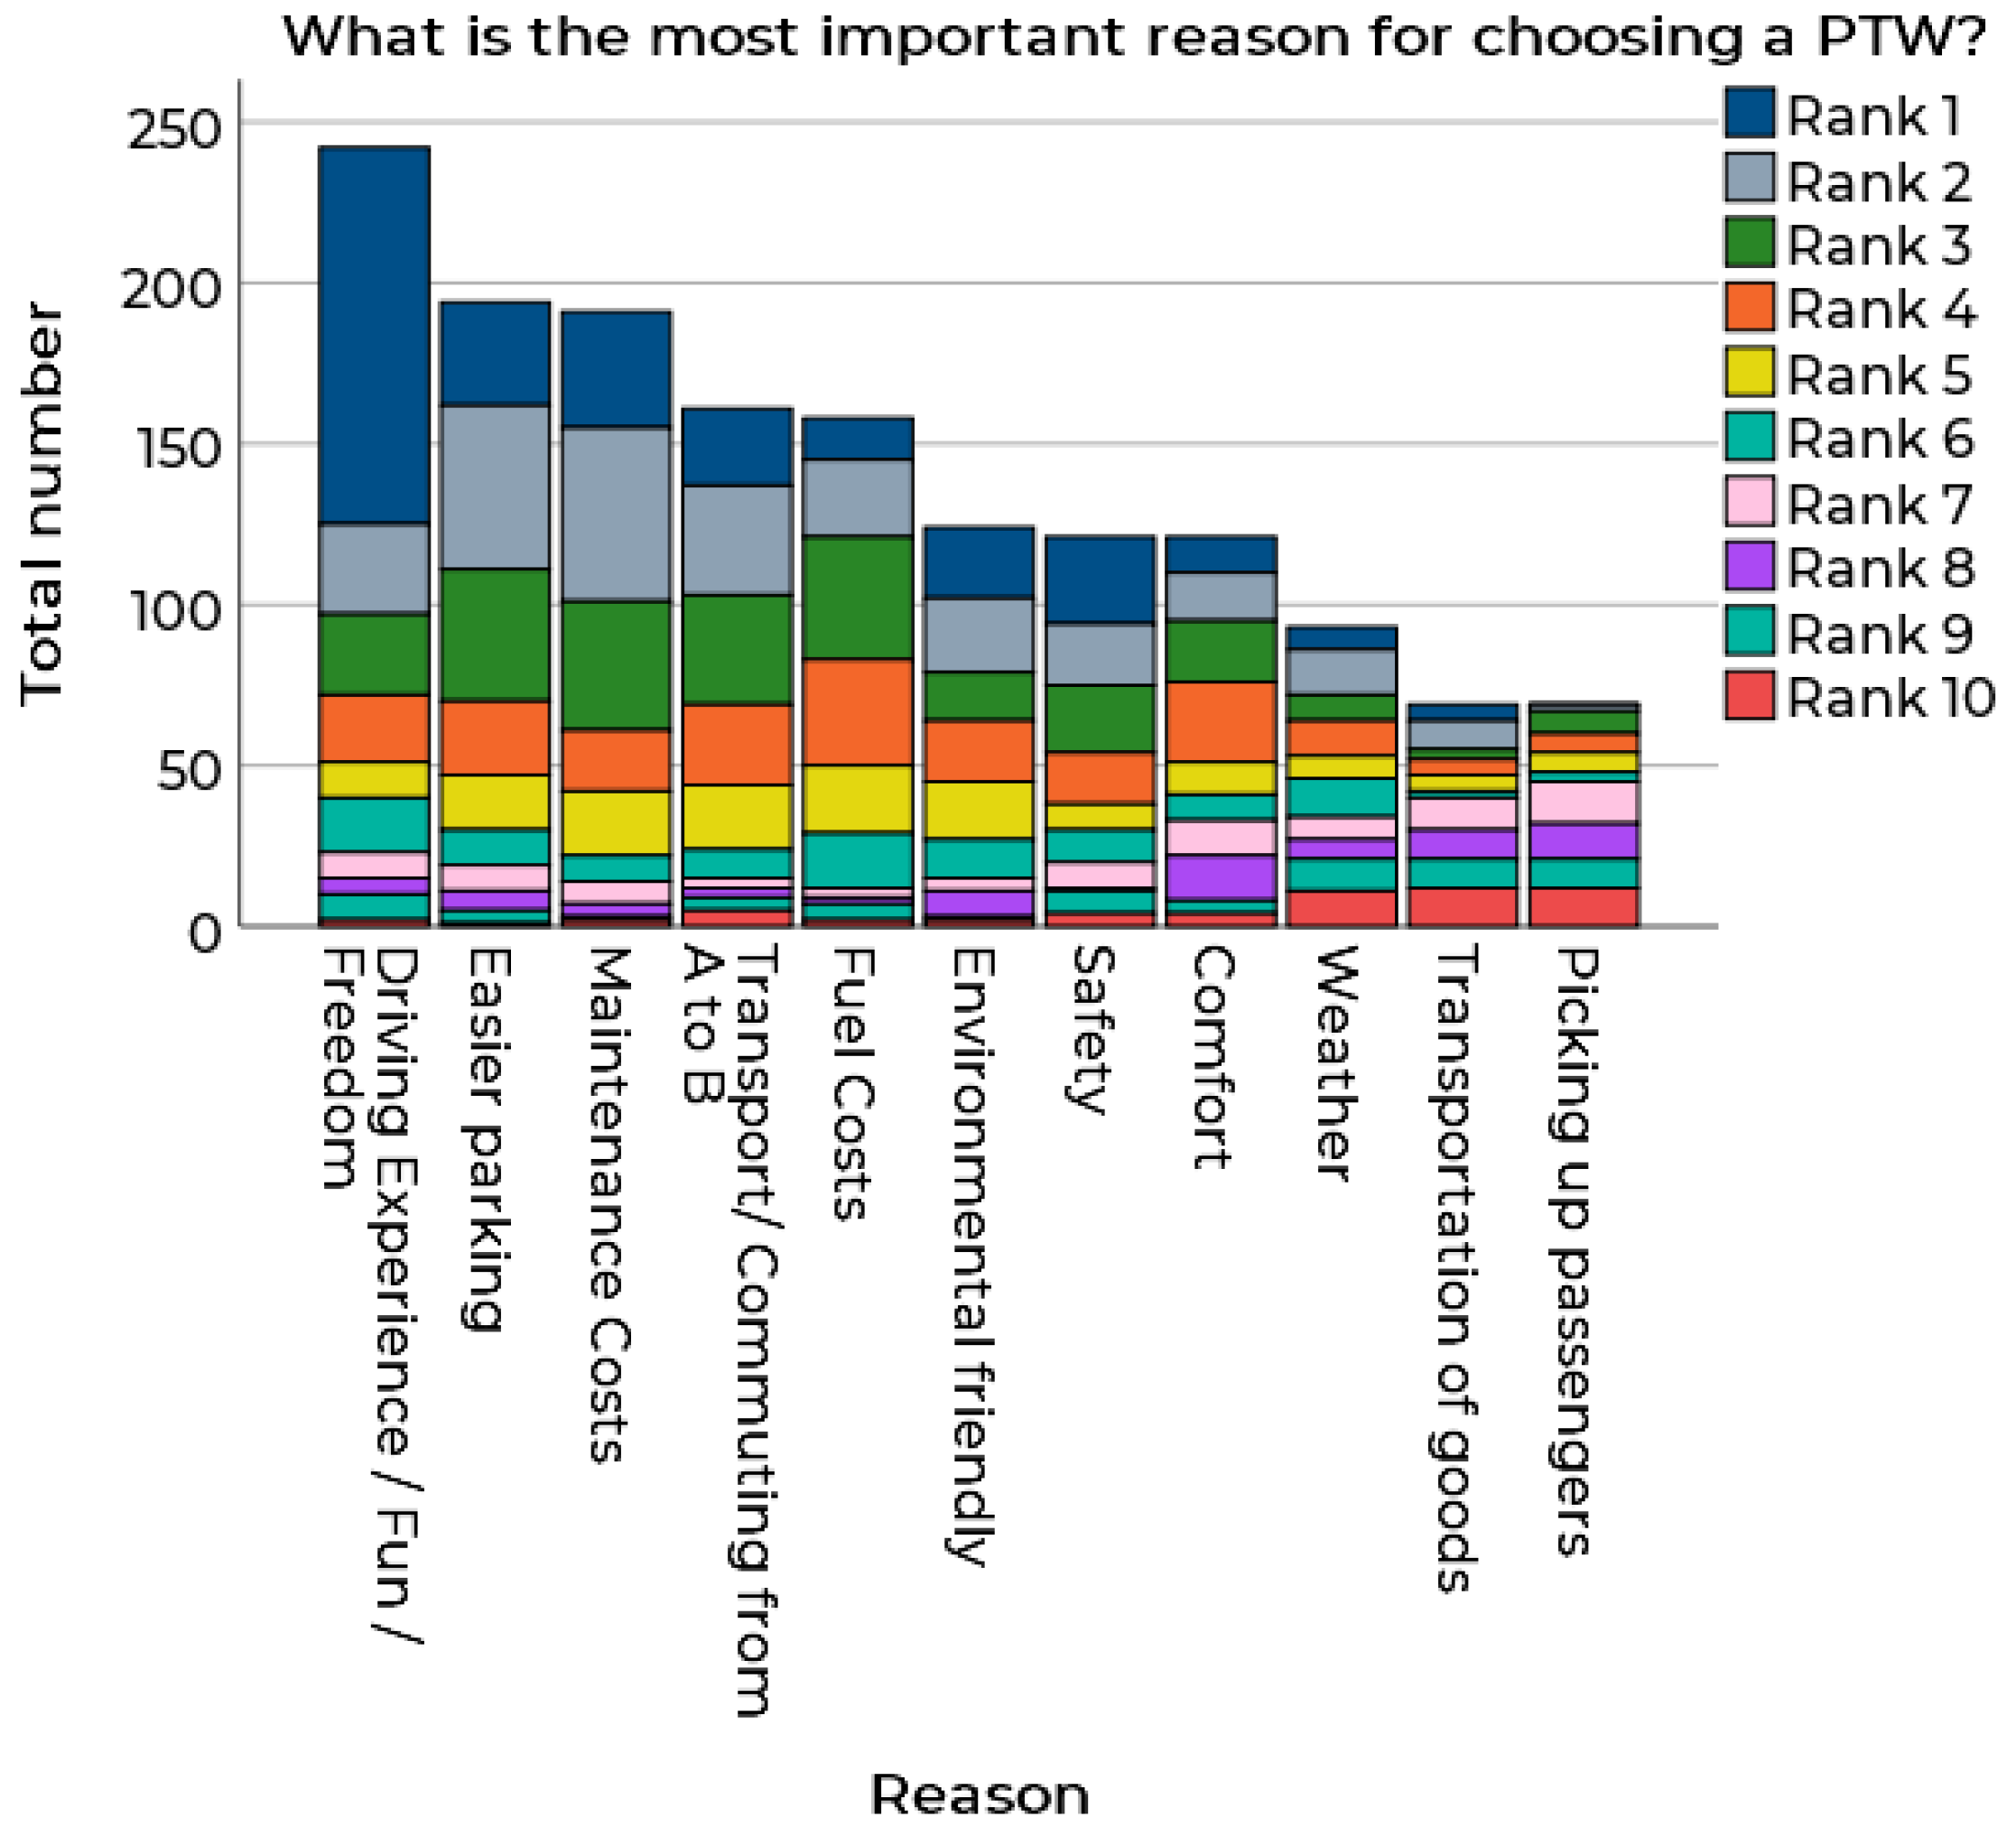
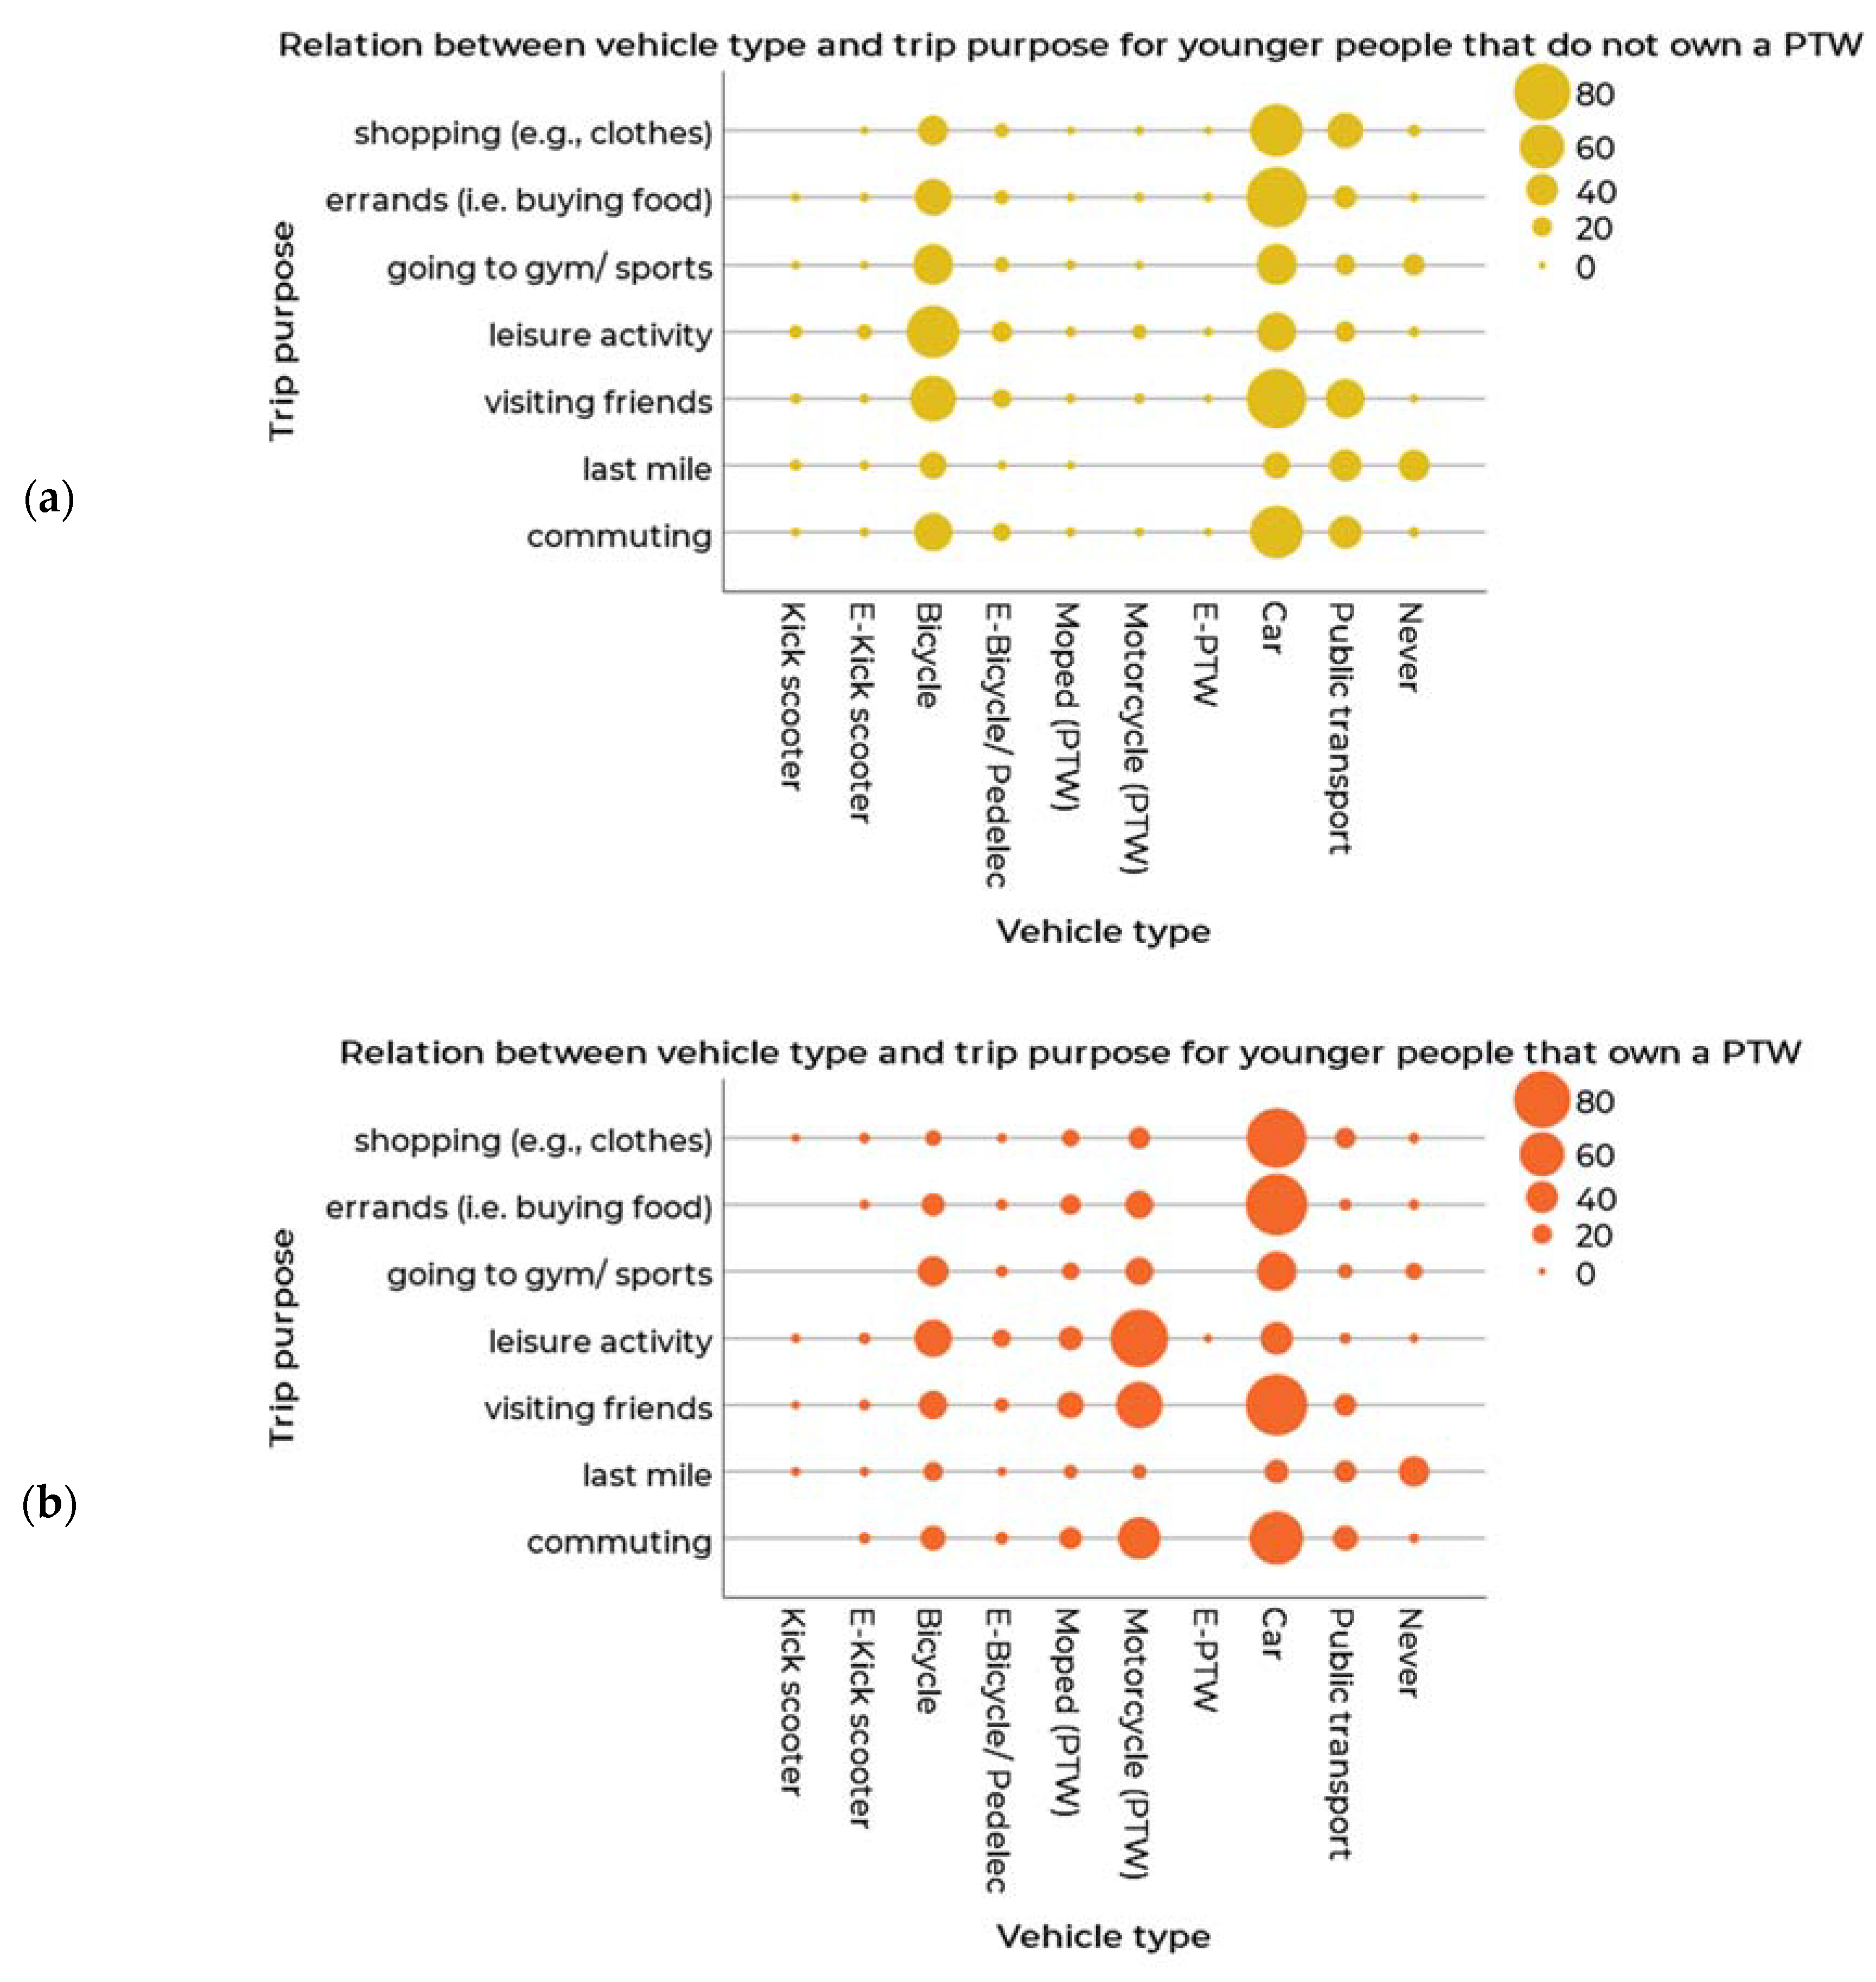
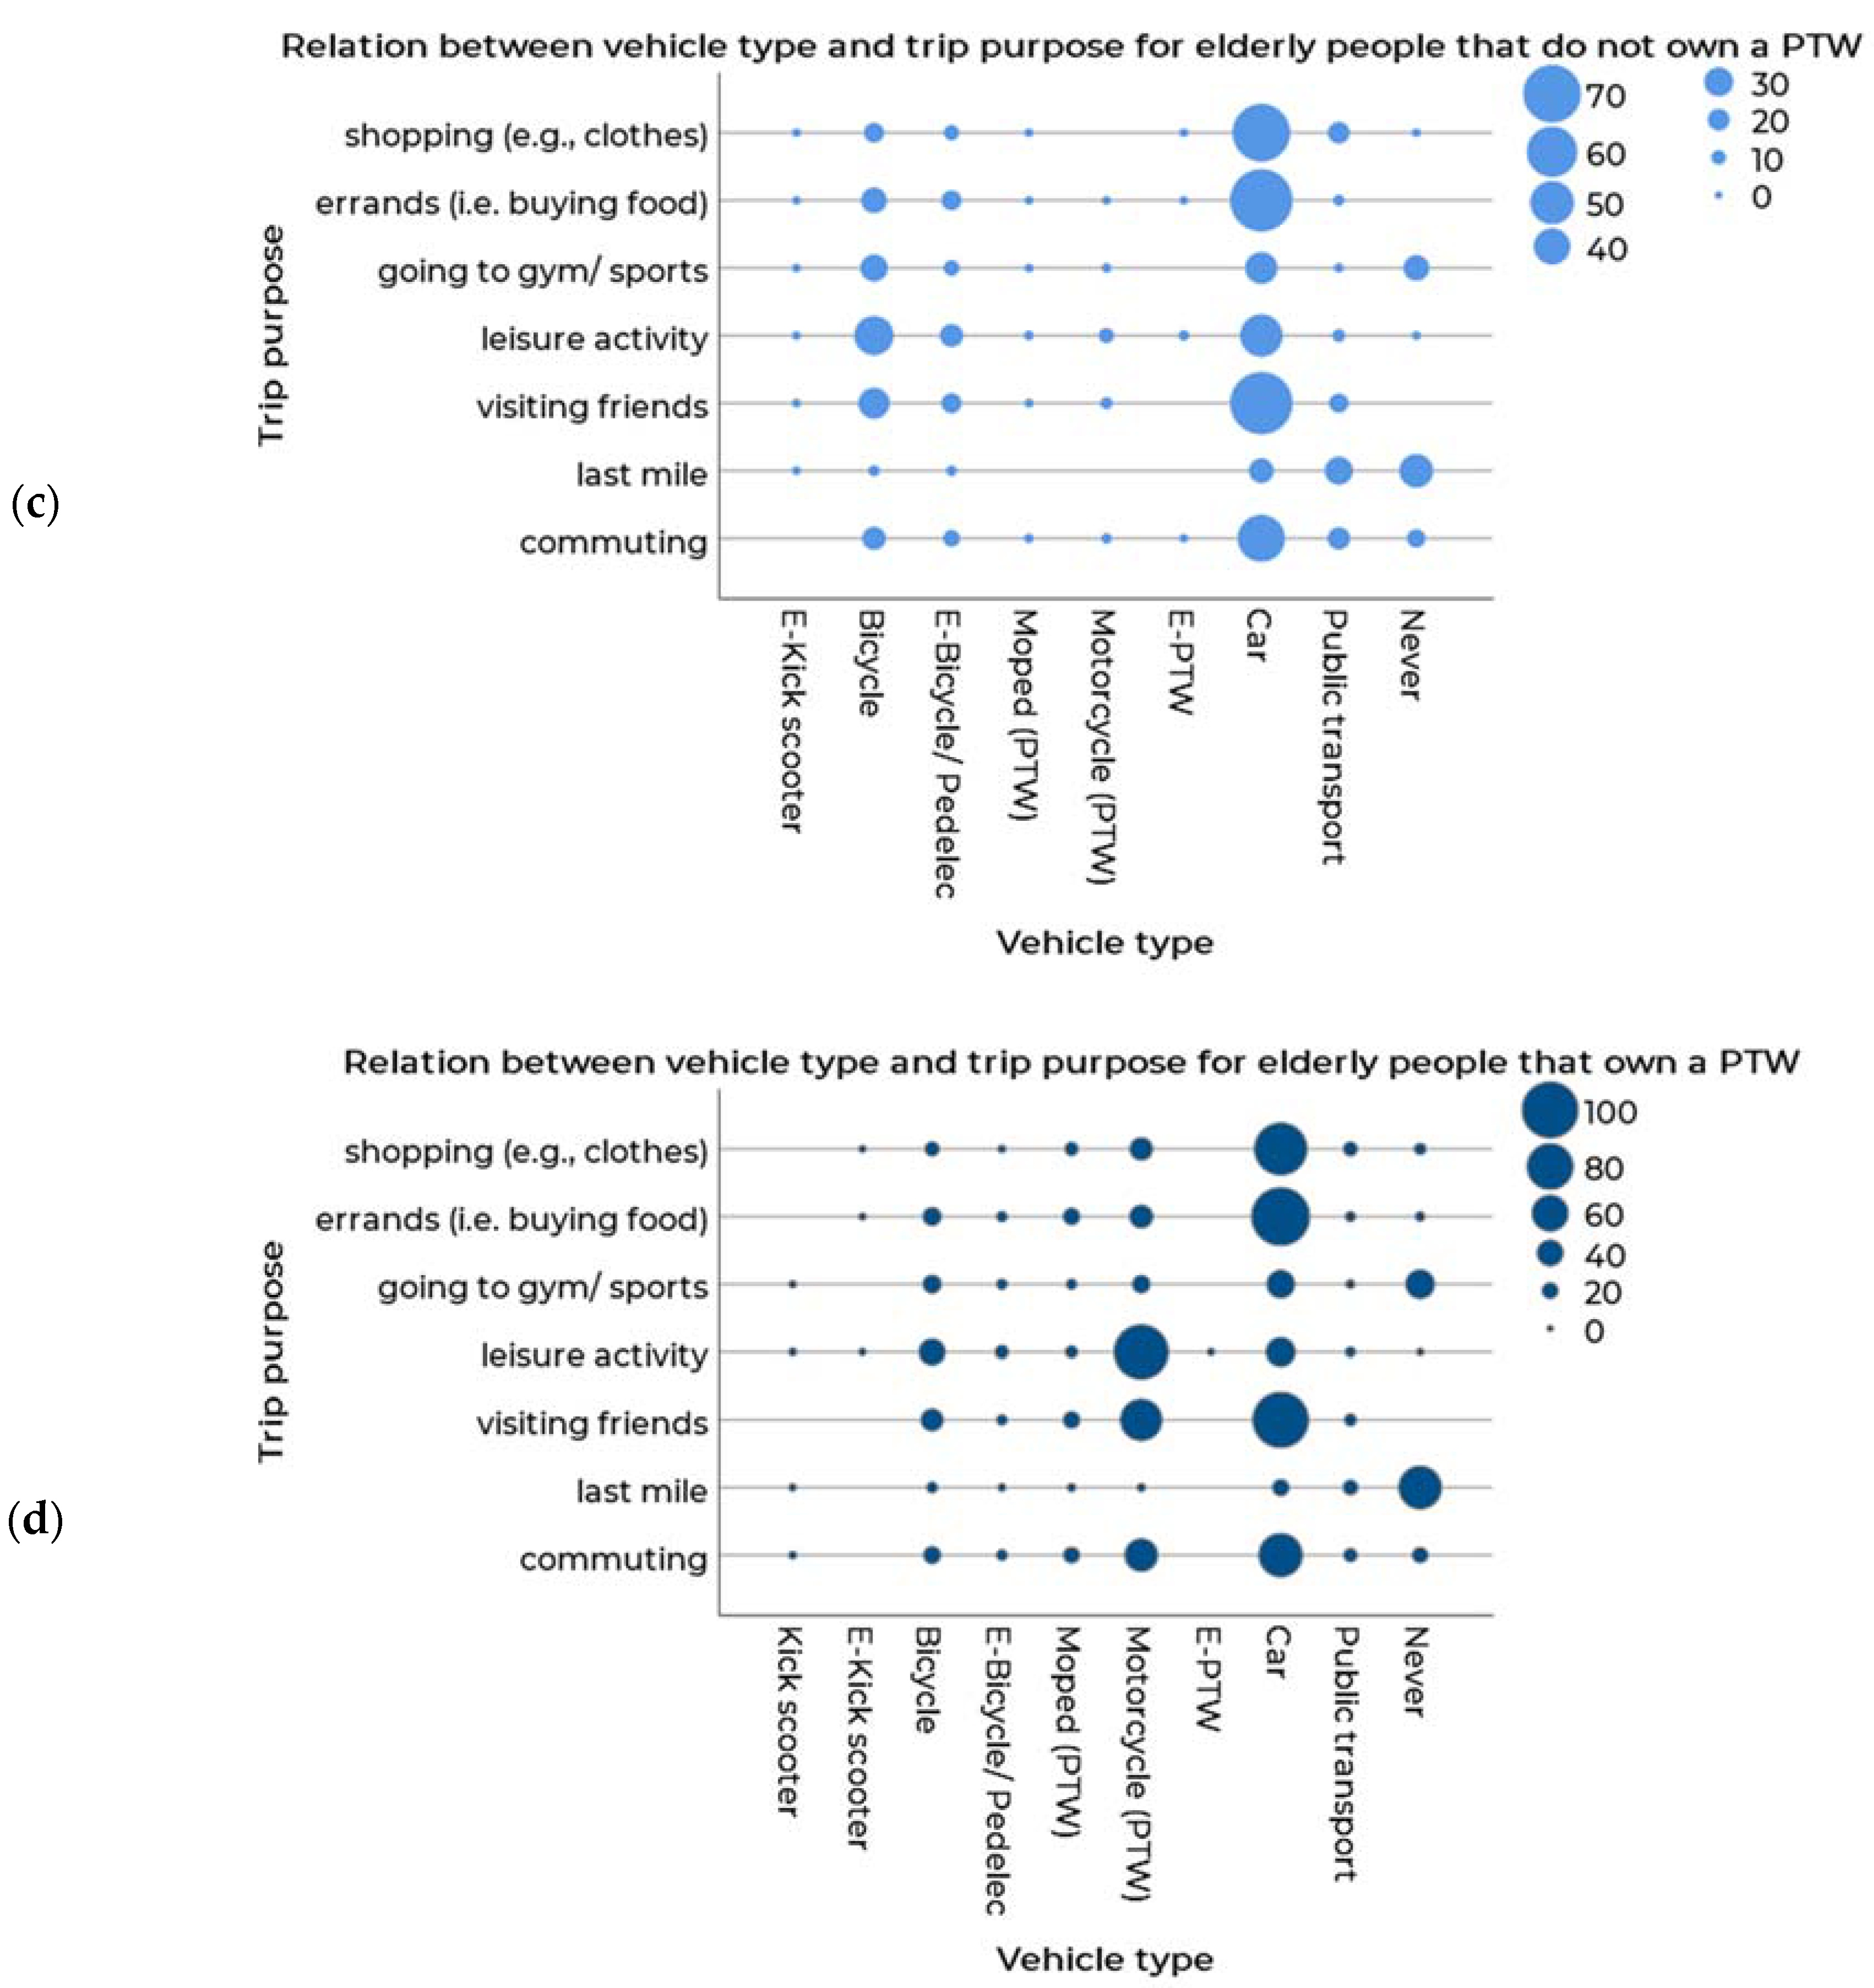
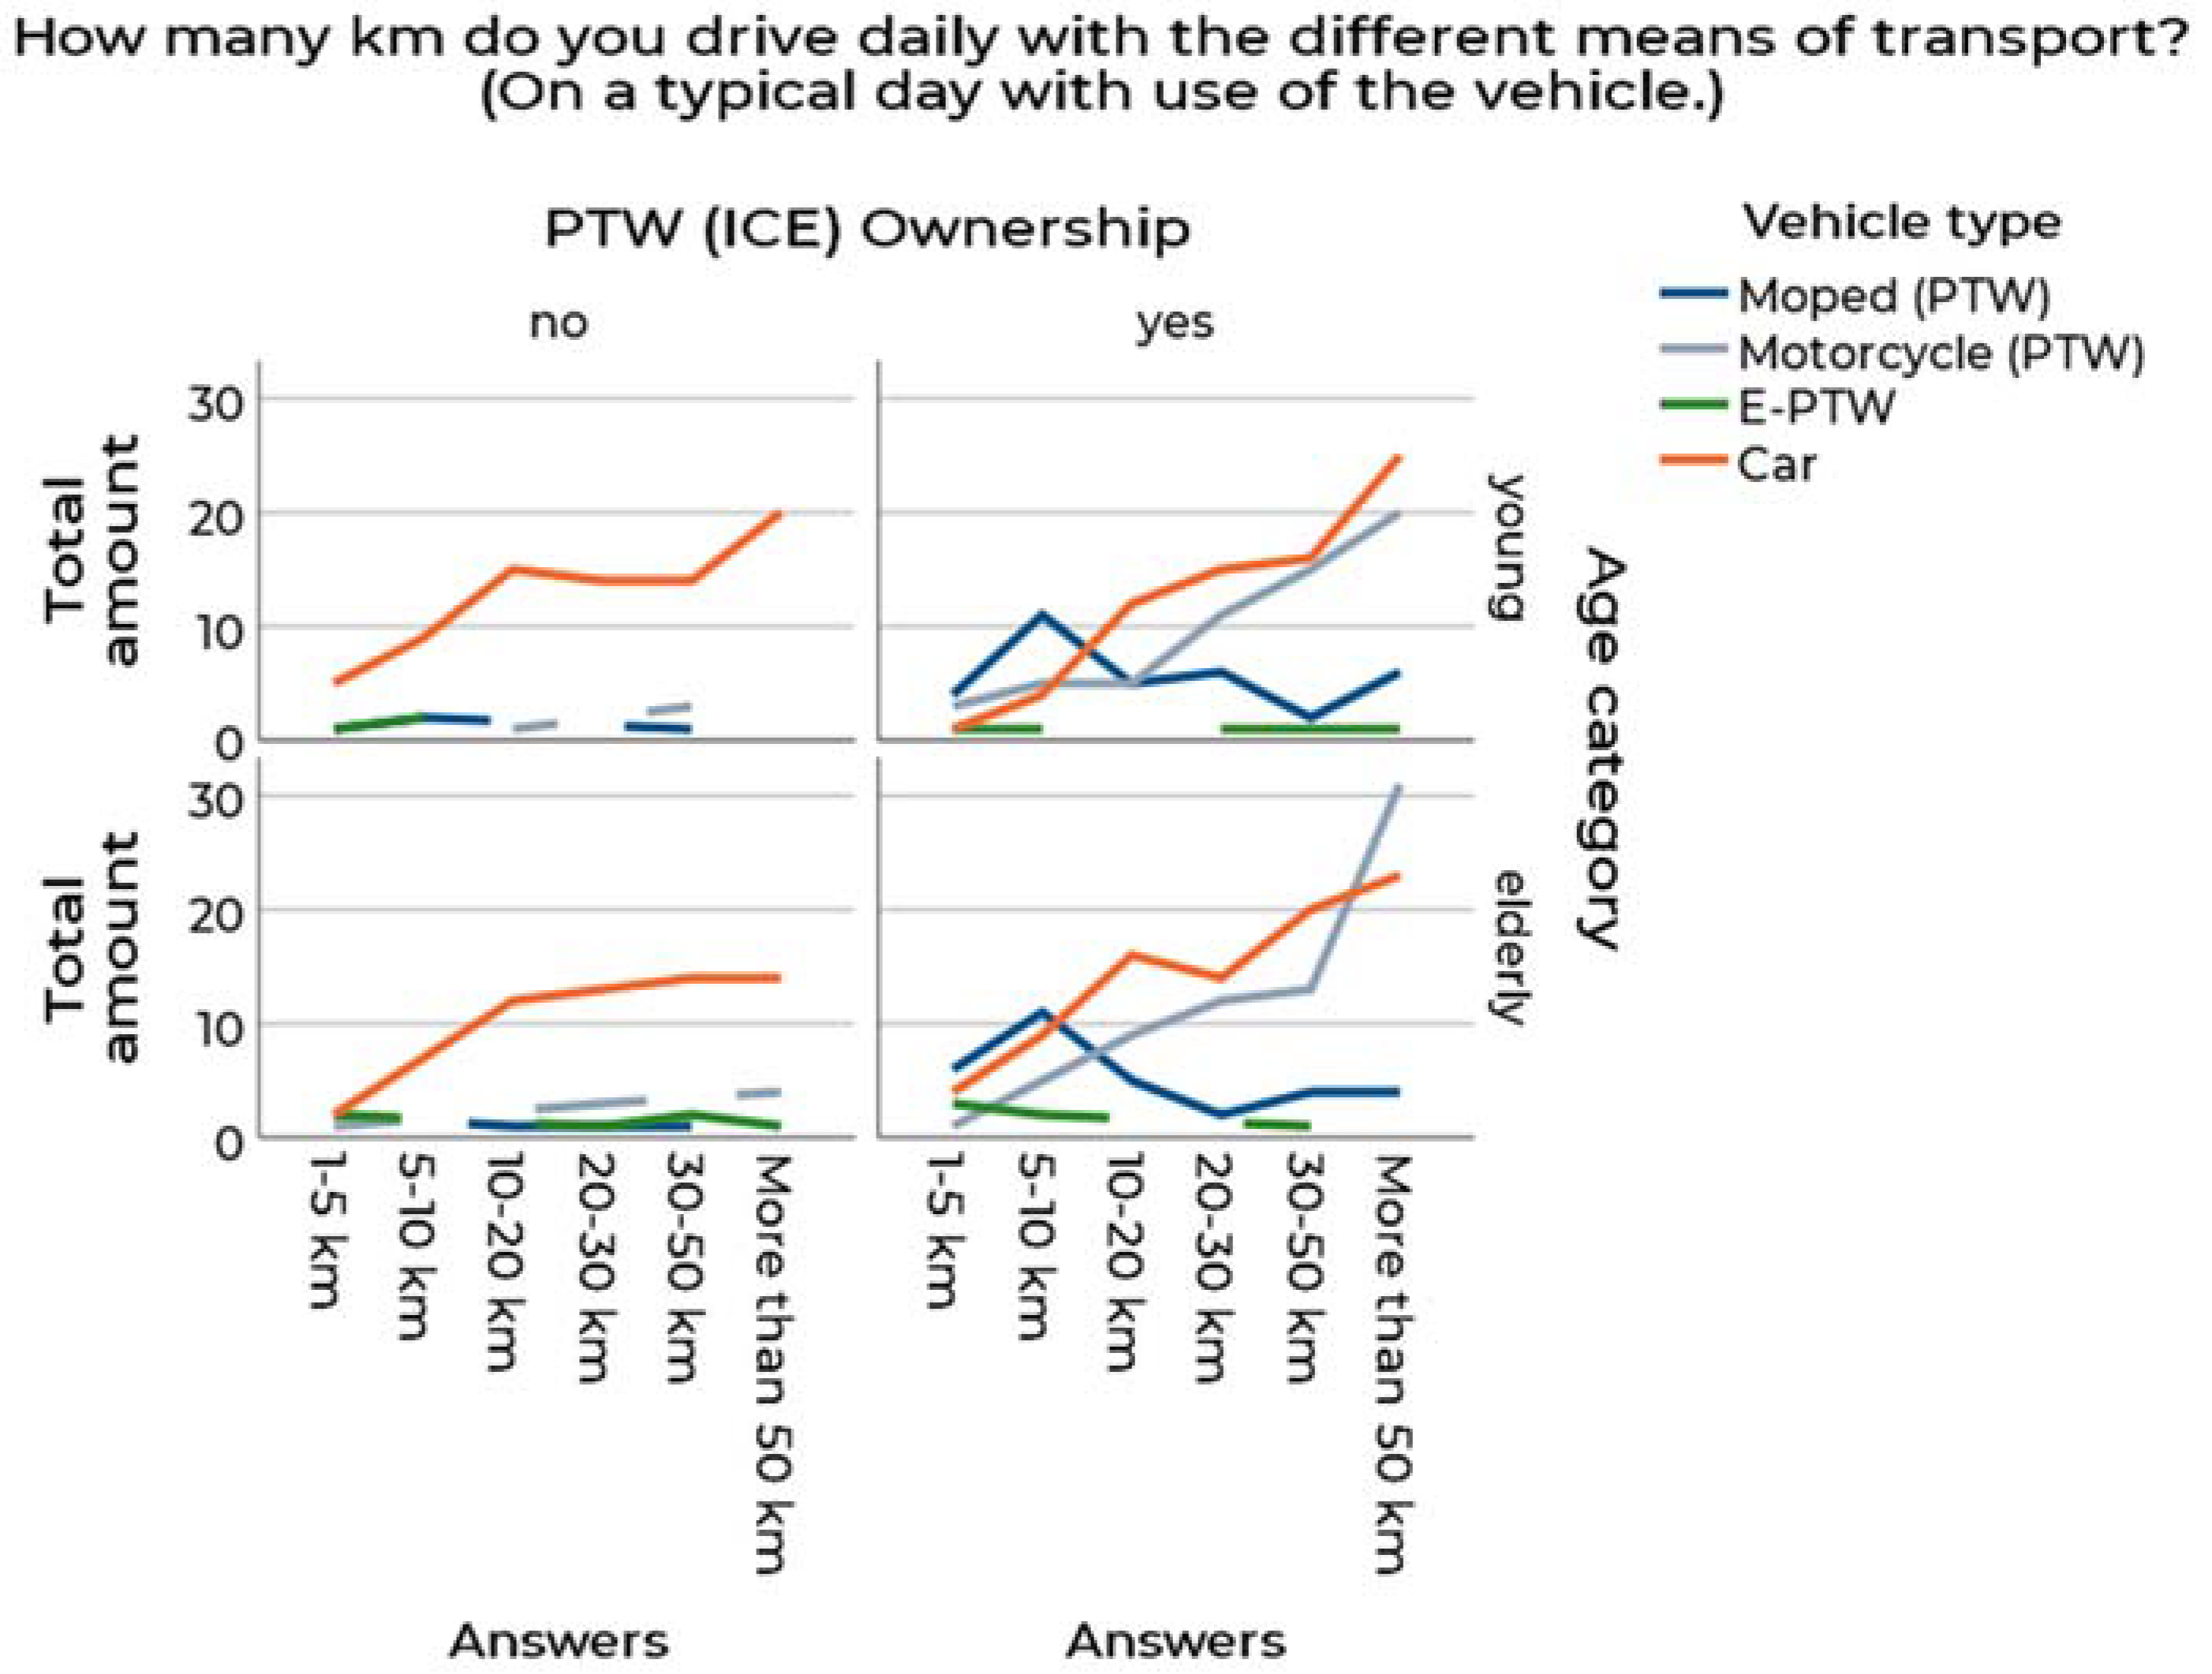
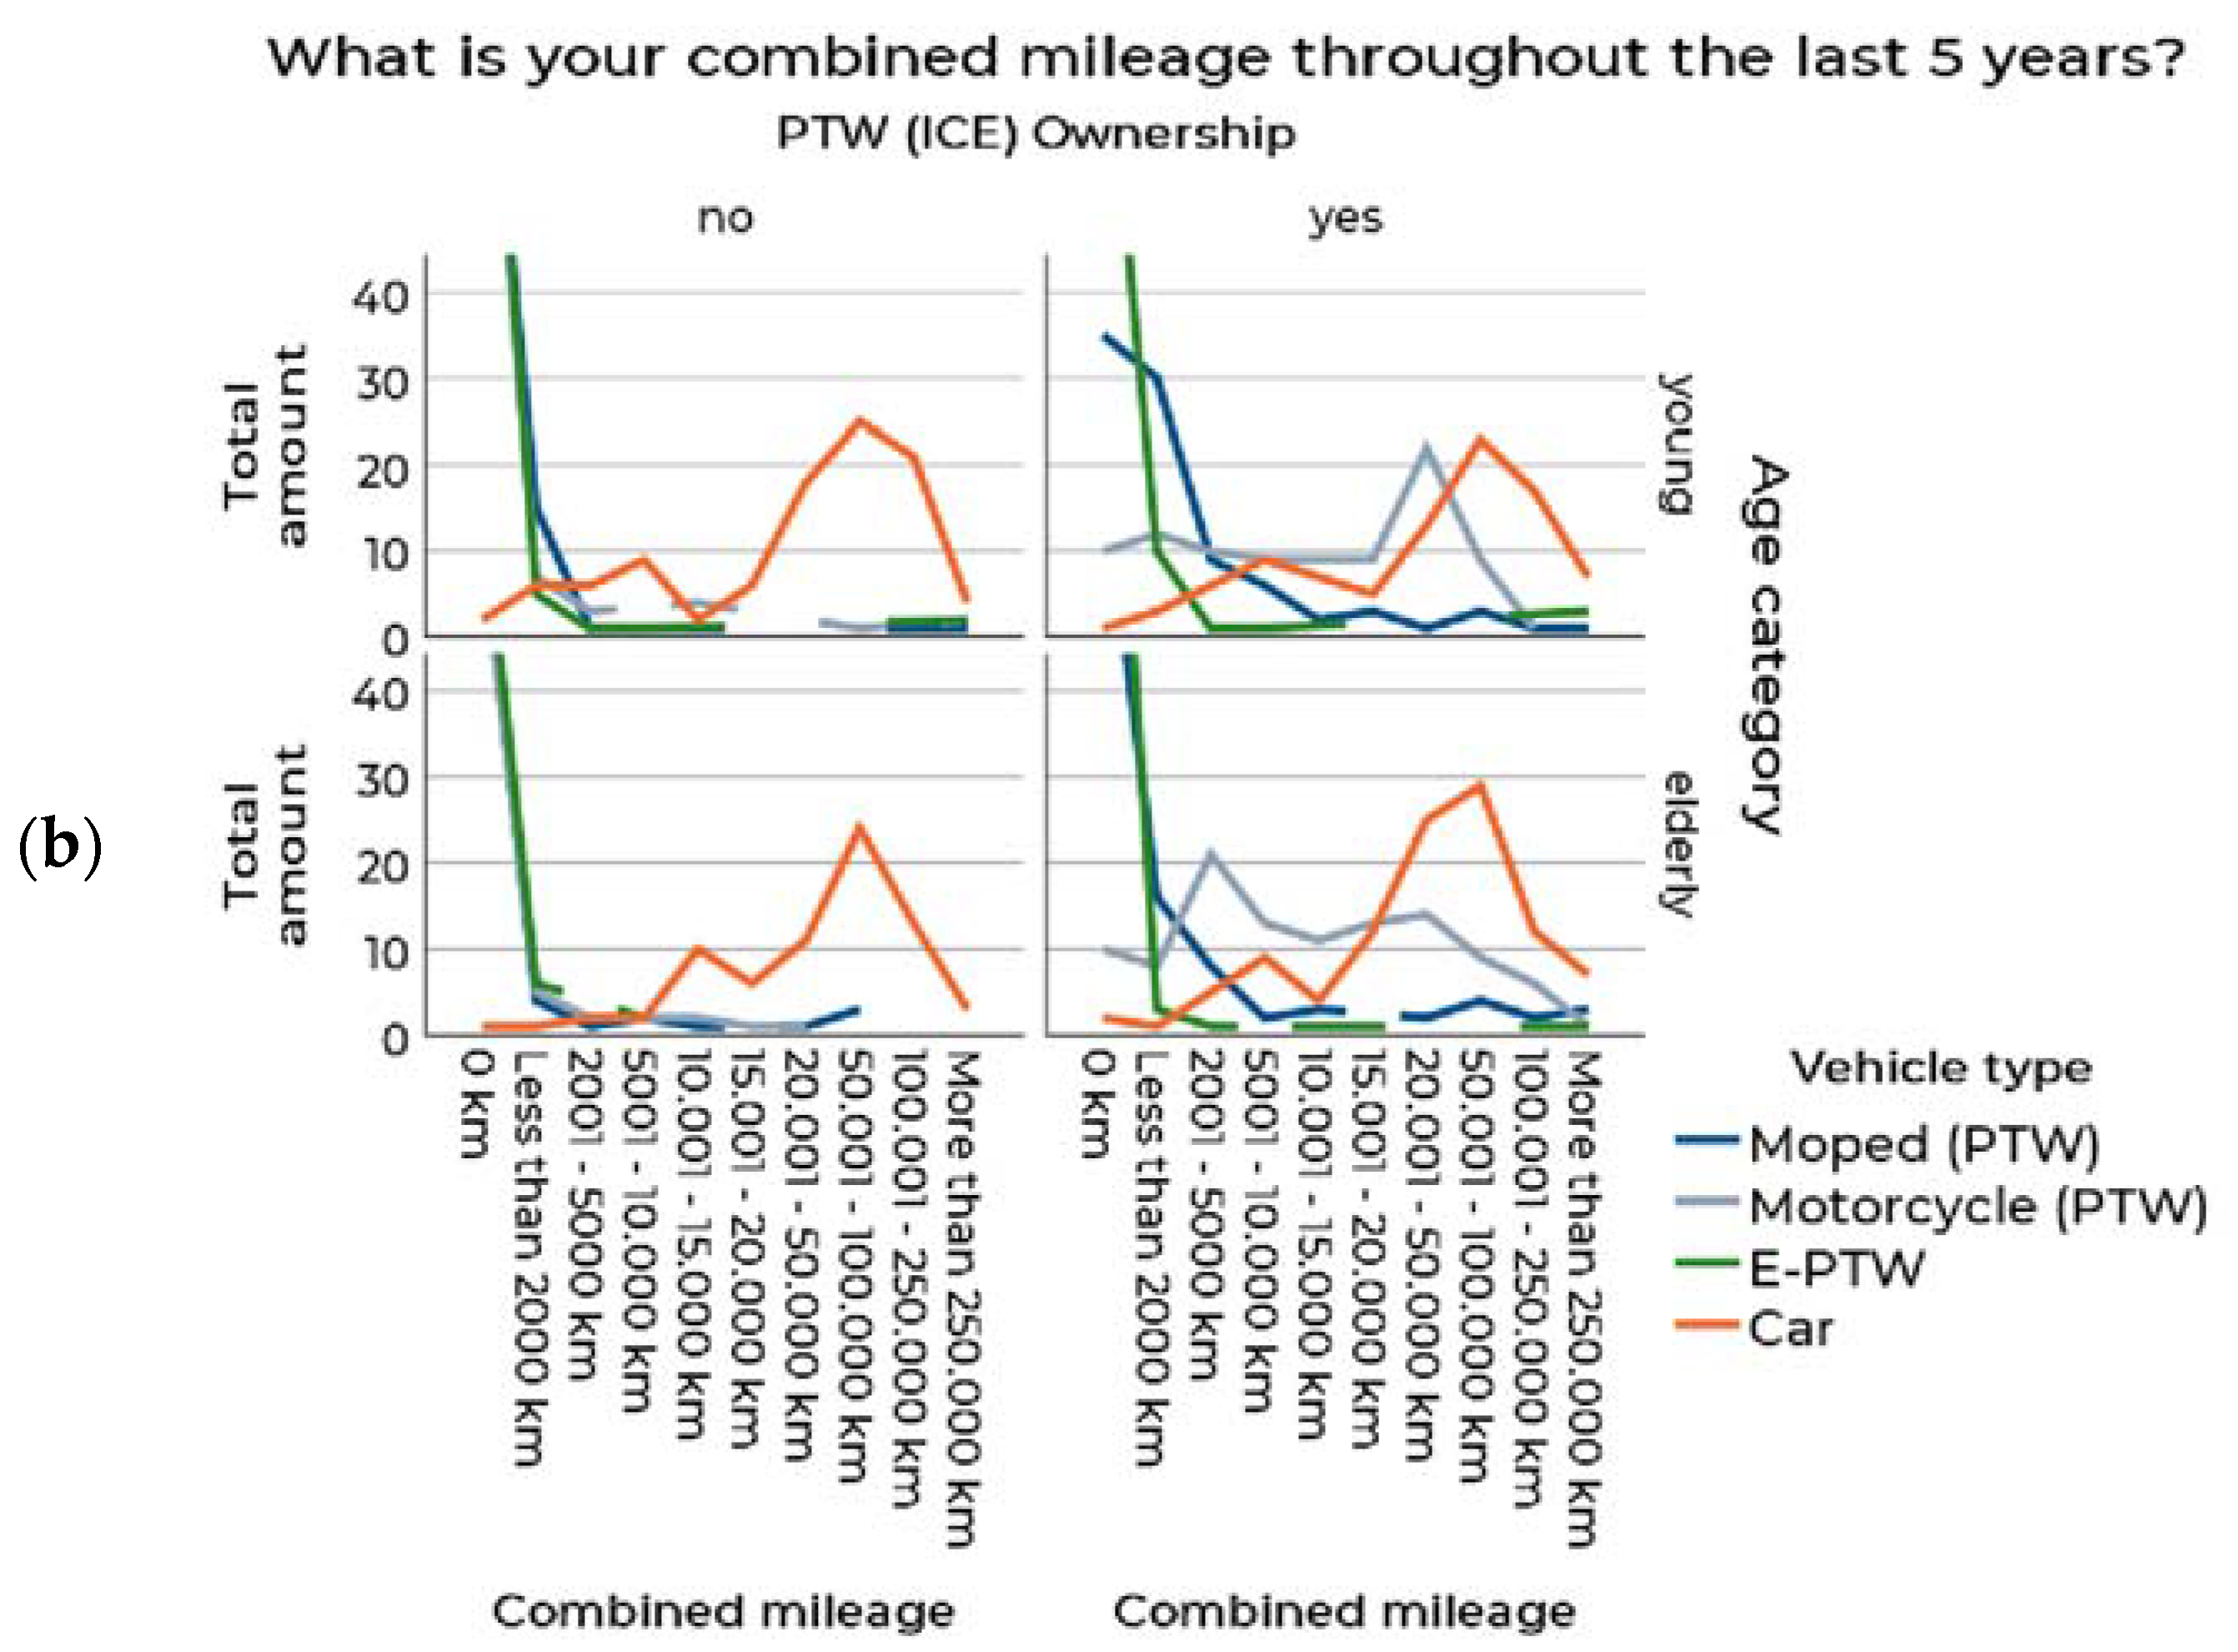
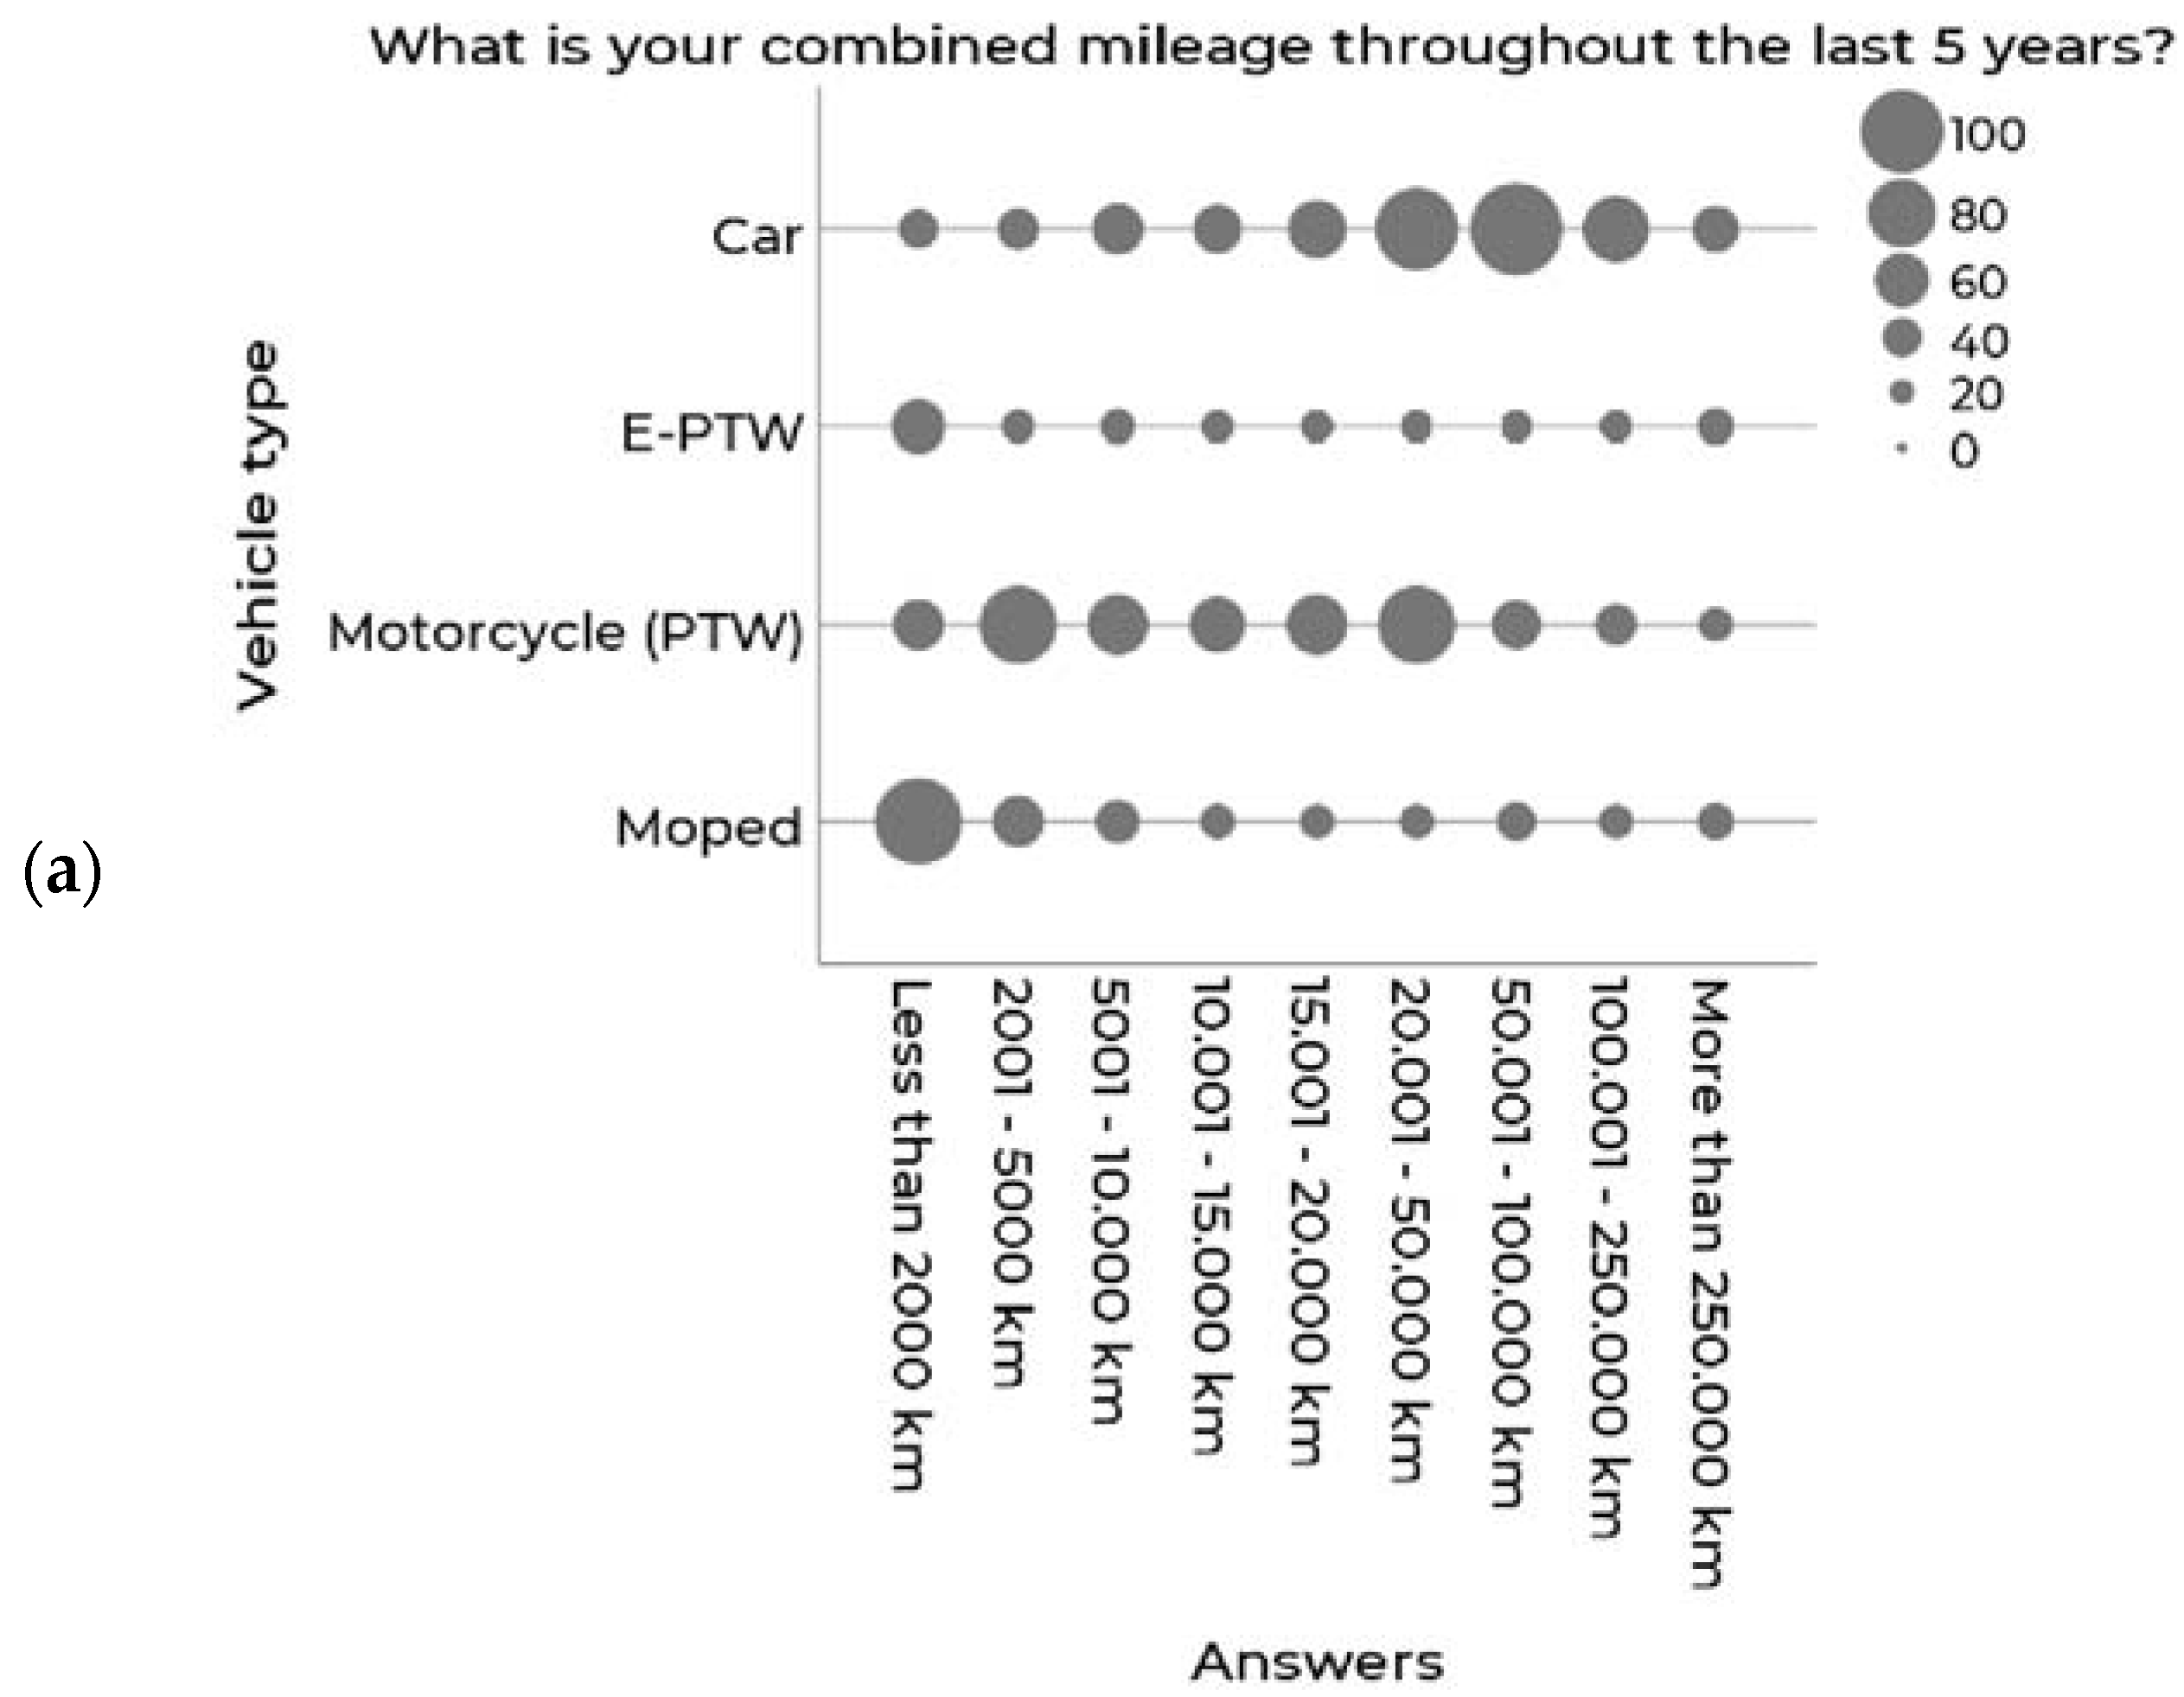
3.2. Mobility Patterns

The following section summarizes results on trip purposes and lengths. While n = 197 participants of the study own a PTW with internal combustion engine (ICE), just two persons own an E-PTW. In both cases, it was a KTM Freeride. The most important reason to own or choose a PTW is the driving experience, i.e., experiencing fun and freedom (Figure 3). The second and third most important reasons are easier parking and lower maintenance costs. PTWs are not chosen when it comes to transporting passengers or goods.
The mobility patterns can be seen in Figure 4. Across all generations and regardless of the fact whether one owns a PTW, the car is the dominating vehicle for any trip purpose. People that own a PTW use it primarily for leisure purposes, to visit friends and for commuting. These purposes seem to be covered with trips by car and bicycle for people without their own PTW. The last mile scenario (changing between different means of transport) seems to be relatively unimportant for the participants, such that the mostly chosen answer was “never” for all participants. Across all trip purposes, the bicycle plays an important role. This holds especially true for younger people that do not own a PTW.
In addition, for the identification of user needs in individual powered transport, it is necessary to analyze the trip lengths. Figure 5 provides more detailed insights separated for age groups and PTW ownership. Once again, there is no clear pattern proving younger people have different day trip lengths than elderly people. Regarding PTWs, mopeds have shorter typical day trip lengths than motorcycles. The category “5–10 km” was chosen most often. Some participants state to ride more than 50 km on a daily basis with a moped. For motorcycles, this category with more than 50 km per day dominates, which is comparable to passenger car use. Given the rather low amount of data per category, the analysis of E-PTW patterns is not reasonable.
The combined mileage throughout the last five years varies significantly among all participants (Figure 6a). The mode category for cars is 50.001–100.000 km in the last five years. Motorcycles have more of a bimodal distribution with one maximum lying between 2001–5000 km and a second one between 20.001–50.000 km. Details can be found in Figure 6b on the right side.
If a moped was available, mopeds are mainly driven up to 5000 km in five years. This pattern is independent of rider age. In contrast, younger motorcyclists’ mileage has a peak at 20.001–50.000 km in five years. Elderly motorcyclists show this peak value in the 2001–5000 km category.

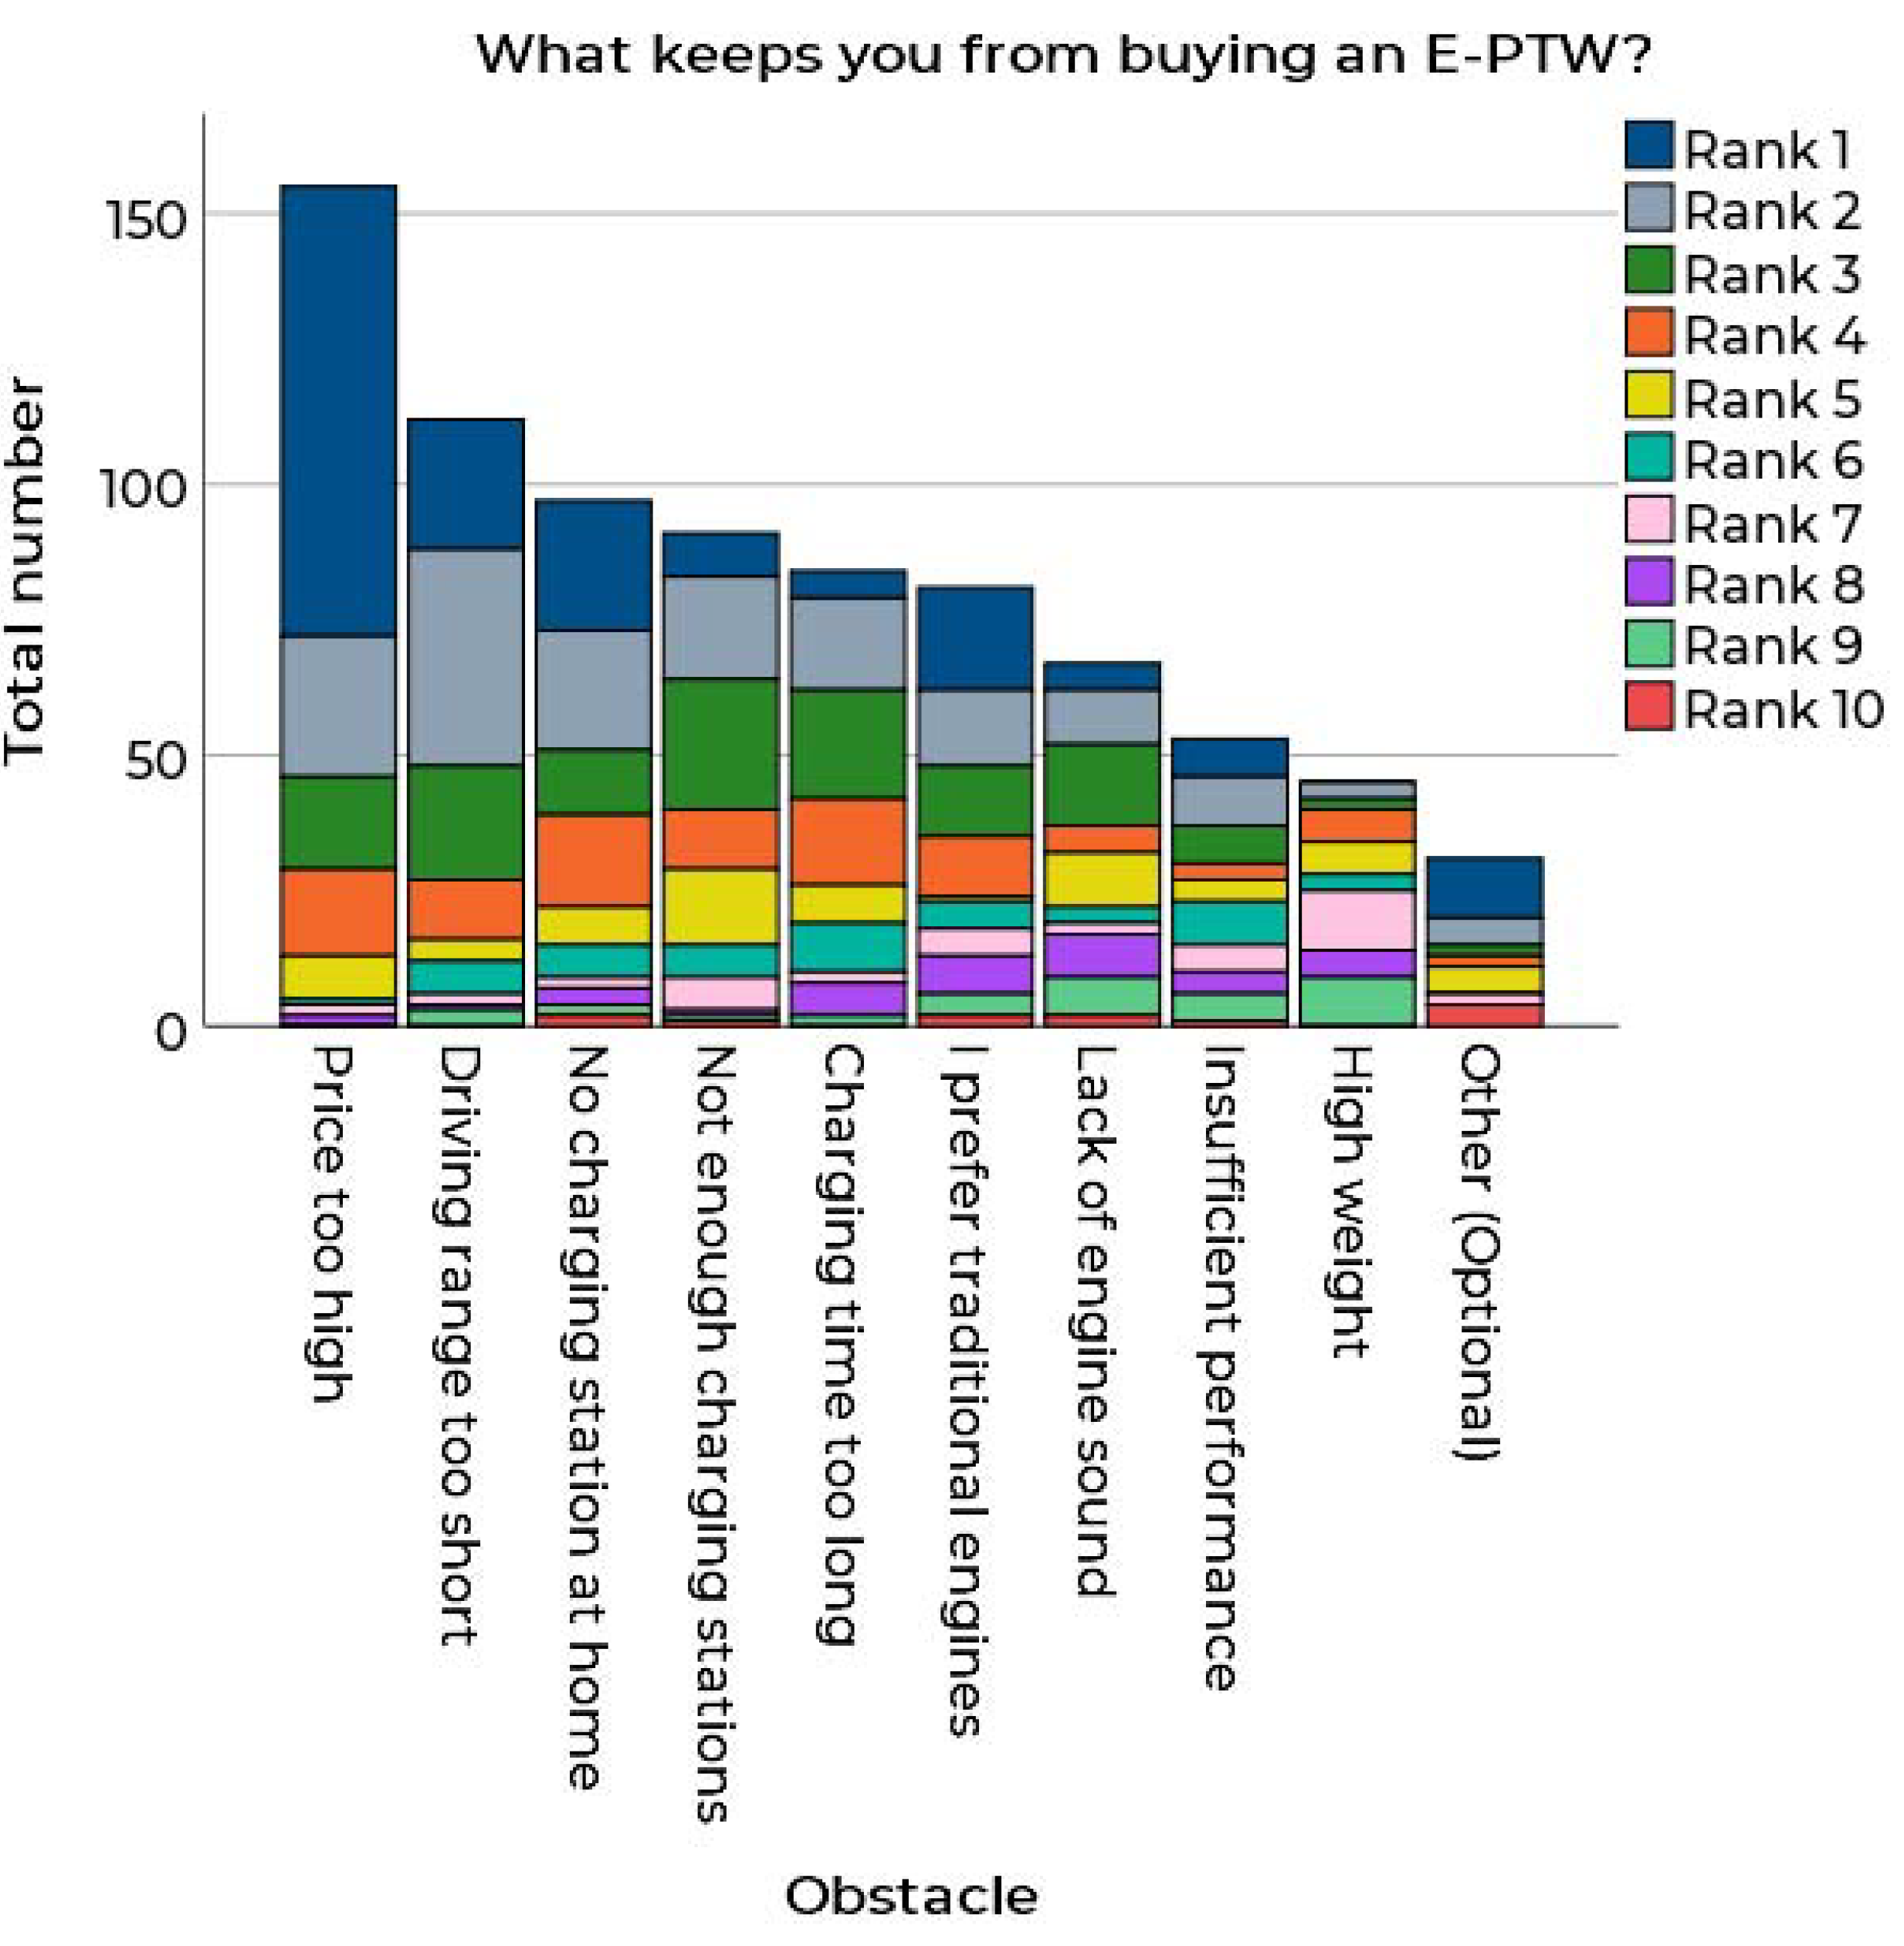
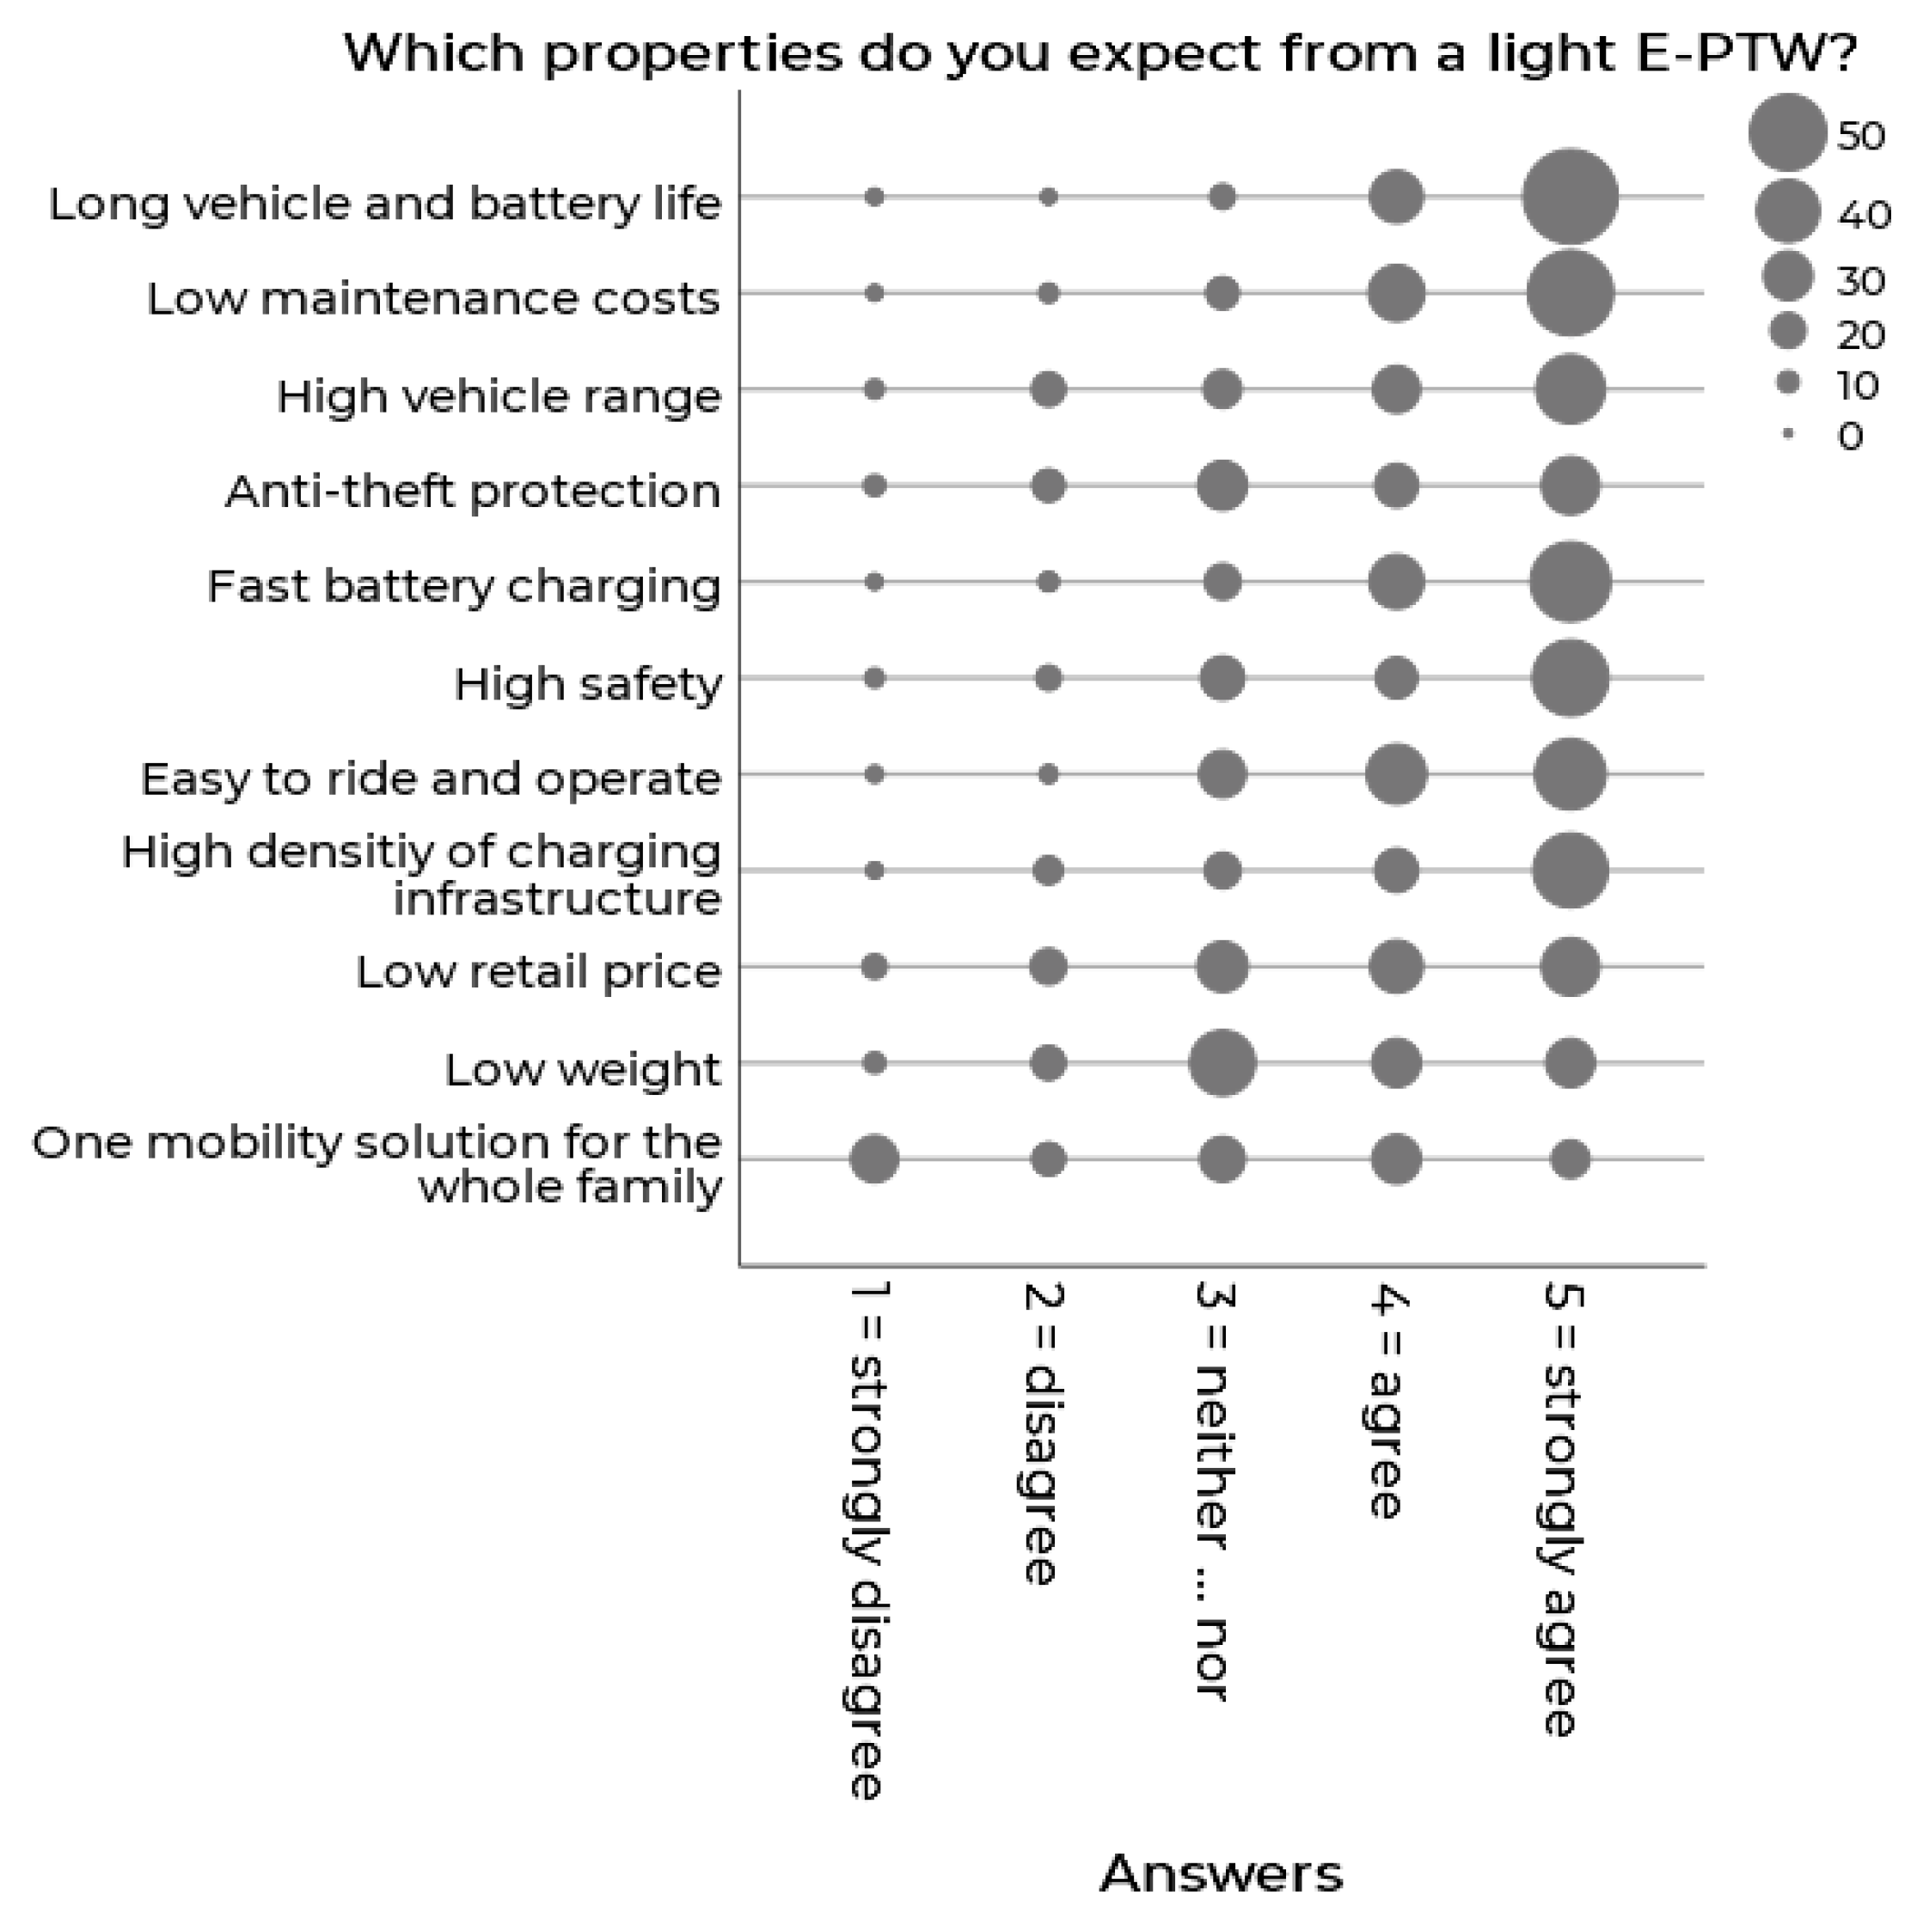
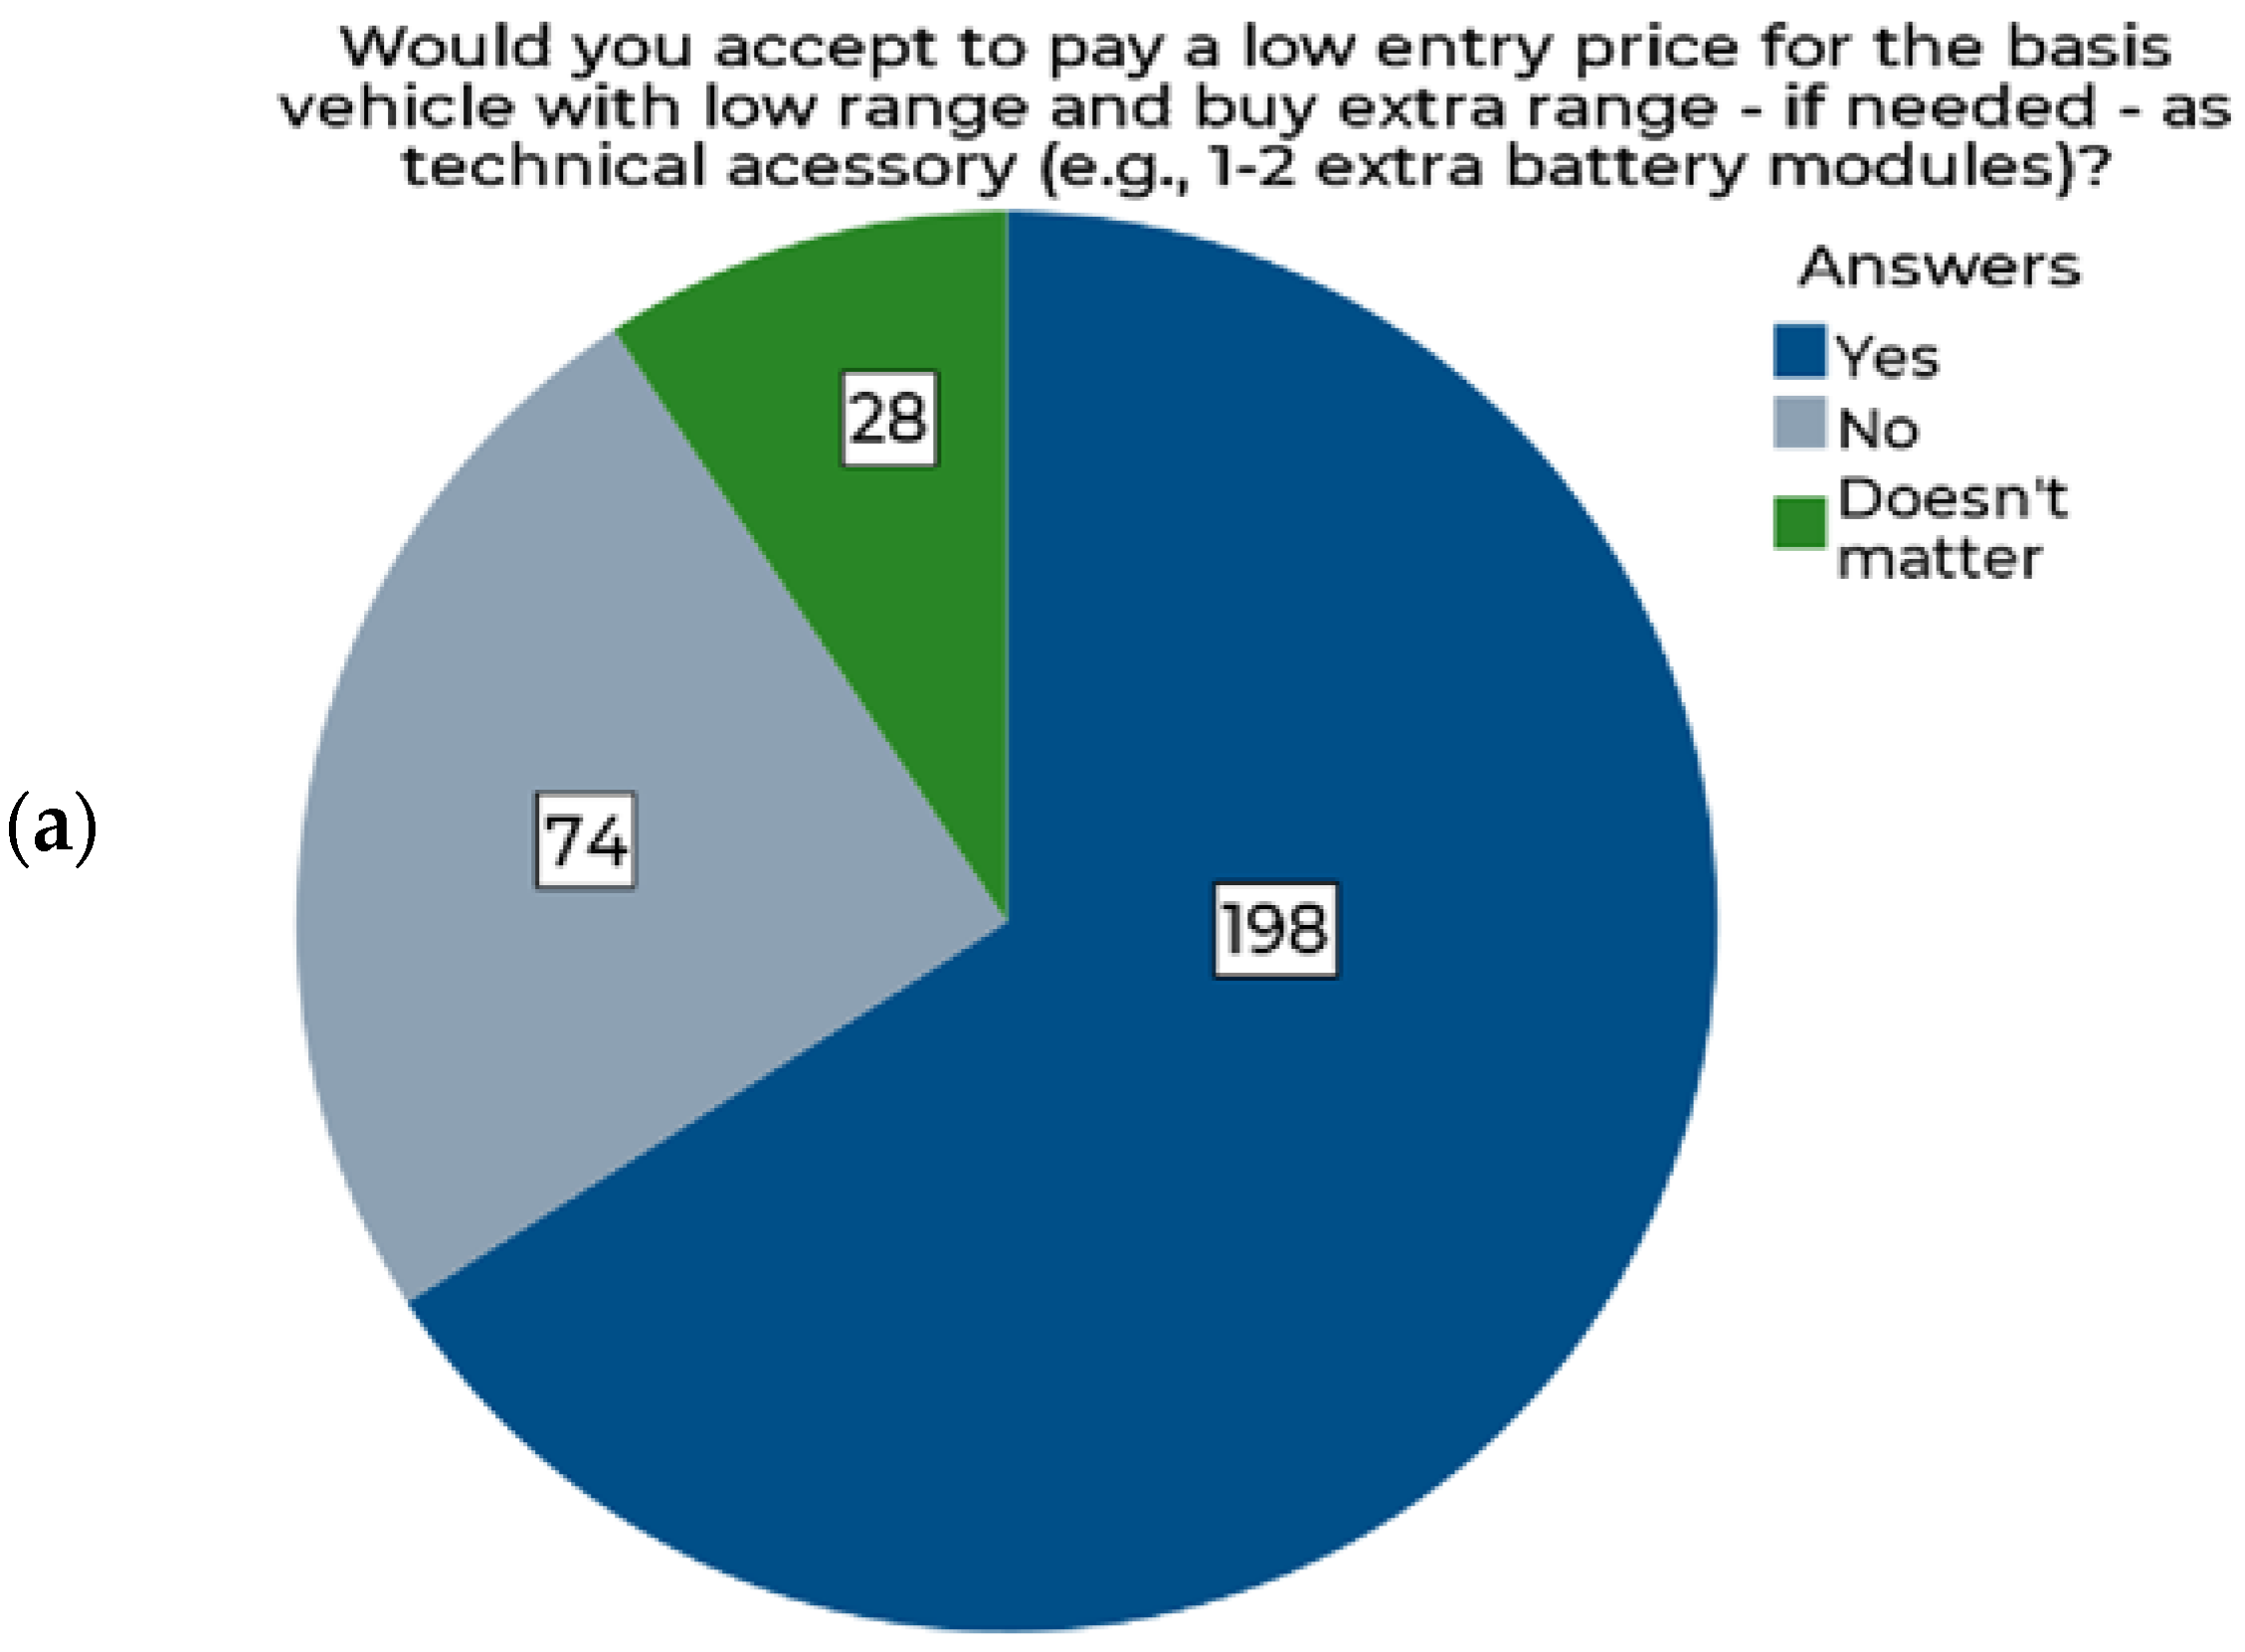
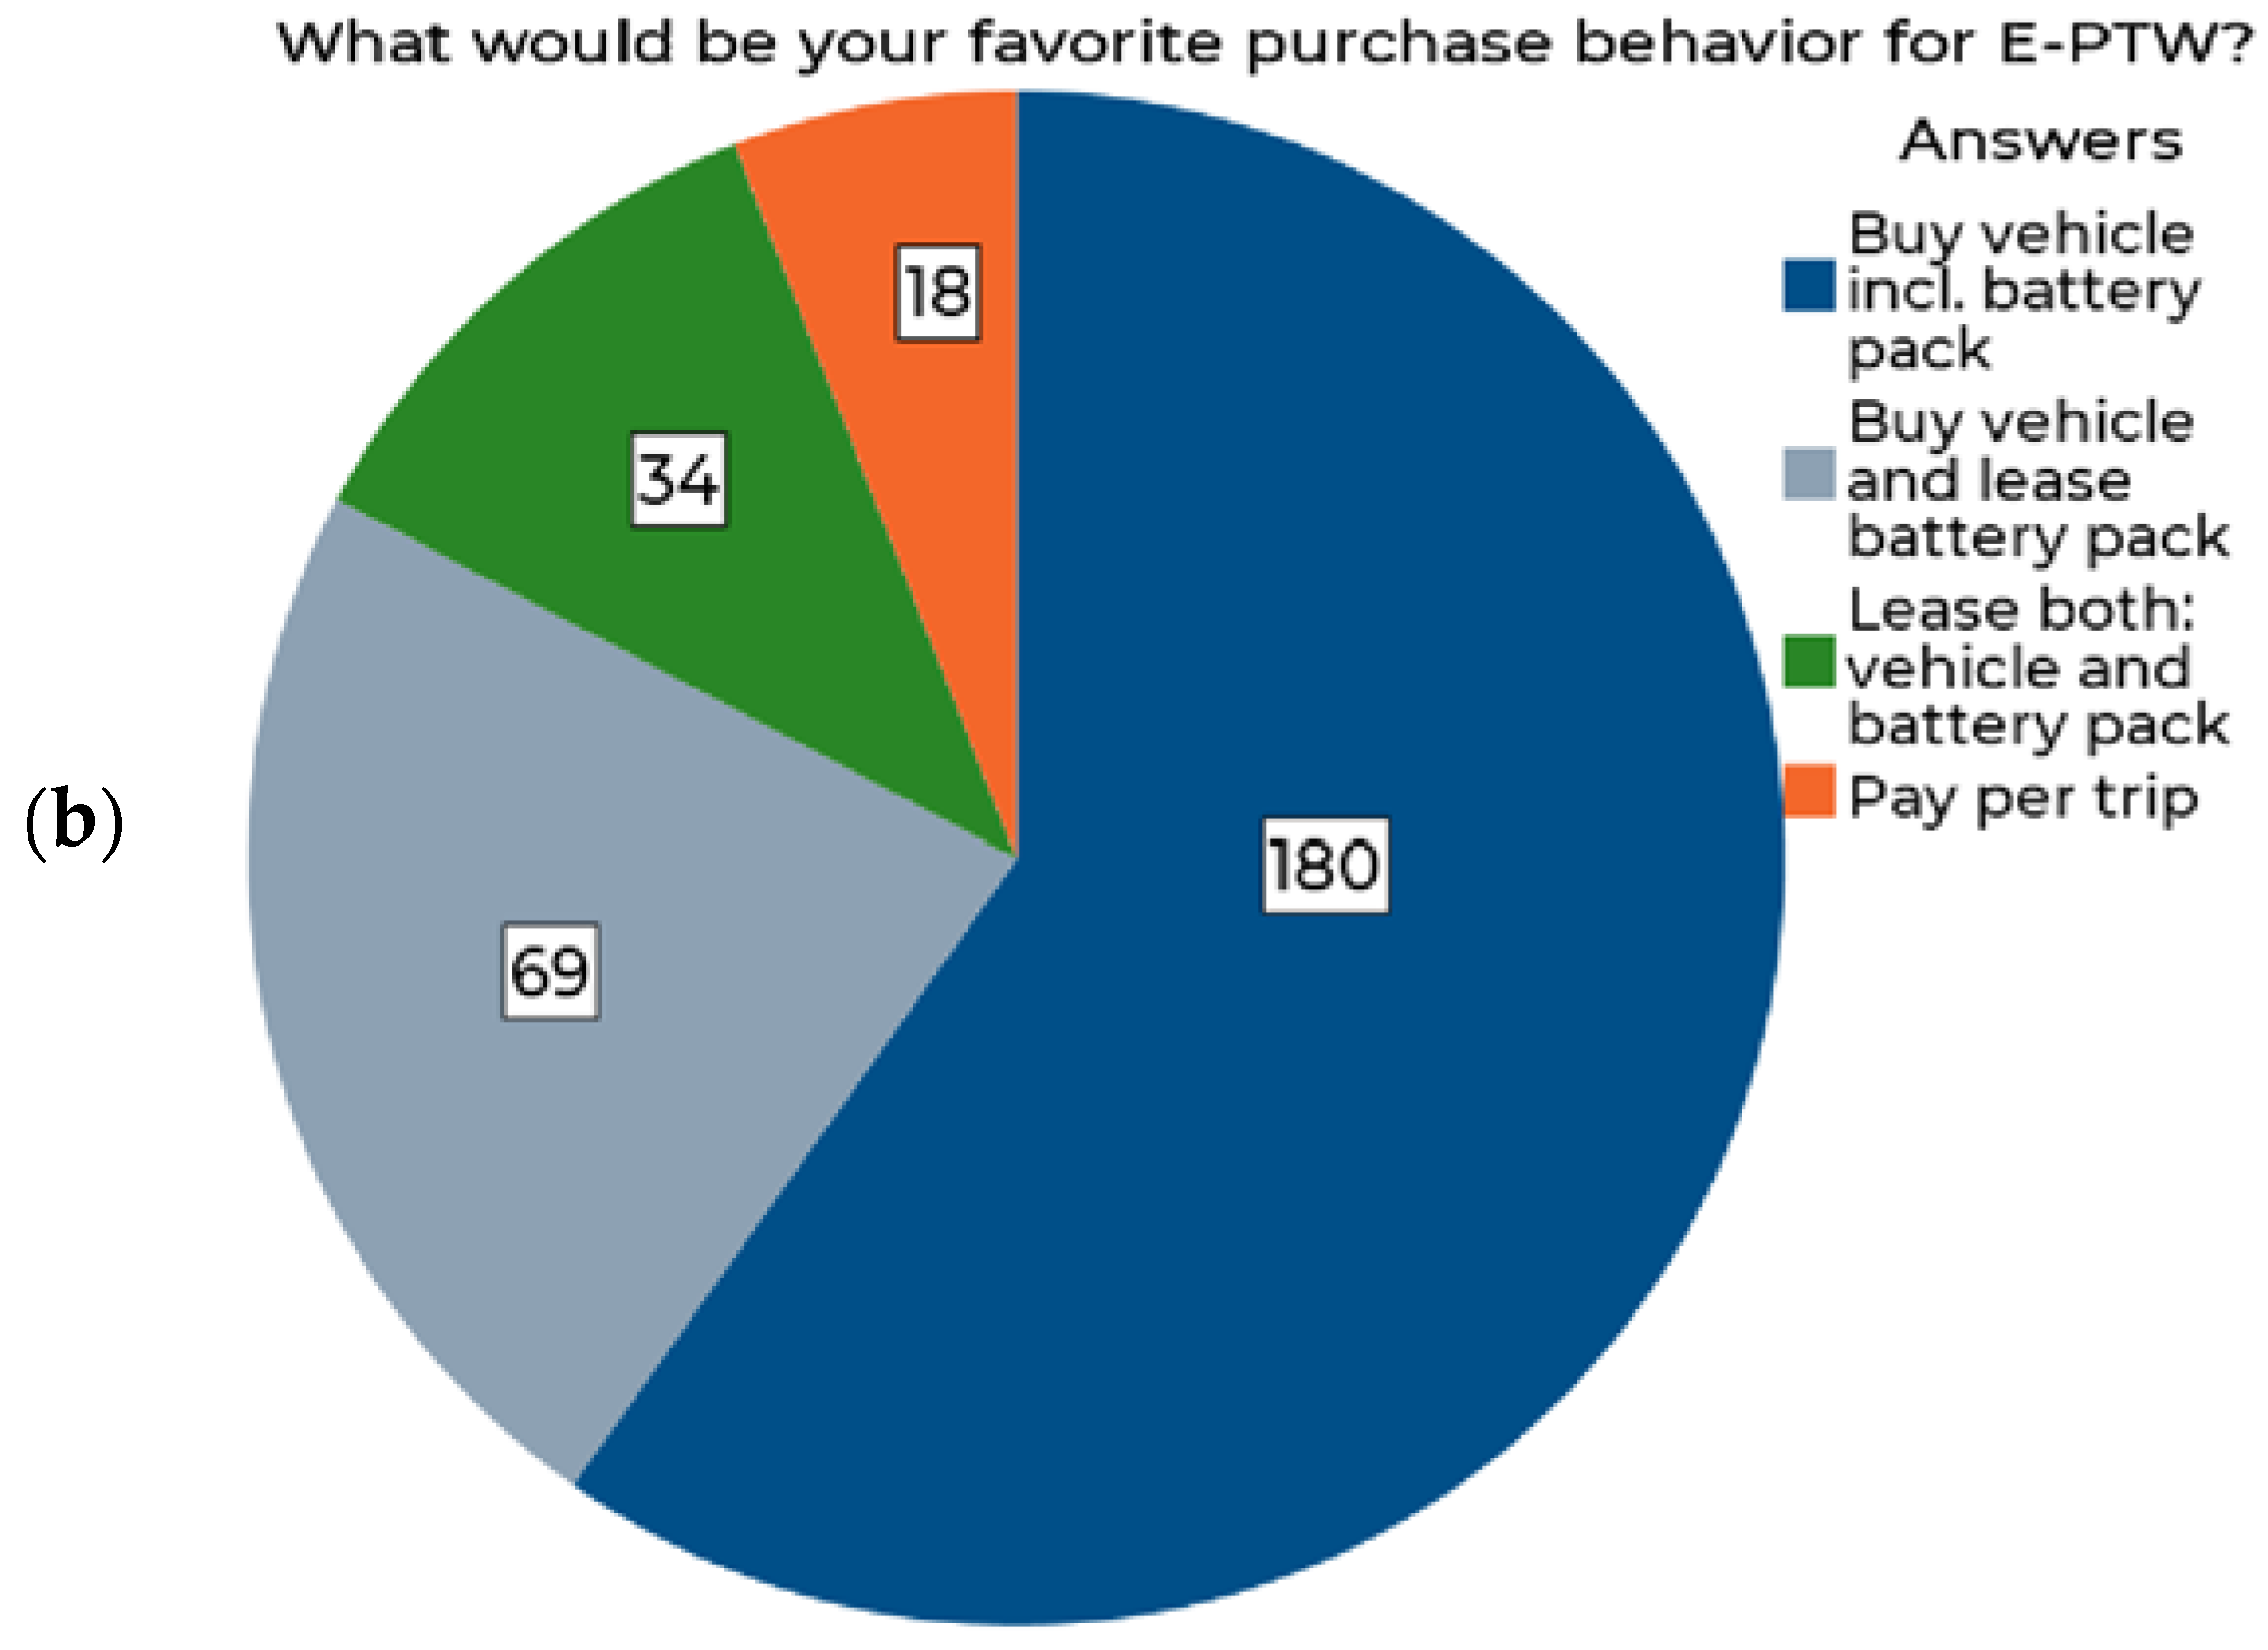
3.3. Opinion on Electric Vehicles

This chapter deals with attitudes and expectations towards electric vehicles. The clear majority of participants were not experienced with E-PTWs. Nevertheless, statements from the small subset of participants with E-PTW experience (n = 15 incl. pedelecs and E-Bikes) are reported. The participants who bought an E-PTW already were asked about their reasons for buying one. Participants referring to electric bicycles mention easier travelling up to a higher age as a big advantage. Generally, the most common reason given for buying an E-PTW was the driving experience associated with it. Participants appreciate the driving pleasure, especially the engine power, and describe the electric powered two-wheelers as easy to operate (e.g., no gear shifting necessary). Another important reason for buying is the personal interest in or professional contact with technology. The participants describe this with curiosity and passion for new technology. Less frequently mentioned as a reason for buying was lower maintenance costs, the design of the bikes or the advantages for the environment and health.
The most prominent reasons against buying an E-PTW among participants who did not yet own an E-PTW are the high price, driving range and an insufficient amount of charging stations at home as well as in public (Figure 7). These reasons were chosen most often among ten alternative obstacles and were mostly assigned ranks one to three. High weight or lack of performance are the least important obstacles.
The ratings of different statements regarding the acceptance of E-PTWs paints a comparable picture. The most critical items are range anxiety for longer trips, daily commuting and issues with the charging process (Figure 8). Furthermore, there is no trend showing that E-PTWs are regarded as being more environmentally friendly. Any existing legal benefits seem not to trigger the purchase of an E-PTW so far.
In addition to the predefined reasons, the open feedback revealed that participants miss information about the technology itself and about available vehicles. The participants also expressed their concerns about the safety of E-PTWs. Due to a lack of engine noise, they are afraid of being overlooked by other road users and question the maturity of the technology.
Figure 9 displays the agreement towards specific properties of a light E-PTW (small size, lightweight and typically up to 11 kW two-wheelers). Once again, battery life and the charging process dominate. Anti-theft protection, low retail price and low vehicle weight are less frequently expected properties of an E-PTW; the same holds true for the property of an E-PTW concept that suits the whole family. As only two participants were experienced E-PTW riders, the answers above show expectations from potential users that should be satisfied, however might also be modified to a certain extent when gaining experience with an E-PTW.
As the price for E-PTWs was mentioned as one relevant obstacle, participants were asked about their accepted pricing for this vehicle category. As can be seen from Figure 10, the users would broadly accept a lower entry price including the willingness to pay for extra range. Of those who responded, 58% stated to accept a similar price for an E-PTW as for a PTW with internal combustion engine. Furthermore, 21% wanted to pay 20% less and 16% would accept 20% more for a PTW with an internal combustion engine. About 3% would even accept 50% more compared to a PTW with an internal combustion engine. These patterns are stable across participants coming from different age groups. Furthermore, the majority of the participants prefer to buy the vehicle including the battery pack. A pay per trip option is the least favored purchase model.

4. Discussion

In this study, we expanded on findings concerning mobility patterns with PTWs, as well as relevant factors of consumer adoption of E-PTWs for the European market. In the online survey, the European sample reached participants from twelve different countries. Participants from Germany dominated clearly, followed by Italy, Austria and Sweden. More men than women participated, which represents a typical sample within the PTW community in Europe (e.g., [17]). Only a tiny proportion (n = 2) of all N = 432 participants were owners of an E-PTW, which is also indicative of the fact that E-PTWs are still a niche market in 2020 [11,12].
The role of riding experience as a factor for choosing a PTW is similar to findings from other publications dealing with PTW mobility in European cities (e.g., [13,14]): the most important reason for choosing a PTW over any other means of transport was the riding experience (i.e., riding pleasure and freedom). This argument was followed by easy parking and low maintenance costs. Interestingly, most of the participants own a PTW in addition to a car. Participants who own a PTW use it mostly for leisure purposes, to visit friends and to commute to work. Participants that do not own a PTW seem to cover leisure activities with bicycles, visiting friends and commuting with the car. This aspect might be especially prominent, because most respondents came from Germany, where PTW riding is a wide-spread leisure activity as opposed to pure commuting.
Mobility patterns of PTW riders were also of interest. Regarding mileage, mopeds were mainly driven up to 5000 km in five years for all age groups. In contrast, for motorcycles, mileage peaked at 20.001 km to 50.000 km for younger participants, but at 2001 km to 5000 km for older participants, meaning that younger participants use the motorcycle more often. A typical trip length for mopeds lies between 5 km to 10 km, while motorcycle trip lengths seem to vary between 5 km and 50 km or more. When asked why participants had not bought an E-PTW yet, the high price, the driving range and the insufficient amount of charging stations were mentioned as major barriers. More than half of the participants would be willing to pay a similar price for an E-PTW as for a PTW with an internal combustion engine, while pay-per-use is still an unfavored purchase model across the study participants.
Regarding opinions on E-PTWs, participants stressed the fact that they were concerned about the range when taking longer trips and when commuting. However, results from mobility patterns and trip lengths showed that, for many trips, the necessary range would easily be covered with the available battery power. Still, participants seem either not to be aware of this or suffer from a certain bias caused by range anxiety, which is a well-known phenomenon in electric mobility research [29].
Substituting passenger car trips with PTW trips, respectively, E-PTW trips have the potential to create an effect on sustainable future mobility due to less congestion, less local emissions and less fuel or battery power consumption. Overall, participants were also not convinced that E-PTWs could be more environmentally friendly. This certainly needs addressing and better communication. Further research and dissemination regarding local emissions and vehicle life-cycle (incl. carbon footprint of the production, possibility to recycle a vehicle, etc.) seems necessary. Furthermore, in some countries such as Germany, financial support on the national level is only granted for four-wheeled electric vehicles and does thereby exclude E-PTWs. If PTW properties such as less parking space and congestion are perceived as additional advantages, more policy makers should include E-PTWs in their promotion strategies. Other countries, such as, e.g., Austria, support this strategy already. As previous research has shown that awareness about environmental issues can have a direct effect on purchase intention of electric vehicles [30], giving potential customers information about the positive impact that E-PTWs can have on climate change and sustainable transport might help in reducing prejudices and foster the intention to buy an E-PTW.

Limitations

Naturally, the conducted study has some limitations when it comes to the generalizability of the results. Firstly, the conduction of an online survey typically fails to create data from a random sample, as people contributed on a voluntary basis and were either contacted from the research partners or that came across the survey and were interested in the topic. Consequently, it seems possible that only people with a certain interest in PTWs or future mobility participated, which might bias the results to a certain extent. However, the panel size and variety should still provide interesting and relevant impressions. Secondly, while the study tried to reach a wide number of participants throughout Europe, there was a clear dominance of participants from Germany, followed by Italy, Austria and Sweden. Therefore, the results should be interpreted carefully, as previous research shows that usage patterns between countries differ [17]. For instance, climate might play a role in mobility patterns with PTWs and Germany cannot be regarded as representative of the climate all over Europe. Thirdly, the survey aimed at gaining a rather broad impression on attitudes and behavior related to mobility and PTW mobility in detail. As a consequence, it lacks some in-depth findings that could explain why certain decisions were made. For instance, the reasons why participants do not regard E-PTWs as more environmentally friendly remains an open question.

5. Conclusions

This study takes a look into the future of sustainable mobility by expanding on findings concerning mobility patterns with PTWs and exploring factors for consumer adoption of E-PTWs for a European market. For making E-PTWs a contribution to more sustainable mobility, potential customer demands were identified that E-PTWs would need to fulfill.
Our results showed that, while riding a PTW in Europe as a leisure activity dominates, it is not the exclusive purpose. Reasons beyond using PTWs as a leisure activity, such as cheaper maintenance and more convenient parking as mentioned above, received high importance rankings in the survey. The strong, but not exclusive focus, on riding a PTW as a leisure activity is different to, e.g., Asian countries, where PTWs are more commonly used for commuting and daily errands (e.g., [13]). Given the fact that German participants dominated among those riding PTWs as a leisure activity, the relevance of PTWs for purposes such as commuting may even be underestimated.
Overall, participants were doubtful about the range of E-PTWs; however, a high proportion of trips should easily be covered with currently available battery power. However, participants seem not to be aware of this. Participants were also doubtful about the fact that E-PTWs can be regarded as more environmentally friendly, which is certainly an aspect that needs more communication if cities should move towards more sustainable mobility concepts including E-PTWs.
In conclusion, when potential E-PTW riders can be made aware that the range of these electric vehicles will be sufficient for many of their trips, and that E-PTWs can play a crucial role for more sustainable transport behavior in the future, this could help in reducing prejudices towards electric mobility. In the long run, this may lead to a more sustainable transport behavior.

Author Contributions

The authors’ individual contributions were as follows: Conceptualization, S.W., C.L.-B. and M.S.; methodology, S.W. and M.S.; software, M.S.; analysis, S.W.; writing—original draft preparation and review process, S.W., C.L.-B. and M.S.; review, C.Z. All authors have read and agreed to the published version of the manuscript.

Funding

This study was conducted within the project EMotion (Electric mobility in L-category vehicles for all generations). This project is supported with funds from the Climate and Energy Fund and implemented in line with the “Zero Emission Mobility” programme (GA: 878111). The funding is coordinated by the Österreichische Forschungsfördergesellschaft (FFG).

Institutional Review Board Statement

The online survey was approved by the WIVW internal ethical board.

Informed Consent Statement

Informed consent has been obtained from the participants prior to starting the online survey.

Data Availability Statement

Restrictions apply to the availability of these data. Data is so far only available to the EMotion consortium members.

Acknowledgments

The authors would like to thank all EMotion members that supported the study with fruitful discussions and by providing important information for their valuable contribution to this publication.

Conflicts of Interest

The funders had no role in the design of the study, in the collection, analyses, or interpretation of data, in the writing of the manuscript, or in the decision to publish the results.

References

  1. Haworth, N. Powered two wheelers in a changing world—Challenges and opportunities. Accid. Anal. Prev. 2010, 44, 12–18. [Google Scholar] [CrossRef] [PubMed] [Green Version]
  2. European Road Safety Observatory. Power Two Wheelers; European Commission: Brussels, Belgium, 2018. [Google Scholar]
  3. Yannis, G.; Vlahogianni, E.; Golias, J.; Saleh, P. Road Infrastructure and Safety of Power Two Wheelers. In Proceedings of the 12th World Conference on Transport Research, Lisbon, Portugal, 11–15 July 2010. [Google Scholar]
  4. Theofilatos, A.; Yannis, G. A review of powered-two-wheeler behaviour and safety. Int. J. Inj. Control Saf. Promot. 2015, 22, 284–307. [Google Scholar] [CrossRef] [PubMed]
  5. Jou, R.-C.; Chen, T.-Y. Factors affecting public transportation, car, and motorcycle usage. Transp. Res. Part. A Policy Pract. 2014, 61, 186–198. [Google Scholar] [CrossRef]
  6. Marquet, O.; Miralles-Guasch, C. City of Motorcycles. On how objective and subjective factors are behind the rise of two-wheeled mobility in Barcelona. Transport. Policy 2016, 52, 37–45. [Google Scholar] [CrossRef]
  7. Jamson, S.; Chorlton, K. The changing nature of motorcycling: Patterns of use and rider characteristics. Transp. Res. Part. F Traffic Psychol. Behav. 2009, 12, 335–346. [Google Scholar] [CrossRef]
  8. Mersky, A.C.; Sprei, F.; Samaras, C.; Qian, Z.S. Effectiveness of incentives on electric vehicle adoption in Norway. Transp. Res. Part. D Transport. Environ. 2016, 46, 56–68. [Google Scholar] [CrossRef] [Green Version]
  9. European Commission CO₂ Emission Performance Standards for Cars and Vans (2020 Onwards). Available online: https://ec.europa.eu/clima/policies/transport/vehicles/regulation_en#tab-0-0 (accessed on 16 April 2021).
  10. SafetyNet, Powered Two Wheelers. 2009. Available online: https://ec.europa.eu/transport/road_safety/sites/default/files/specialist/knowledge/pdf/powered_two_wheelers.pdf (accessed on 2 June 2021).
  11. ACEM. ACEM Statistical Release: Motorcycles Registrations in the European Union Grew by 8% in 2019; Association des Constructeurs Européens de Motocycles: Brussels, Belgium, 2020; Available online: https://www.acem.eu/motorcycles-registrations-in-the-european-union-grew-by-8-in-2019 (accessed on 2 June 2021).
  12. ACEM. ACEM Press Release-Registrations of Motorcycles and Mopeds in Largest European Mar-Kets Slightly Rose again after the First Months of the Year; Association des Constructeurs Européens de Motocycles: Brussels, Belgium, 2020; Available online: https://www.acem.eu/registrations-of-motorcycles-and-mopeds-in-largest-european-markets-slightly-rose-again-after-the-first-months-of-the-year (accessed on 2 June 2021).
  13. Blackman, R.; Haworth, N. A Qualitative Exploration of the Attitudes and Experiences of Moped and Scooter Riders. In Proceedings of the Transportation Research Board 89th Annual Meeting Compendium of Papers; Transportation Research Board: Washington, DC, USA, 2010; pp. 1–16. [Google Scholar]
  14. Coxon, I. Journey to Work, Buzz or Bore? A Phenomenological, Ethnographic Study of Motor Scooter Riders in Sydney. In Proceedings of the 25th Australasian Transport Research Forum, Canberra, Australia, 2–4 October 2002. [Google Scholar]
  15. Guerra, E. Electric vehicles, air pollution, and the motorcycle city: A stated preference survey of consumers’ willingness to adopt electric motorcycles in Solo, Indonesia. Transp. Res. Part D Transp. Environ. 2019, 68, 52–64. [Google Scholar] [CrossRef]
  16. Rogers, N. Trends in Motorcycles Fleet Worldwide. In Proceedings of the International Transport Forum—Workshop on Motorcycling Safety, Lillehammer, Norway, 10 June 2008; Organisation for Economic Co-operation and Development: Lillehammer, Norway, 2008. [Google Scholar]
  17. Delhaye, A.; Marot, L. The Motorcycling Community in Europe. 2015. Available online: https://ec.europa.eu/transport/road_safety/sites/default/files/pdf/projects_sources/riderscan_d9.pdf (accessed on 2 June 2021).
  18. Eurostat Ageing Europe—Statistics on Population Developments. Available online: https://ec.europa.eu/eurostat/statistics-explained/index.php/Ageing_Europe_-_statistics_on_population_developments#Older_people_.E2.80.94_population_overview. (accessed on 2 June 2021).
  19. Coffman, M.; Bernstein, P.; Wee, S. Electric vehicles revisited: A review of factors that affect adoption. Transp. Rev. 2017, 37, 79–93. [Google Scholar] [CrossRef]
  20. Egbue, O.; Long, S. Barriers to widespread adoption of electric vehicles: An analysis of consumer attitudes and perceptions. Energy Policy 2012, 48, 717–729. [Google Scholar] [CrossRef]
  21. Rezvani, Z.; Jansson, J.; Bodin, J. Advances in consumer electric vehicle adoption research: A review and research agenda. Transp. Res. Part D Transp. Environ. 2015, 34, 122–136. [Google Scholar] [CrossRef] [Green Version]
  22. Liao, F.; Molin, E.; van Wee, B. Consumer preferences for electric vehicles: A literature review. Transp. Rev. 2017, 37, 252–275. [Google Scholar] [CrossRef] [Green Version]
  23. Eccarius, T.; Lu, C.-C. Powered two-wheelers for sustainable mobility: A review of consumer adoption of electric motorcycles. Int. J. Sustain. Transp. 2020, 14, 215–231. [Google Scholar] [CrossRef]
  24. Ajzen, I. The theory of planned behavior. Organ. Behav. Hum. Decis. Process. 1991, 50, 179–211. [Google Scholar] [CrossRef]
  25. Rogers, E.M. Diffusion of Innovations; Free Press: New York, NY, USA, 2003; Volume 5. [Google Scholar]
  26. Davis, F.D.; Bagozzi, R.P.; Warshaw, P.R. User acceptance of computer technology: A comparison of two theoretical models. Manag. Sci. 1989, 35, 982–1003. [Google Scholar] [CrossRef] [Green Version]
  27. Zhu, L.; Song, Q.; Sheng, N.; Zhou, X. Exploring the determinants of consumers’ WTB and WTP for electric motorcycles using CVM method in Macau. Energy Policy 2019, 127, 64–72. [Google Scholar] [CrossRef]
  28. EMotion Consortium Electric Mobility in L-Category Vehicles for All Generations. Available online: https://www.emotion-project.at/ (accessed on 16 April 2021).
  29. Noel, L.; de Rubens, G.Z.; Sovacool, B.K.; Kester, J. Fear and loathing of electric vehicles: The reactionary rhetoric of range anxiety. Energy Res. Soc. Sci. 2019, 48, 96–107. [Google Scholar] [CrossRef]
  30. Okada, T.; Tamaki, T.; Managi, S. Effect of environmental awareness on purchase intention and satisfaction pertaining to electric vehicles in Japan. Transp. Res. Part D Transp. Environ. 2019, 67, 503–513. [Google Scholar] [CrossRef]
Figure 1. (a) Participants‘ gender as a function of PTW ownership with internal combustion engine (ICE). (b) Relation between participants’ age and technical affinity.
Sustainability 13 07151 g001
Figure 2. Country of residence for all participants in the EMotion online survey.
Sustainability 13 07151 g002
Figure 3. Reasons for choosing a PTW. Participants had to assign ranks 1 to 10 to 10 provided arguments.
Sustainability 13 07151 g003
Figure 4. (ad): Mobility patterns as a function of PTW ownership and generation (age groups). The bubble diameters display the absolute amount of people stating to use a specific vehicle for a specific purpose. Please note that no participant within panel (c) replied “Kick scooter”, therefore this category is not displayed.
Sustainability 13 07151 g004aSustainability 13 07151 g004b
Figure 5. Daily kilometrage as a function of PTW ownership and age groups. The 0 km category was excluded for better legibility.
Sustainability 13 07151 g005
Figure 6. (a) Combined mileage during the last five years (b) as a function of PTW ownership and age group.
Sustainability 13 07151 g006aSustainability 13 07151 g006b
Figure 7. Obstacles to buy an E-PTW.
Sustainability 13 07151 g007
Figure 8. Acceptance ratings concerning E-PTWs.
Sustainability 13 07151 g008
Figure 9. Expected properties of a light E-PTW.
Sustainability 13 07151 g009
Figure 10. (a) Electric light PTW pricing and (b) purchase behavior.
Sustainability 13 07151 g010aSustainability 13 07151 g010b
Publisher’s Note: MDPI stays neutral with regard to jurisdictional claims in published maps and institutional affiliations.

