1. Introduction
The search for efficient buildings is one of the main priorities of all governments to reduce energy bills. Many initiatives have been developed to provide regulations and tools that facilitate the process of obtaining such buildings and to help designers in the decision-making process. In the European Union (EU) in 2002, the European Commission published the first Energy Performance Building Directive (EPBD) [
1] to give EU Member States guidelines to develop mandatory regulations to improve the energy efficiency of the building market, including new and existing buildings. This directive has been periodically updated, introducing different factors, such as zero-energy buildings and the recovery of the investment in measures to improve buildings’ energy performance [
2].
Since 2002, the EU Member States have developed different methodologies and tools to comply with the adopted national regulations, most of which are based on ISO 13790 [
3], which promotes a method to calculate the energy needed for cooling and heating, based on the different loads that affect the building but with a strong focus on building geometry.
The first methods developed by EU countries lacked homogeneity and were supported by simulation tools that only allowed calculations at the end of the design process and when the construction was almost complete [
4]. These methods limited the decision-making process and sometimes guided the architects and engineers in the wrong direction, delivering results that were far from the real building performance [
5]. These tools also allowed for better performance when designing efficient buildings under cold conditions but complicated the evaluation of buildings in warm weather situations [
6].
To obtain results that were closer to reality, all the methods forced the building designers to adopt passive solutions that built on experience and changed across different climates. Therefore, finding the proper building shape, adapted to the location and the evaluation of the influence of the passive solutions, became one of the main research directions and one of the main challenges these evaluation tools must tackle. It has been demonstrated that further research on the influence of building shape on overall building performance is still required [
7], with it being crucial to identify the key parameters in different climates to understand building performance [
8].
It is important to focus on vernacular architecture, traditionally adapted to the local environment, and follow its design rules to facilitate the process of obtaining efficient and comfortable buildings. In the case of buildings adapted to warm or mild-warm weather, working with the size of openings, shading systems, and ventilation have been revealed as the most effective passive design solutions, combined with low tightness of the envelope [
9]. However, applying these design principles in large buildings is typically a challenge because of the limits in building function, the complex relations between spaces, and the need for centralized HVAC systems and efficient management [
10].
The development of the Building Information Modeling (BIM) paradigm has emerged as a key factor to improve construction information and to allow better buildings to be obtained. The analysis of building performance over different stages, including the operating phase, has been made possible by new simulation tools that provide information supporting the decision-making process. The analysis that can be performed includes energy performance. Building Energy Management (BEM) has been enhanced by different tools that can be applied at different stages of design. Studies have shown its usefulness at both early and advanced design stages [
11] and in the process of adapting building shape to local climate [
12].
On the other hand, relating energy efficiency to building comfort is one of the main challenges that, despite being the focus of architects and engineers since the Modern Movement, seems to have been neglected in the evaluation of building energy performance. What is more, the welfare of buildings’ occupants and, in particular, their thermal comfort, can be directly influenced by building efficiency. To correct this fault, different methodologies were developed during the 20th century, such as those proposed by Givoni [
13], Fange [
14] and Olgyay [
15]. Of these, Fanger’s Predicted Mean Vote (PMV) has been considered a valuable factor to evaluate comfort and has been adopted in a number of regulations, including ASHRAE 55 [
16] and UNE 16798-1:2020 [
17]. The different strategies coincide in that building design is one of the main factors in obtaining a comfortable architectural space although the overall understanding of the process is still considered to be limited [
18].
1.1. The Spanish Case
The Energy Performance of Buildings Directive (EPBD) to the Spanish regulatory framework is transposed through the Technical Building Code (CTE) [
19] but especially through the Basic Document for Energy Savings (DB HE) [
20]. This document is responsible for defining the energy limits and providing the methodology to evaluate energy performance in all types of buildings. Since its first publication, it has been updated four times, reinforcing the level of demand of the requirements. The last update moves towards obtaining buildings with nearly-zero energy consumption and adopting construction solutions similar to those stated in the Passivhaus standard [
21].
Until September 2018, the evaluation of the energy performance based on the DB HE was conducted through a software tool developed by the Spanish Government, called Unified Tool Lider-Calener (HULC) [
22]. This tool, based on the DOE-2 calculation engine, was widely criticized by architects and engineers because of its opacity, difficulty in introducing the data, and the errors found in the results obtained. It was also investigated by some researchers, as, in combination with a weak certification system, inefficient public buildings with complex geometry obtained better results than compact, regular buildings [
23]. One of the main complaints made by the professionals was the lack of an iterative process where building performance could be checked during project development.
This problem was unsolved by other software developed by both the Government and the private initiative. In 2013, CE3 and CE3X were approved [
24], providing a simplified evaluation for existing residential and small public buildings, and in 2018, CERMA [
25] was adopted, which addressed the evaluation of new residential buildings.
The introduction of the BIM paradigm in the Spanish building market has continued to be left to private initiatives. Only a few regions, such as Catalonia, have published statutes and guidelines to implement BIM in building construction. In the field of energy performance in 2019, a private initiative developed Cypetherm HE Plus, which is the first simulation tool based on an OpenBIM environment. It works under the Energy Plus calculation engine and is based on IFC 3D models that allow building energy performance to be evaluated at different design stages, but with a medium-high level of building detail. It can be applied to any type of building, both new and existing. At the same time, its connection to BIM modelling programs, such as Autodesk Revit, allows for complex geometries and the evaluation of architectural solutions that are reduced to simplifications in other programs. This geometry can also be exported to other simulation programs and analysis of other factors, including comfort, can be performed. It is worth highlighting that Spain is not clearly implementing the evaluation of thermal comfort conditions in buildings, with this currently being related to the analysis of the interior conditioning systems.
This tool is still under development and is being updated as there is still insufficient information about its performance, especially in medium-large buildings.
1.2. University Campuses
University campuses are among the group of stakeholders interested in understanding how buildings perform under the perspectives of energy efficiency and comfort. This type of built complex is typically formed by many buildings, where an efficient strategy needs to be followed to contain energy consumption, while guaranteeing comfort for building users. Additionally, many of these campuses were designed without the help of simulation tools and with obsolete construction regulations, leading administrators to take important decisions when buildings need refurbishing. To complete the scenario, many of the buildings on campuses can be considered iconic as they were participants in architectural competitions or are listed for their heritage value.
The University of Alicante (UA) can be considered as an example of a closed campus, which grew strongly in the 1990s as its position in the region was reinforced and new degree courses were created. Architectural contests were organized, and famous architects were chosen to design the new buildings. Most of these buildings can be considered singular and some of them significantly adapted design recommendations to obtain efficient buildings in mild-warm weather. Within these new designs, three buildings are particularly striking because of their singular shape and particular relation with the environment. Building design is taken to an extreme, eliminating closed corridors and opening up rooms and classes directly to the exterior. These buildings have defenders and detractors as, even under mild-warm weather, they can be uncomfortable during some parts of the year.
3. Bibliography Analysis
Simulation software has become an essential component of the process of obtaining efficient buildings. The building market demands tools that allow key factors for energy analysis to be identified and which permit a comprehensive improvement in building performance [
26].
The original simulation tools are slowly being replaced by other tools, developed by public and private actors, which can be applied at different stages of the building design. These tools differ in accuracy but it has been shown that they can all be valuable in the energy evaluation process [
27]. However, it has been demonstrated that those tools and methods used in the early design stages, which need to be flexible and allow for easy changes, do not provide robust feedback as simplifications and databases can condition the results and so they need interpretation [
28]. Despite this limitation, it is possible to define a minimum set of parameters that yield results that are close to reality with a minimum deviation [
29]. Although some researchers state that most of the procedures to reduce carbon emissions are mainly focused on the operation stage of the building [
30], new tools applied in early stages can provide sufficient information about building CO
2 emissions with a low level of detail.
Among these newly developed tools, we can find those that work under a BIM environment. These tools have been found to be very useful in the process of evaluating energy performance from different perspectives [
31,
32,
33,
34]. They also provide proper interaction with designers supporting decision-making in the different stages of the project [
35].
In the process of obtaining efficient buildings, the relation between building shape and energy efficiency is one of the most widely researched topics, both in academia and the building market. The search for a design system to relate envelope shape designs to integrated energy simulation has been shown to be useful to find the proper design and energy performance adapted to a location [
36]. To achieve this objective, rules are needed, but developing computer implementations is complex [
27]. In the process of obtaining efficient buildings, working with the key parameters, such as building orientation [
37], building shape [
38,
39], and façade design have been shown to reduce the energy demand in buildings [
40].
The process of evaluating building energy performance involves preliminary work that must adjust design solutions to the climate conditions where the building is located. There are several examples of research that relate design to location, with most being based on case studies. These design solutions may be exclusive for each location but some researchers suggest that although buildings may be located in different regions with different weather conditions, there are common issues and strategies in adapting building shape to location [
41]. It is also possible to predict the passive methods that have a greater impact on building energy performance according to the local climate conditions [
42].
The use of simulation tools is crucial in this process but some authors have reported limits to the simplifications of building geometry applied by the simulation tools and provide research on controlling building shapes [
43]. Nonetheless, it has been shown that with proper simulation-based workflows, efficient buildings can be obtained [
12].
It is clear, then, that energy efficiency should be incorporated into the building design process as early as possible to allow technology to serve the design and help achieve the energy efficiency objective [
44].
There are also several examples of research intended to assess the influence and effectiveness of the simulations during the process of evaluating building performance. Of the tools for simulations, those that allow automatization in the modelling process permit multiple variants to be simultaneously assessed [
45]. In this sense, it has been demonstrated that simulations are essential in the evaluation of cross-ventilation strategies for buildings [
46]. The building shape can also be tested with these simulations and the changes in the heat gain and loss can be rapidly predicted and optimized [
47]. The use of simulation tools to quantify passive solutions in different times of the year is evaluated by a number authors, finding that in a warm climate comfort can be obtained without an active cooling system [
48]. The impact of certain building elements, such as openings, can be precisely evaluated. Their geometry, which decisively affects energy consumption at different times of the year, has been tested [
49], as has the influence on the thermal comfort of buildings’ occupants [
50].
The influence of shading devices has been widely evaluated [
51,
52], and the impact of the geometry and their mobility can greatly improve building energy performance both in winter and in summer [
53,
54]. Strategies to optimize external shading devices have been proposed, as they reduce sun radiation over the building openings [
55] and improve building performance in warm weather [
56].
However, the use of validated processes and databases is crucial to obtain robust results during the process of obtaining efficient buildings [
57].
Many initiatives have sought procedures to obtain comfortable buildings. The starting point can be found in the Modern Movement when architectural principles were focused on improving the well-being of people in buildings. The notion of thermal atmospheres in architecture was first related to architectural design in that period [
58]. Architects and building designers, such as Eileen Gray, published writings to accompany their buildings, showing an environmental awareness that only appeared in later theories of the 1960s [
59].
Since that time, the need for methods to evaluate the health and comfort of occupants in buildings has grown over time. Some authors have suggested that these methods must be integrative multi-disciplinary approaches and must consider people in the process [
60]. This participation can be supported by methods, such as Fanger’s, based on people’s opinion. Evaluations of Fanger’s PMV have proven to be highly effective in the process of analyzing comfort in working places [
61].
However, these methods conflict with people’s actual activity in buildings, which is one of the major issues responsible for much of the deviation between reality and simulation [
62]. In the opinion of some authors, the evaluation of comfort is a complex process and there is a great distance between simulations and real building performance. To solve this distance, more fieldwork should be performed before methods are included in standards [
63]. This proposal from 2002 remains open, with subsequent research confirming the need to improve the procedures defined by the standards [
64] Field studies on thermal comfort confirm that personal understanding conditions the evaluation, and the results can vary depending on context and time. This situation confirms the changing relation between people, climate, and buildings posited by some authors [
65]. This situation worsens when buildings are naturally ventilated and users can interact with the architecture to improve their feeling of comfort [
66]. However, the interaction of the user with the building guarantees reduced energy use and increases their level of satisfaction [
67].
The interaction between the user and the architecture may generate a conflict that could be greater when matching energy efficiency with comfort and the improvement of the building design based on the energy needed and consumed [
68]. The users’ cultural background can make post-occupancy evaluations fail as they may neglect some building malfunctions while analyzing green buildings [
69]. This idea can be extended to good architecture followers, who may admit certain uncomfortable situations for the sake of good design, although it has been shown that good architectural design may also be comfortable [
70]. On the other hand, studies have shown that low-energy cooling can be achieved without an adverse effect on occupants’ thermal comfort, using an appropriate architectural design [
71]. In the process of improving the overall thermal conditions, the global comfort in the building can also be improved but not in a linear manner [
72]. Moreover, of the available methodologies, those based on graphical comfort charts can allow an intuitive interpretation of the building performance, enabling changes and corrections [
73].
Thus, it has been demonstrated that the evaluation of comfort, especially when related to energy, is a complex procedure and that the variation in standards in the field of thermal environment complicate building analysis [
74]. This is in the same line as the claims of authors who suggest building design has been neglected at the cost of complex analysis methods [
75].
Simulation tools play a key role in the process of evaluating comfort in buildings, and their simplifications can sometimes condition results. In this line, complex simulation tools, such as DesignBuilder, can be useful to evaluate building performance. Studies have reported its usefulness in confirming that, in some examples of good architecture, the buildings’ environmental performance is far from the current standards of adaptive comfort [
76].
4. Methodology
The methodology is based on a calculation process where the architectural shape, the energy performance, and the comfort from three case studies are evaluated. These case studies were chosen from among the buildings at the UA, due to their shape and the intended extreme adaptation to the local weather conditions.
The case studies were evaluated with two simulation tools: Cypetherm HE Plus and DesignBuilder. The energy results obtained are compared with the real building performance, as the energy consumption of the UA buildings are public and available. Building comfort is also evaluated by using the results obtained from the simulation tools. Furthermore, a basic CFD analysis was performed to evaluate comfort due to cross-ventilation and illumination. The results of the illumination analysis are compared to real illumination data. Finally, the comfort results are compared with the energy performance data obtained, with the aim of relating an energy efficient building design to comfort.
In the first step of the research, the case studies were chosen. The UA currently has 49 buildings, 42 of which are on the main Campus of San Vicente del Raspeig (Spain). It is a closed complex of one million square meters, where sustainable strategies are adopted in its daily management. The origin of the Campus can be found in a former military camp and some of these military buildings have been repurposed. The UA itself was created in 1979 and grew quickly as it was the only university in the province of Alicante. In the 1990s, the campus was completed with the construction of nine new buildings. All these buildings were developed after architectural competitions and all of them can, in some way, be considered singular. Of these buildings, three are striking because of their singular shape and their intention to be adapted to the local weather conditions: Institutos Universitarios (University Research Institutes—IU), Aulario III (Lecture Hall III—A-III), and Escuela Politécnica IV (Polytechnic School IV—EPS-IV).
Once the case studies were selected, the process of simulating building performance started with the definition of the 3D models using Autodesk Revit. This is a modeling tool from the BIM environment that allows the geometrical data to be exported to energy performance tools. The building geometry is then exported to two simulation tools: Cypetherm HE Plus and DesignBuilder. Both tools have EnergyPlus as the calculation engine and offer the possibility of evaluating different aspects of building performance.
Cypetherm HE Plus, as mentioned, is the most recent official tool approved by the Spanish Government to evaluate energy performance in buildings and to obtain the building energy certification. It was developed by a Spanish company, Cype. It is built over an OpenBIM platform that allows information to be shared to improve building construction information management. To export the information from Revit to Cypetherm HE PLUS, we used the OpenBIM Analytical Model tool to allow for a better exchange of the building information through an IFC file. Cypetherm HE Plus yields information about energy need, energy consumption, and CO2 emissions.
DesignBuilder is a renowned simulation tool that allows for a detailed analysis of different aspects of building performance. It yields, among others, information about building energy performance, the influence of the sun, and computational fluid dynamics calculations (CFD). It offers different calculations including an hourly analysis that allows comfort in buildings to be evaluated.
The abovementioned tools were used to evaluate energy demand and consumption and information about the interior temperature and humidity, illumination, and cross-ventilation in the case studies. The results of energy consumption from the two simulation tools are compared with real building energy consumption data from the period of 2016 to 2019. It should be noted that the evaluation period could not be updated to the last available year due to the COVID-19 pandemic in 2020, which reduced activity at the university buildings to a minimum.
The interior comfort was evaluated using the methods provided by Givoni and Fanger, two of the most widely implemented methodologies to evaluate comfort in buildings. The data was obtained from DesignBuilder.
Givoni’s method [
13] introduces architectural design and the building construction as factors that can condition a building’s interior comfort. Comfort is presented through a bioclimatic chart that allows us to identify the strategies needed to create a situation of comfort, according to specific hygrothermal conditions. The calculation of comfort with Givoni’s method was performed by using the hourly data obtained from DesignBuilder. The data were introduced in a psychrometric chart app [
77] to evaluate comfort under Givoni’s methodology to obtain the period of the year when the building is under a comfort situation. This web app displays a psychrometric chart on which a range of comfort metrics can be overlaid. Energy Plus weather data files (.epw) and results (.CSV) provided by simulation programs can be loaded and overlapped with methods that analyze the comfort situation, such as those designed by Givoni and Fanger.
The results obtained with Givoni’s methods are complemented with those from Fanger’s. In this case, the method calculates two indices, called the Predicted Mean Vote (PMV) and the Predicted Dissatisfied Percentage (PPV), which show the mean thermal sensation of an interior environment and the percentage of people that will feel uncomfortable, respectively. These statistical values are conditioned by the level of activity, type of clothing, dry bulb temperature, relative humidity, mean radiant temperature, and wind speed. The limits to the comfort in the interior of the building are defined by the ASHRAE 55, which sets the comfort zone for the PPD from 0.5 to −0.5.
The data from DesignBuilder are also used to evaluate the level of illumination and the influence of cross-ventilation on comfort in three representative rooms, one from each case study.
The evaluation of the illumination in the three rooms analyzes the influence of the existing shading systems on the level of illumination and the comfort conditions. It shows the maximum and minimum values at 12:00 h over one year and is contrasted with the minimum levels defined by the CTE, which is set in 500 luxes measured 0.85 m over ground level. The simulated data are compared with real measurements taken with a PCE-CRM 40 luxometer. To complete the research, a basic CFD analysis was performed to evaluate the influence of cross-ventilation on comfort using Fanger’s PMV as the evaluation parameter.
To compare the simulated comfort results with actual people’s well-being, we conducted a basic survey among the three groups of people that use the buildings: students, lecturers, and administration. The survey was distributed through the UA intranet at different times of the year, with special attention paid to winter and summer. There were six questions, which, as can be seen in
Table 1, focused on the evaluation of people’s well-being in the building.
5. Research
5.1. Definition of the Case Studies
The calculation examples are located at the Campus of the UA, which belongs to the municipality of San Vicente del Raspeig, in the southeast of Spain. This area has a Mediterranean climate, considered as Bsh, warm steppe, by the Köppen classification [
78]. This implies temperate, humid, and dry winters and warm, dry summers. Proximity to the Mediterranean Sea guarantees an average high level of humidity during the whole year. The direction of the main winds is west–east, with west dominating. Therefore, a high energy need would not be expected in winter to provide comfort, but solutions are needed to refresh buildings in summer. Architectural principles to be applied in buildings under such weather conditions are based on controlling the sunlight, by sizing windows properly or using solar control devices and providing cross-ventilation.
As mentioned, the UA concentrates most of its activity on a closed campus where 42 buildings were built in different periods. Most of these buildings have a mixed use, sharing classrooms with offices for lecturers and researchers. The shape of the buildings is typically compact and windows have a controlled size or have devices to control sunlight. Most of the buildings are used intensely, 12 h a day and 5 days a week, with long periods of inactivity in the classrooms when the teaching period ends. This activity is usually interrupted in summer, from June to September, which is when temperatures are the highest. The offices are active from September until July with the same breaks for holidays. The campus is typically closed in August.
As can be seen in
Table 2, the buildings have very different sizes and predominant low shape factors. Shape factor is defined as the relationship of the built area to the occupied volume, according to the following formula:
F Shape Factor
S Built area
V Volume
As can be seen in
Table 2, there is a large group of buildings with a shape factor below 0.40. Within the buildings with higher shape factors, three of them also follow architectural principles related to the adaptation of the building to the climate: Polytechnic School IV, Lecture Hall III, and University Institutes. These three buildings are also striking because of their high energy consumption.
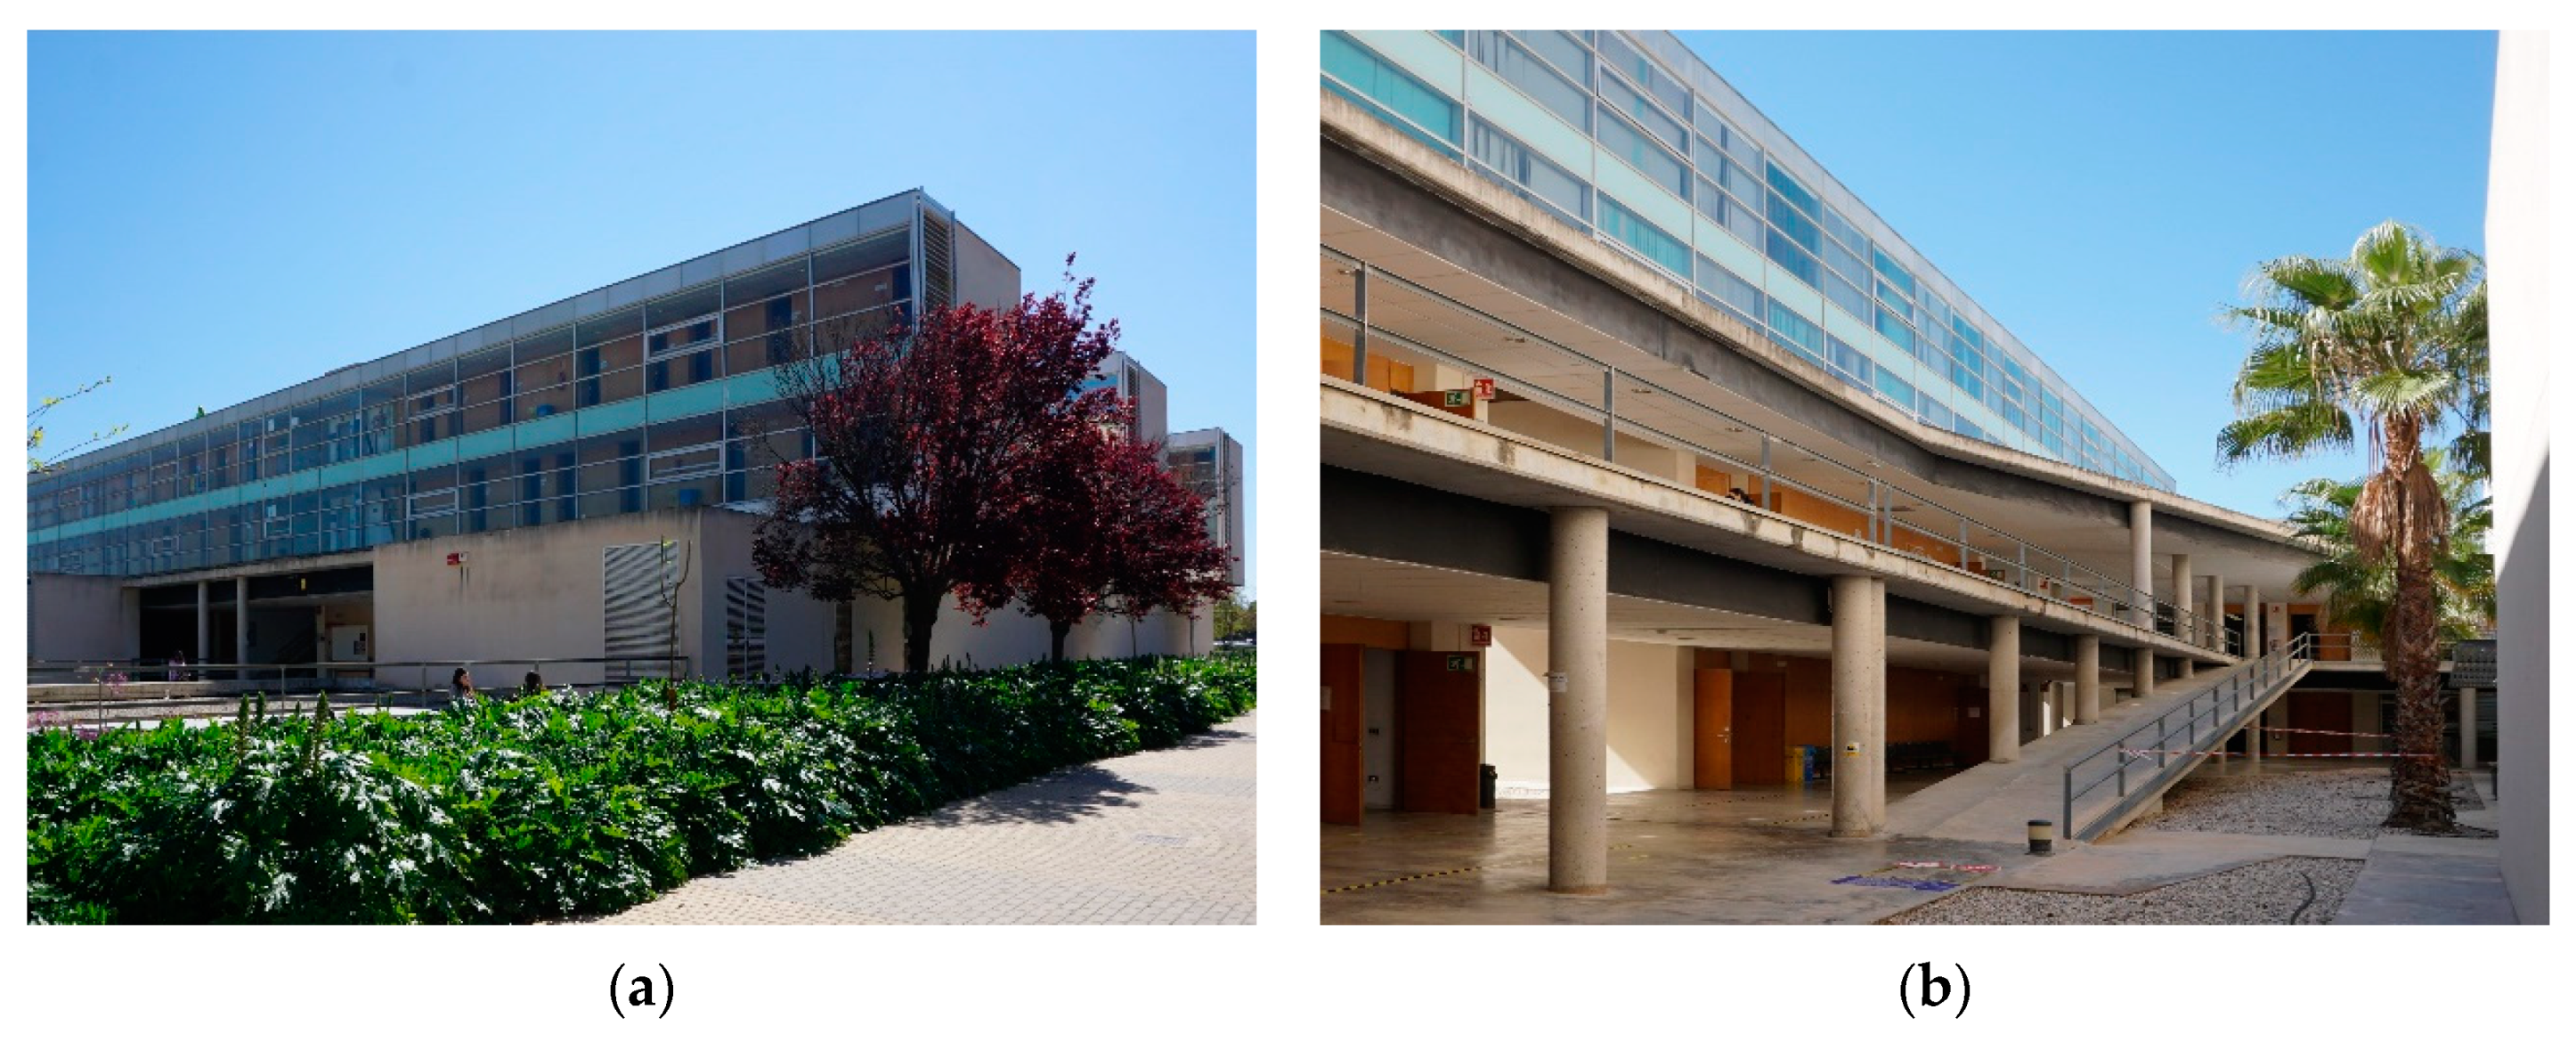
5.1.1. Case Study 1: Polytechnic School IV (EPS-IV)
With a gross built area of 9720.00 m
2, it is the most recent large building built on the campus. It was completed in 1999, according to the design of the architect Mª Dolores Alonso-Vera. This building has a mixed use, and is divided into two very different parts. The basement and ground level are devoted to classrooms and lecture halls, while the two upper levels are used by different departments for their lecturers, as can be seen in
Figure 1.
This building is defined by its open spaces, such as the classrooms, in the two lower levels, which are directly open to the exterior, as can be seen in
Figure 2. The two upper levels are divided into three large volumes, where a long corridor provides access to the teachers’ and researchers’ rooms.
Both the upper and the lower parts of the building have a public use and are defined by big windows with sun control devices. The offices have small and deep windows. Building construction was performed according to the regulations approved in Spain in its period of construction, and it is defined by insulated multi-layer façades with a non-ventilated cavity. The window frames are very basic and do not have interruption of the thermal bridge. Thermal bridges are not solved in the building, but the mild weather of the location allows this type of construction without causing damages.
5.1.2. Case Study 2: Lecture Hall III (A-III)
The construction of the A-III building has an interesting story as its use was changed when the building foundations were finished. The use of the building was deeply modified and therefore so was its volume. The architect was asked to reuse the foundations and the new building design needed to be finished in a very short period.
With these strict requirements, the optimization of the building materials and techniques was one of the main conditions of the project. Concrete was used for most parts of the building envelope, and it can be found in the exterior walls and flooring elsewhere than in the structure. The rest of the construction was prefabricated so as to allow the opening of the building as soon as possible. This challenge was accepted by the architect Javier Garcia-Solera in 1999. The building has a gross built area of 2926.00 m
2 that is solved in one level as can be seen on
Figure 3. Its shape is defined by its concrete enclosure that does not have thermal insulation. As it can be seen, classrooms have big windows that are protected from direct sunlight by big overhangs and brise-soleils. These big windows face northern and southern orientations and allow an interesting cross-ventilation.
5.1.3. University Research Institutes (IU)
Built in 1995, after a competition that was won by the architects Miguel del Rey and Iñigo Magro, this building is divided into five rectangular volumes oriented north–south with a total gross built area of 3781.00 m
2 on two levels, as can be seen in
Figure 4. The building hosts open patios to both headwaters with which they communicate or not as appropriate.
The building envelope is solved with a ventilated façade finished with galvanized steel panels combined with a regular multilayer face-brick façade with an insulated but not ventilated cavity. Windows size is small in the working area, with large ones in the corridors and in some public spaces. There are no exterior systems to reduce sunlight and all the shading systems are in an interior position.
5.2. Calculation of the Buildings’ Energy Performance
The analysis of the buildings’ energy performance was conducted by using two simulation tools: Cypetherm HE Plus and DesignBuilder. Both tools, as mentioned, share the same calculation engine, Energy Plus, but have different degrees of accuracy. As mentioned, Cypetherm HE Plus is the tool recently recognized by the Spanish Government to comply with the current regulations in the field of building energy performance. It works under an OpenBIM platform developed by the company Cype. It also provides a complete analysis of the building construction and yields, at the end of the process, the energy certification.
The process for the evaluation of the building performance starts with the modeling of the building geometry with a BIM modeling program. In this case, Autodesk Revit was used. The geometry is then exported to an IFC format that must be adjusted with another OpenBIM tool called OpenBIM Analytical Model. This tool prepares spaces, defines uses, and checks the building geometry to allow for proper working in the Cypetherm HE Plus tool. The construction and conditioning systems are defined in Cypetherm HE Plus once the building geometry has been imported into the program.
The program allows a detailed level of modeling, but in the time to export it to the calculation engine, EnergyPlus, shading systems are transformed into a value that reduces the sun incidence over the windows, so the work done with the shading systems is limited to a simplification.
The same building geometry obtained with Autodesk Revit is also exported into DesignBuilder, where minor adjustments of the building geometry and a complete construction definition are both enabled. In this case, DesignBuilder permits greater accuracy in the analysis, while also providing information about comfort, illumination, and a basic CFD analysis. The calculations were performed under the existing conditions of the buildings, to see whether the buildings were designed with the appropriate strategies and to evaluate whether they would comply with current regulations in the field of energy performance. Minimum adjustments were introduced if any parameter failed in this evaluation. However, as mentioned in the previous paragraph, sun reduction in windows is limited to a value that limits the energy gains from solar light.
Conditioning and other interior systems were defined according to the information provided by the UA. The operating schedule was adjusted to the official academic schedule approved by the UA to have the opportunity to compare the results obtained with the actual building energy consumptions. The UA has classes from the beginning of September until the end of December. There then follows two weeks with a minimum level of activity due to the Christmas break. From mid-January to the first week of February, exams are conducted. Classes start in the last week of February to the last week of May with a 1.5-week break for Easter. Exams take place again from the beginning of June to the second week of July. The campus is closed for most of August.
As can be seen in
Figure 5,
Figure 6 and
Figure 7, although both programs share the calculation engine, the results obtained for the buildings’ energy needs and consumption show differences. In the case of the EPS IV, as can be seen in
Figure 5, the energy needs have significantly different behaviors, especially in the months of September and October while, on the other hand, the energy consumption exhibits a similar performance.
Figure 6 shows the energy performance of the A-III, which follows a similar pattern to the energy consumption in the EPS-IV. This behavior is also similar in the case of the energy needs.
These two buildings, which show similar performance, face the IU building, which shows a very different energy performance behavior. As can be seen in
Figure 7, the energy needs and consumption of this building share peak energy demands in July while in the spring and autumn the building performs totally differently. It is worth noting that this building is the only one without an exterior shading system and has no large overhangs.
In all three case studies, the higher energy demand and consumption occurs in the summer period, which is understandable as the buildings are in a mild-warm area. However, these results also show high energy needs and consumption in winter, especially in the case of the IU building. These results demonstrate that, in this climate area, designers are forced to balance the building design to fit mild-warm and mild-cold situations.
As can be seen in
Table 3, from the annual energy needs and consumption per square meter, it can be said that the EPS-IV and the A-III can be adapted to the minimum requirements of the Spanish regulations [
20] with small adjustments. In the case of A-III, the design with the large overhangs and sun protection complies without problems.
The above-mentioned regulation limits the maximum energy consumption for these types of buildings through the Calculated Energy Consumption that it is obtained from the following formula:
The results of these two buildings are opposite to the results yielded from the analysis of the IU building, where the lack of sun-control devices penalizes the building’s performance.
5.3. Analysis of the Real Building Performance
The comparison between the two simulations and the real building energy consumptions in the different case studies yields different results. Real energy consumption, in the case of the EPS-IV, as can be seen in
Figure 8, shows an almost constant performance with peak consumption in winter and in summer. It drops during Easter and summer holidays. Comparing this data with the results of the programs, we obtain a different building performance with higher energy consumptions in winter and in summer, breaking with the constant behavior offered by the real data. Comparing Cyptherm HE Plus with DesignBuilder, it cannot be stated, in this case study, that one performs better than the other when comparing with the real energy data.
As can be seen in
Figure 9, the A-III shows an energy consumption performance that is closer to reality compared to the other buildings. In this case, the real building consumption occurs in winter when it should have happened during the warm period of the year. The origin of this situation can be found in the special building design that defends the building from direct sunlight and has efficient cross-ventilation. This design can also penalize the building performance in winter by reducing the solar gains. However, the results yielded by Cypetherm HE Plus show a robust performance compared to DesignBuilder and the real energy consumptions. This situation can be interpreted as the program having a good understanding of the geometry of the building and the recommended solutions for this type of climate.
The real building performance of the IU building reveals a peak energy consumption in July and in September while high figures are also reached in January. In this case, simulation and reality perform similarly in the warm part of the year, as can be seen in
Figure 10. The results yielded by Cypetherm HE Plus are higher during winter and lower during summer than the actual ones, while DesignBuilder shows acceptable results during the warm part of the year.
In absolute numbers, the analysis of the monthly and annual energy consumption, as can be seen in
Table 4, shows some distance between the simulated and the real results. In the case of the EPS-IV, the simulated results are between 18.09 and 21.72% of the mean energy consumption of the four years analyzed. In the case of Lecture Hall-III, the simulated energy consumption is between 41.93 and 51.15% above the real energy consumption. Finally, the University Institutes building shows a simulated energy consumption that is between 8.66 and 19.66% higher than the real one.
The conclusion to these analyses is that the building best adapted in its shape to the design recommendations, Lecture Hall III, is much more efficient than expected in the simulations. Meanwhile, the building with the fewest architectural solutions to control sunlight, the University Institutes Building, which has no overhangs or shading systems, shows energy results closer to reality. These situations confirm that complex geometries are not properly understood by the simulation programs and that simple geometries, such as the University Institutes’, are easier to simulate. The origin of these miscalculations can be found in the simplifications and the databases that the programs use to simulate sun control devices, among other factors. Moreover, the results continue to be influenced by the human factor in the way the buildings are used.
5.4. Comfort Analysis
The comfort analysis of the three case studies was carried out with the results yielded by DesignBuilder, after using the building geometries initially modelled with Autodesk Revit and adjusted in OpenBIM Analytical Model. The data yielded were introduced in a psychrometric chart overlapping Givoni’s and Fanger’s methods. The introduced data are based on temperature and relative humidity under the following suppositions:
Air Velocity: below 0.20 m/s
Clothing level: Casual with sweater
Metabolic rate: Seated with sedentary activity
Mean Radiant Temp.: 20 °C
As can be seen in
Figure 11,
Figure 12 and
Figure 13, the three case studies show a similar performance offering comfort or an extended comfort situation during most of the year. They all reveal the need to introduce corrections during the summer period that can be easily controlled using natural ventilation. In the case of cold periods, comfort can be reached by maintaining energy inside the building and promoting internal gains. This situation is favored as the buildings are closed or reduce their activity during the warmest part of the year.
It is also worth noting the need for the A-III to increase the temperature in winter, which is directly related to the use of overhangs and exterior shades, being consistent with previously analyzed data.
With these results, it can be said that the three case studies have a shape that can provide comfort to their users, given the results obtained from Givoni’s method. On the other hand, the PMV shows that the users are likely to be cold, especially in the case of the A-III building, as can be seen in
Figure 12. The IU building shows a more homogeneous distribution of the values, showing cold, mean, and warm situations in the same percentage.
5.5. Illumination and Ventilation
The evaluation of comfort cannot be only based on temperature and humidity, as wind speed and illumination also play an important role in the evaluation of people’s well-being inside a building. A basic illumination and CFD analysis were performed by using the results provided by DesignBuilder. The analysis was completed with information about illumination obtained with real data taken with a luxometer.
As can be seen in
Figure 14, the mean air speed in the courtyard of the underground level of the EPS-IV is between 4.30 and 7.40 m/s. This speed can be suitable for an exterior situation and can guarantee comfort during the warmest part of the year. It can provide proper cross-ventilation in the interior spaces where air speed should be below 1.5 m/s. The design of both the ground level and the underground level, formed by isolated volumes that define the classrooms, ensure the PMV is between the minimum and the maximum limits defined by the ASHRAE 55,119 days per year so that they are summed to comply with comfort standards.
Additionally,
Figure 15 and
Figure 16 shows the illumination analysis of one of the classrooms on the basement level.
Figure 15 shows the maximum and minimum simulated illumination, with the influence of the shading systems taken into consideration. As can be seen, the position of the classroom in the basement and the use of shading limits the level of illumination in the interior of the classroom.
Figure 16 confirms that only in the area of the classroom close to the window can the minimum illumination be reached. This situation is confirmed by the real illumination measurements confirming that the 83% of the time of the year the classroom is under-illuminated. This situation reduces the energy needed for cooling in summer but increases the energy needed for heating in winter and at the same time reduces the possibility of using the classroom with natural light.
In the case of the A-III building, the exterior spaces also have a good level of ventilation, which can also be introduced in the interior of the classrooms, as can be seen in
Figure 17. This cross-ventilation, the overhangs, and the shadings allow the classroom to be in a comfortable situation 183 days of the year, according to the PMV and the limits defined by the ASHRAE 55.
From the illumination perspective, the situation differs from the previous building. The overhangs and the shading systems condition the interior level illumination, as can be seen in the simulated results in
Figure 18. The actual illumination data show a higher mean level of illumination, which is higher than in the EPS-IV, but the classroom is below the limit defined by the CTE for 63% of the year.
However, as can be seen in
Figure 19, the active shading system, its design with opposite windows, and the north–south orientations of the classroom allow a better distribution of sunlight in the interior. Moreover, the shading can control the excess of sunlight in summer, allowing light to enter in winter.
The IU building has a similar situation, as the cross-ventilation can be guaranteed with the design of its courtyards. As can be seen in
Figure 20, the narrow shape of the different parts of the building and the courtyards allows a proper wind speed. This design means that 169 days of the year the classroom is under comfort conditions.
From the illumination perspective, as shown in
Figure 21, the east–west orientation of the main façades and the size of the windows reduce the illumination and therefore increase the need for artificial lighting. This situation can be positive in summer as solar gains in summer are reduced, but this penalizes the winter situation. The same situation persists, and the interiors can be under-lit for 59% of the year, as the real measurements show that.
The design of the classroom with small windows in only one of the façades limits the level of the illumination in the interior of the room, making the use of artificial light necessary, as can be seen in
Figure 22.
5.6. Survey
The comfort analysis was completed with surveys administered to the buildings’ users. Questionnaires were distributed among the three types of building users: students, lecturers, and administration staff.
As can be seen in
Table 5, EPS-IV users accept the building design and feel comfortable most of the year. Their main complaint is about the noise insulation of the different classrooms. This building is mainly used by students and lecturers of Architecture and Architectural Technology studies and 90% approve the building design. The main criticism, mentioned by almost 95%, is the design of the corridors on the first and second levels where the lecturers’ offices are located. The reflection of the sun from the neighboring volume raises the temperature as the building enclosure is finished with a glass wall.
As can be seen in
Table 6, the A-III building, which is also used by the same group of students and lecturers, presents a high level of acceptance from the building design perspective with 76% of positive reactions. In this case, the building design is perceived to provide a high level of ventilation, which can be understood as positive or negative, depending on the period of the year. Furthermore, the design of the windows allows acoustic bridges and generates large energy loses in the classrooms.
The opinions on the IU building are different, as can be seen in
Table 7. The users of this building are UA workers from various research institutes. These individuals spend 8 h a day with little physical activity. In this case, the main disagreement concerns the lack of sunlight control as the windows have devices located on the interior. The users also complain about the lack of ventilation and the high temperatures that can be reached in the interior if the air conditioning fails.
6. Discussion
The analysis in this research demonstrates that for a large stakeholder, such as university campuses, these results may generate doubts while taking decisions about adopting architectural passive solutions to improve energy and comfort performance in their buildings. The simulation tools can be highly useful in the process of evaluating building performance from different perspectives, but, as stated by [
18], there is still a limited understanding of how to translate design into efficient buildings and a significant distance between simulation and real building performance [
7,
63]. It is also confirmed that simulating buildings with a unique geometry is a challenge, as the simplifications and databases that the simulation tools use may condition the results obtained [
57].
The evaluation of Cypetherm HE Plus demonstrates that although this tool is integrated in a BIM environment and allows the exchange of information with other tools, it yields weak results and can guide architects towards wrong design decisions. The use of this tool over the three case studies confirms the importance of building orientation [
37], building shape [
38], and façade design [
40] in the process of obtaining energy-efficient buildings. However, it also demonstrated that it yields results that are closer to reality in the case study with a design that is less adapted to the local climate, which is not the ideal situation.
The exchange of information with DesignBuilder allows energy performance and comfort to be compared, using renowned methodologies such as Givoni’s and Fanger’s methods, and evaluating other parameters such as illumination and comfort due to ventilation. However, as it happens with energy performance, the results are not robust and there are contradictions between the analyses performed and the user survey. It is then confirmed that it is a challenge to match a good design with a comfort situation if the simulation tools do not offer robust results. However, the methods used in the research can be useful to understand building performance for the perspective of comfort. It can also help understand the role of ventilation and sunlight in the process, as suggested by other authors [
73].
The energy performance analysis of the EPS-IV shows that both Cypetherm HE Plus and DesigBuilder yielded results that are below the real energy performance. Additionally, despite the analysis of the overall building comfort conducted with the Givoni and Fanger methods, the analysis of the illumination and ventilation of one of the classrooms shows that the building has some limitations and that the shading, which can be useful to control sunlight, impacts the proper illumination of the classroom during the period it is under comfort conditions.
In the case of the A-III building, which very precisely follows the recommendations that should be applied in a building under mild-warm weather, the energy performance yielded results above the real energy consumption data in a range of 41.93–51.15%, which means that the building is much more efficient than expected. From the comfort point of view, the building shows robust results, which are supported by the users’ opinions, confirming that the building is under comfort conditions during a large part of the year.
The IU building presents contradictory results, as the energy performance data are the closest to real performance. The origin of these results can be found in that this case study has the simplest geometry and there is no shading system in the façade. From the comfort point of view, both Givoni and Fanger find that the building is under comfort conditions for a large part of the year and that the illumination level is good. However, in contrast to this data, the building design does not have the support of the users.
This research confirms that the use of passive solar solutions can influence building energy performance and comfort. However, a specific analysis should be performed during the design process, as the solutions are particular to the location [
53,
54] and results should be compared with real building performance. In addition, it is confirmed that a detailed analysis may not be extended to the overall building due to the complex calculations needed.
The results obtained by this research confirm that multiple variants should be analyzed at the same time to obtain an efficient and comfortable building [
45], and tools that allow this integral analysis should be used. Of these tools, those that work in the BIM environment, such as Cypetherm HE Plus, have sufficient flexibility to enable this [
35].
Finally, post-occupancy evaluations are confirmed to be a good tool to learn from experience [
65] but with the challenge of the impossibility of experimenting with corrections to malfunctions.
7. Conclusions
The analysis of the results obtained demonstrates that Cypetherm HE Plus may be an alternative to the existing tools in use in Spain. Its connection with other BIM tools allows for a better modeling process and accepts modifications that enable designers to change building parameters and, therefore, it can be used in different stages of the project. The exchange of information with other tools can also allow for a global analysis and for work to be conducted over different parameters, such as comfort, at the same time.
However, we find that the use of simulation tools for evaluation energy performance in buildings in Spain is still a field to explore, as the simulation yielded results that differed greatly from real building performance. In the analysis of the proposed case studies, buildings with a shape adapted to a mild-warm weather yielded weak results as simplifications and databases condition the process, especially when complex geometries and shading systems were evaluated. This uncertainty can affect construction stakeholders, such as university campuses, in the process of taking decisions to improve building performance.
Under this scenario, where a global approach is needed, the designers must be able to interpret the results to obtain an efficient and comfortable building and to avoid building malfunctions caused by the influence of simulation tools.


 ,
, 


