
Choice Experiment Method for Sustainable Tourism in Theme Parks


Abstract
:1. Introduction
2. Materials and Methods
2.1. Combination Schemes of Product Attributes and Levels of Theme Parks
2.1.1. Recreational Facilities
2.1.2. Theme Characteristics
2.1.3. Fastpass Drawing
2.1.4. Wait Times
2.1.5. Pricing
2.2. Model Selection and Analysis
2.2.1. RPL
2.2.2. CL
2.2.3. WTP for Attributes
3. Results
3.1. Sample Size and Composition
3.2. Choice Sets of Theme Parks
3.3. Analysis Results of CL and RPL
3.4. Explorations of Socioeconomic Backgrounds of Respondents on the Heterogeneity of WTP for Theme Parks
4. Discussion
5. Conclusions
5.1. Findings
5.2. Managerial Implications
5.3. Research Limitations and Directions for Future Studies
Author Contributions
Funding
Institutional Review Board Statement
Informed Consent Statement
Data Availability Statement
Acknowledgments
Conflicts of Interest
Appendix A. Questionnaire
| Part 1 Please according to the following description to choose the appropriate option and tick the checkbox. | |
| 1. Have you ever been to a theme park ? ☐ (1) Yes ☐ (2) No (Please stop answering) | |
| 2. What theme parks have you visited in the past five years? (Answer can be checked) | |
| ☐ (1) Leofoo Village Theme Park | ☐ (2) LIHPAO RESORT |
 |  |
| ☐ (3) Formosan Aboriginal Culture Village | ☐ (4) E-DA Theme Park |
 |  |
| ☐ (5) Janfusun Fancy world | ☐ (6) other _____________ |
 | |
| 3. What was the last theme park you visited? ______________ | |
References
- World Travel and Tourism Council (WTTC). Economic Impact Reports. 2020. Available online: https://wttc.org/Research/Economic-Impact (accessed on 12 March 2021).
- Dodds, R.; Butler, R. The phenomena of overtourism: A review. Int. J. Tour. Cities 2019, 5, 519–528. [Google Scholar] [CrossRef]
- Brida, J.G.; Risso, W.A. Hierarchical structure of the German stock market. Expert Syst. Appl. 2010, 37, 3846–3852. [Google Scholar] [CrossRef]
- The Tourism Bureau of the Ministry of Transportation and Communications of Taiwan. 2019. Available online: https://eng.taiwan.net.tw/ (accessed on 22 June 2020).
- World Economic Forum (WEF). Travel and Tourism Competitiveness Index (TTCT). Available online: http://www3.weforum.org/docs/WEF_TTCR_2019.pdf (accessed on 18 July 2020).
- Gabe, T.; Florida, R. Impacts of Jobs Requiring Close Physical Proximity and High Interaction with the Public on US Industry Employment Change During the Early Stages of the COVID-19 Pandemic. BE J. Econ. Anal. Policy 2021. [Google Scholar] [CrossRef]
- Kasemsap, K. Environmental management and waste management: Principles and applications. In Ethics and Sustainability in Global Supply Chain Management; IGI Global: Hershey, PA, USA, 2017; pp. 26–49. [Google Scholar]
- Lew, A.A. Scale, change and resilience in community tourism planning. Tour. Geogr. 2014, 16, 14–22. [Google Scholar] [CrossRef]
- Faber, M.H.; Miraglia, S.; Qin, J.; Stewart, M.G. Bridging resilience and sustainability-decision analysis for design and management of infrastructure systems. Sustain. Resilient Infrastruct. 2020, 5, 102–124. [Google Scholar] [CrossRef]
- De Carvalho, A.O.; Ribeiro, I.; Cirani, C.B.S.; Cintra, R.F. Organizational resilience: A comparative study between innovative and non-innovative companies based on the financial performance analysis. Int. J. Innov. 2016, 4, 58–69. [Google Scholar] [CrossRef]
- Akgün, A.E.; Keskin, H. Organisational resilience capacity and firm product innovativeness and performance. Int. J. Prod. Res. 2014, 52, 6918–6937. [Google Scholar] [CrossRef]
- Lukas, S.A. How the theme park gets its power: Lived theming, social control, and the themed worker self. In The Themed Space: Locating Culture, Nation, and Self; Lanham: Lexington, MD, USA, 2007; pp. 1–22. [Google Scholar]
- Raluca, D.C.; Gina, S. Theme park––The main concept of tourism industry development. Ann. Univ. Oradea Econ. Sci. Ser. 2008, 17, 641–646. [Google Scholar]
- Clavé, S.A. The Global Theme Park Industry; CABI: London, UK, 2007. [Google Scholar]
- Milman, A.; Li, X.; Wang, Y.; Yu, Q. Examining the guest experience in themed amusement parks: Preliminary evidence from China. J. Vacat. Mark. 2012, 18, 313–325. [Google Scholar] [CrossRef]
- McClung, G.W. Theme park selection: Factors influencing attendance. Tour. Manag. 2012, 18, 233–245. [Google Scholar]
- Wu, H.C.; Li, M.Y.; Li, T. A study of experiential quality, experiential value, experiential satisfaction, theme park image, and revisit intention. J. Hosp. Tour. Res. 2018, 42, 26–73. [Google Scholar] [CrossRef]
- Milman, A.; Tasci, A.D. Exploring the experiential and sociodemographic drivers of satisfaction and loyalty in the theme park context. J. Destin. Mark. Manag. 2018, 8, 385–395. [Google Scholar] [CrossRef]
- Milman, A.; Tasci, A.D.; Wei, W. Crowded and popular: The two sides of the coin affecting theme-park experience, satisfaction, and loyalty. J. Destin. Mark. Manag. 2020, 18, 100468. [Google Scholar] [CrossRef]
- Lee, S.; Jeong, E.; Qu, K. Exploring theme park visitors’ experience on satisfaction and revisit intention: A utilization of experience economy model. J. Qual. Assur. Hosp. Tour. 2020, 21, 474–497. [Google Scholar] [CrossRef]
- Fu, X.; Kang, J.; Tasci, A. Self-congruity and flow as antecedents of attitude and loyalty towards a theme park brand. J. Travel Tour. Mark. 2017, 34, 1261–1273. [Google Scholar] [CrossRef]
- Lari, L.; Jabeen, F.; Iyanna, S. Prioritising theme park service quality in Islamic contexts: An analytic hierarchy process approach. Int. J. Cult. Tour. Hosp. Res. 2020, 14, 225–237. [Google Scholar] [CrossRef]
- Tasci, A.D.; Milman, A. Exploring experiential consumption dimensions in the theme park context. Curr. Issues Tour. 2019, 22, 853–876. [Google Scholar] [CrossRef]
- Pan, H.; Bahja, F.; Cobanoglu, C. Analysis of US theme park selection and international implications. J. Transnatl. Manag. 2018, 23, 22–38. [Google Scholar] [CrossRef]
- Kim, D.; Park, B.J.R. The moderating role of context in the effects of choice attributes on hotel choice: A discrete choice experiment. Tour. Manag. 2017, 63, 439–451. [Google Scholar] [CrossRef]
- Zong, C.; Cheng, K.; Lee, C.H.; Hsu, N.L. Capturing tourists’ preferences for the management of community-based ecotourism in a forest park. Sustainability 2017, 9, 1673. [Google Scholar] [CrossRef] [Green Version]
- Juutinen, A.; Mitani, Y.; Mäntymaa, E.; Shoji, Y.; Siikamäki, P.; Svento, R. Combining ecological and recreational aspects in national park management: A choice experiment application. Ecol. Econ. 2011, 70, 1231–1239. [Google Scholar] [CrossRef]
- Crouch, G.I.; Del Chiappa, G.; Perdue, R.R. International convention tourism: A choice modelling experiment of host city competition. Tour. Manag. 2019, 71, 530–542. [Google Scholar] [CrossRef]
- Balcombe, K.; Fraser, I.; Harris, L. Consumer willingness to pay for in-flight service and comfort levels: A choice experiment. J. Air Transp. Manag. 2009, 15, 221–226. [Google Scholar] [CrossRef]
- Chaminuka, P.; Groeneveld, R.A.; Selomane, A.O.; Van Ierland, E.C. Tourist preferences for ecotourism in rural communities adjacent to Kruger National Park: A choice experiment approach. Tour. Manag. 2012, 33, 168–176. [Google Scholar] [CrossRef]
- Hearne, R.R.; Salinas, Z.M. The use of choice experiments in the analysis of tourist preferences for ecotourism development in Costa Rica. J. Environ. Manag. 2002, 65, 153–163. [Google Scholar] [CrossRef] [PubMed]
- Duijndam, S.; Beukering, P.; Fralikhina, H.; Molenaar, A.; Koetse, M. Valuing a Caribbean coastal lagoon using the choice experiment method: The case of the Simpson Bay Lagoon, Saint Martin. J. Nat. Conserv. 2020, 56, 125845. [Google Scholar] [CrossRef]
- Carlsson, F.; Frykblom, P.; Liljenstolpe, C. Valuing wetland attributes: An application of choice experiments. Ecol. Econ. 2003, 47, 95–103. [Google Scholar] [CrossRef]
- Song, H.; Wang, J.; Lyu, S.O. Willingness to pay for casino-based integrated resorts: A choice experiment. J. Destin. Mark. Manag. 2021, 19, 100555. [Google Scholar]
- Grilli, G.; Tyllianakis, E.; Luisetti, T.; Ferrini, S.; Turner, R.K. Prospective tourist preferences for sustainable tourism development in Small Island Developing States. Tour. Manag. 2021, 82, 104178. [Google Scholar] [CrossRef]
- Mejía, C.V.; Brandt, S. Managing tourism in the Galapagos Islands through price incentives: A choice experiment approach. Ecol. Econ. 2015, 117, 1–11. [Google Scholar] [CrossRef]
- Hossain, I.; Saqib, N.U.; Haq, M.M. Scale heterogeneity in discrete choice experiment: An application of generalized mixed logit model in air travel choice. Econ. Lett. 2018, 172, 85–88. [Google Scholar] [CrossRef]
- Wielgus, J.; Gerber, L.R.; Sala, E.; Bennett, J. Including risk in stated-preference economic valuations: Experiments on choices for marine recreation. J. Environ. Manag. 2009, 90, 3401–3409. [Google Scholar] [CrossRef]
- Mahadevan, R.; Chang, S. Valuing shipscape influence to maximise cruise experience using a choice experiment. Int. J. Hosp. Manag. 2017, 67, 53–61. [Google Scholar] [CrossRef]
- Vogel, M.; Papathanassis, A.; Wolber, B. The Business and Management of Ocean Cruises; CABI: London, UK, 2012. [Google Scholar]
- Kwortnik, R.J. Shipscape influence on the leisure cruise experience. Int. J. Cult. Tour. Hosp. Res. 2008, 2, 289–311. [Google Scholar] [CrossRef] [Green Version]
- Seekamp, E.; Jurjonas, M.; Bitsura-Meszaros, K. Influences on coastal tourism demand and substitution behaviors from climate change impacts and hazard recovery responses. J. Sustain. Tour. 2019, 27, 629–648. [Google Scholar] [CrossRef]
- Randle, M.; Kemperman, A.; Dolnicar, S. Making cause-related corporate social responsibility (CSR) count in holiday accommodation choice. Tour. Manag. 2019, 75, 66–77. [Google Scholar] [CrossRef]
- Hu, X.S.; Yang, Y. Determinants of consumers’ choices in hotel online searches: A comparison of consideration and booking stages. Int. J. Hosp. Manag. 2020, 86, 102370. [Google Scholar] [CrossRef]
- Grunert, K.G.; Bredahl, L.; Brunsø, K. Consumer perception of meat quality and implications for product development in the meat sector—A review. Meat Sci. 2004, 66, 259–272. [Google Scholar] [CrossRef]
- Chiambaretto, P. Air passengers’ willingness to pay for ancillary services on long-haul flights. Transp. Res. Part E Logist. Transp. Rev. 2021, 147, 102234. [Google Scholar] [CrossRef]
- Kang, S.; Nicholls, S. Determinants of willingness to pay to stay at a green lodging attraction. Int. J. Hosp. Manag. 2021, 94, 102834. [Google Scholar] [CrossRef]
- Rodella, I.; Madau, F.; Mazzanti, M.; Corbau, C.; Carboni, D.; Utizi, K.; Simeoni, U. Willingness to pay for management and preservation of natural, semi-urban and urban beaches in Italy. Ocean Coast. Manag. 2019, 172, 93–104. [Google Scholar] [CrossRef]
- Iranah, P.; Lal, P.; Wolde, B.T.; Burli, P. Valuing visitor access to forested areas and exploring willingness to pay for forest conservation and restoration finance: The case of small island developing state of Mauritius. J. Environ. Manag. 2018, 223, 868–877. [Google Scholar] [CrossRef]
- Platania, M.; Rizzo, M. Willingness to pay for protected areas: A case of Etna Park. Ecol. Indic. 2018, 93, 201–206. [Google Scholar] [CrossRef]
- Milman, A. The future of the theme park and attraction industry: A management perspective. J. Travel Res. 2001, 40–42, 139–147. [Google Scholar] [CrossRef]
- Cornelis, P.C. Effects of co-branding in the theme park industry: A preliminary study. Int. J. Contemp. Hosp. Manag. 2010, 22, 775–796. [Google Scholar] [CrossRef]
- Kao, Y.F.; Huang, L.S.; Wu, C.H. Effects of theatrical elements on experiential quality and loyalty intentions for theme parks. Asia Pac. J. Tour. Res. 2008, 13, 163–174. [Google Scholar] [CrossRef]
- Chuo, H.Y.; Heywood, J.L. An Optimal Queuing Wait for Visitors’ Most Favorite Ride at Theme Parks. In Advances in Hospitality and Leisure; Emerald: Bingley, UK, 2014; pp. 57–73. [Google Scholar]
- Gill, S. An analysis of Disney Theme Parks’ relational approaches to developing consumer engagement and advocacy. J. Promot. Commun. 2018, 6, 236–248. [Google Scholar]
- Mishalani, R.G.; McCord, M.M.; Wirtz, J. Passenger wait time perceptions at bus stops: Empirical results and impact on evaluating real-time bus arrival information. J. Public Transp. 2006, 9, 5. [Google Scholar] [CrossRef] [Green Version]
- Allen, J.; Muñoz, J.C.; de Dios Ortúzar, J. Modelling service-specific and global transit satisfaction under travel and user heterogeneity. Transp. Res. Part A Policy Pract. 2018, 113, 509–528. [Google Scholar] [CrossRef]
- Lekhawichit, N.; Chavaha, C.; Chienwattanasook, K.; Jermsittiparsert, K. The impact of service quality on the customer satisfaction: Mediating role of wait times. Psychol. Educ. J. 2021, 58, 3113–3125. [Google Scholar]
- Varki, S.; Colgate, M. The role of price perceptions in an integrated model of behavioral intentions. J. Serv. Res. 2001, 3, 232–240. [Google Scholar] [CrossRef]
- Cakici, A.C.; Akgunduz, Y.; Yildirim, O. The impact of perceived price justice and satisfaction on loyalty: The mediating effect of revisit intention. Tour. Rev. 2019, 74, 443–462. [Google Scholar] [CrossRef]
- Baskaran, R.; Cullen, R.; Colombo, S. Estimating values of environmental impacts of dairy farming in New Zealand. N. Z. J. Agric. Res. 2009, 52, 377–389. [Google Scholar] [CrossRef] [Green Version]
- Hensher, D.A.; Rose, J.; Greene, W.H. The implications on willingness to pay of respondents ignoring specific attributes. Transportation 2005, 32, 203–222. [Google Scholar] [CrossRef] [Green Version]
- Bechtold, K.B.; Abdulai, A. Combining attitudinal statements with choice experiments to analyze preference heterogeneity for functional dairy products. Food Policy 2014, 47, 97–106. [Google Scholar] [CrossRef]
- Ryan, C.; Shih Shuo, Y.; Huan, T.C. Theme parks and a structural equation model of determinants of visitor satisfaction—Janfusan Fancyworld, Taiwan. J. Vacat. Mark. 2010, 16, 185–199. [Google Scholar] [CrossRef]
- Milman, A.; Okumus, F.; Dickson, D. The global theme park industry. Worldw. Hosp. Tour. Themes 2010, 2, 220–237. [Google Scholar] [CrossRef]
- Fu, X.; Kang, J.; Hahm, J.J.; Wiitala, J. Investigating the consequences of theme park experience through the lenses of self-congruity and flow. Int. J. Contemp. Hosp. Manag. 2020, 32, 1181–1199. [Google Scholar] [CrossRef]
- Baker, C.A. Creative choices and fan practices in the transformation of theme park space. Transform. Work. Cult. 2016, 22. [Google Scholar] [CrossRef]
- Disney World. Extra Magic Hours. 2020. Available online: https://disneyworld.disney.go.com/guest-services/extra-magic-hours/ (accessed on 21 December 2020).
- Milman, A. Visitor management in highly-visited attractions: Lessons that practitioners can learn from the US theme park industry and the national parks. In Overtourism: Tourism Management and Solutions; Routledge: New York, NY, USA, 2019; pp. 104–124. [Google Scholar]
- Heo, C.Y.; Lee, S. Application of revenue management practices to the theme park industry. Int. J. Hosp. Manag. 2009, 28, 446–453. [Google Scholar] [CrossRef]
- Hernandez-Maskivker, G.M.; Nicolau, J.L.; Ryan, G.; Valverde, M. A reference-dependent approach to WTP for priority. Tour. Manag. 2019, 71, 165–172. [Google Scholar] [CrossRef]

| Attributes | Description of Attributes | Levels |
|---|---|---|
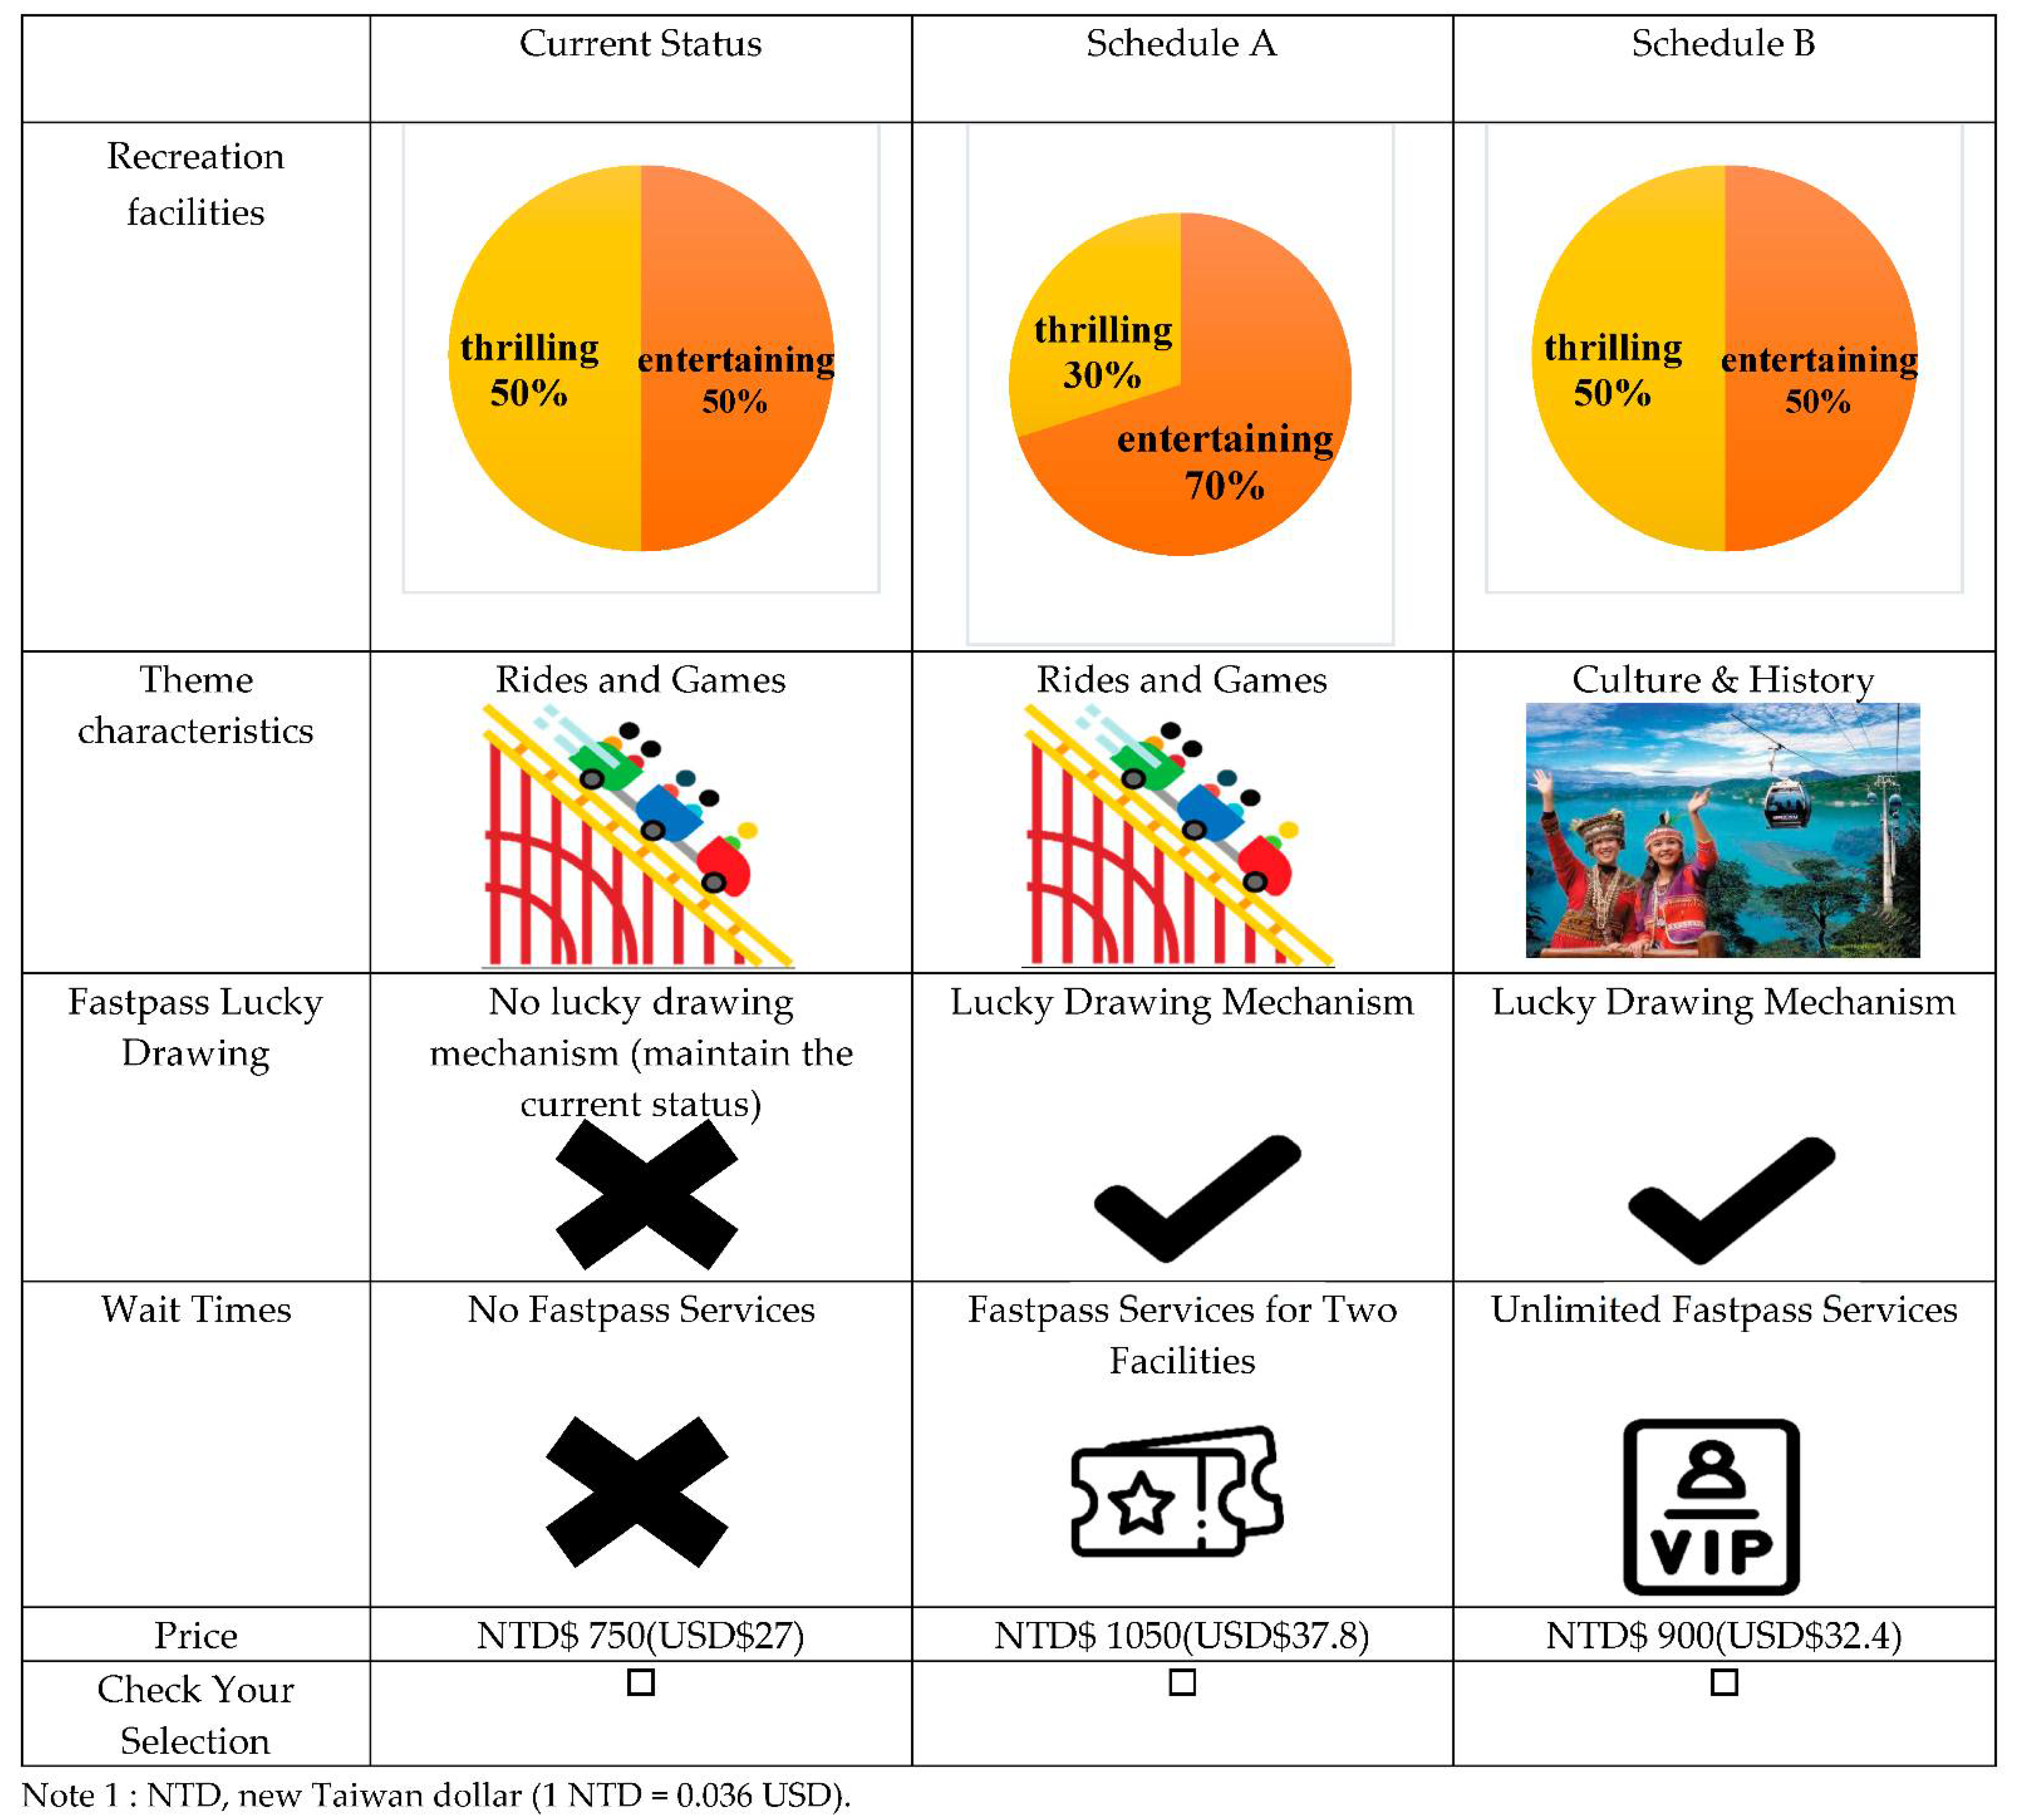
| Recreation facilities | According to the current status of Taiwan’s theme parks, this study classifies recreational facilities as entertaining and exciting. The entertainment facilities are usually relaxing and soothing, such as, the merry-go-round and big wheel; thrill rides are those with a fast-paced and stimulating experience, such as, roller coasters and hot wheel. | (1) 50% entertainment facilities and 50% thrill rides (2) 70% entertainment facilities and 30% thrill rides (3) 30% entertainment facilities and 70% thrill rides |
| Theme characteristics | Currently, the theme of Taiwan’s theme parks are mostly about rides and games, which are used in their operating activities. | (1) Rides and games; (2) Cartoon characters; (3) Culture & history; (4) Movie-themed tourism |
| Fastpass lucky drawing | The fastpass drawing activity was created by Disney, which allows tourists to go to specific attraction during a specific time to participate in a lucky drawing where they can win an fastpass. There is a chance of winning the fastpass of that attraction. This activity aims to reduce wait times for popular facilities by distributing tourists to wait for different facilities. | (1) No lucky drawing mechanism (maintain the current status) (2) Lucky drawing mechanism in place |
| Wait times | Currently, in Taiwan’s theme parks, the average wait times for one attraction is about 15–20 min, which may vary due to peak or off-peak hours, and peak or off season. Based on the number of facilities that one tourist purchases, the fastpass services can be used to get clearance. On average, one can save 20 min for one attraction, and if using the fastpass for six recreational facilities, about 2 h of wait times can be saved. However, none of Taiwan’s theme parks provide this service. | (1) No fastpass services (2) fastpass services for two facilities (3) Unlimited fastpass services |
| Price | This study refers to the ticket price of four major theme parks in Taiwan (the baseline ticket price is NTD 750 (USD 27)) to design the research, takes into account the level of wait times, and sets the price difference at NTD 150 (USD 5.4). Combinations of different attributes will be priced accordingly. | (1) NTD 750 (USD 27); (2) NTD 900 (USD 32.4); (3) NTD 1050 (USD 37.8) |
| Attribute and level | CL | RPL | |||||||
|---|---|---|---|---|---|---|---|---|---|
| Attribute Variables | Coefficient | t Value | WTP | Coefficient | t Value | Standard Deviation Coefficient | t Value | WTP | |
| Maintain current status (ASC) | −2.536 | −2.923 ** | −3.436 | −4.531 *** | 1.046 | 3.21 | |||
| Recreational Facilities (FAC1) | −0.992 | −4.892 *** | 99.2 | −1.292 | −6.621 *** | 0.222 | 1.67 | 53.8 | |
| Recreational Facilities (FAC2) | 0.526 | 2.407 ** | 52.6 | 1.419 | 3.264 *** | 0.385 | 2.52 *** | 59.1 | |
| Theme characteristics (THE1) | −0.491 | −2.019 * | 49.1 | −0.631 | −1.642 * | 1.218 | 1.48 | 26.3 | |
| Theme characteristics (THE2) | 0.698 | −2.870 ** | 69.8 | 0.426 | −3.405 * | 0.520 | 0.64 | 17.8 | |
| Theme characteristics (THE3) | −0.244 | −0.108 | 24.4 | −0.498 | −0.243 | 1.234 | 0.97 | 20.8 | |
| Fastpass Drawing (REW) | −0.352 | −2.925 ** | 35.2 | −0.434 | 5.375 * | 0.679 | 1.34 | 18.1 | |
| Wait Times (WAT1) | −0.369 | −1.322 | 36.9 | −0.684 | −2.987 * | 0.164 | 0.52 ** | 28.5 | |
| Wait Times (WAT2) | −0.211 | −1.348 | 21.1 | −0.795 | −6.248 *** | 0.943 | 1.64 | 33.1 | |
| Price (MONEY) | −0.01 | −0.356 | −0.024 | −0.234 ** | |||||
| Number of Choice Sets | 1647 | 1647 | |||||||
| Log-likelihood Ratio | −1677.102 | −1067.346 | |||||||
| Socioeconomic Background | Sample Size | ASC | FAC2 | REW | ||||
|---|---|---|---|---|---|---|---|---|
| Mean | t Value | Mean | t Value | Mean | t Value | |||
| Gender | Male | 260 | −6672.27 | 2.14 | 1056.64 | 2.69 | 1024.98 | −3.193 |
| Female | 289 | −7793.23 | 1057.53 | 1059.87 | ||||
| Age | 15–18 years old | 226 | −4632.13 | −2.98 ** | 1098.21 | 1.79 | 1034.31 | 2.14 *** |
| 19–23 years old | 183 | −3249.24 | 1038.42 | 1048.35 | ||||
| 24–30 years old | 140 | −7643.15 | 1069.24 | 962.54 | ||||
| Profession | Students | 330 | −4321.89 | 1.19 | 964.25 | 2.43 *** | 989.78 | 1.54 |
| Military, Public Servants & Teachers | 46 | −6498.17 | 1034.79 | 1046.52 | ||||
| Service Industry | 92 | −6952.94 | 1054.28 | 1078.98 | ||||
| Self-employed | 55 | −5972.15 | 1035.17 | 1034.56 | ||||
| Engineers | 15 | −4698.27 | 1043.27 | 1088.55 | ||||
| Others | 11 | −6531.46 | 1004.93 | 1010.14 | ||||
| Average personal wage per month | NTD$20,000 (USD$720) and below | 329 | −8.597.22 | 1.73 * | 1047.46 | 2.11 ** | 1201.46 | 2.153 ** |
| NTD$20,001–40,000 (USD$720–1440) | 162 | −7342.6 | 1039.57 | 984.56 | ||||
| NTD$40,001–60,000 (USD$1440–2160) | 46 | −6678.15 | 1026.34 | 1079.65 | ||||
| NTD$ 60,001–80,000 (USD$2160–2880) | 9 | −7067.38 | 998.14 | 978.98 | ||||
| NTD$80,001–100,000 (USD$2880–3600) | 3 | −7498.19 | 1058.33 | 1034.21 | ||||
| NTD$100,000 (USD$3600) and above | 2 | −6438.25 | 1079.44 | 1077.88 | ||||
Publisher’s Note: MDPI stays neutral with regard to jurisdictional claims in published maps and institutional affiliations. |
© 2021 by the authors. Licensee MDPI, Basel, Switzerland. This article is an open access article distributed under the terms and conditions of the Creative Commons Attribution (CC BY) license (https://creativecommons.org/licenses/by/4.0/).
Share and Cite
Chang, M.-Y.; Hsu, Y.-S.; Chen, H.-S. Choice Experiment Method for Sustainable Tourism in Theme Parks. Sustainability 2021, 13, 7146. https://doi.org/10.3390/su13137146
Chang M-Y, Hsu Y-S, Chen H-S. Choice Experiment Method for Sustainable Tourism in Theme Parks. Sustainability. 2021; 13(13):7146. https://doi.org/10.3390/su13137146
Chicago/Turabian StyleChang, Min-Yen, Yi-Sheng Hsu, and Han-Shen Chen. 2021. "Choice Experiment Method for Sustainable Tourism in Theme Parks" Sustainability 13, no. 13: 7146. https://doi.org/10.3390/su13137146
APA StyleChang, M.-Y., Hsu, Y.-S., & Chen, H.-S. (2021). Choice Experiment Method for Sustainable Tourism in Theme Parks. Sustainability, 13(13), 7146. https://doi.org/10.3390/su13137146