
Spreading of Food Deserts in Time and Space: The Case of the City of Nitra (Slovakia)


1
Department of Geography and Regional Development, Faculty of Natural Sciences, Constantine the Philosopher University in Nitra, Tr. A. Hlinku 1, 949 01 Nitra, SVK, Slovakia
2
Department of Ecology and En-vironmental Sciences, Faculty of Natural Sciences, Constantine the Philosopher University in Nitra, Tr. A. Hlinku 1, 949 01 Nitra, SVK, Slovakia
*
Author to whom correspondence should be addressed.
Sustainability 2021, 13(13), 7138; https://doi.org/10.3390/su13137138
Submission received: 26 April 2021
/
Revised: 17 June 2021
/
Accepted: 18 June 2021
/
Published: 25 June 2021
(This article belongs to the Special Issue Urban Retail Systems: Vulnerability, Resilience and Sustainability)
Abstract
:The aim of the article is to evaluate the time availability of food stores for the population permanently residing in the city of Nitra (Slovakia). Parts of the city where poor accessibility has been identified can be described as “food deserts”. In the last two decades, there have been dramatic changes in the retail network in Nitra, as well as extensive housing construction and an aging change in the demographic structure. Therefore, we evaluated the years 2008 and 2019 separately. This made it possible to evaluate the changes in time availability and the number of inhabitants located in individual zones. During the years 2008–2019, the residential zones of the city of Nitra increased by 43.86%, the area of food desert increased by up to 68.78%, and the number of inhabitants endangered by the food desert increased by 1100 residents, i.e., 23.9%. In 2008, 5.51% of Nitra’s residents lived in the food deserts, in approximately twelve years this percentage increased to 7.45% of the population (2019). The proximity to the nearest grocery was in Nitra in 2008 median 504 m, while in 2019 median 623 m. Evaluating the time availability of grocery stores and identifying so-called “food deserts” can be interesting for both the city’s residents and the business community, especially for potential developers. It can also be used effectively in the spatial planning process and in the rational management of complex territorial development, as well as in local politics. Given the character of the city of Nitra, it can be assumed that the acquired knowledge can be extrapolated to other post-socialist cities of a similar size and hierarchical level.
1. Introduction
The crushing entry of foreign chains into Slovakia’s retail market created a highly competitive environment, bringing the process of concentration to the forefront. This development was reflected externally mainly in the location of large sales units near important transport routes, respectively their intersections [1]. The exponential growth of supermarkets and the disappearance of midsized and small grocery stores has contributed to limited access to food. The urban dwellers (and, to a greater extent, those living rurally) live in relatively disadvantaged areas, where socio-economic conditions are deteriorating due to a lack of food sources.
The term “food desert” can mean a literal absence of groceries in a defined area. The older one of theories is associated with both the development and closure of stores [2]. Other authors have defined the food desert as an area, where food is expensive [3], relatively unhealthy and unaffordable [4,5], or areas of poor access to the provision of healthy affordable food, usually related to the lack of large retailers [6,7,8,9].
While there is no universally agreed upon definition [10], early definitions included those put forward by government ministers, like UK health minister Tessa Jowell in 1997, who identified food desert as areas “where people do not have easy access to health, fresh foods, particularly if they are poor and limited mobility” [11,12].
The principles of the so-called food deserts in the cities of our geopolitical area in CEE Europe started to be researched in the first decade of the 21st century. The issue of availability of geospatial access food stores has been addressed in several studies [13,14,15,16].
Some geographical studies considered all types of food retailers [17], while others dealt only with supermarkets [18,19,20,21,22]. Recent conceptualizations of “food deserts” have expanded from a single focus on access to supermarkets, grocery stores, and all household food sources [23]. A different concept was used by [12,24,25], whose studies of food deserts looked at the situation in residential areas of the city with limited access to fresh food.
For our purposes in this article, food desert means the zone area of a populated city where there is no grocery shop or other options for buying food at the stalls. By time availability we signify achieving the goal of buying foodstuff within 15 min on foot along the street network. The aim of the article is to evaluate the time availability of food stores for the population permanently residing in the city of Nitra.
To obtain it, we set two hypotheses:
Hypothesis 1.
Food deserts will be present in Nitra, even though our assessment included all accessible food stores;
Hypothesis 2.
We assume that the number of food deserts increases due to the concentration of food stores.
2. Data and Methods
In order to gain the geo-spatial access to the issue of food deserts, it was necessary to proceed in four logical steps:
(1) The input primary data for solving the research task were based on field research and certification in the city of Nitra in the years of 2008 and 2019. During the reconnaissance of the territory, retail units of different size, assortment offers were identified in order to describe their basic characteristics: address, sales area and product range structure. The selection criterion thus established is standard for shops with a generally valid name grocery (excluding delicacies, buffets, stall sales).
The process of the increase in sales floor areas are evidence of concentration in retail [1], which are manifested by a reduction in the number of food stores with a simultaneous increase in sales area. The sales floor area in supermarkets varies between 400 to 2500 m2. A hypermarket is defined as a “large sales unit with self-service, one floor, between 15,000 to 100,000 different items on sale, a full variety of food items, and a wide selection of non-food goods for daily, frequent and occasional needs. We distinguish between the so-called small hypermarket—with a sales area min. 2500 m2, an upper limit is 5000 m2 and an offer of about 15,000–30,000 items (Kaufland, Neckarsulm, Germany)—and a large hypermarket with a sales area of over 5000 m2, usually offering around 30,000–50,000 items (Tesco, Welwyn Garden City, Great Britain)” [26] (p. 32).
(2) The spatial data in the table containing the addresses of food stores has been geocoded into the point vector layer via the MMQGIS plugin in QGIS software (3.14.16-Pi, Free Software Foundation: Boston, MA, USA) [27]. MMQGIS is a set of Python plugins for manipulating vector map layers in Quantum GIS: CSV input/output/join, geocoding, geometry conversion, buffering, hub analysis, simplification, column modification and simple animation. We have used a Geocodes CSV With Web Service tool to geocode addresses to a point output file [28].
The resulting point layer was checked to see if the points actually represented grocery stores.
During the verificaton we moved the point layers so they represent the location of the stores’ entrances, referring to small grocery outlets; in the case of large hypermarkets (with several entrances), the point layers expressed their centroids.
Grass GIS (7.8.0, Free Software Foundation: Boston, MA, USA) [29] was used to calculate the density of food stores. The basic for the calculation was tool v. kernel, by which we generate a raster density map from vector points representing food stores, by using a moving kernel. The density was calculated by the Gaussian kernel function using the same method as [30] who estimated densities of various types of stores in North Carolina, Maryland and New York, and [31] who created continuous map layers representing the density of primary care providers.
With this method [30,31] each food shop is represented on a map surface by a cone (kernel), centered on the food store location. The radius of the cone base was set at 1666 m and represents the distance a person walks in 15 min at an average speed of 4 km/h. The Gaussian kernel method [9,32,33] allocates the capacity of food stores to the cell underlying the cone in such a way that cells near the cone centre receive higher values of service capacity (i.e., accessibility), and those near the periphery of the cone receive very little. In other words, the accessibility value of the cell is inversely related to its distance from the cone’s center. The sum of the density values of all cells covered by the cone is equal to 1.0 [31]. The resulting raster density map was reclassified into 4 classes (r. reclass tool). The limit values of individual classes were individual quartiles from raster density map attributes (minimum value–1 quartile, 1 quartile–median, median–3 quartile, 3 quartile–maximum value).
(3) The cumulative accessibility calculation was also performed using GRASS GIS 7.8.0. The basic input was the road layer [34], which was filtered for pedestrian accessibility, connected to the point layer of stores (v.net tools) and transformed from the vector format to raster (v.to.rast) with a spatial resolution of 5 m. The calculation of cumulative accessibility itself was carried out through the r.cost tool. The tool r.cost determines the cumulative cost of moving to each cell on a cost surface (the input raster road layer with a spatial resolution of 5 m) from other cells (the point layer of the grocery stores), whose locations are specified by their geographic coordinates. The result is an output raster map of roads in which each cell contains the lowest total cost of traversing the space between each cell of road and the points presenting the grocery stores. The resulting raster map of roads has a precisely defined value in each cell on the distance to the nearest food store. The next step was interpolation (tool r.surf.idw) by which we expressed accessibility values for built-up residential areas of the city, occurring near roads. The basic mask for the calculation of Interpolation and for the further reclassification of results was the layer of the built-up residential areas from 2008 (internal documents of the Chief Architect Section in Department of Urbanism and Architecture in the city of Nitra, 2008). The differences in the settlement structure in 2019 were manually modified by digitalisation of the base map [34] in the scale 1:25,000.
(4) For the purpose of identifying the food desert, the resulting values were reclassified into two parts: walking availability within 15 min and walking availability over 15 min (at 4 km/h). There is no agreement in terms of the border of the food desert, but distances of around 1000 m (approximately a 12-min walk for an adult in a city—a walking speed of 5 km/h) are common e.g., [17,18,35,36]. The border of the food desert was defined by accessibility exceeding 15 min (distance of 1000 m at a walking speed of 4 km/h).
We assessed the accessibility analysis of food stores at 11 TTU level (territorial and technical units). One grocery located within 2 km from the city borders was also included in the spatial analyses (TTU Čechynce), as well as all roads located at this distance, in order to eliminate distortions of results on the edge of the city. The resulting statistical overlays of the final map layers with TTU layers were expressed by the tools r. report and r. stat. The creation of map outputs with an expressed density of food stores and visualized cumulative accessibility values above 15 min representing food deserts was realized through QGIS software 3.14.16.
The basic group of residents which was evaluated in relation with the food deserts was obtained in the Statistical Office of the Slovak Republic from the only available census data on Nitra residents on the level of basic settlement unit in 2011. The data was overlapped (v. overlap) with the layer of built-up residential area and with TTUs as well. This complex data source was used for the further analysis. All other natural factors were excluded from the study.
3. Study Area
The city of Nitra, with an area of 100.4 km2 and a population of 76,553, is currently the 6th largest in Slovakia (after Bratislava, Košice, Prešov, Žilina, and Banská Bystrica). Its formation and development was made possible by a propitious location at the border of the lowlands and the mountains, as well as at the crossroads of ancient trade routes [1]. As in Western Europe, there have been changes in demography, specifically an ageing population. The index of Nitra residents as the share of persons in post-productive age (65+) to persons in pre-productive (0–14) age was 134.4% in 2019; compared to the population of the whole of Slovakia, the index was much higher (Table 1). The average age of residents of Nitra in 2008 was 39.6 years and 42.94 in 2019. Pensioners’ share in the post-productive age is 19.33% (2019) high, while in 2008 11.81%. The data in Table 1 show the former youngest city of the republic today became the city of the elderly [37]. The whole data indicates a regressive type of population.
Nitra is a part of one of the most dynamically developing Central European regions, along with centers in Vienna and Budapest (Figure 1). The economy, employment and social development in Nitra has been significantly affected by the automotive industry Jaguar Land Rover Slovakia since 2018. Since 1996, there has been a permanent decrease in the number of children born as well as of inhabitants. In terms of the theory of [38,39] the city belongs to the group of “shrinking” cities.
We consider the city of Nitra to be an appropriate model of the Slovak town, because it is not only cleaned of specific parameters of the capital, but is, at the same time, a leader in some aspects (the first hypermarket opened in the Slovak Republic—Tesco (Welwyn Garden City, Great Britain) in 1999, the saturation-stage, achieved in 2014 by the value of PAFS (the ratio of the admissible floor space to the population in thousands) 2000 m2/1000 customers [1].
In terms of historical development, localization and spatial differentiation, the forms of food retail network in Nitra can be divided into three basic groups:
- (1)
- Traditional grocery and convenience stores from the socialist period that “survived” the transformation in the tumultuous 1990s and have a long tradition despite the socialist past. They have successfully implemented both new marketing strategies and a “commemorative sentiment”. From the point of view of site theory, this group of shops used both the “city cent” rule and the “proximity to the consumer” rule.
- (2)
- New large-scale food stores of the multinational foreign trade chains Tesco (Welwyn Garden City, Great Britain), Billa (Wiener Neudorf, Austria), Lidl (Neckarsulm, Germany) and Kaufland (Neckarsulm, Germany). They built their sales points on a “greenfield” site when they implemented location strategies for proximity to the consumer and favorable accessibility to Class I and Class II roads.
- (3)
- Restored small-scale stores with many of them reflecting modern nutritional trends (with an emphasis on ecology and bioproducts). They are created by the process of so-called “small brownfield developments” in the city center in older buildings. They began to emerge again after 2010, when customers became saturated and gradually overwhelmed with visits to large shopping malls in the suburbs. This trend to fill the gap in the shopping possibilities of inhabited parts of urban areas can be observed to this day.
4. Survey Results
From our detailed cataloging of food stores, we noted that they decreased in number by 12.5% from 103 (2008) to 88 stores (2019), although the sales area more than doubled from 15,334 m2 in 2008 to 36,417 m2 in 2019. In 2008, food stores accounted for 12.28% of the total number of stores (839 in 2008); however, by 2019 their share decreased to 11.76% of the total of 748 stores. In 2008, the smallest unit selling grocery items was 12 m2 (stall sales), while the largest was 5890 m2 (Tesco hypermarket, Welwyn Garden City, Great Britain); in 2019 the smallest was 10 m2 (stall sales), whereas the largest was 5600 m2 (Metro Cash & Carry, Dűsseldorf, Germany). In 2008 there were 24 small shops (up to 50 m2) in operation, which represented 23.3% of all food stores; after 12 years this number had increased to 39 (2019), which was 44% of all food stores.
In 2008, the retail sale of food in Nitra took place in 19 large-scale stores, of which 13 were supermarkets and 6 were hypermarkets. By 2019, 4 more such stores had been added, bringing the situation to 17 supermarkets and 6 hypermarkets. The group of hypermarkets had not changed during these 12 years between 2008 and 2019.
In the monitored period, we recorded food store loss in TTU Chrenová, Dolné Krškany I, Veľké Janíkovce and Dražovce (Figure 2). The situation of food retail developed positively in TTU Mlynárce, Horné Krškany, and Zobor.
This phenomenon was caused by two processes. In addition to the arrival of multinational foreign chains on the retail scene of Nitra with large-scale formats of Tesco (Welwyn Garden City, Great Britain), Billa (Wiener Neudorf, Austria), Lidl (Neckarsulm, Germany), Kaufland (Neckarsulm, Germany) and CBA (Alsónémedi, Hungaria), it was also a blanket expansion of domestic chains (Jednota COOP, Bratislava, Slovakia and Nitrazdroj, Nitra, Slovakia). In 2008, the grocery network was more disperse, localized even in less significant streets. In the second year under surveillance, it already showed elements of a more concentrated network, which apparently replicates traffic arteries. In the outskirts of the city in particular, retail food sales have clearly declined, which can be described as a process of competitive “cleansing”.
Density maps (Figure 2) calculated for both monitored years also point to this fact. The highest values of food density (from Q3 to max) in both years were found in built-up areas located directly in downtown Nitra I. The increase in density in 2019 compared to 2008 occurred in TTU where built-up residential areas are in direct proximity to the city center—gentrified TTU Chrenová, residential TTU Zobor with the most expensive villa houses but and also TTU Mlynárce with older family houses. On the contrary, lower density values reached by TTU, whose built-up residential areas are located on the outskirts of the city of Nitra (TTU Dražovce, Dolné Krškany and Veľké Janíkovce), show elements of residential suburbanization, as they were originally rural municipalities with minimal amenities. New construction here continues out of the city and suggests possible future expansion beyond the city limits.
4.1. Accessibility Food Retail Network
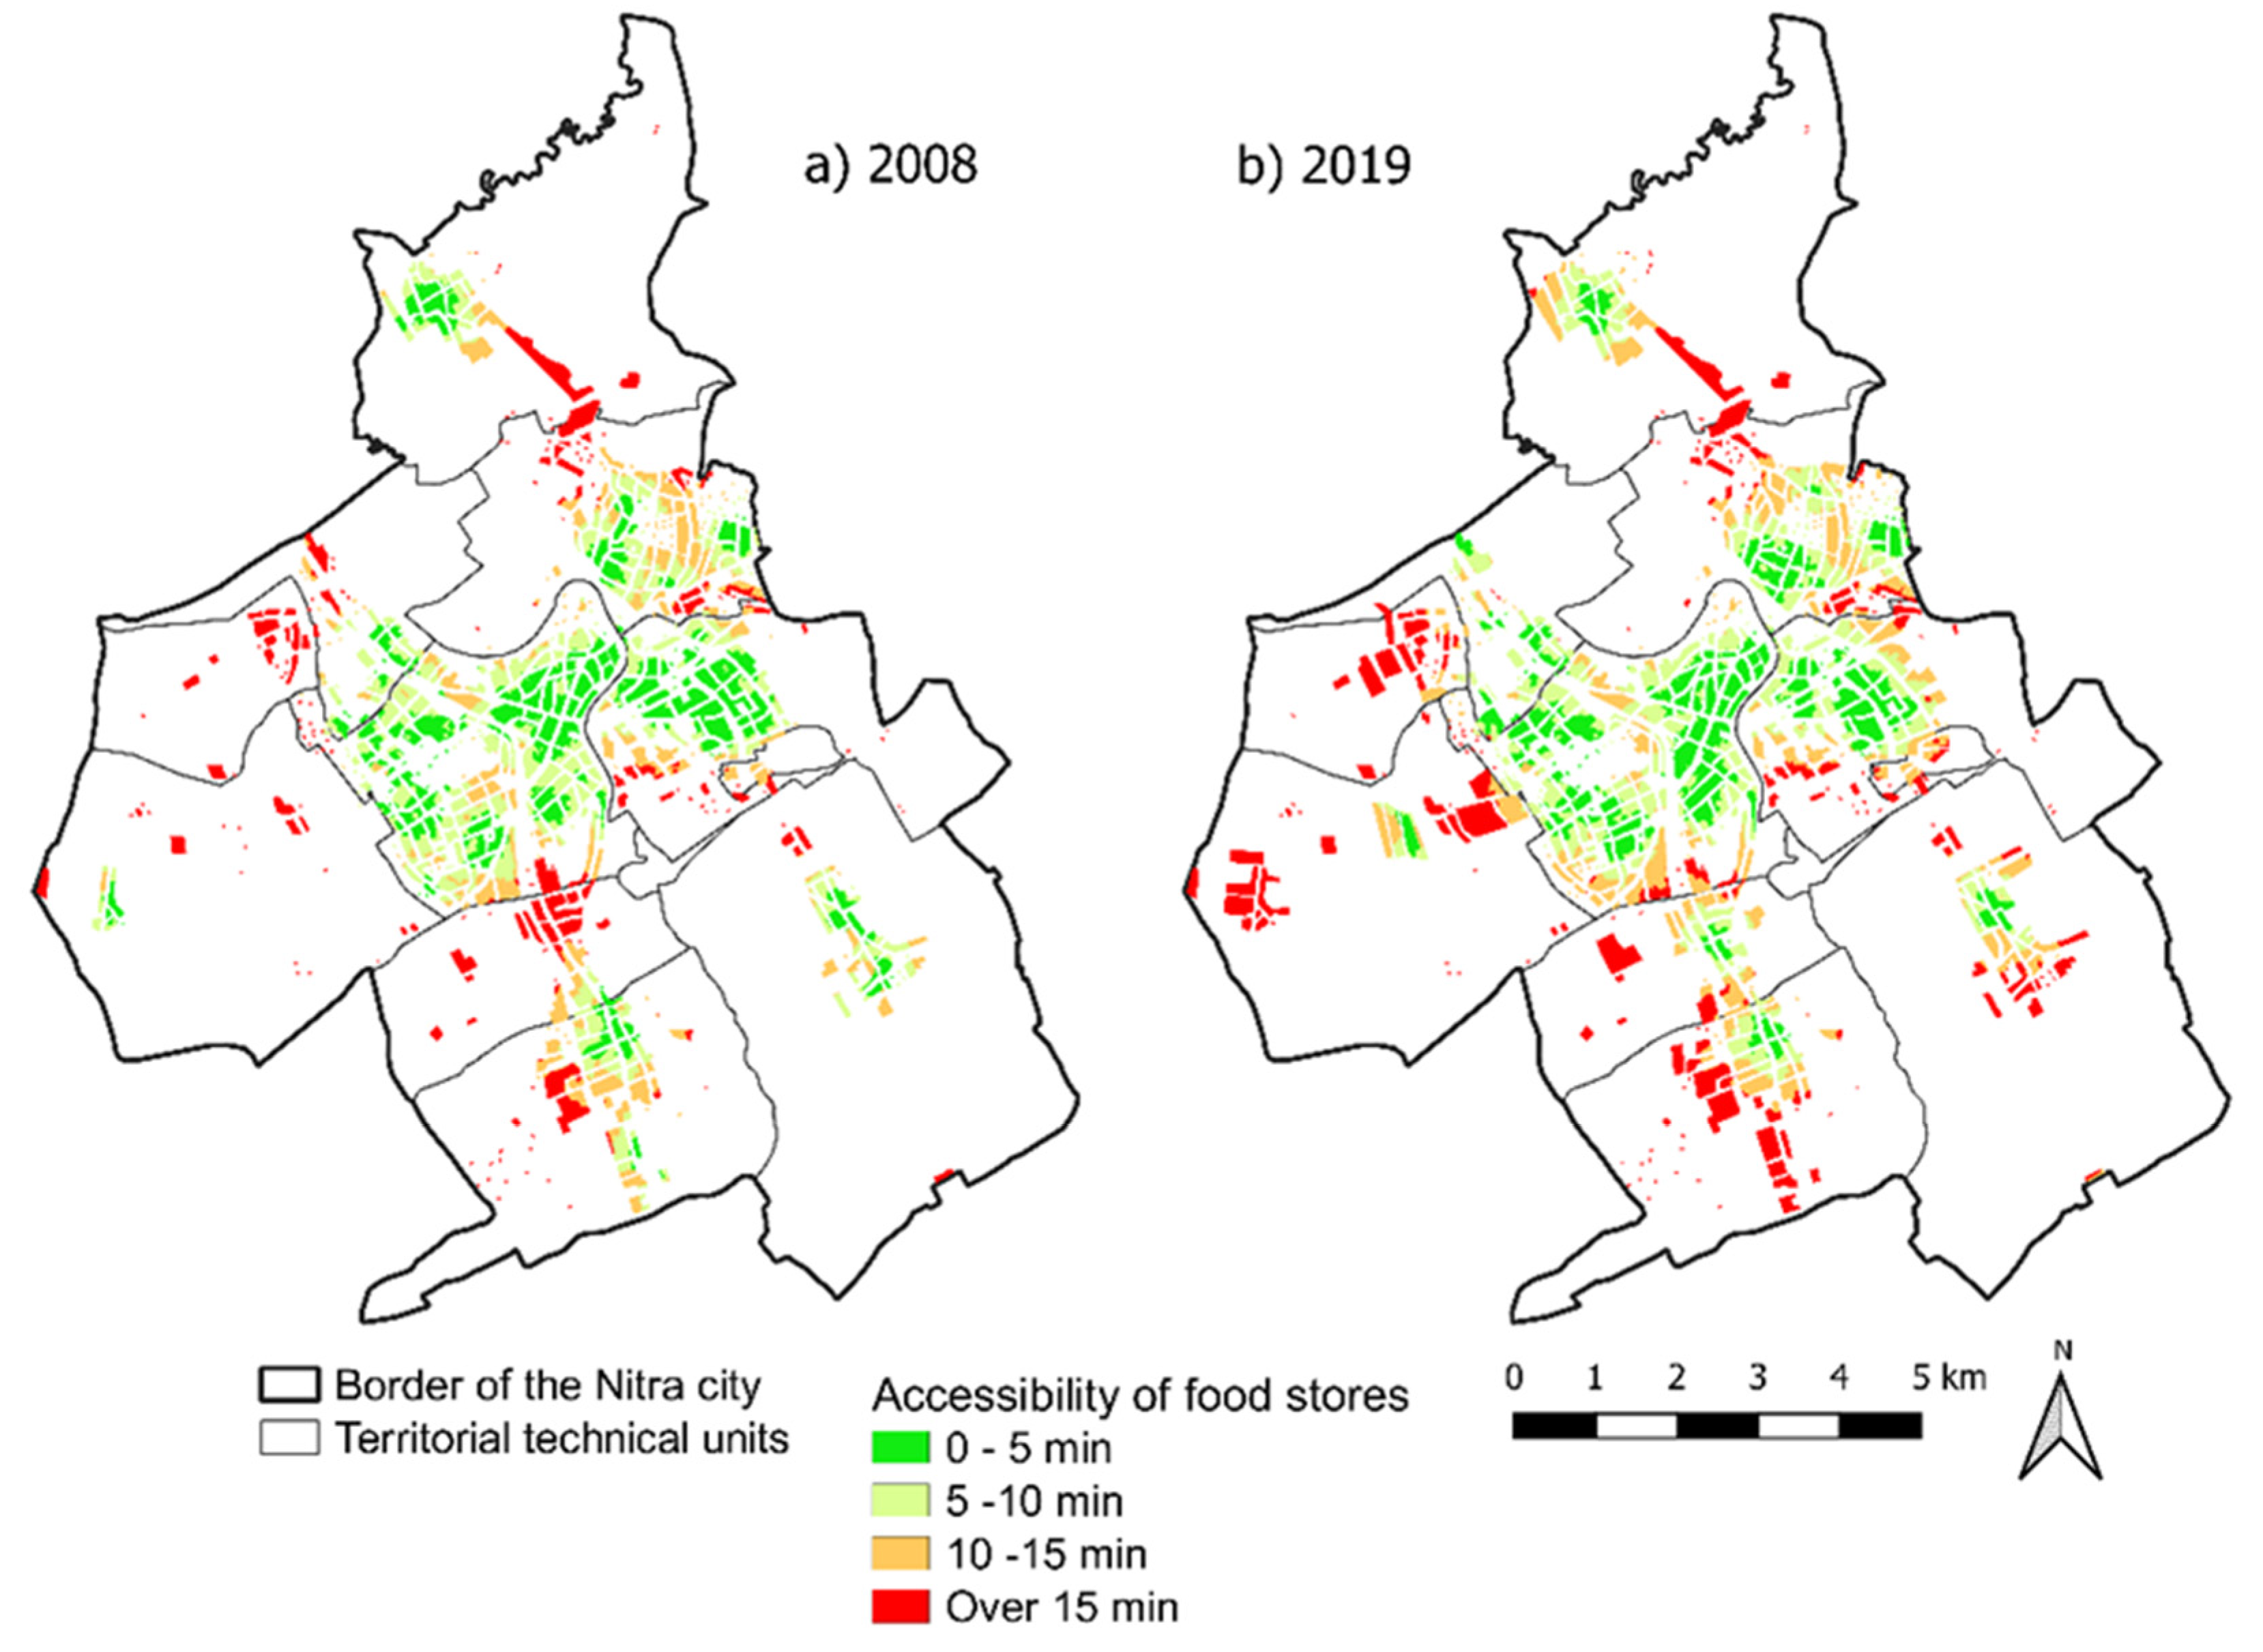
In addition to distance accessibility, we also focused our attention on time accessibility. The best time accessibility to the nearest foodstuffs in both years is in TTU Nitra I in 2008 as well as in 2019 (Figure 3).
The population can buy foodstuffs from 40% of the built-up area within 5 min. TTU Zobor, Mlynárce, Horné Krškany and Kynek belong to the group with a positive development and reduction of food deserts, where the food retail network was denser in 2019. Deterioration was identified in other TTU—Chrenová, Dolné Krškany I and II, Dražovce, Nitra II and Veľké Janíkovce.
On the contrary, on the western and northern periphery the area endangered by the food desert of TTU Kynek, Zobor and Mlynárce decreased. Surprisingly, the situation worsened in TTU Chrenová. Expression of the quartile time availability range to the nearest food stores in the monitored years indicates a slight deterioration in time availability (Figure 4).
The development in the evaluated TTUs was either positive or negative. The situation of 2008 was not repeated in any of the TTUs. The improving trend in accessibility occurred in the TTU Kynek (the minimum availability interval was reduced from 16 min to 8 min, and the farthest values from 56 min to 50). Even parts of the city in contact with the central zone, namely the TTU Mlynárce and Horné Krškany, have improved, but not so significantly. Deterioration of accessibility occurred in other parts of the city, with the worst in TTU Dražovce and Veľké Janíkovce. We were specifically interested in the gentrifying TTU Chrenová and in the traditional business zone with the highest number of retail facilities, Nitra I. Both TTUs have the highest share of elderly citizens [23], which we can evaluate as the most endangered inhabitants of Nitra. In TTU Chrenová, the increase in the minimum time availability was at the level of 1 min and the maximum availability increased by up to 4 min. A similar trend occurred in TTU Nitra I, where the maximum availability increased from 31 to 34 min.
4.2. Food Deserts
The results of the processing confirmed the existence of food deserts in Nitra as early as 2008. In other living areas, large differences can be seen between the different categories of pedestrian accessibility. In the years 2008–2019, the residential zone of the city of Nitra increased by 43.86% (289.75 ha), the area of food deserts by up to 68.75% (120.94 ha), and the number of inhabitants endangered by the food desert increased by 1100 residents, i.e., 23.9% (Table 2).
Positive development, i.e., three TTU Horné Krškany, Nitra I and Kynek had a reduction in food deserts in terms of the affected population.
From a geo-spatial point of view, the reduction of food deserts has a central-western direction in Nitra (Table 3, Figure 3).
In terms of built-up areas, there has been a reduction in food deserts in the TTU Dražovce, Mlynárce, and Chrenová, but the number of affected inhabitants increased as residents (permanent residents) increased in these parts of the city. The proximity to the nearest grocery in Nitra was low (in 2008 median 504 m, 2019 median 623 m, Table 3) and is comparable to the average proximity to supermarkets in Amsterdam (median 686 m, [22]). On the contrary, on the western and northern periphery the areas endangered by the food desert of TTU Kynek, Zobor and Mlynárce decreased. Surprisingly, the situation worsened in TTU Chrenová.
5. Discussion
Food stores, which in the current pandemic belong to the critical infrastructure, should have the highest possible population with an acceptable walking distance. Due to economic progress and the improving economic situation in our geo-space, there is a higher mobility of customers due to the increase in individual car transport.
Until recently most food desert research (e.g., [20,22,40,41], was restricted to a single timestamp, this study compares two years (twelve-year interval), with density and accessibility calculated each year against the current housing structure in 2008 and 2019. A chosen 2008 was the initial year of the financial and economic global crisis, 2019 had not been affected by the ongoing pandemic SARS-CoV-2.
The entry of multinational trade chains into the Slovak market was a significant milestone. Because the food trade is very competitive [42], it quickly creates a strong competitive environment in which many smaller food stores fail.
The accessibility indicators were computed along the street network (e.g., [22]), which is an improvement compared to [35], who simply used Euclidean distances [4]. We agree that local variations in food accessibility within a spatial unit call for micro-geographic analyses at street network level. We agree with the authors of several studies [24,25] that there are methodological flaws in most desert food studies as there was no consensus for unifying the methodologies for the identification of food deserts. The fact that the concept was first articulated by community activists and not academics or policymakers is important; perhaps it explains why there is no single agreed-upon definition of food deserts in an academic context. It also satisfies the identification of the problem as community-driven [43]. The authors of [21] questioned the usefulness of the food desert concept, suggesting we should retire the term to enable a new focus on more nuanced forms; however, there have been few food environment studies in the food retail environment of post-socialist countries. These developments differ diametrically from the Western European retail environment. This study is unique in that it determined accessibility to all grocery stores and did not solely consider supermarkets. The authors of [22] (p. 11) write: “We focused only on supermarkets. Particularly in Amsterdam, small stores selling ethnic groceries are important sources of healthy food. As such, the results may underestimate the overall exposure to healthy food, but also allow better comparability with other studies”. These authors identified the fact that they only worked with supermarkets as a weakness of their study.
Traditional food access measures identify spatial-only food provision gaps [44]. In our study we provide time as a new measure of access. The paper belongs to the group of spatiotemporal food research through micro-geographic analysis at the street network level. A prime contribution of the research is an expression of the number of inhabitants endangered by the food deserts. Micro-level population density data by housing units made it possible to express the set of vulnerable inhabitants with difficult access to food. In recent times the customers have become more mobile, but they are still shopping in small grocery stores near their homes or workplaces.
Based on a comparison of the results of geo-spatial and socio-economic analysis of food deserts and their residents, problems with access to food in two areas of the city are most likely to occur. The first—the southern periphery, represented by the TTU Dolné Krškany I and Veľké Janíkovce, showed in both analyses the largest increase in food deserts, with the highest number of endangered inhabitants (Table 2). The second problem area in relation to the phenomenon of food deserts was profiled in the eastern background of the city center, in the TTU Chrenová. In the 1970s, it was called the “most beautiful settlement” of the socialist bloc towns. It is currently undergoing a process of gentrification, in which middle-class representatives occupy the older inner-city districts originally occupied by the lower-income population [45,46]. This creates new renovated neighborhoods. Sometimes this change means that previous inhabitants can no longer afford to live in these localities, the population is displaced, which is one of the disadvantages of the gentrification process. Elements of gentrification also initiate the observed average monthly income per 1 member of households, which increased by 47% (from 248 € in 2008 to 365 € in 2019). The food deserts increased spatially by 0.91%, but the risk to residents increased by 176%. Studies from 2008 and 2014 confirmed [47,48] the change in the mode of transport after purchases. While in 2008 14% of respondents were transported by car, in 2014 this figure increased by 50% to 21%.
6. Conclusions
The main goal of the study was met and the research carried out made it possible to determine the spatial differentiation of food deserts in a twelve years period. The result of the comparison is information on time availability to grocery stores and the identification of problem areas. As the Nitra population ages, it is necessary to identity a deterioration in the availability of basic foodstuffs as a priority for parts of the city with an older population. New residential parts of the city do not have civic amenities and public transit, which forces these residents to use the private means of transport.
Both hypotheses were confirmed. Food deserts have been present in the city of Nitra since 2008. Residents identify with this and are moving to new residential zones, despite the fact that they will have reduced accessibility to grocery stores. During the years 2008–2019, the residential zone of the city of Nitra increased by 43.86%, the area of food deserts by up to 68.78% and the number of inhabitants endangered by the food desert increased by 1100 residents, i.e., 23.9%. In 2008, 5.51% of Nitra’s residents lived in a food desert, and in approximately twelve years this percentage increased to 7.45% of the population (2019). The proximity to the nearest groceries in Nitra was 2008 median 504 m, in 2019 median 623 m. Current data on the accessibility of grocery and the occurrence of food deserts in Nitra are an important basis for the decision of the municipality in regard to the construction of new residential housing, roadways or other commercial establishments. This kind of information can be relevant not only for the city’s residents, but also for the business community, especially for potential developers. It can also be used effectively in the spatial planning process, in the rational management of complex territorial development, as well as in local politics. Given the character of the city of Nitra, it can be assumed that the acquired knowledge can be extrapolated to other post-socialist cities of a similar size and hierarchical level.
Author Contributions
Conceptualization: M.T. and I.J.; Methodology: M.T. and I.J.; Validation: M.T. and I.J.; Formal analysis: M.T. and I.J.; Investigation M.T.; Resources: M.T. and I.J.; Data curation: M.T. and I.J.; Writing—original draft preparation: M.T.; Writing—review and editing: M.T. and I.J.; Supervision: M.T.; Project administration: M.T. and I.J.; Funding acquisition: I.J.; Data collection: M.T. and I.J. Both authors have read and agreed to the published version of the manuscript.
Funding
This research was funded by the Scientific Grant Agency of the Ministry of Education, Science, Research and Sport of the Slovak Republic, and the Slovak Academy of Sciences, the Slovak Research and Development Agency, and the European Union’s research and innovation funding program.
Institutional Review Board Statement
Not applicable.
Informed Consent Statement
Not applicable.
Data Availability Statement
Not applicable.
Acknowledgments
This scientific article was prepared as a part of the VEGA No. 1/0245/21 project “Implementation of the New EU Food Strategy in the Food Chain in Slovakia”, KEGA 026UKF-4/2020 (Siphonapterology modernly and illustratively, SIMONA) of the APVV-18-0185 project “Land-use changes of Slovak cultural landscape and prediction of its further development”, and with support from the H2020 project “Linking Science and Innovation for Gender Equality”.
Conflicts of Interest
The authors declare no conflict of interest.
References
- Trembošová, M.; Dubcová, A.; Nagyová, Ľ.; Cagáňová, D. Development of retail network on the example of three regional towns comparison in West Slovakia. Wirel. Netw. 2020, 26, 1–11. [Google Scholar] [CrossRef]
- Guy, C.; Clarke, G.; Eyre, H. Food retail change and the growth of food deserts: A case study of Cardiff. Int. J. Retail. Distrib. Manag. 2004, 32, 72–88. [Google Scholar] [CrossRef]
- Cummins, S.; Macintyre, S. “Food deserts” evidence and assumption in health policy making. BMJ 2002, 325, 436–438. [Google Scholar] [CrossRef]
- Apparicio, P.; Cloutier, M.S.; Shearmur, R. The case of Montreal’s missing food deserts: Evaluation of accessibility to food supermarkets. Int. J. Health Geogr. 2007, 6, 4. [Google Scholar] [CrossRef] [PubMed] [Green Version]
- Jiao, J.; Moudon, A.V.; Ulmer, J.; Hurvitz, P.M.; Drewnowski, A. How to identify food deserts: Measuring physical and economic access to supermarkets in King County, Washington. Am. J. Public Health 2012, 102, e32–e39. [Google Scholar] [CrossRef] [PubMed]
- Gregory, D.; Johnston, R.; Pratt, G.; Watts, M.J. The Dictionary of Human Geography, 5th ed.; Wiley-Blackwel: West Sussex, UK, 2009. [Google Scholar]
- Beaulac, J.; Kristjansson, E.; Cummins, S. A systematic review of food deserts, 1966–2007. Prev. Chronic Dis. 2009, 6, 105. [Google Scholar]
- Križan, F.; Bilková, K.; Kita, P.; Horňák, M. Potential food deserts and food oases in a post-communist city: Access, quality, variability and price of food in Bratislava-Petržalka. Appl. Geogr. 2015, 62, 8–18. [Google Scholar] [CrossRef]
- Wiśniewski, S. Dostepność mieszkańców województwa Łódzkiego do sklepów wielkopowierzchniowych. Acta Univ. Lodz. Folia Geogr. Socio Oeconomica 2016, 23, 25–38. [Google Scholar] [CrossRef]
- Widener, M.J. Spatial access to food: Retiring the food desert metaphor. Physiol. Behav. 2018, 193, 257–260. [Google Scholar] [CrossRef] [PubMed]
- Furey, S.; Farley, H.; Strugnell, C.H. An investigation into the availability and economic accessibility of food items in rural and urban areas of Northern Ireland. Int. J. Consum. Stud. 2002, 26, 313–321. [Google Scholar] [CrossRef]
- Shaw, H. “Food Deserts” Depriving Towns of Fresh Fruit and Vegetables; Hickman, M., Ed.; The Independent Print Ltd.: London, UK, 2007. [Google Scholar]
- Fertaľová, J.; Szczyrba, Z. Globalization in Czech and Slovak retail: Common and specific features. In Globalization and Its Impact on Society, Regions and States; Baar, V., Ed.; University of Ostrava: Ostrava, Czech Republic, 2006; pp. 164–172. [Google Scholar]
- Križan, F.; Tolmáči, L.; Lauko, V. Identification of food deserts in Bratislava city by application of accessibility measures. J. Econ. 2008, 56, 959–972. [Google Scholar]
- Spilková, J.; Syrovátková, M.; Šifta, M.; Strnadel, Š.; Vágner, J.; Fialová, D. Alternativní Potravinové Sítě: Česká Cesta, 1st ed.; Karolinum: Praha, Czech Republic, 2016; pp. 72–73. [Google Scholar]
- Trembošová, M.; Vlačuhová, V.; Jakab, I. Accessibility of retail stores in the Nitra self-governing region. In 20. Mezinárodní Kolokvium o Regionálnych Vědách; Masarykova Univerzita: Brno, Czech Republic, 2017; pp. 582–589. [Google Scholar]
- Inagami, S.; Cohen, D.A.; Finch, B.K.; Asch, S.M. You are where you shop: Grocery store location, weight and neighborhoods. Am. J. Prev. Med. 2006, 31, 10–17. [Google Scholar] [CrossRef] [PubMed]
- Russel, S.E.; Heidkamp, C.P. “Food desertification”: The loss of a major supermarket in New Haven, Connecticut. Appl. Geogr. 2011, 31, 1197–1209. [Google Scholar] [CrossRef]
- Charreire, H.; Casey, R.; Salze, P.; Simon, C.; Chaix, B.; Banos, A.; Badariotti, D.; Weber, C.; Oppert, J.M. Measuring the food environment using geographical information systems: A methodological review. Public Health Nutr. 2010, 13, 1773–1785. [Google Scholar] [CrossRef] [PubMed]
- Bilková, K.; Križan, F.; Horňák, M.; Barlík, P.; Kita, P. Comparing two distance measures in the spatial mapping of food deserts: The case of Petržalka, Slovakia. Morav. Geogr. Rep. 2015, 5, 95–103. [Google Scholar] [CrossRef] [Green Version]
- Widener, M.J.; Farber, T.; Tijs, N.; Horner, M. Spatiotemporal accessibility to supermarkets using public transit: An interaction potential approach in Cincinnati, Ohio. J. Transp. Geogr. 2015, 42, 72–83. [Google Scholar] [CrossRef] [Green Version]
- Helbich, M.; Schadenberg, B.; Hagenauer, J.; Poelman, M. Food deserts? Healthy food access in Amsterdam. Appl. Geogr. 2017, 83, 1–12. [Google Scholar] [CrossRef]
- Wagner, J.; Hinton, L.; McCordic, C.; Owour, S.; Capron, G.; Arellano, S.G. Do Urban Food Deserts Exist in the Global South? An Analysis of Nairobi and Mexico City. Sustainability 2019, 11, 1963. [Google Scholar] [CrossRef] [Green Version]
- Lamb, K.; Thorton, L.E.; Cerin, E.; Ball, K. Statistical approaches used to assess the equity of access to food outlets: A systematic review. AIMS Public Health 2015, 2, 358–401. [Google Scholar] [CrossRef] [PubMed] [Green Version]
- Wang, H.; Tao, L.; Qiu, F.; Lu, W. The role of socio-economic status and spatial effects on fresh food access: Two case studies in Canada. Appl. Geogr. 2016, 67, 27–38. [Google Scholar] [CrossRef]
- Spilková, J. Geografie Maloobchodu a Spotřeby: Věda o Nakupování, 1st ed.; Karolinum: Praha, Czech Republic, 2012; p. 32. [Google Scholar]
- QGIS. QGIS Geographic Information System. QGIS Association. Available online: http://www.qgis.org (accessed on 10 January 2021).
- Minn, M.; QGIS. Describes Use of MMQGIS, a Set of Python Vector Map Layer Plugins for Quantum GIS. 2021. Available online: http://michaelminn.com (accessed on 16 May 2021).
- GRASS Development Team: Geographic Resources Analysis Support System (GRASS) Software, Version 7.8.0. Open Source Geospatial, Foundation. Available online: http://grass.osgeo.org (accessed on 12 February 2021).
- Moore, L.V.; Roux, A.V.; Brines, S. Comparing perception-based and geographic information system (GIS)-based characterizations of the local food environment. J. Urban Health 2008, 85, 206–216. [Google Scholar] [CrossRef] [PubMed] [Green Version]
- Guagliardo, M.F. Spatial accessibility of primary care: Concepts, methods and challenges. Int. J. Health Geogr. 2004, 3, 1–3. [Google Scholar] [CrossRef] [PubMed] [Green Version]
- Goliszek, S. Udział transportu zbiorowego w poprawie dostępności do usług w Gdyni. Pr. Kom. Geogr. Komun. PTG 2017, 20, 36–49. [Google Scholar]
- Goliszek, S.; Połom, M.; Duma, P. Potential and cumulative accessibility of workplaces by public transport in Szczecin. Bull. Geogr. Socio Econ. Ser. 2020, 50, 133–146. [Google Scholar] [CrossRef]
- Openstreetmap. Available online: https://www.openstreetmap.org (accessed on 12 February 2021).
- Cushon, J.; Creighton, T.; Kershaw, T.; Marko, J.; Markham, T. Deprivation and food access and balance in Saskatoon, Saskatchewan. Chronic Dis. Inj. Can. 2013, 33, 146–159. [Google Scholar] [CrossRef] [PubMed]
- Apparicio, P.; Abdelmajid, M.; Riva, M.; Shearmur, R. Comparing alternative approaches to measuring the geographical accessibility of urban health services: Distance types and aggregation-error issues. Int. J. Health Geogr. 2008, 7, 1–14. [Google Scholar] [CrossRef] [PubMed] [Green Version]
- Statistical Office of the Slovak Republic. Available online: http://datacube.statistics.sk/#!/view/sk/VBD_DEM/om7008rr/v_om7008rr_00_00_00_sk (accessed on 20 May 2021).
- Buček, J.; Bleha, B. Urban Shrinkage as a Challenge to Local Development Planning in Slovakia. Morav. Geogr. Rep. 2013, 21, 2–15. [Google Scholar] [CrossRef] [Green Version]
- Haase, A.; Rink, D.; Grossmann, K. Shrinking Cities in Post-socialist Europe: What Can We Learn From Their Analysis for Theory Building Today. Geogr. Ann. Ser. B Hum. Geogr. 2016, 98, 305–319. [Google Scholar]
- Lu, W.; Qiu, W. Do food deserts exist in Calgary, Canada? Can. Geogr. 2015, 59, 267–282. [Google Scholar] [CrossRef]
- Zenk, S.; Schulz, A.; Israel, B.; James, S.; Bao, S.; Wilson, M. Neighborhood racial composition, neighborhood poverty and the spatial accessibility of supermarkets in metropolitan Detroit. Am. J. Public Health 2005, 95, 660–667. [Google Scholar] [CrossRef] [PubMed]
- Huddleston, P.; Whipple, J.; Natick, R.J.; Lee, S.J. Customer satisfaction in food retailing: Comparing specialty and conventional grocery stores. Int. J. Retail. Distrib. Manag. 2009, 37, 63–80. [Google Scholar] [CrossRef]
- Battersby, J. The Food Desert as a Concept and Policy Tool in African Cities: An Opportunity and a Risk. Sustainability 2019, 11, 458. [Google Scholar] [CrossRef] [Green Version]
- Chen, X.; Clark, J. Measuring space-time access to food retailers: A case of temporal access disparity in Franklin county, Ohio. Prof. Geogr. 2016, 68, 175–188. [Google Scholar] [CrossRef]
- Granath, H. Gentrifiering Bortom Staden: En Undersökning av ett Fiskeläge Statt i Förändring; Lunds Universitet: Lund, Sweden, 2014; pp. 49–71. Available online: https://lup.lub.lu.se/luur/download?func=downloadFile&recordOId=8875150&fileOId=8877184 (accessed on 21 April 2021).
- Featherstone, M. Consumer Culture and Postmodernism, 2nd ed.; SAGE Publications Ltd.: London, UK, 2007; pp. 51–52. Available online: https://books.google.sk/books?hl=sk&lr=&id=czfeN2hV6xIC&oi=fnd&pg=PR7&dq=/ (accessed on 21 April 2021).
- Trembošová, M.; Dubcová, A. Vývoj maloobchodu v Nitre v nových trhových podmienkach. Acta Geogr. Univ. Comen. 2013, 57, 213–230. [Google Scholar]
- Trembošová, M.; Dubcová, A.; Kramáreková, H. Consumer shopping behaviour in the Nitra city. In International Scientific Days 2016: The Agri-Food Value Chain: Challenges for Natural Resources Management and Society; SPU: Nitra, Slovakia, 2016; pp. 836–849. [Google Scholar]
Figure 1.
Study area.
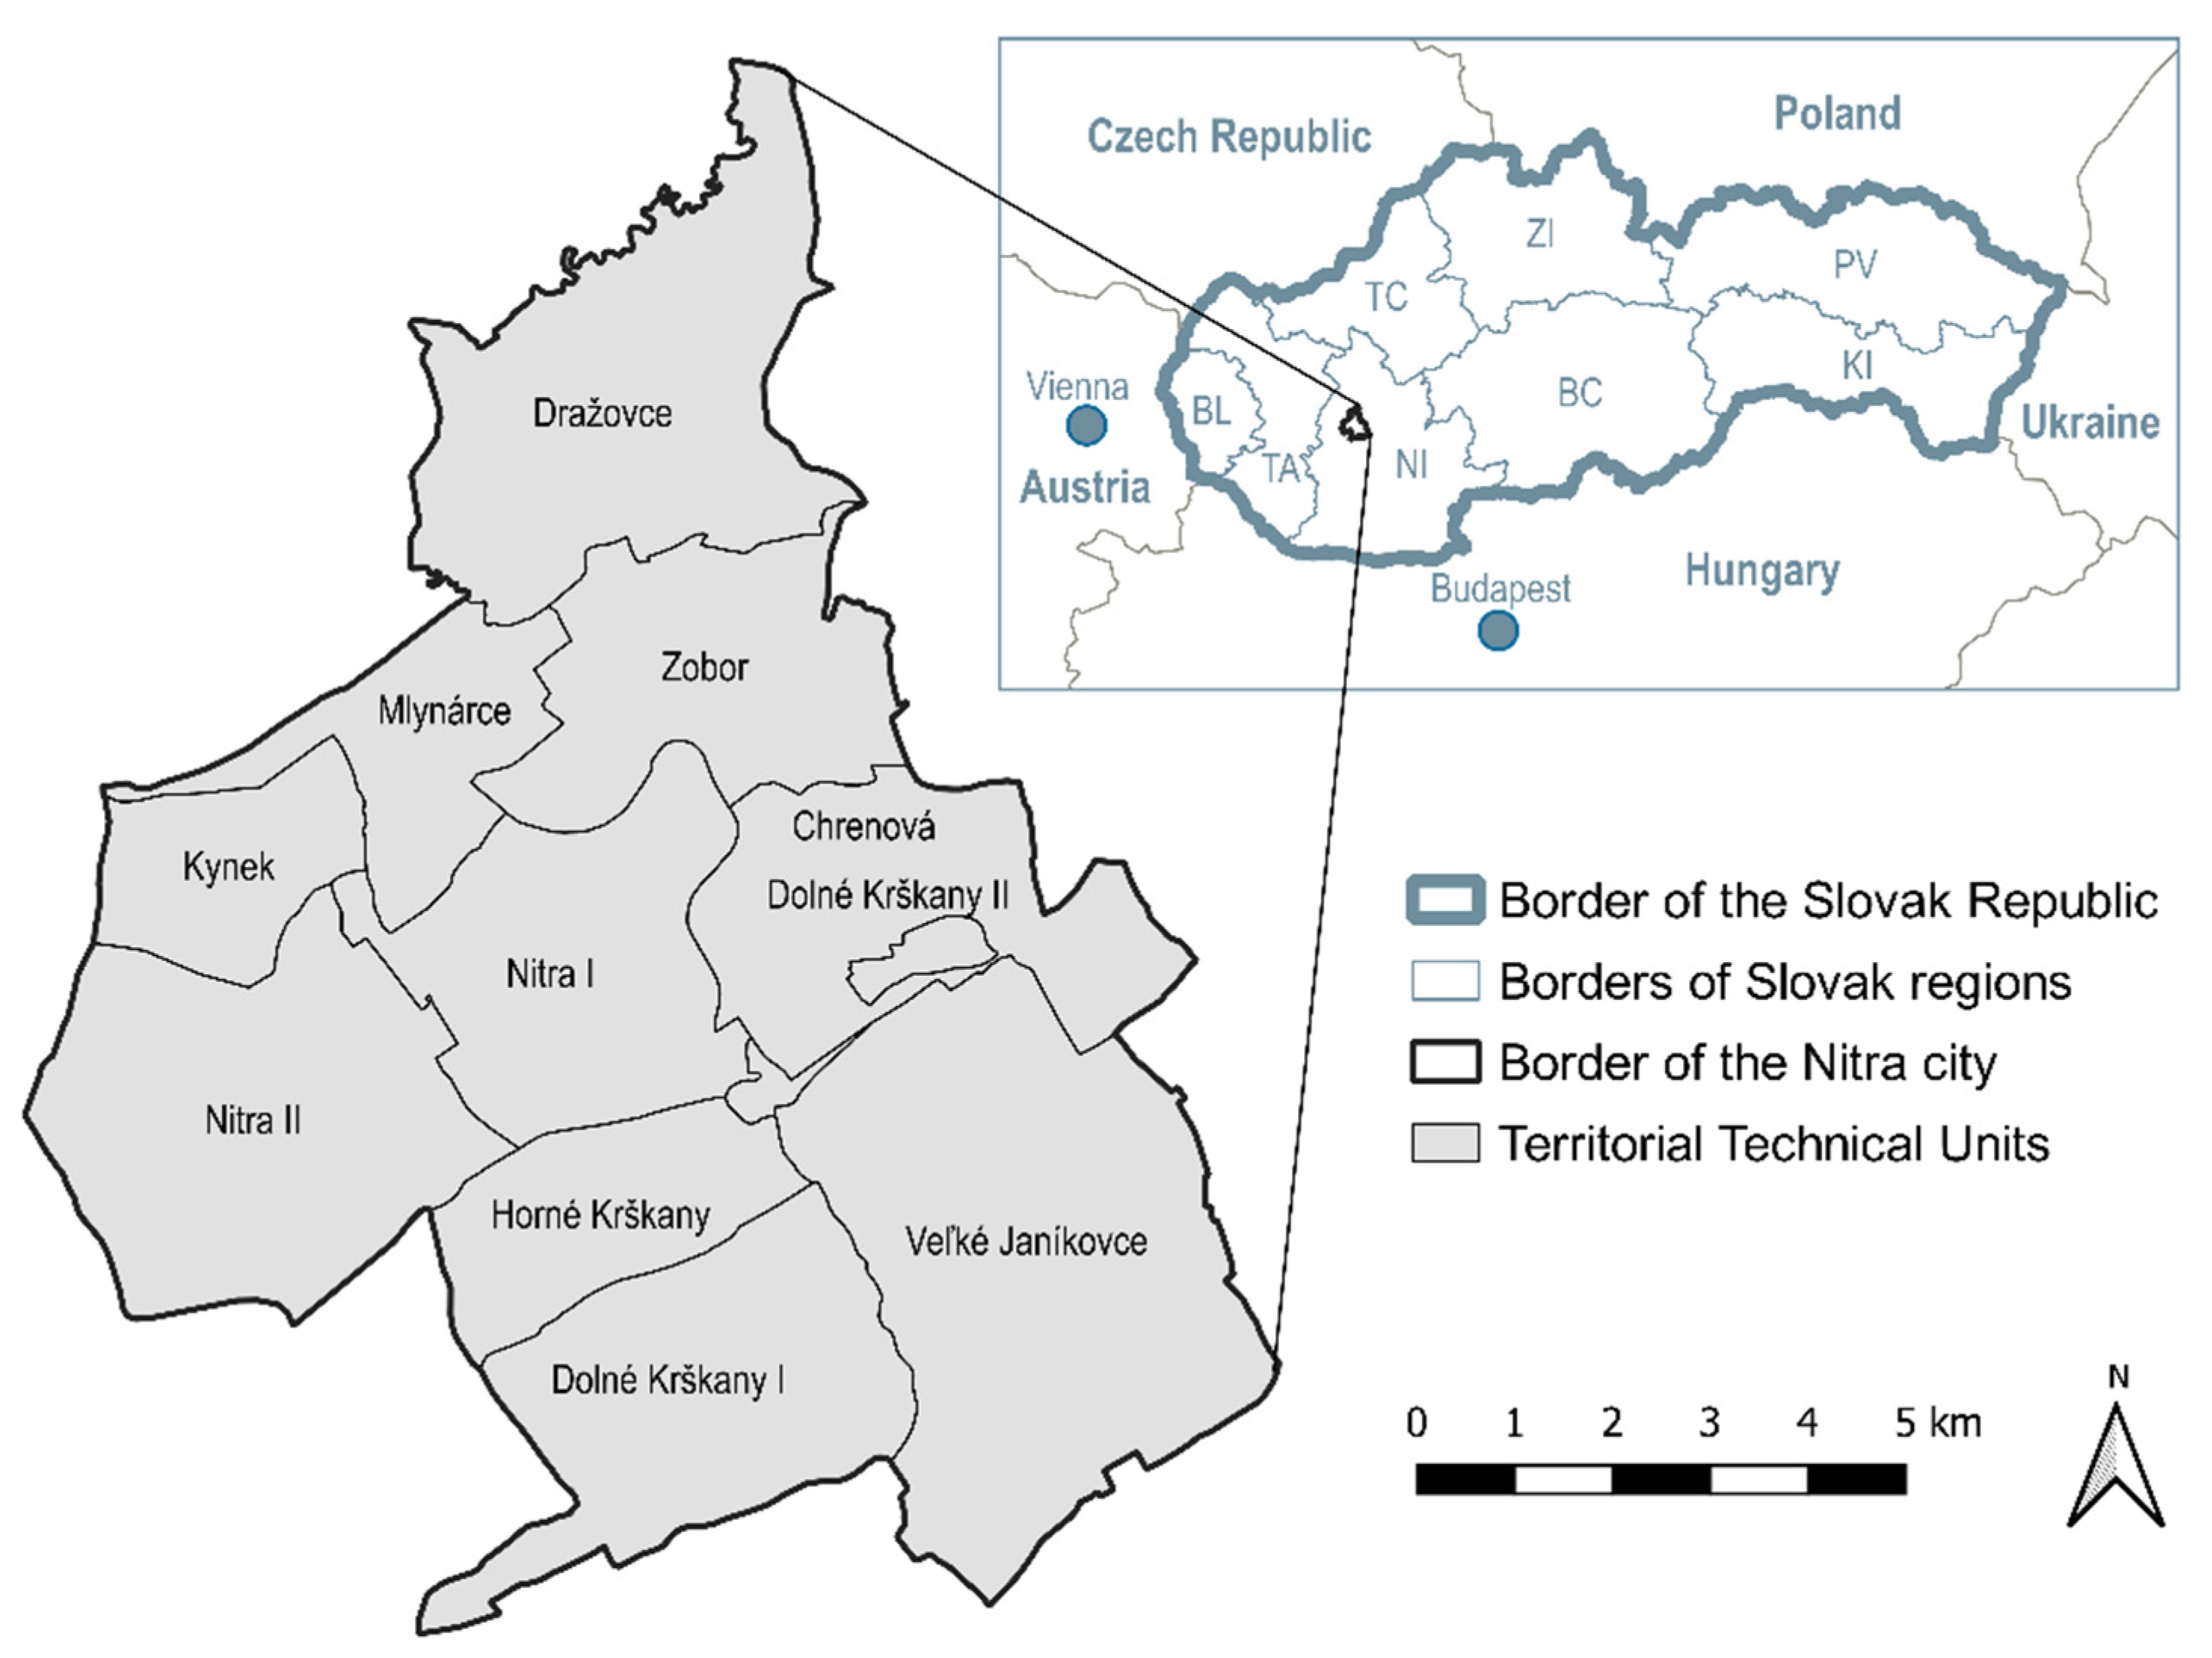
Figure 2.
(a) Kernel density of food stores and its share of the built–up area in individual TTUs in 2008; (b) Kernel density of food stores and its share of the built–up area in individual TTUs in 2019; (c) Kernel density of food stores and its share of the built–up area in individual TTUs in 2008 and 2019.

Figure 3.
(a) Accessibility to the nearest grocery (in minutes) and the share of the built–up area in individual TTUs in 2008; (b) Accessibility to the nearest grocery (in minute) and the share of the built–up area in individual TTUs in 2019; (c) Accessibility to the nearest grocery (in minutes) and the share of the built–up area in individual TTUs in 2008 and 2019.


Figure 4.
(a) Quartile range of time availability of the population to the nearest food stores in 2008; (b) Quartile range of time availability of the population to the nearest food stores in 2019.
Figure 4.
(a) Quartile range of time availability of the population to the nearest food stores in 2008; (b) Quartile range of time availability of the population to the nearest food stores in 2019.


Table 1.
Selected characteristics of the inhabitants of the city Nitra and Slovakia.
| Ageing Index in % | Average Age | Pensioners Share in % | ||||
|---|---|---|---|---|---|---|
| 2008 | 2019 | 2008 | 2019 | 2008 | 2019 | |
| Nitra | 90.70 | 134.4 | 39.26 | 42.94 | 11.81 | 19.33 |
| Slovakia | 78.26 | 104.8 | 38.25 | 41.06 | 12.09 | 16.58 |
Source: [37].
Table 2.
Selected characteristics of food desert at TTU level.
| Territorial Technical Unit (TTU) | Area TTU (ha) | Built-Up Area (ha) | Area (ha) of Food Deserts | Food Desert/Built-Up Area % | I/D % | Inhabitants in Food Desert | I/D % | ||||
|---|---|---|---|---|---|---|---|---|---|---|---|
| 2008/19 | 2008 | 2019 | 2008 | 2019 | 2008 | 2019 | 2008 | 2019 | |||
| D. Krškany I | 1083.32 | 125.89 | 130.73 | 22.55 | 64.21 | 17.91 | 49.12 | +31.21 | 311 | 1011 | +225 |
| D. Krškany II | 63.45 | 10.45 | 18.58 | 3.13 | 6.73 | 29.95 | 36.22 | +6.27 | 28 | 39 | +39 |
| H. Krškany | 567.41 | 35.48 | 43.74 | 28.56 | 5.60 | 80.50 | 12.8 | −67.7 | 1051 | 371 | −65 |
| Dražovce | 1344.01 | 22.45 | 89.94 | 15.40 | 16.34 | 67.35 | 18.17 | −49.18 | 217 | 246 | +13 |
| Zobor | 863.32 | 182.63 | 141.63 | 30.30 | 31.16 | 16.50 | 22.10 | +5.51 | 971 | 981 | +1 |
| Nitra I | 970.69 | 61.69 | 119.37 | 11.83 | 12.67 | 19.18 | 10.63 | −8.55 | 388 | 295 | −24 |
| Nitra II | 1349.41 | 29.46 | 114.40 | 17.20 | 75.84 | 57.77 | 66.29 | +8.52 | 697 | 769 | +10 |
| Mlynárce | 531.21 | 31.23 | 43.42 | 10.30 | 0.42 | 32.12 | 0.97 | −31.15 | 11 | 57 | +418 |
| Kynek | 441.97 | 18.73 | 44.81 | 18.27 | 34.37 | 97.54 | 76.70 | −20.84 | 658 | 517 | −21 |
| Chrenová | 901.08 | 79.35 | 123.31 | 14.64 | 21.63 | 18.45 | 17.54 | −0.91 | 142 | 392 | +176 |
| V. Janíkovce | 1896.82 | 63.20 | 80.38 | 4.83 | 27.93 | 7.64 | 34.75 | +27.11 | 128 | 1024 | +700 |
| Nitra | 10012.69 | 660.56 | 950.31 | 175.9 | 296.84 | 26.63 | 31.24 | +4.61 | 4602 | 5702 | +23.9 |
I/D: increase/decrease %; D. Krškany: Dolné Krškany; H. Krškany: Horné Krškany; V. Janíkovce: Veľké Janíkovce.
Table 3.
Descriptive statistics.
| Year | Min. | Max | Range | Mean | Mean of Absolute Values | Standard Deviation | Variance |
|---|---|---|---|---|---|---|---|
| 2008 | 0 | 4411 | 4411 | 659.855 | 659.855 | 542.301 | 294090 |
| 2019 | 0 | 4455 | 4455 | 800.955 | 800.955 | 652.153 | 425303 |
| Variation coefficient | Sum | 1st quartile | Median | 3rd quartile | 90th percentile | ||
| 2008 | 82.1848% | 317885287 | 275 | 504 | 859 | 1473 | |
| 2019 | 81.4219% | 454728023 | 331 | 623 | 1045 | 1712 |
Publisher’s Note: MDPI stays neutral with regard to jurisdictional claims in published maps and institutional affiliations. |
© 2021 by the authors. Licensee MDPI, Basel, Switzerland. This article is an open access article distributed under the terms and conditions of the Creative Commons Attribution (CC BY) license (https://creativecommons.org/licenses/by/4.0/).
Share and Cite
MDPI and ACS Style
Trembošová, M.; Jakab, I. Spreading of Food Deserts in Time and Space: The Case of the City of Nitra (Slovakia). Sustainability 2021, 13, 7138. https://doi.org/10.3390/su13137138
AMA Style
Trembošová M, Jakab I. Spreading of Food Deserts in Time and Space: The Case of the City of Nitra (Slovakia). Sustainability. 2021; 13(13):7138. https://doi.org/10.3390/su13137138
Chicago/Turabian StyleTrembošová, Miroslava, and Imrich Jakab. 2021. "Spreading of Food Deserts in Time and Space: The Case of the City of Nitra (Slovakia)" Sustainability 13, no. 13: 7138. https://doi.org/10.3390/su13137138
Note that from the first issue of 2016, this journal uses article numbers instead of page numbers. See further details here.