Abstract
The Paris Agreement requires radical action across all policy sectors and at all scales of government. This paper argues that without a clear framework for sectoral budget setting which takes account of interactions across spatial scales, incoherent and inadequate policy responses will result. Using a case study of the transport sector within the UK, which has committed to a zero carbon pathway in law, we look at three key elements which have to be considered in setting out a new framework: budget coherence, accounting coherence and policy coherence. Using top-down and bottom-up examples emerging from practices today in the UK, we demonstrate that there are no ‘optimal’ solutions but a set of choices, all of which appear to be better than the patchwork of approaches emerging in the absence of a framework. A multi-scalar approach is essential as transport crosses spatial boundaries and the policy system places different levers at different scales. Transparency will be beneficial for honesty with the public and the difficult politics this rapid transition necessitates. It will also mitigate against blame shifting across governments between and within scales and the resultant inaction which characterized the previous decade of supposed ‘climate action’.
Keywords:
Paris Agreement; carbon budgets; transport; governance; carbon accounting; climate change; scalar; top-down; bottom-up 1. Introduction
The past three decades have seen increasing political recognition of the need to reduce global cumulative carbon emissions and a science-led ratcheting up of the stringency of carbon budgets which are consistent with limiting global warming [1,2]. This has also been a period in which the pace of action has yet to match the political commitments to act [3,4]. To meet the challenge of the climate crisis requires rapid and difficult actions across all scales of government. To date, a reluctance to break commitments down by sector or spatial scale has resulted in a patchwork framework which enables blame shifting and incrementalism [5,6]. In this paper, we look at three key elements which have to be considered in setting out a new framework: budget coherence, accounting coherence and policy coherence. Using top-down and bottom-up examples emerging from practices today in the UK, we demonstrate that there are no ‘optimal’ solutions due to the multi-scalar nature of the problem and the mismatch of policy competencies to the spatial governance scale. This paper concludes that coordination across scales can be facilitated through addressing the three components of coherence, and without this, the difficult political decisions that the climate crisis demands are more likely to remain unresolved.
The accounting and accountability frameworks set up by the United Nations Framework Convention on Climate Change (UNFCCC) are all based around national territorial responsibilities. The 2015 Paris Agreement commits “to holding the global increase in global average temperatures to well below 2 °C” and to seeking to limit the rise to 1.5 °C [7]. The science underpinning what comprises a safe budget is continuously evolving [2]. For any given budget, however, the process of allocating responsibility for the global carbon budget to the different national territories has long been identified as being “as much a political as a scientific issue” [8]. Such concerns also matter within national territories, and this is the focus of this paper.
This paper is based on an analysis of the United Kingdom (UK). The UK government has set a UK-wide target under the Climate Change Act 2008 and Climate Change Act 2008 (2050 Target Amendment). The latest amendment, ratified in 2019, adds a commitment to cutting emissions by 100% by 2050 (from 1990 levels), with a series of five-year budget periods set along the route. Previous research has shown that the presence of ambitious targets (80% reductions at that time) served as a ‘lodestar’ to point actors in a new direction but offered little in the way of structure to stimulate change [9]. However, a 100% reduction goal should change the nature of the debate from what is to be included in the emissions reduction goals to ‘by when?’ and ‘how?’ as all sectors are, de facto, critical. The policy position has now effectively moved beyond arguments about whether sectoral target setting is a good idea [10,11].
The UNFCCC process is a top-down territorial allocation process, and in the UK, the government has refused to consider allocating responsibilities to jurisdictions below that of the devolved nations (Scotland, Wales and Northern Ireland). In parallel with and in contrast to the top-down UNFCCC process, there is a vibrant local response to the climate crisis at a local scale, with climate emergencies declared in an estimated 1910 jurisdictions and local governments across the world (which, combined, would represent over 826 million citizens) [12]. This is true too in the UK, with 74% of local authorities estimated to have declared climate emergencies by February 2021 [13]. Local action and political engagement must be part of any rapid transition [14]. The key point here is that there is a multi-scalar response to the climate crisis unfolding in a way which is not being coordinated.
This paper uses the transport sector to demonstrate why this lack of coordination matters and how the concerns which exist at an international scale about how to assign budgets and responsibility also play out strongly in subnational policy systems. The transport sector is selected, as it is both the largest contributor to climate emissions [15] in the UK and also one which evidently crosses different scalar governance boundaries. To illustrate the nature of the coordination challenge, a sample of 183 (of the 300) climate emergencies declared in the UK in October 2020 were reviewed, which revealed the following:
- Only 38% of authorities had declared an emergency with no target or pathway;
- Only 15% of authorities were in the process of setting targets;
- Only 47% of authorities had set a target. However, of these, 41% were for emissions only by the local authority’s own activities, with 59% being area-wide targets;
- Only 8% set targets for the transport sector.
What lies behind this piecemeal approach is not clear. For some authorities, the race to declare the earliest date for zero emissions across local authorities has been likened to “exercises in vanity” with the targets helping “politicians to be seen to be doing something when actually they are not” [16] (p. 65). For others, undoubtedly there are still debates about what accounting method to use, what physical boundaries to use and what system boundaries are applied [17,18,19], which provide a shield for inaction. The lack of clear recognition of the need for multi-scalar allocation of emissions responsibilities is allowing an incoherent approach to unfold.
In this paper, we attempt to resolve the issue of how to achieve coherence across different spatial governance scales. The OECD identifies a key aspect of policy coherence as being the establishment of effective governance mechanisms “to address policy interactions… and align actions between levels of government” [20] (p. 4). In this paper, we expand the notion of coherence to three different aspects which we see as necessary for effective carbon governance:
- Budget coherence: Are the budgets aligned across authorities and scales?
- Accounting coherence: What gets counted where?
- Policy coherence: How are budgets aligned with the capacity to act?
We demonstrate that the components of coherence do not all align in some optimal solution. Where budget coherence is at its greatest does not map well to where policy coherence is at its greatest. We know that the current institutional structures are undoubtedly not well matched to tackling wicked problems such as climate change [21]. However, institutional structures are also quite rigid, and policy siloes are difficult to change [22,23], so urgent action can only be enacted through the institutions we have. Even if governance reform were on the table, there would be tensions between the categories of coherence under any configuration. We argue then for a pragmatic approach to enable recognition of the importance of finding a multi-scalar solution and to choosing a way forward.
This paper proceeds as follows. First, we set out the data sources and methods we use to support the analysis, which we use to resolve our arguments on coherence in Section 2. In Section 3, we look at the international to national translation of what the Paris Agreement means for a country such as the UK and then what the UK Climate Change Committee has assessed this to mean for emission reduction targets in transport. Section 4 then shifts to a consideration of a spatial scale through consideration of carbon accounting approaches and by mapping the governance realities to the task of carbon reduction. The concluding section draws together the different components of our arguments. It demonstrates that enough is known to agree on a meaningful accounting and accountability framework across scales.
2. Materials and Methods
This article uses secondary data sources to inform its arguments. The data sources are all publicly available and introduced here with an explanation of how they have been applied. In addition, the ranking analysis which is conducted to explore accounting coherence in Section 4.2.2 is explained.
In Section 3, the article uses data from the Climate Change Committee’s Sixth Carbon Budget [24]. The data are all made freely available on the Climate Change Committee website [25]. This allows for the annual disaggregation of total mitigation and residual emissions by sector, which is reported in Section 3. Aggregate charts which are used in the Sixth Carbon Budget report are also accessed from this site.
In Section 4.2.1 on budget coherence, two local climate action plans are used to explore consistency across overlapping spatial scales [26,27]. The data used in the analysis are extracted from publicly available reports, but the elaboration of the Leeds and West Yorkshire pathways is the authors’ own based on stated annual emission reduction rates and the local climate action plan’s projections. Both plans were, at the time of writing, subject to either consultation or further work to identify a preferred final pathway.
Section 4.2.2 examines accountability coherence at different spatial scales. Two data sets were used to inform this analysis. The territorial emissions estimates were derived from the UK National Atmospheric Emissions Inventory, published by the Department of Business, Energy and Industrial Strategy, which reports on territorial emissions using, for road transport, traffic flow estimates and speed-flow curves to allocate emissions according to where they take place [28]. Only road transport emissions were used, which represented 96% of the categorized emissions. For a production-based approach (as per Harris et al. [18]), we used data provided by Transport for the North, which provides estimates of emissions for residents of different areas on the basis of car ownership, vehicle type and annual mileage as recorded in the annual roadworthiness test and assigned by locality. This draws on the methodology of Wilson et al. [29]. The data are available at different local authority spatial scales and for both data sets for the period of 2010–2018 for England, Scotland and Wales but are not yet publicly available. This data set did not, however, include freight transport emissions.
As part of the accounting coherence assessment, the performance (overall CO2 emissions from surface transport) was estimated for each local authority unit. There were 382 local authority units which could be considered at the smallest scale for the analysis. In order to understand the difference that exists between using territorial and production-based estimates (and taking into account the issue of freight differences), we applied a ranking and rank change method. For each assessment, a rank was assigned, with one as the lowest carbon rating and n the highest carbon rating, where n is the number of authorities considered in the analysis. Rank change was calculated by taking the rank from the production estimate away from the rank of the territorial estimate. Rank changes of zero or close to zero would therefore be indicative of zero or small relative differences between methods.
3. Translating the Paris Agreement to the UK Transport Sector
As set out in the introduction, the Paris Agreement sets out a commitment to keep global temperature rises well below 2 °C, with an aim of limiting that to 1.5 °C. There are different approaches to allocating the limited carbon budget implied by the Paris Agreement across countries. Figure 1 sets out the budget proposed by the UK Climate Change Committee (hereafter CCC), which it deems to be Paris compliant [24]. The cumulative CO2 emissions allowed by the CCC’s ‘balanced net zero pathway’ amount to 6975 MtC between 2020 and 2050. This allows for 1493 MtC of negative emissions through removals from carbon capture and storage and land use changes such as afforestation [24]. Despite the predominant position of the CCC in the UK climate policy picture, there are alternative and more aggressive budgetary approaches in use in the UK which are less reliant on negative emission technologies [2]. The implications of the divergence in approaches to budget setting will be discussed further within our case studies in Section 4.2.1.
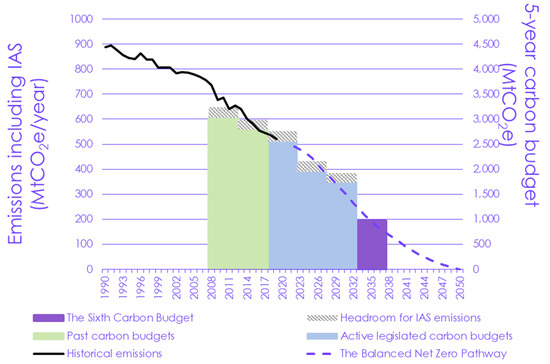
Figure 1.
Carbon budgets set out by the Climate Change Committee [24].
Globally, the transport sector comprises 24% of direct CO2 emissions from fuel combustion, and this has risen at a rate of 1.9% per annum since the year 2000 [30]. In the UK in 2019, transport comprised 27% of CO2 emissions (excluding international aviation and shipping) and, at 119.6 MtC, was only 4.6% lower than nearly 30 years ago in the baseline year of 1990 [15]. Transport’s importance to the overall emissions burden and trajectory are now so significant it can no longer lag behind the national trajectory.
Turning now to the interpretation of the Paris Agreement for the transport sector, the CCC budget assessed that surface transport will need to reach absolute zero (i.e., to not rely on any negative emission technologies) by 2050. Its indicative budget is 1588 MtC (23% of the overall budget) over the period, with an annual percentage decline of 4% every year from 2020 to a residual emission of 1 MtC per annum in 2049. By 2035, annual surface transport emissions should be 72% lower than 2019 levels which, by that time, exceeds the economy-wide average (65%). Figure 2 shows the indicative reduction pathway which the CCC sees to be consistent with the agreed budget. Figure 3 shows the breakdown of transport emissions to date and shows how emissions have reduced by just 4.6% in 30 years. Surface transport needs to transition to being a leading rather than lagging sector.
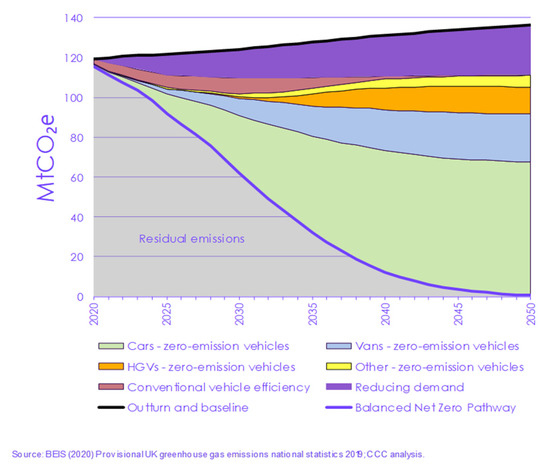
Figure 2.
Estimates of sources of abatement from the balanced net zero pathway from the Sixth Carbon Budget [24].
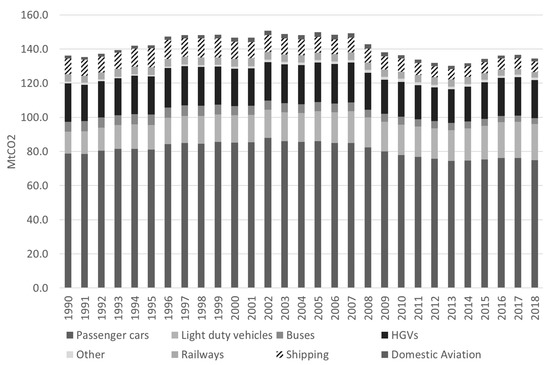
Figure 3.
Change in transport sector CO2 emissions from 1990 to 2018 (source: [15]).
The CCC pathway requires a mix of demand reduction (mainly mode shift), electric vehicle uptake in the private car market and then, over time, decarbonization of heavy goods vehicles. Table 1 translates Figure 2 into five-year budget periods to give a more transparent understanding of the contribution of different policies relative to the baseline. Only 12% of the total abatement from surface transport is expected in the first decade to 2030, which seems very slow given the overall importance of transport to total carbon emissions. In the first five years to 2025, demand reduction is the largest contributor, with 36.3% of the abatement in the period and remaining the second most important category over the period to 2050 at just under one fifth of all emission reductions. This is due to a mixture of mode shift and virtual travel substitution. Electrification of the car market grows in importance, forming 26.6% of emission abatement to 2025 and then becoming the largest category thereafter, totaling just under half of all abatement. Over the period to 2050, the total car distance is on track to stay at approximately 2020 levels once underlying growth and rebound effects from lower electrified motoring costs are taken into account.

Table 1.
Estimates of sources of abatement by five-year period MtCO2 and percentage (in brackets) (source: [25]).
Brand et al. describe the application of the UK TEAM model to assess different technology and behavior change pathways to 2050 in line with the Paris Agreement [31]. Their paper focused on the implications of different phase out dates and options for vehicle technology, with the UK government recently announcing that it would phase out the sale of ICEs and hybrid vehicles in 2030 but allow the sale of plug-in hybrid vehicles through 2035 [32]. The analysis found that no ‘technology only’ scenario was compliant with their interpretation of the Paris budget. The technology pathway selected by the UK government could just meet the Paris cumulative budget with a major package of behavior change (a ‘lifestyle’ scenario). Such changes would include “overall passenger travel demand decreases [of] 2% by 2030 and 12% by 2050. The distance traveled by car as a driver or passenger per head of population decreases 20% by 2030 and 51% by 2050, with increases in bus travel (172% for urban bus, express coach and rural mini bus services combined)” with cycling and walking also increasing [31] (p. 4). Cycling increases from 1% of distance traveled to 8% by 2050, mostly replacing car journeys of under 5 miles in length. While there are many other studies which point to the importance of a balance of measures to reduce travel demand, to shift more travel away from the private car and to achieve full decarbonization of the fleet over time [33,34], few take an explicit carbon budget constraint approach.
While top-down modeling approaches very clearly point to the importance of actions being taken at a range of spatial scales, the balance between national, regional and local levels and between emission reduction technologies and demand shifts is contested. Creutzig suggests that top-down modeling approaches typically marginalize the role of local actors and that 20–50% of carbon emission reductions could be achieved through more local actions around planning and behavioral change [35]. Others present coherent arguments as to why local actions should be important without quantifying the likely impacts [33,36,37]. To date, despite the theoretical case for the importance of local actions, the evidence on the additional value of local action has been mixed [38,39].
The analysis above points to the importance of transport as a sector to the overall emissions reduction trajectory and the need to lead rather than lag behind any nationally defined budget constraint. The scale of emission reductions required and the need for early action mean that there is a requirement for action across a range of scales. Even for matters such as electrification, which will be heavily influenced by the national fiscal and regulatory framework, there are key local actions. Similarly, behavior change initiatives will often be led locally but are conducted within the national framework of subsidy, fuel taxes and regulation, which define the relative costs of different modes of transport. The climate problem in the transport sector is multi-scalar in nature, as is the policy environment through which any transition will be delivered. We now turn to exploring more about differences across scales and what could be done to develop a more coherent multi-scalar approach.
4. Translating National Sectoral Targets to Subnational Scales
As we introduced in Section 1, 74% of local authorities have declared climate emergencies but have taken an extremely inconsistent approach to what this really means. Setting carbon commitments at a subnational scale has a range of technical challenges [17,18,19]. However, the arguments that it is difficult to decide how to do this or that it may lead to suboptimal outcomes have been overtaken by events. An inconsistent approach has emerged in the vacuum created by the decision not to cascade the carbon budgets.
In this section, we review the arguments for subnational intervention in this space and underline the potential benefits of providing greater structure to this process. To begin, it is important to understand something of the complexity of subnational governance in the UK.
4.1. Subnational Government in the UK
The structure of local government across the UK is complex and different across the four administrations [40]. England has the largest population and the most complex arrangements comprising up to four tiers, although this can vary from two (national and local) to four. This provides a context where many nested boundaries need to be considered for carbon accounting. The five broad categories are as follows:
- National government (UK, Scotland, Wales and Northern Ireland), which has a mix of competencies on tax and fiscal policy which applies across the four nations (including England) but where transport and planning policies are largely managed separately [41].
- Sub-National Transport Bodies, as regional governance in the UK has had a mixed history [42], with regional planning being a feature of the early 2000s but abolished in England and Wales by 2010, for example. In 2019, Transport for the North was established as the first statutory Sub-National Transport Body, covering 20 local authorities in the North of England to conduct strategic planning for, among other elements, new infrastructure. While not originally conceived with a carbon management role, this is currently being developed [43]. Other non-statutory subnational transport bodies exist.
- Combined authorities represent clusters of local authorities that have formal governance structures to work together, based initially around the logic of shared travel to work areas which defined the metropolitan counties up to their abolishment in the 1980s. Other forms of combined authority are now being set up, and many also now have elected mayors, who are delegated some powers [44].
- Shire counties are typically larger rural counties which are comprised of district authorities. Most of the transport planning powers sit with the shires.
- Unitary authorities are typically, but not exclusively, smaller cities which do not neatly fit within shire boundaries or which have been separated out in local government reorganizations. Combined authorities are made up of an aggregation of unitary authorities.
Vagnoni and Morati suggest that “local government is an important level of government as it is the closest public organization to the citizens; local government is in a unique position to understand, inform, guide and lead local inhabitants, businesses and industries” [37] (p. 489). Willis suggests that the connection to politics and democracy needs to be brought to the fore, given the nature of the radical transition that is faced [30]. Indeed, climate emergencies have been declared by every tier, with the exception of Sub-National Transport Bodies. However, subnational action raises some quite challenging questions for the coherence of carbon governance [19,38] which we turn to next.
4.2. Coherence in Carbon Management for Transport
The OECD definition of policy coherence introduced in Section 1 pointed to the need for effective governance mechanisms focused on policy interactions which aligned actions between levels of government. We have interpreted this to cover three key dimensions of coherence, which we relate to the definition and then explore more fully in turn:
- Budget coherence concerns budgets as a mechanism through which the sum of the actions of different actors meet the national goals;
- Accounting coherence is a means through which questions about what gets counted where are resolved to align actions between different levels of government;
- Policy coherence considers the relationship between the budget and accounting coherence and the policy competencies to act at different spatial scales.
4.2.1. Budget Coherence
Within any given budget framing, a key aspect of a coherent budget is that the total change in any given period is made up of the sum of the parts. Whatever annual percentage reduction is set by the national trajectory must be met by the sum of the actions across all local areas. This would be true for each sector as well as across all sectors. Where authorities do not take action, there is an implicit correction assumption within the national framing that some other area will move faster to compensate. This is rarely stated.
As Anderson et al. set out, “long-term targets do not have a scientific basis and are leading to dangerously misguided policies. If a policy is to be scientifically credible, it must be informed by an understanding of cumulative emissions and associated emissions pathways.” [8] (p. 3714). In looking across the 183 authorities that declared climate emergencies, only 27% set an area-wide commitment for emission reduction. Within this, very few agreed to an overall budget rather than picking an end date by which zero emissions would be achieved. The lack of national guidance on what process should be undertaken has, unsurprisingly, resulted in some very different practices that seem to be poorly aligned with the national goals.
The issues persist even when examining authorities which have moved early and been advised on science-based target setting. We illustrate this through a case study within West Yorkshire in the North of England where we contrast the largest city (Leeds) to the wider West Yorkshire Combined Authority area (see Table 2). Transport for the North, which sits across all of the authorities in the north, is developing its decarbonization strategy, with a plan to publish said strategy in 2021, and so it is following rather than leading in the process.
Table 2.
Key comparator statistics for Leeds City Council and West Yorkshire Combined Authority.
The trajectories set by Leeds City Council [26] and the West Yorkshire Combined Authority [27] are shown below in Figure 4. Some observations on coherence stand out. First, the WYCA adopted the Tyndall Centre approach to emissions reduction, which suggests a reduction of 14.1% per annum to be within the assigned budget. This is more ambitious than the CCC budget set out earlier but is science-led, with 2038 being set as an end date on the basis of the earliest reasonable projection for achieving zero emissions, allowing for negative emission technologies and forestation. The Leeds City Council used a different budgeting approach informed by climate scientists at Leeds University, but it set a target end date of 2030, which is more ambitious than the science-recommended approach. Even within bodies with overlapping administrative relationships, there are budgetary inconsistencies.
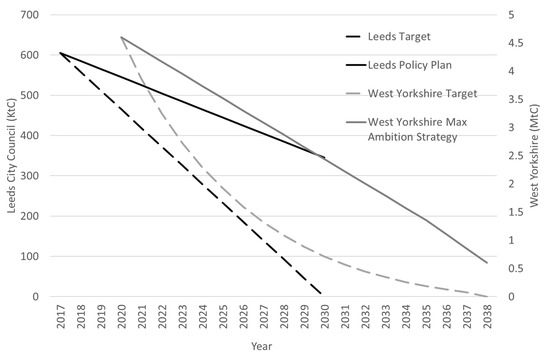
Figure 4.
Subnational carbon budget and policy trajectories for the West Yorkshire Combined Authority and Leeds City Council.
Leeds City Council is currently consulting on a strategy that would get it to a 43% reduction by 2030, leaving a 57% gap. The WYCA has mapped out some possible emission reduction pathways without adopting, as yet, a preferred policy position or identifying the gap against the implied trajectory. The maximum ambition scenario is shown on the chart, again falling well outside of the annual reductions implied by the Tyndall Centre, which steered the pathway approach. Even with startlingly high mode shift and car reduction aspirations, neither area has a plan yet which is consistent with the budget. We return to policy coherence in Section 4.2.3.
4.2.2. Accounting Coherence
Within the example just shown, we also see elements of the second aspect of interest: accounting coherence. Leeds represents 40% of West Yorkshire’s emissions (on the basis of territorial emissions), yet the transport emissions which Leeds is identifying as its problem represent just 12% of the WYCA total in 2020, suggesting a narrowing of the focus to journeys with both origins and destinations within Leeds City Council only.
There are a number of different options that could be considered to address accounting coherence and how boundaries are drawn. Many reviews discuss the merits and disadvantages of the three main approaches [17,19,38,45]:
- A territorial-based emissions approach where the place in which the emissions occur is the basis for accounting. In transport, this means assigning the emissions to where the movement occurs as a proxy for where fossil fuels are used.
- A production-based approach where sources of production are assigned the emissions, no matter where the end consumption is. In transport, for example, this would assign emissions to residents of an area irrespective of how much of their emissions burden is within that area.
- A consumption-based approach, which assigns the emissions associated with the whole consumption chain (including imports) to the place where consumption occurs.
It is broadly agreed that consumption-based approaches indicate higher levels of emissions for cities than other approaches, as the use of territorial boundaries can outsource emissions to production elsewhere, and the choice of approach does matter (see [18] for a fuller discussion).
Hermannson and McIntyre looked at accounting at a core city, wider city region and national level in Scotland using an input–output model and concluded that issues of transboundary flows are just as important at the local and regional scales (due to commuting flows, retail and industrial movements) as they are nationally and that “it is important to understand the spatial interdependencies that exist in the composition of the emissions total within regions and nations” [46] (p. 1). Salon et al., specifically looking at transport, also found that “On road vehicles move freely between localities, emitting greenhouse gas emissions as they go. The best method of assigning these emissions to localities and measuring them is not immediately obvious but should be based upon some measurement of distance traveled (VKT) by vehicles in that region” [36] (p. 2036).
Figure 5 shows the distribution of trips by private car by journey length and their relative contribution to total mileage by the same journey length categories as captured by the National Travel Survey. While the fleet of electric vehicles in the UK remains small, this acts as a good proxy for tailpipe CO2 emissions. The data shows that 96% of trips are under 35 miles in length and might, therefore, be well-suited to governance at a shire county or combined authority scale. However, this comprises just under two-thirds of the distance traveled and carbon consumed from passenger trips. Freight transport also operates over larger scales, and so transboundary flows beyond even a shire county or urban combined authority matter.
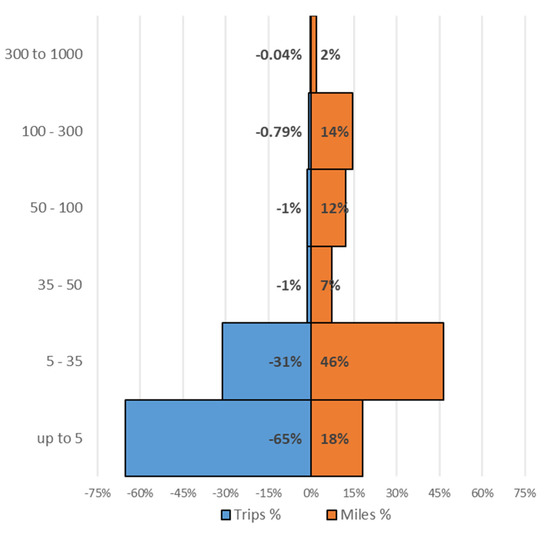
Figure 5.
Trips and mileage by journey length band for cars. Source: National Travel Survey.
While the arguments for consumption-based accounting are strong, the lack of data and, importantly, lack of policy competences to act on imports and industrial policy below the national scale mean that, for now, we consider territorial or production-based approaches.
Figure 6 shows the distribution of emissions across the local authorities using both methods for all transport emissions (a and b) and then per capita (c and d). The difference in ranking when applying the two methodologies, as explained in Section 2, for total emissions is shown in Figure 6e. Then, the smallest units were aggregated so that counties were used rather than their constituent districts (Figure 6f) using the same rank difference approach. Then, metropolitan unitary authorities were aggregated to combined authorities (Figure 6g).
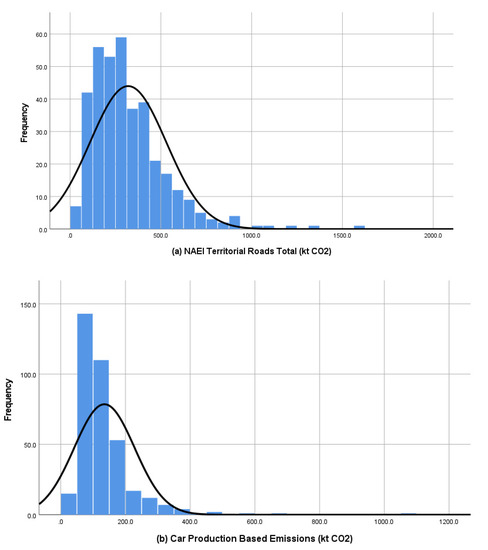
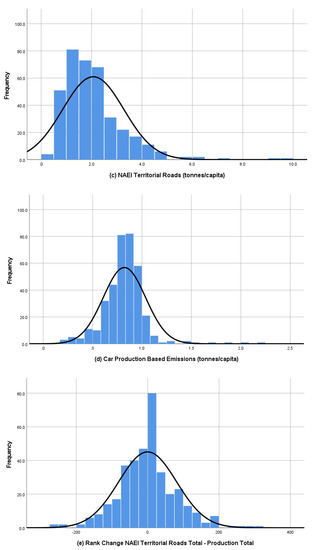
Figure 6.
Territorial and production-based emission estimates and the differences in ranking by method at different levels of spatial aggregation. Subscripts (a–g) represent different levels of aggregation.
Both methodologies produced a very considerable spread of emissions performance at the most disaggregated spatial scale, although the distributions were highly skewed, with a larger concentration of lower bands. As the spatial scales of local government were aggregated, the differences between accounting methods diminished as expected because the larger scales of government would encompass more of the distance traveled and, therefore, the emissions (as per Figure 5). Large rank changes between the two methods are indicative of a mismatch between estimates, which were based on movement within an area and those which might be associated with residents of that area. At the lowest spatial scale (Figure 6e), we see a standard deviation of rank changes of 81; that is to say, a third of the authorities changed ranks by more than 81. As we move up the aggregation level, we see the rank shifting reduce considerably (Table 3). We accounted for the reduction in numbers of authorities considered at different levels of aggregation by using the standard error as our comparator.
Table 3.
Comparison of rank changes by spatial aggregation.
There still remained a considerable spread at the county scale, with a third of the authorities moving more than 20 places, but there was a very clear reduction in difference between methods as one moved to aggregation at both the county and combined authority scales. This suggests that arguments about how to account for emissions diminish with spatial aggregation, in line with expectations.
4.2.3. Policy Coherence
The implications of accounting at different scales need also to be set against the competencies to act at the different scales. This is the third of our areas of exploration: policy coherence. In Table 4, we set out some of the key powers at different spatial scales to intervene in the transport sector. These are split across different scales, with the primary actors being national and county or unitary authorities, although every layer has a role, and the actual balance plays out differently in different parts of the country.
Table 4.
Indicative powers to act on decarbonization in England (authors’ elaboration).
We can see from Section 4.2.2 that the accounting coherence increases as we move up spatial scales from local to subnational (and then national as the final scale of aggregation). By contrast, the policy competencies have more of a dumbbell shape, with lots of competencies held at a national level and county or unitary level but far fewer in between. While in some places mayoral combined authorities are beginning to acquire more powers and some financial autonomy, the metropolitan district councils which form the combined authority areas still wield a lot of power [44]. There is no obvious ‘optimal’ approach which matches accounting coherence and policy coherence due to the messy cross-boundary nature of transport flows (Section 4.2.2), and the historic distribution of policy competencies, which developed largely before climate change, was a recognized policy problem.
5. Conclusions
The Paris Agreement has crystallized some carbon reduction realities which have profound impacts on what needs to happen next and how that must be delivered. First, the use of budgeting frameworks is now demonstrating to policymakers how late deep emissions cuts have been left and how hard this will be to deliver. While there remain quite substantial differences in framings about shared burdens and negative emission technologies, the rate of annual emission reductions required far exceeds the progress ever achieved in a range of sectors and particularly so for transport, the focus area of this paper. The second is that, coupled with a requirement for deep cuts in the coming decade, there is at most 30 years to completely decarbonize all sectors and in all parts of the country.
This paper has demonstrated that in the UK, a country which has taken a leading role in committing to a transition to a zero carbon economy, there is no currently coherent framework for understanding the role of different levels of government in this transition. The requirement to act is not a unique property of an international accounting system or the national governments tasked with negotiating and reporting on their progress. Local populations and their governments are also responding. In the absence of a clear framework beneath the national level, the response is piecemeal and incoherent. In light of our analysis, we think it is impossible to defend the position that setting a clear framework for responsibility sharing would create more problems than it would solve.
Our analysis shows that there is no one optimal spatial scale for allocating budgets due to the different alignment of policy competencies and distribution of emissions. This paper has identified three dimensions of the problem that require coordination across scales and which can form the basis of choosing pragmatic ways forward right now. Most authorities are still in the process of working out what the declaration of a climate emergency means and thus can build this in immediately. The urgency of cutting emissions early in the period to 2050 means we cannot afford a call for coordination to be interpreted as an opportunity for delay.
The three components identified that shape how to coordinate action are as follows:
- Budget coherence, where the gap between framings of what the Paris Agreement means are creating radically different ambition levels. Coupled with this are inconsistencies even within areas that have budgets as well as between places that do and do not have any form of budgeting. There must, at the very least, be some form of budgeting at a subnational scale below that of devolved administrations.
- Accounting coherence, as accounting at the smaller scales of local government alone appears too limited in managing the full range of carbon impacts from transport. Carbon accounting coherence in transport significantly improves at a combined authority, city region or shire county scale, and there are still important flows at a sub-national authority scale.
- Policy coherence, because of the patchwork of powers and structures across the UK, there is no one prescription for how this will work. A multi-scalar approach seems, therefore, both inevitable and appropriate. It is difficult to envisage policy coherence, however, without agreement over how much action is needed and what needs to be counted where, as set out in the budget and accounting coherence.
The scale of the changes that are now implied by the carbon budgets and pathways will require adaptations to ways of life which will be deeply political, and so there has to be clarity, accountability and fairness in the allocation of responsibilities and resources to match if we are to expect the local, regional and national contributions to add up [47]. There has, as yet, been no discussion about how to deal with key equity issues, such as how to treat places with historically high emissions, lower long-term investment in alternatives to the car, high (or low) levels of co-benefits with other policy areas or socioeconomic and geographic circumstances that might influence the pace of action in different places [48]. If, as Willis suggests, the success or failure of the race to cut emissions will be won or lost on the basis of bringing the public along with the realities of the choices implied by the budget [14], then we cannot afford to persist with the muddle of approaches being enacted today. A clear framework for carbon management should provide a more robust and transparent assessment of what needs to be done where and by when. It is time to stop hiding the realities of the scale of the carbon reduction challenge in transport and the need for action everywhere.
Author Contributions
Conceptualization, G.M. and J.A.; methodology, G.M., writing—original draft preparation, G.M.; writing—review and editing, J.A. and G.M. All authors have read and agreed to the published version of the manuscript.
Funding
This research was funded by the Engineering and Physical Sciences Research Council (EPSRC) under the DecarboN8 grant EP/S032002/1 and the CREDS Centre EP/R035288/1. The APC was funded by EPSRC.
Institutional Review Board Statement
Not applicable.
Informed Consent Statement
Not applicable.
Data Availability Statement
Data on the Sixth Carbon Budget is available to download from https://www.theccc.org.uk/wp-content/uploads/2021/02/The-Sixth-Carbon-Budget-Dataset.xlsx, Accessed 1 on June 2021 and data on the local authority territorial emissions by sector is available from https://data.gov.uk/dataset/723c243d-2f1a-4d27-8b61-cdb93e5b10ff/emissions-of-carbon-dioxide-for-local-authority-areas. Accessed on 1 June 2021.
Acknowledgments
We would like to thank Kadambari Lokesh for her work in reviewing the declarations of climate emergencies referred to in Section 1 as part of the DecarboN8 project.
Conflicts of Interest
The authors declare no conflict of interest. The funders had no role in the design of the study; in the collection, analyses, or interpretation of data; in the writing of the manuscript, or in the decision to publish the results.
References
- IPCC. Global Warming of 1.5C. An IPCC Special Report on the Impacts of Global Warming above Pre-Industrial Levels and Related Greenhouse Gas Emission Pathways, in the Context of Strengthening the Global Response to the Threat of Climate Change, Sustainable Development and Efforts to Eradicate Poverty; Masson-Delmotte, V., Zhai, P., Pörtner, H.-O., Roberts, D., J.Skea, P.R., Shukla, A., Pirani, W., Moufouma-Okia, C., Péan, R., et al., Eds.; IPCC: Geneva, Switzerland, 2018. [Google Scholar]
- Anderson, K.; Broderick, J.F.; Stoddard, I. A Factor of Two: How the mitigation plans of ‘climate progressive’ nations fall far short of Paris compliant pathways. Climate Policy 2020. [Google Scholar] [CrossRef]
- Lebling, K.; Levin, K.; Jeffery, L.; Plechaty, D.; Ge, M.; Friedrich, J.; Waite, R. Climate Action Must Progress Far Faster to Achieve 1.5 C Goal, World Resources Institute. 2019. Available online: https://www.wri.org/blog/2020/11/climate-action-progress-2030-2050 (accessed on 26 March 2021).
- Rogelj, J.; Forster, P.M.; Kriegler, E.; Smith, C.J.; Séférian, R. Estimating and tracking the remaining carbon budget for stringent climate targets. Nature 2019, 571, 335–342. [Google Scholar] [CrossRef]
- Bache, I.; Bartle, I.; Flinders, M.; Marsden, G. Blame games and climate change: Accountability, multi-level governance and carbon management. Br. J. Politics Int. Relat. 2014, 17, 1–20. [Google Scholar] [CrossRef]
- Marsden, G.; Ferreira, A.; Bache, I.; Flinders, M.; Bartle, I. Muddling through with climate change targets: A multi-level governance perspective on the transport sector. Climate Policy 2014, 14, 617–636. [Google Scholar] [CrossRef]
- UNFCC. Decision 1/CP.21, Paris Agreement, United Nations Framework Convention on Climate Change; Document FCCC/CP/2015/10/Add.1; United Nations: Paris, France, 2015. [Google Scholar]
- Anderson, B. From long-term targets to cumulative emission pathways: Reframing UK climate policy. Energy Policy 2008, 36, 3714–3722. [Google Scholar] [CrossRef]
- Bache, I.; Reardon, L.; Bartle, I.; Flinders, M.; Marsden, G. Symbolic Meta-Policy: (Not) Tackling Climate Change in the Transport Sector. Political Stud. 2015, 63, 830–851. [Google Scholar] [CrossRef]
- Zhao, R.; Min, N.; Geng, Y.; He, Y. Allocation of carbon emissions among industries/sectors: An emissions intensity reduction constrained approach. J. Clean. Prod. 2017, 142, 3083–3094. [Google Scholar] [CrossRef]
- Steininger, K.W.; Meyer, L.; Nabernegg, S.; Kirchengast, G. Sectoral carbon budgets as an evaluation framework for the built environment. Build. Cities 2020, 1, 337–360. [Google Scholar] [CrossRef]
- Climate Emergency Declaration. Available online: https://climateemergencydeclaration.org/climate-emergency-declarations-cover-15-million-citizens/ (accessed on 25 March 2021).
- List of Councils Who Have Declared a Climate Emergency. Available online: https://www.climateemergency.uk/blog/list-of-councils/ (accessed on 30 January 2021).
- Willis, R. Too Hot to Handle? The Democratic Challenge of Climate Change; Bristol University Press: Bristol, UK, 2020. [Google Scholar]
- 2019 UK Greenhouse Gas Emissions, Provisional Figures, 26 March 2020, National Statistics. Available online: https://data.gov.uk/dataset/9a1e58e5-d1b6-457d-a414-335ca546d52c/provisional-uk-greenhouse-gas-emissions-national-statistics (accessed on 11 March 2021).
- Harstaad, H. Do Climate Targets Matter? The accountability of climate target setting in urban climate and energy policy. In Enabling Sustainable Energy Transitions: Practices of Legitimation and Accountable Governance; Sareen, S., Ed.; Palgrave MacMillan: London, UK, 2020; pp. 63–72. [Google Scholar]
- Balouktsi, M. Carbon metrics for cities: Production and consumption implications for policies. Build. Cities 2020, 1, 233–259. [Google Scholar] [CrossRef]
- Harris, S.; Weinzettel, J.; Bigano, A.; Källmén, A. Low carbon cities in 2050? GHG emissions of European cities using production-based and consumption-based emission accounting methods. J. Clean. Prod. 2020, 248, 119206. [Google Scholar] [CrossRef]
- Leão, E.B.S.; do Nascimento, L.F.M.; de Andrade, J.C.S.; de Oliveira, J.A.P. Carbon accounting approaches and reporting gaps in urban emissions: An analysis of the Greenhouse Gas inventories and climate action plans in Brazilian Cities. J. Clean. Prod. 2020, 245, 118930. [Google Scholar] [CrossRef]
- OECD Recommendation of the Council on Policy Coherence for Sustainable Development, OECD/LEGAL/0381. Available online: https://www.oecd.org/gov/pcsd/oecd-recommendation-on-policy-coherence-for-sustainable-development.htm (accessed on 21 May 2021).
- Levin, K.; Cashore, C.; Bernstein, S.; Auld, G. Overcoming the tragedy of super wicked problems: Constraining our future selves to ameliorate global climate change. Policy Sci. 2012, 45, 123–152. [Google Scholar] [CrossRef]
- Low, N.; Astle, R. Path dependence in urban transport: An institutional analysis of urban public transport in Melbourne Australia, 1956–2006. Transp. Policy 2009, 16, 47–58. [Google Scholar] [CrossRef]
- Sorenson, A. Taking path dependence seriously: An historical institutionalist research agenda in planning history. Plan. Perspect. 2015, 30, 17–38. [Google Scholar] [CrossRef]
- Sixth Carbon Budget, Climate Change Committee, London, 9th December. 2020. Available online: https://www.theccc.org.uk/publication/sixth-carbon-budget/ (accessed on 25 March 2021).
- Sixth Carbon Budget Dataset. Available online: https://www.theccc.org.uk/wp-content/uploads/2021/02/The-Sixth-Carbon-Budget-Dataset.xlsx (accessed on 25 March 2021).
- Connecting Leeds: Transport Strategy, Draft for Consultation. Available online: https://leedstransportstrategy.commonplace.is/overview (accessed on 25 March 2021).
- Tackling the Climate Emergency: Emissions Reduction Pathway Report, West Yorkshire Combined Authority and Leeds City Region Enterprise Partnership, July. Available online: https://www.westyorks-ca.gov.uk/media/4268/emission-reduction-pathways-report.pdf (accessed on 25 March 2021).
- Emissions of Carbon Dioxide for Local Authority Areas. Department of Business, Energy and Industrial Strategy. Available online: https://data.gov.uk/dataset/723c243d-2f1a-4d27-8b61-cdb93e5b10ff/emissions-of-carbon-dioxide-for-local-authority-areas (accessed on 25 March 2021).
- Wilson, R.E.; Anable, J.; Cairns, S.; Chatterton, T.; Notley, S.; Miller, J.D. On the estimation of temporal mileage rates. Transp. Res. E Logist. Transp. Rev. 2013, 60, 126–139. [Google Scholar] [CrossRef][Green Version]
- Transport Outlook. International Transport Forum, Paris. 2019. Available online: https://www.oecd-ilibrary.org/transport/itf-transport-outlook-2019_transp_outlook-en-2019-en (accessed on 25 March 2021).
- Brand, C.; Anable, J.; Ketsopolou, I.; Watson, J. Road to zero or road to nowhere? Disrupting transport and energy in a zero carbon world. Energy Policy 2020, 139, 111134. [Google Scholar] [CrossRef]
- Government Takes Historic Step towards Net-Zero with End of Sale of New Petrol and Diesel Cars by 2030, Press Release from Department for Transport, Office for Zero Emission Vehicles and Department for Business, Energy and Industrial Strategy, 18th November. Available online: https://www.gov.uk/government/news/government-takes-historic-step-towards-net-zero-with-end-of-sale-of-new-petrol-and-diesel-cars-by-2030 (accessed on 25 March 2021).
- Gota, C.; Huezinga, C.; Peet, K.; Medimorec, N.; Bakker, S. Decarbonising transport to achieve Paris Agreement targets. Energy Effic. 2019, 12, 363–386. [Google Scholar] [CrossRef]
- Lefevre, J.; Briand, Y.; Pye, S.; Tovilla, J.; Li, F.; Oshiro, K.; Waisman, H.; Cayla, J.M.; Zhang, R. A pathway design framework for sectoral deep decarbonization: The case of passenger transportation. Clim. Policy 2021, 21, 93–106. [Google Scholar] [CrossRef]
- Creutzig, F. Evolving narratives of low-carbon futures in transportation. Transp. Rev. 2016, 36, 341–360. [Google Scholar] [CrossRef]
- Salon, D.; Sperling, D.; Meier, A.; Murphy, S.; Gorham, R.; Barrett, S. City carbon budgets: A proposal to align incentives for carbon friendly communities. Energy Policy 2010, 38, 2032–2041. [Google Scholar] [CrossRef]
- Vagnoni, E.; Morati, A. Local Government’s contribution to low carbon mobility transitions. J. Clean. Prod. 2018, 176, 486–502. [Google Scholar] [CrossRef]
- Tólon-Becerra, A.; Lastro-Bravo, X.B.; Sotelo-Navoporto, J.A. Territorial distribution of transport emission reduction targets from an environmental, economic and social viewpoint. Environ. Sci. Policy 2012, 16, 97–113. [Google Scholar] [CrossRef]
- Azevedo, I.; Horta, I.; Leal, V.M. Analysis of the relationship between local climate change mitigation actions and greenhouse gas emissions–Empirical insights. Energy Policy 2017, 111, 204–213. [Google Scholar] [CrossRef]
- Marsden, G.; Docherty, I. Governance of UK Transport Infrastructures. UK Government Office for Science. Future of Mobility: Evidence Review; Government Office for Science: London, UK, 2019. Available online: https://assets.publishing.service.gov.uk/government/uploads/system/uploads/attachment_data/file/780871/governance.pdf (accessed on 25 March 2021).
- MacKinnon, D.; Shaw, J.; Docherty, I. Diverging Mobilities: Devolution, Transport Policy and Innovation; Elsevier Science: Oxford, UK, 2008. [Google Scholar]
- MacKinnon, D.; Shaw, J. New state spaces, agency and scale: Devolution and the regionalisation of transport governance in Scotland. Antipode 2010, 42, 1226–1252. [Google Scholar] [CrossRef]
- Marsden, G. The Role of Sub-National Transport Bodies in Carbon Governance, DecarboN8 working paper 3.1. 2020. Available online: https://decarbon8.org.uk/sntbs-carbon-governance/ (accessed on 25 March 2021).
- Sandford, M. Local Government in England: Structures, Briefing Paper 07104, Library of the House of Commons, 20th November, London. 2020. Available online: https://commonslibrary.parliament.uk/research-briefings/sn07104/ (accessed on 25 March 2021).
- Liu, Z.; Geng, Y.; Dong, H.; Wilson, J.; Micic, T.; Wu, R.; Cui, X.; Qyian, Y.; Yu, W.; Sun, H. Efficient distribution of carbon emissions reductions targets at the city level: A case of Yangtze River Delta region. J. Clean. Prod. 2018, 172, 1711–1721. [Google Scholar] [CrossRef]
- Hermannson, K.; McIntyre, S.G. Local consumption and territorial-based accounting for CO2 emissions. Ecol. Econ. 2014, 104, 1–11. [Google Scholar] [CrossRef]
- Gordon, D.J.; Johnson, C.A. City networks, global climate governance and the road to 1.5C. Curr. Opin. Environ. Sustain. 2018, 30, 35–41. [Google Scholar] [CrossRef]
- Walker, R.; Morgan, M.; Marsden, G.; Anable, J. Carbon Accounting for Local Authorities: A Comparative Analysis of NAEI Estimates and MOT Test Data Based Estimates, DecarboN8 Working Paper 1.1. 2020. Available online: https://decarbon8.org.uk/wp-content/uploads/sites/59/2020/09/DecarboN8-WP1.1-Walker-et-al-2020-1.pdf (accessed on 25 March 2021).


Publisher’s Note: MDPI stays neutral with regard to jurisdictional claims in published maps and institutional affiliations. |
© 2021 by the authors. Licensee MDPI, Basel, Switzerland. This article is an open access article distributed under the terms and conditions of the Creative Commons Attribution (CC BY) license (https://creativecommons.org/licenses/by/4.0/).