
Heterogeneous Deterioration Process and Risk of Deficiencies of Aging Bridges for Transportation Asset Management


Abstract
:1. Introduction
2. Methodology
2.1. Outline
2.2. Definition of Condition State, Analysis Groups, and Explanatory Variables
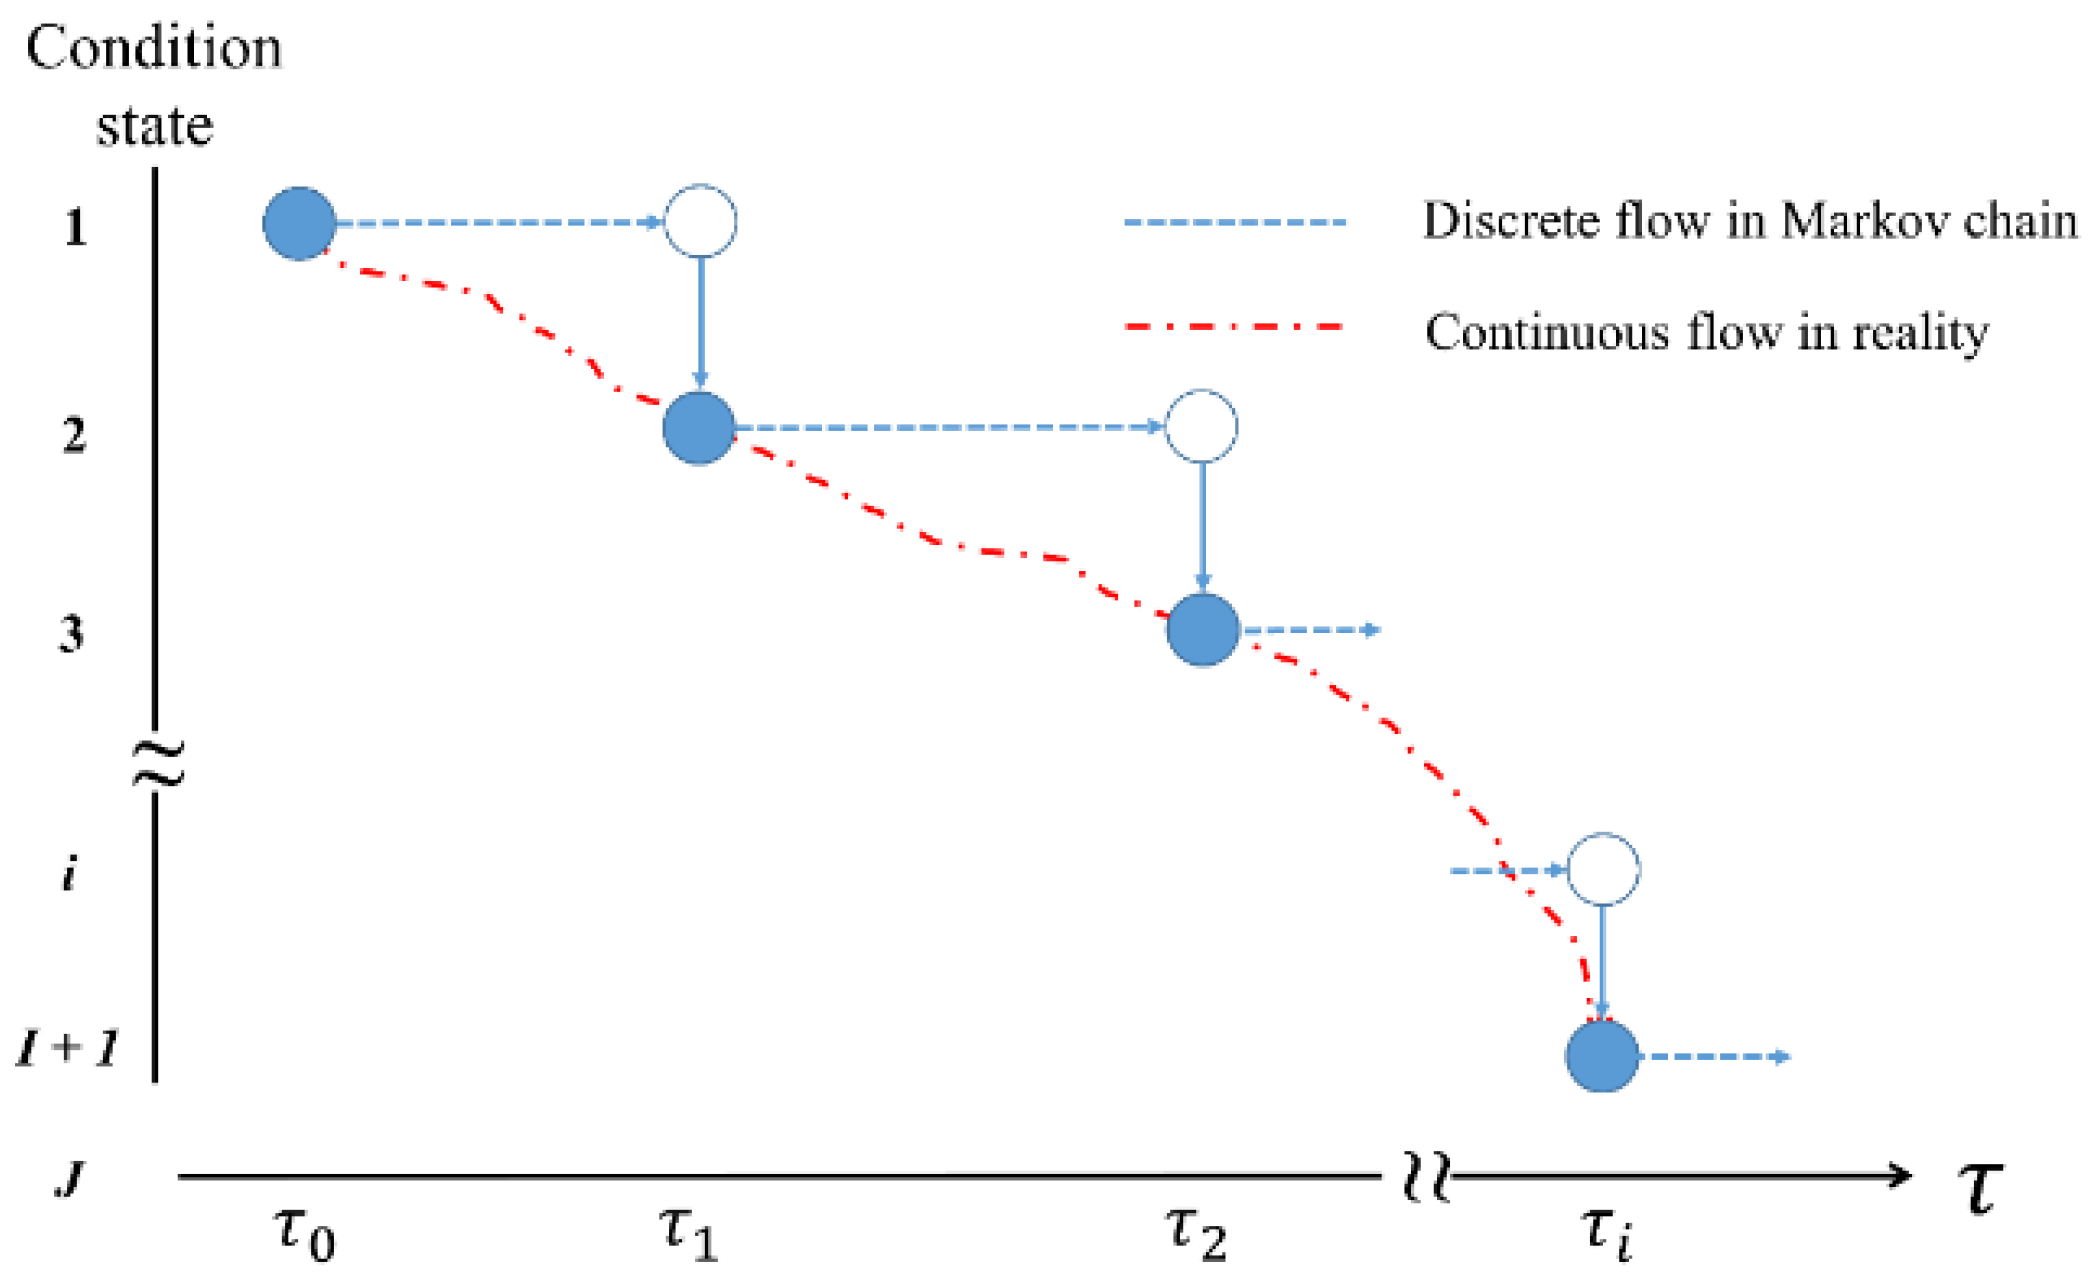
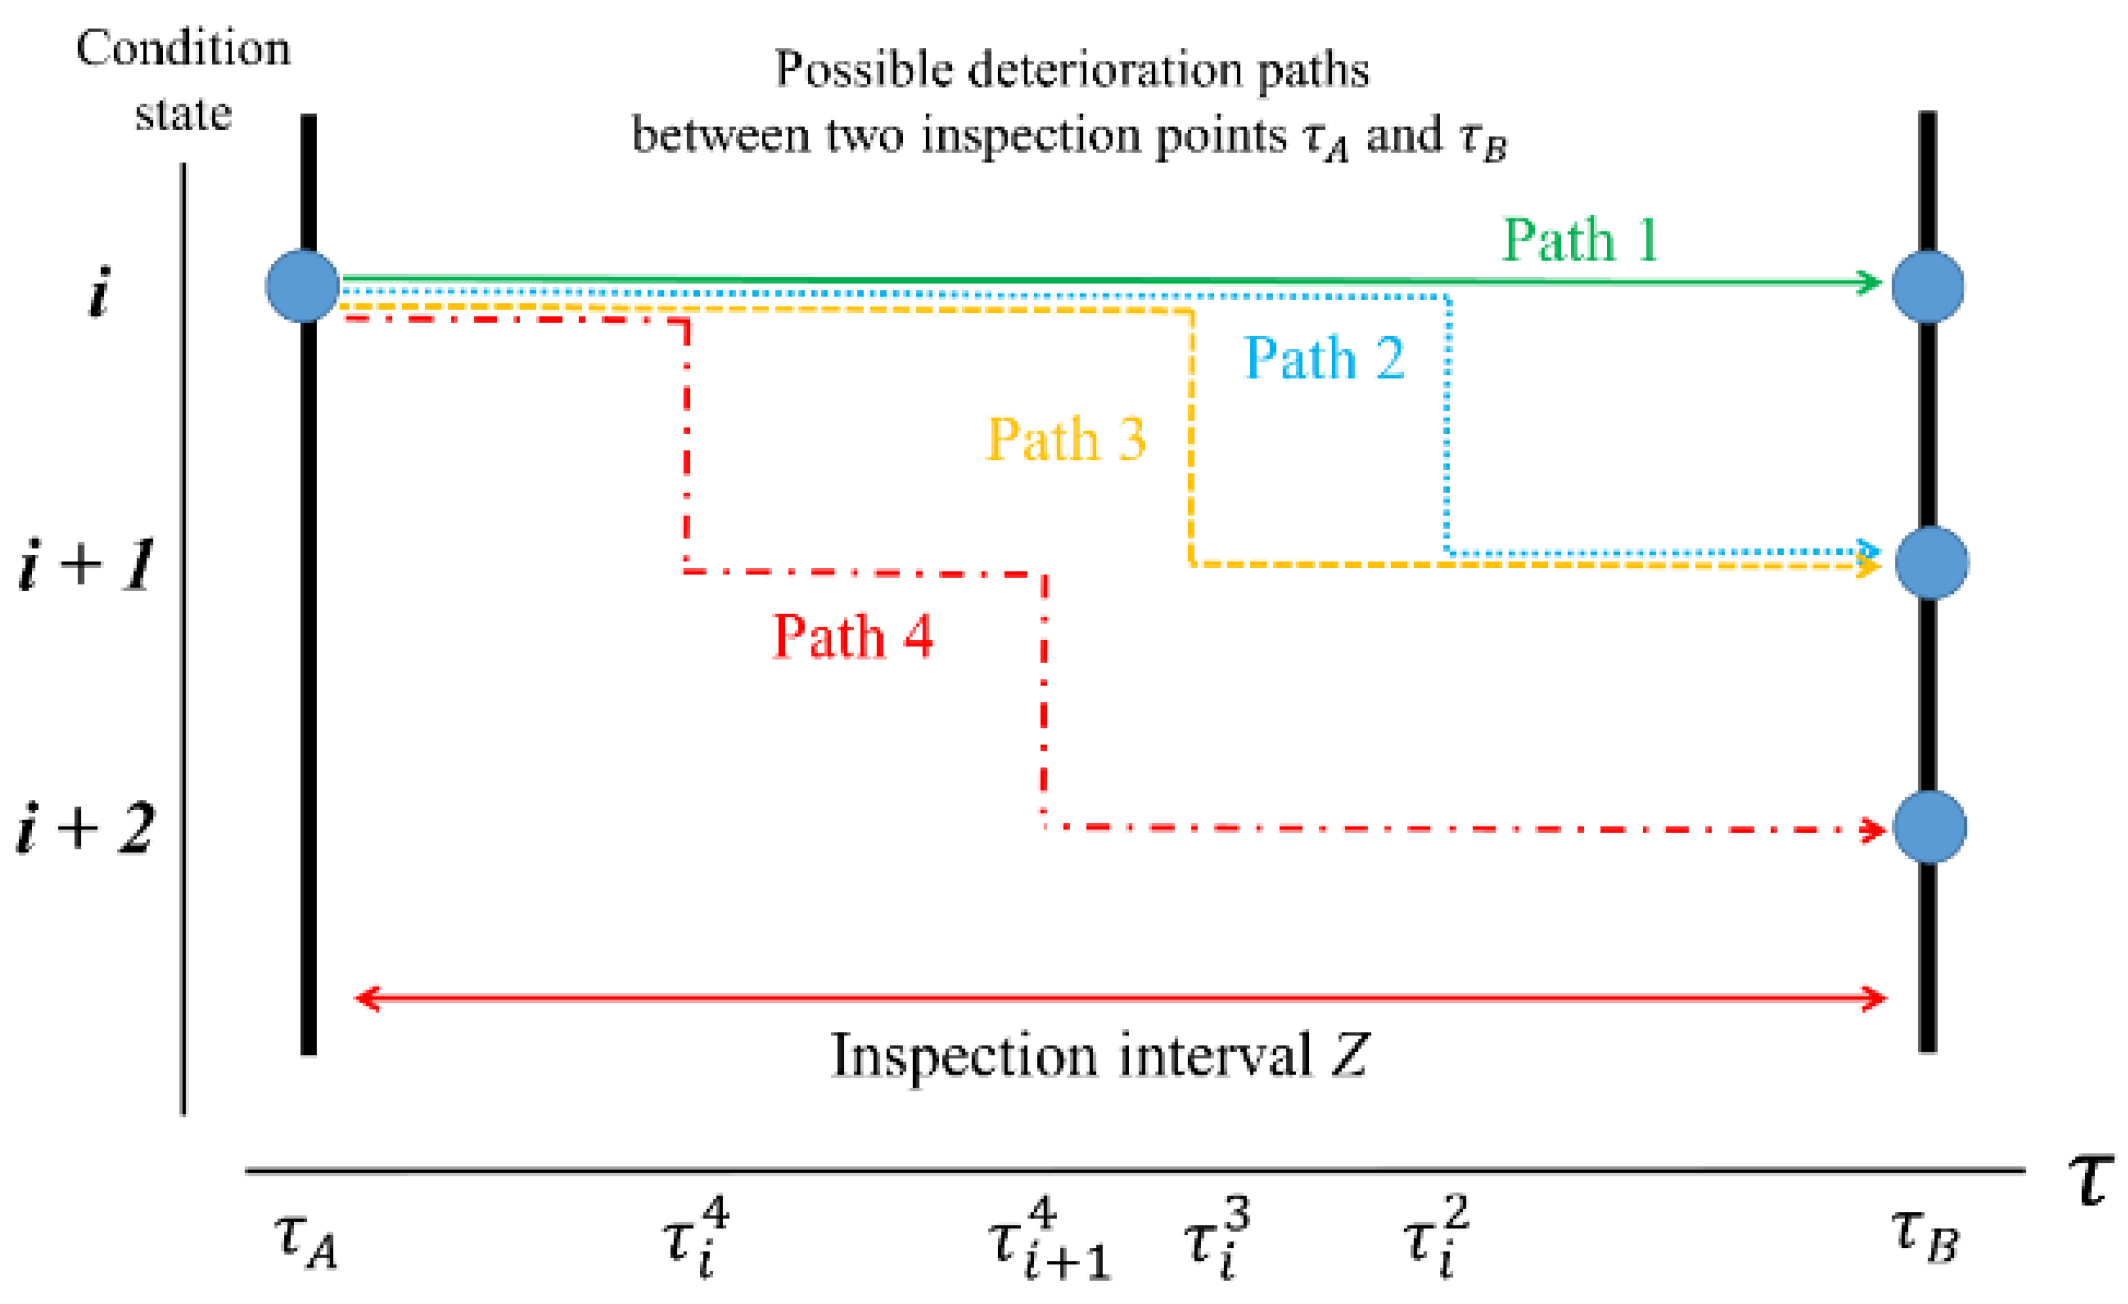
2.3. Deterioration Process and Risk Analysis Method
3. Empirical Study
3.1. Data Securing and Processing
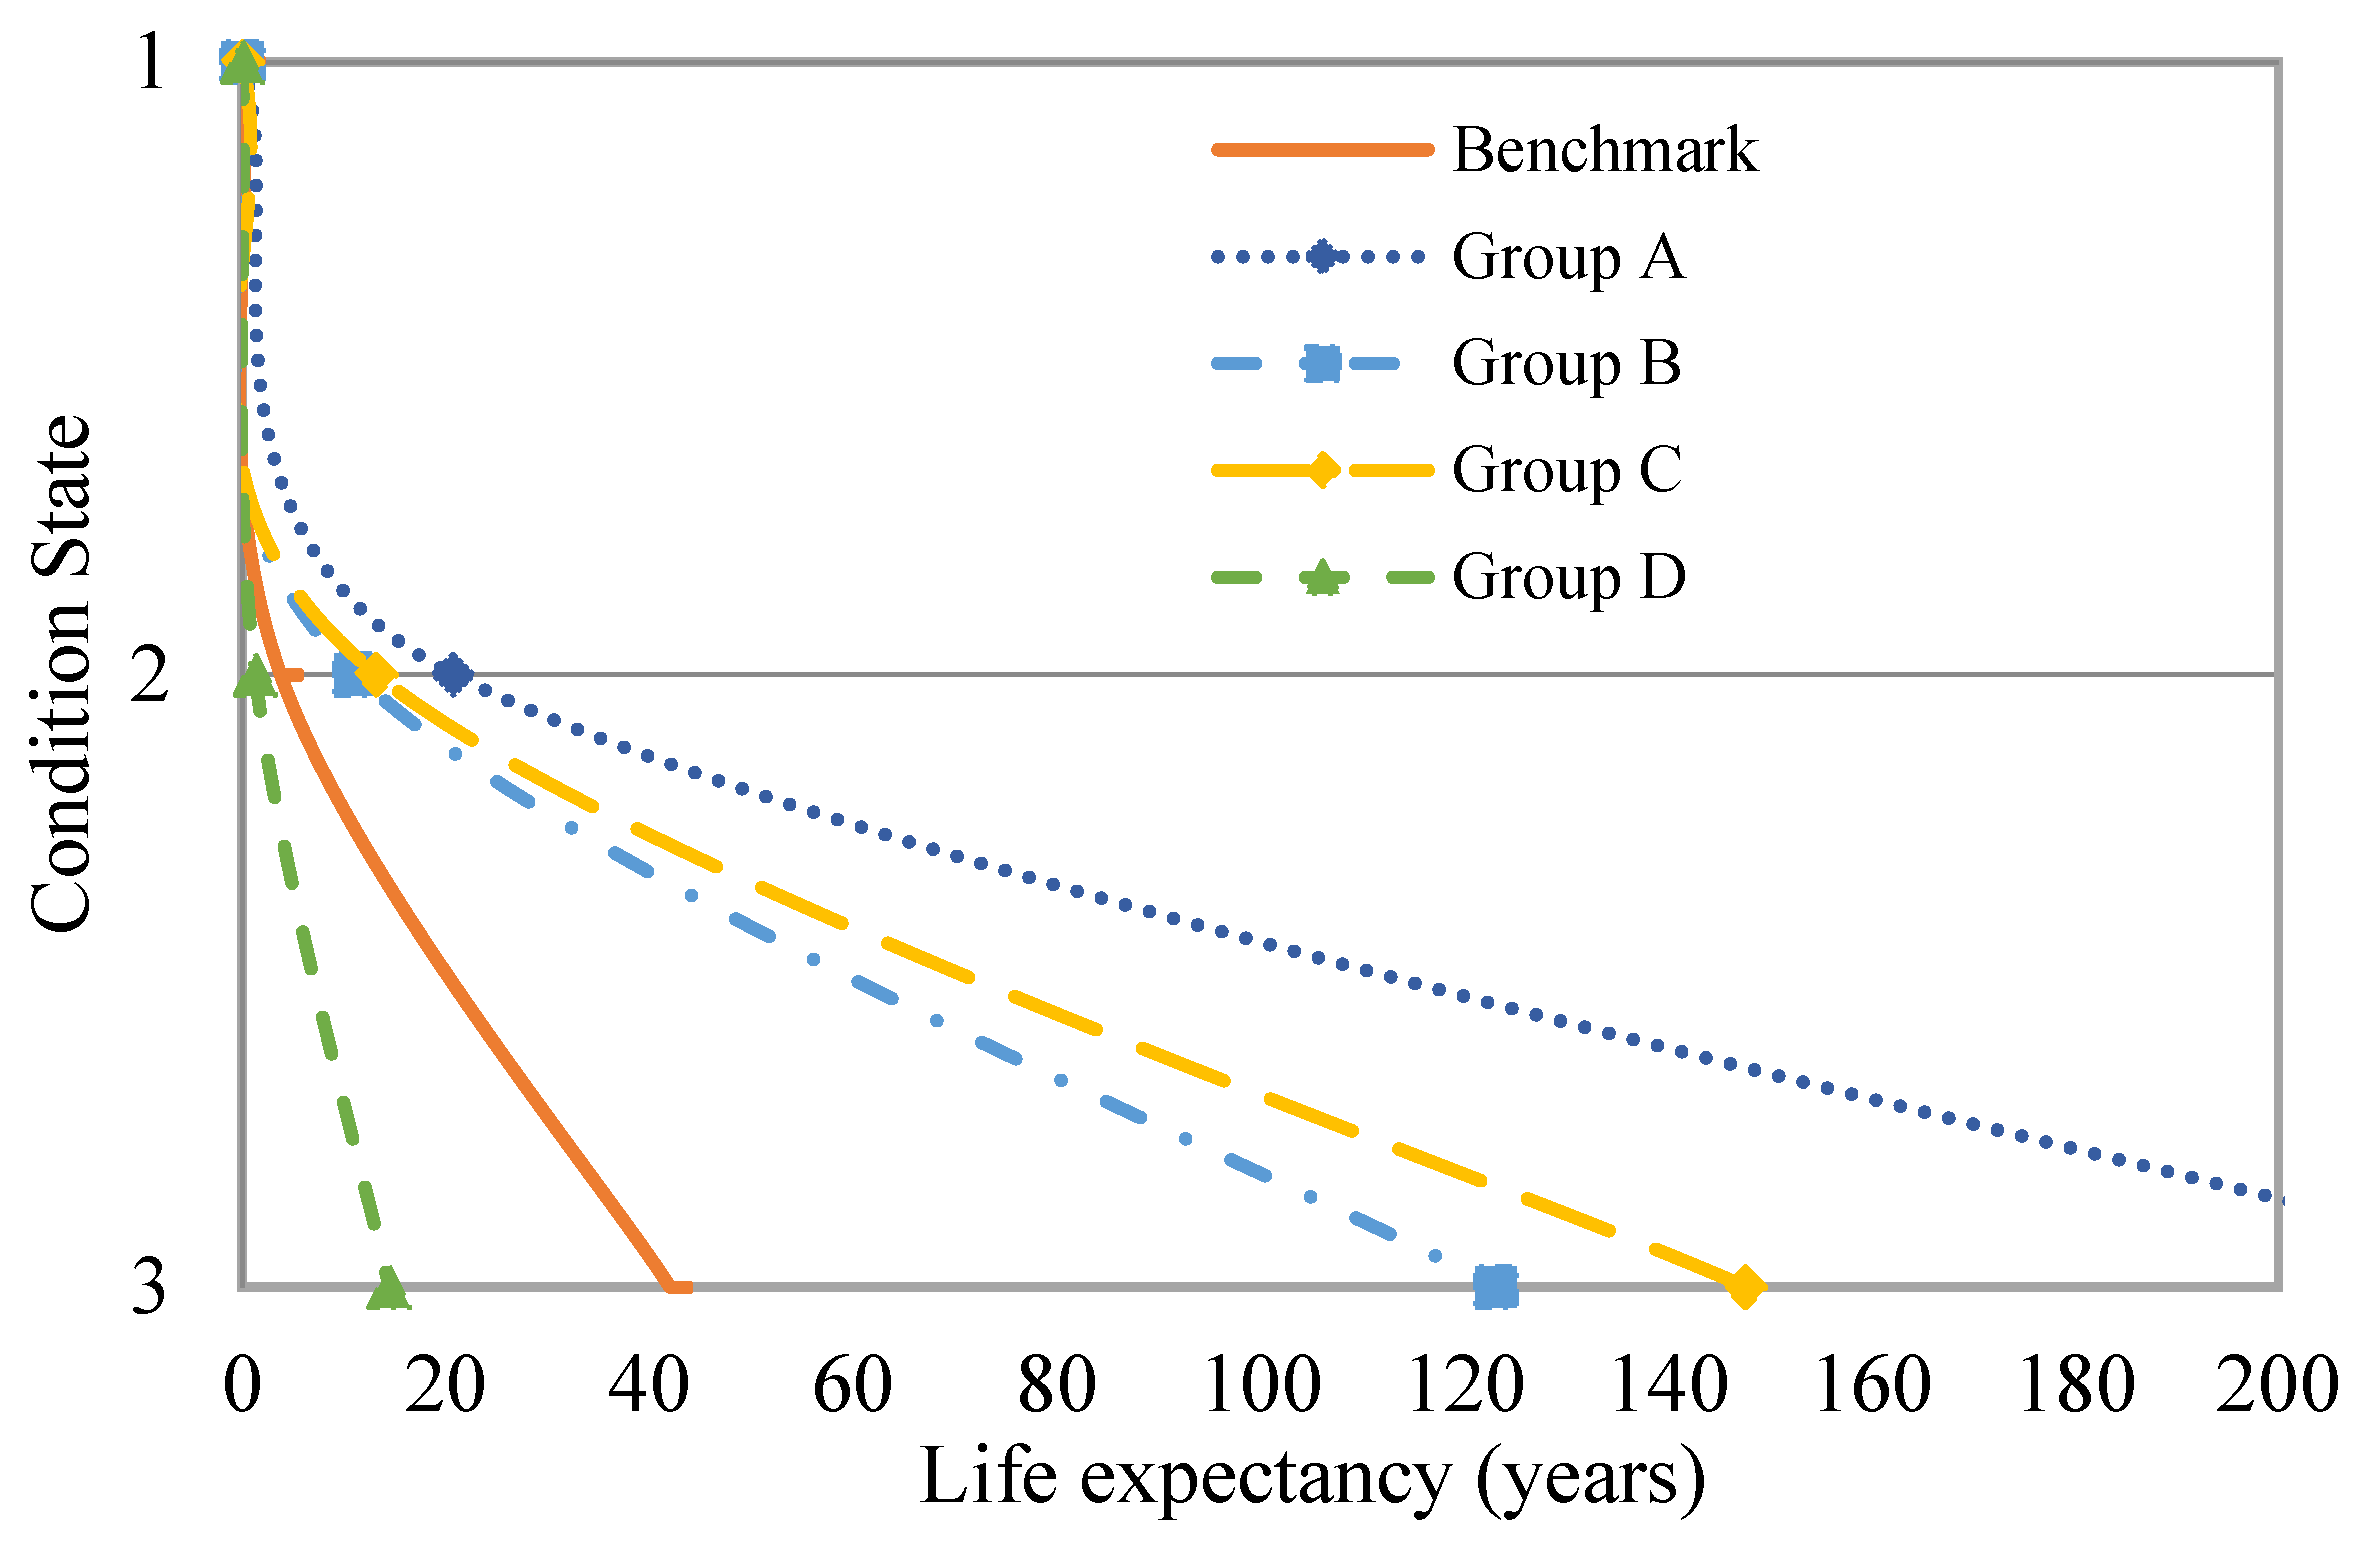
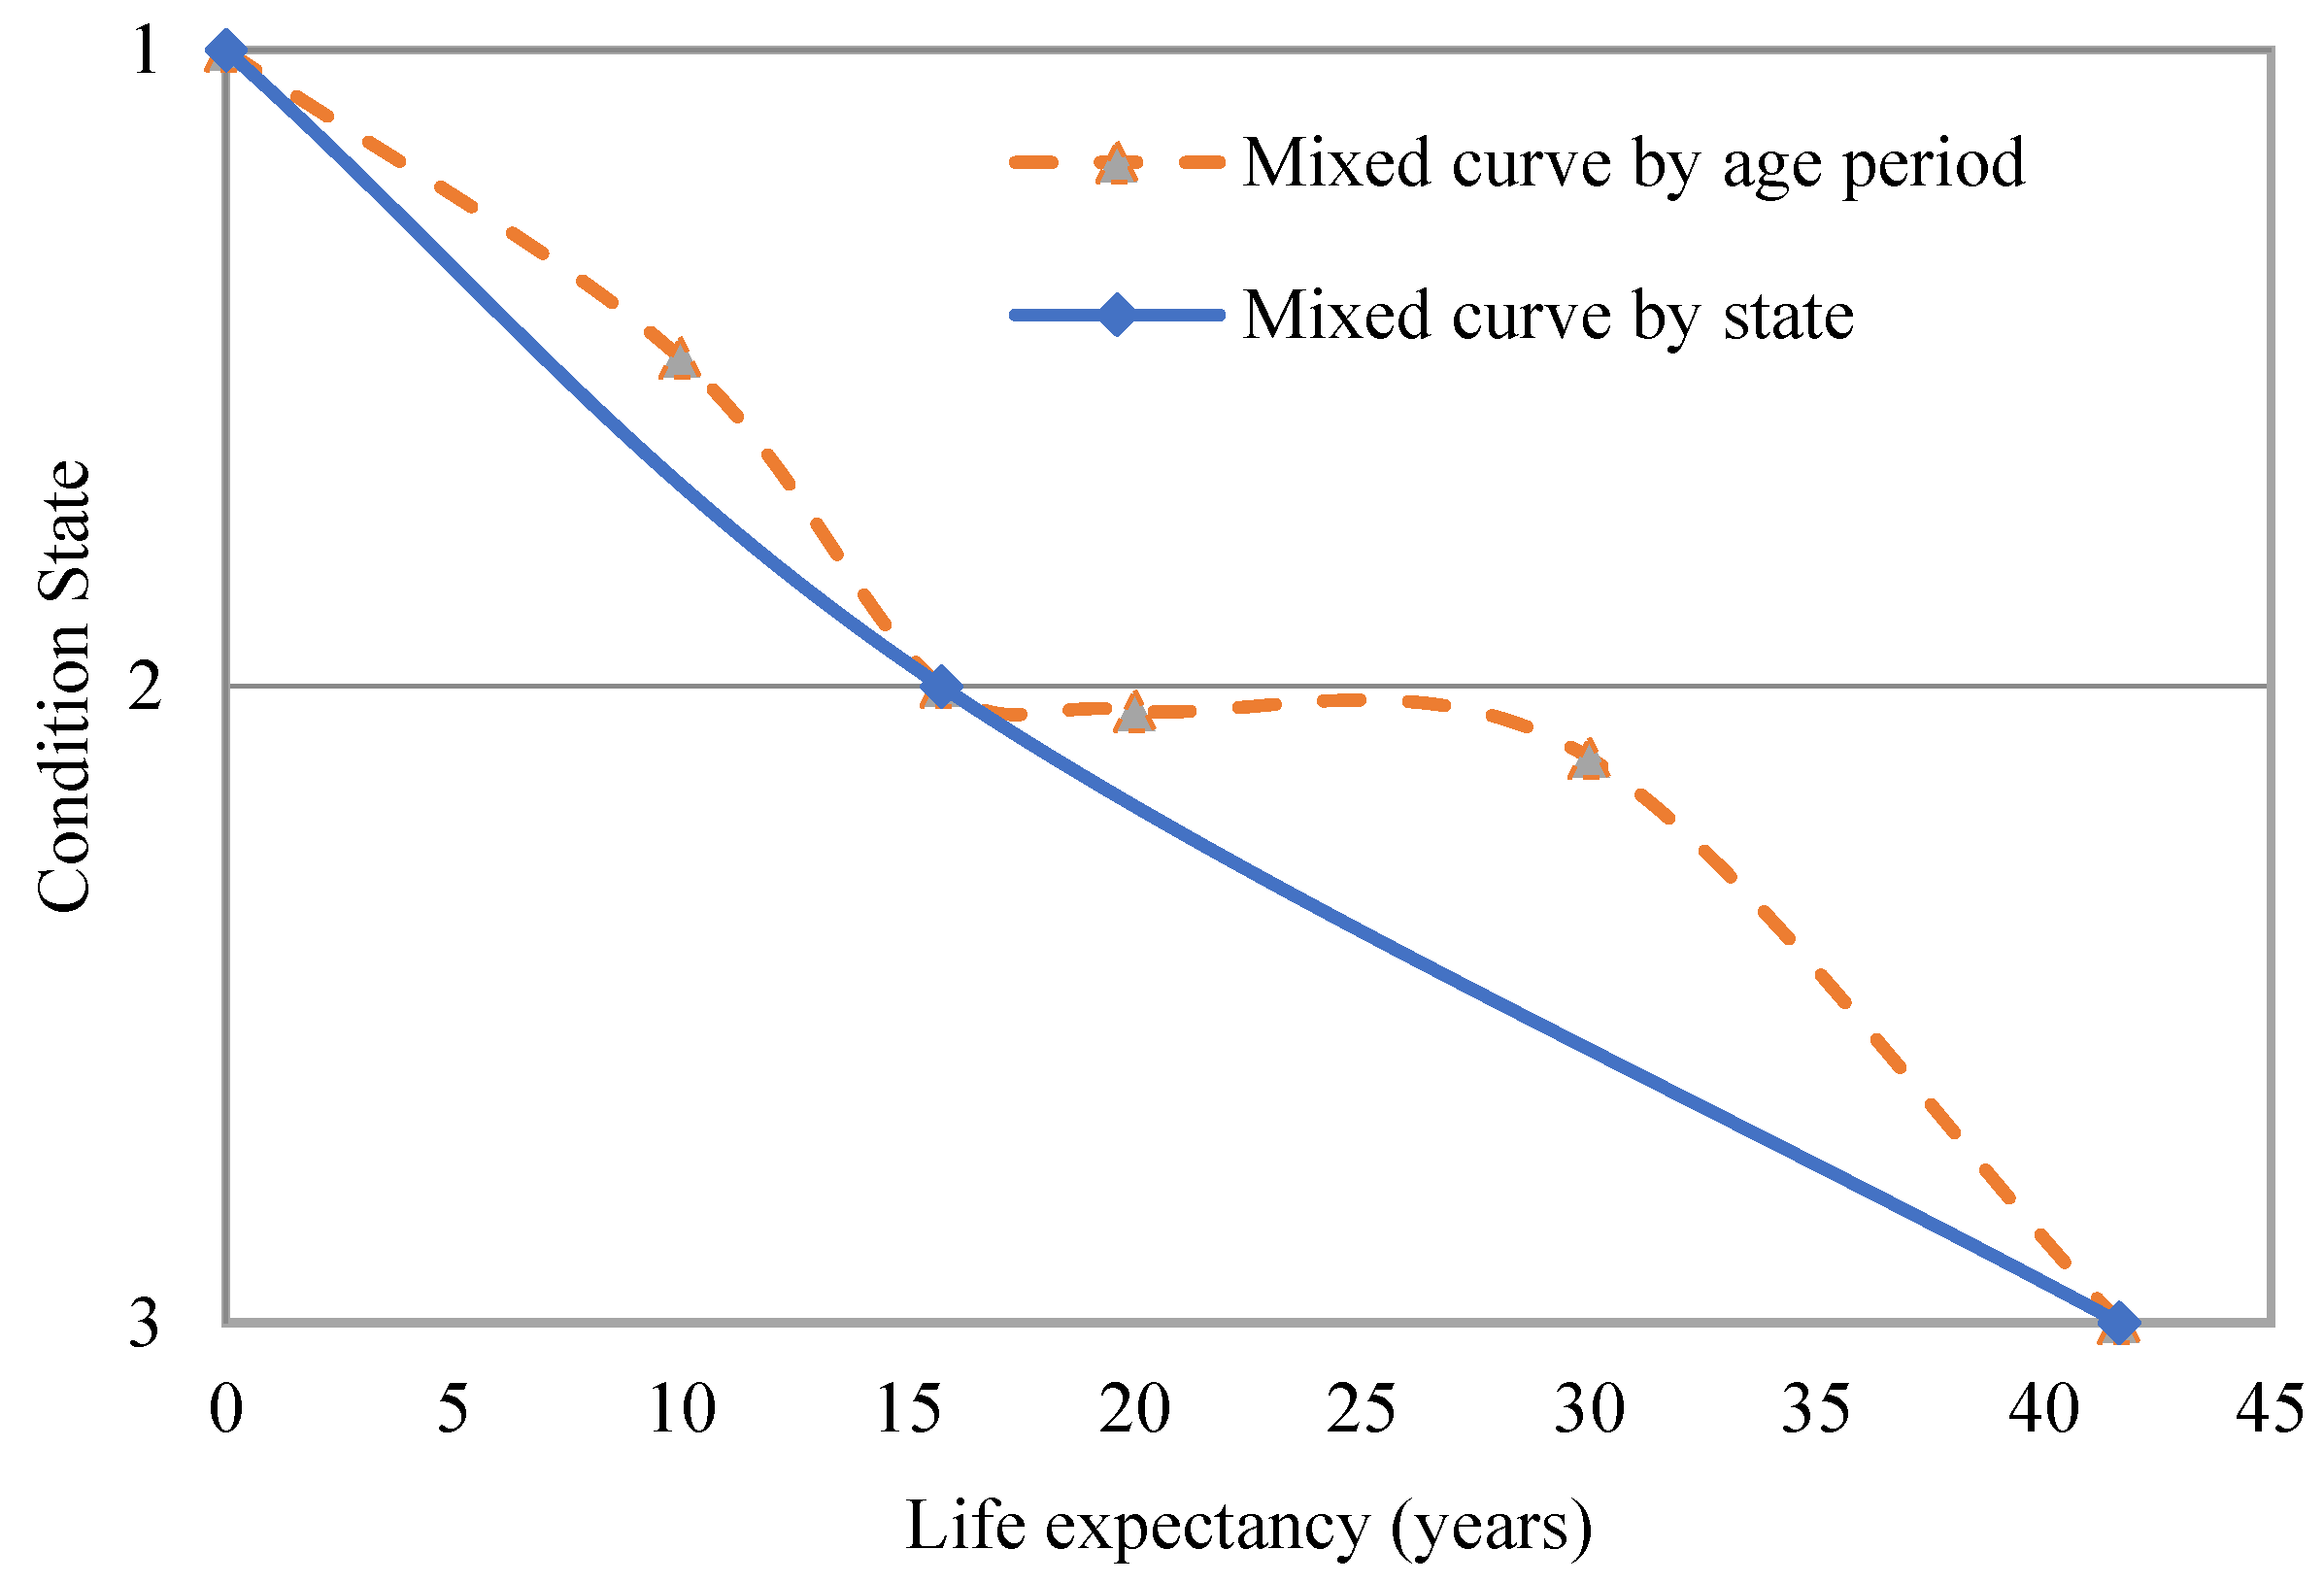
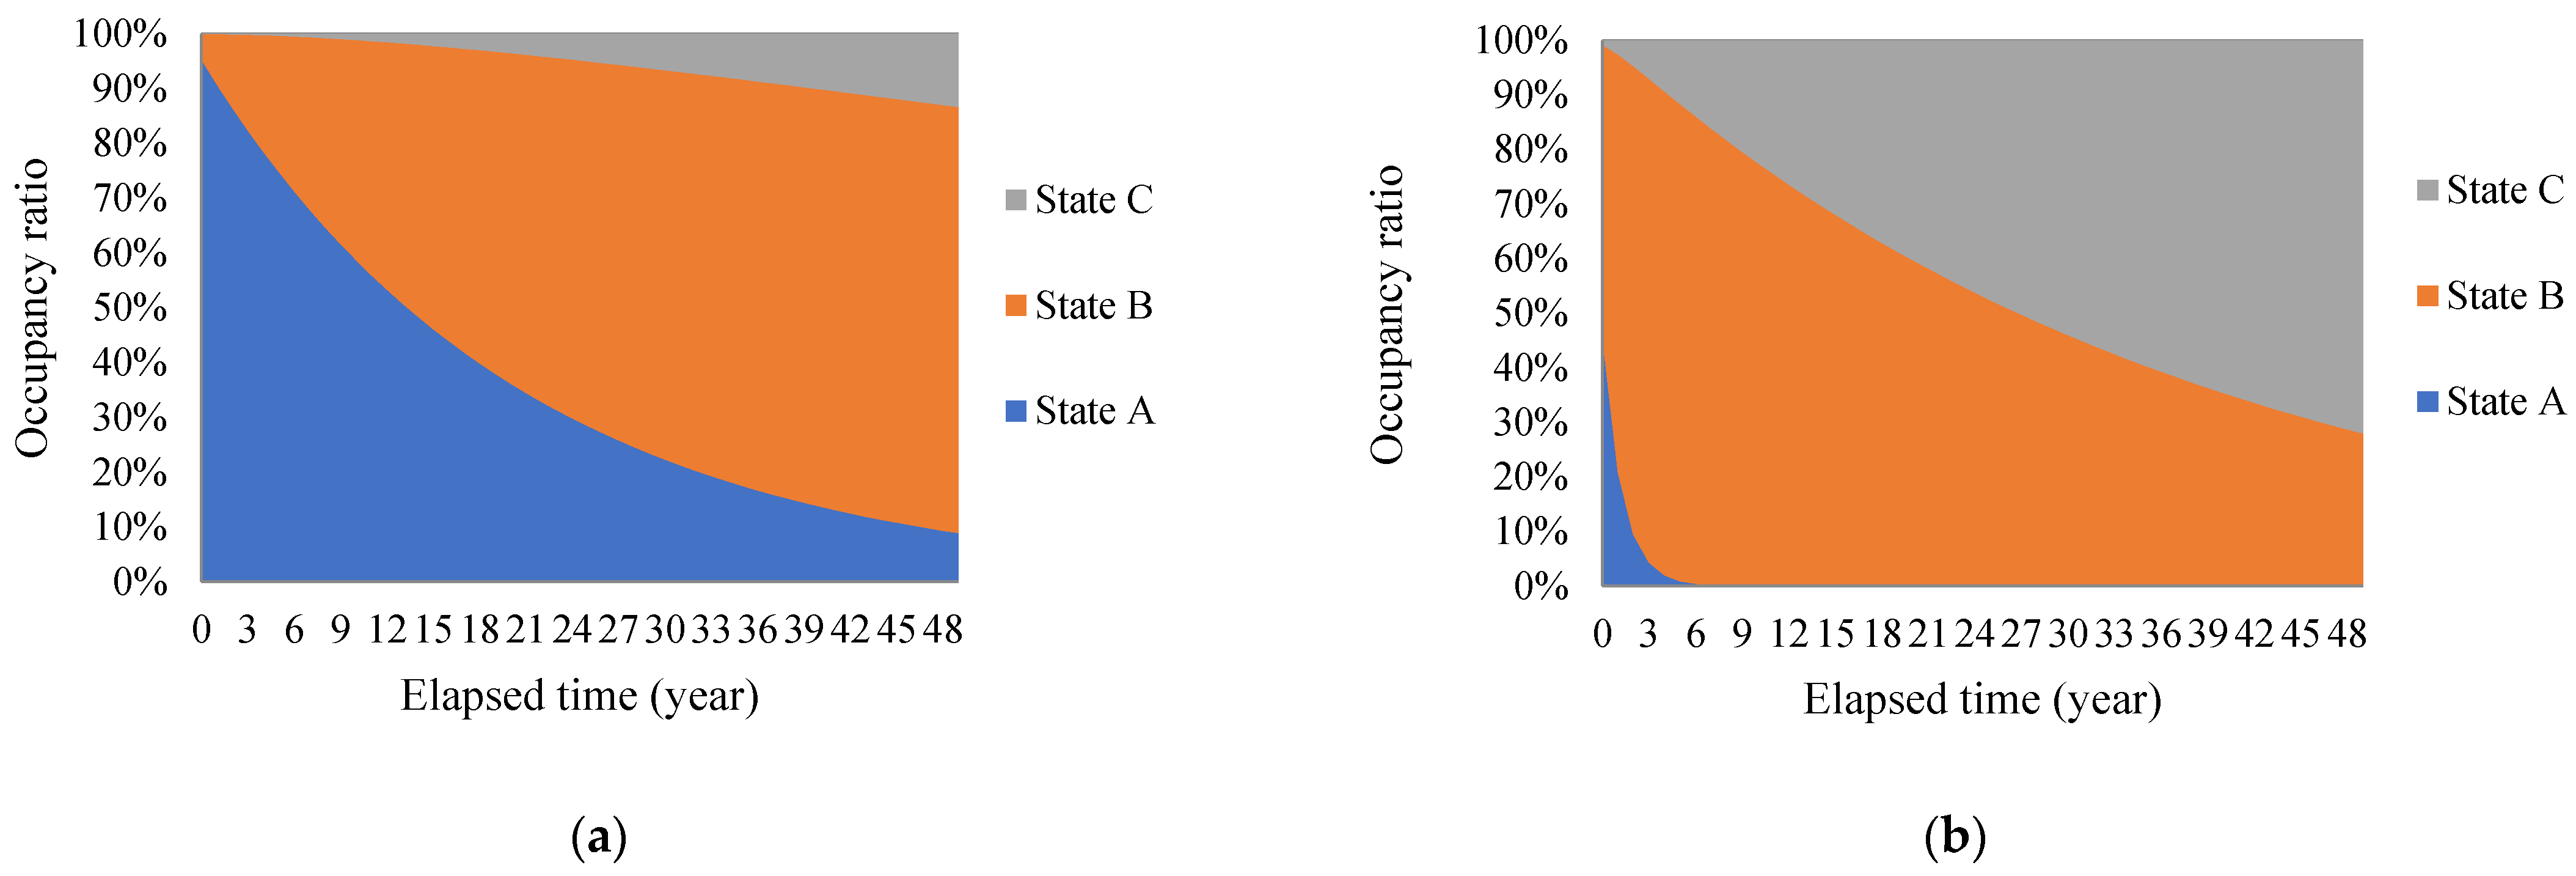
3.2. Estimation of Deterioration Processes and Life Expectancies by Age Group
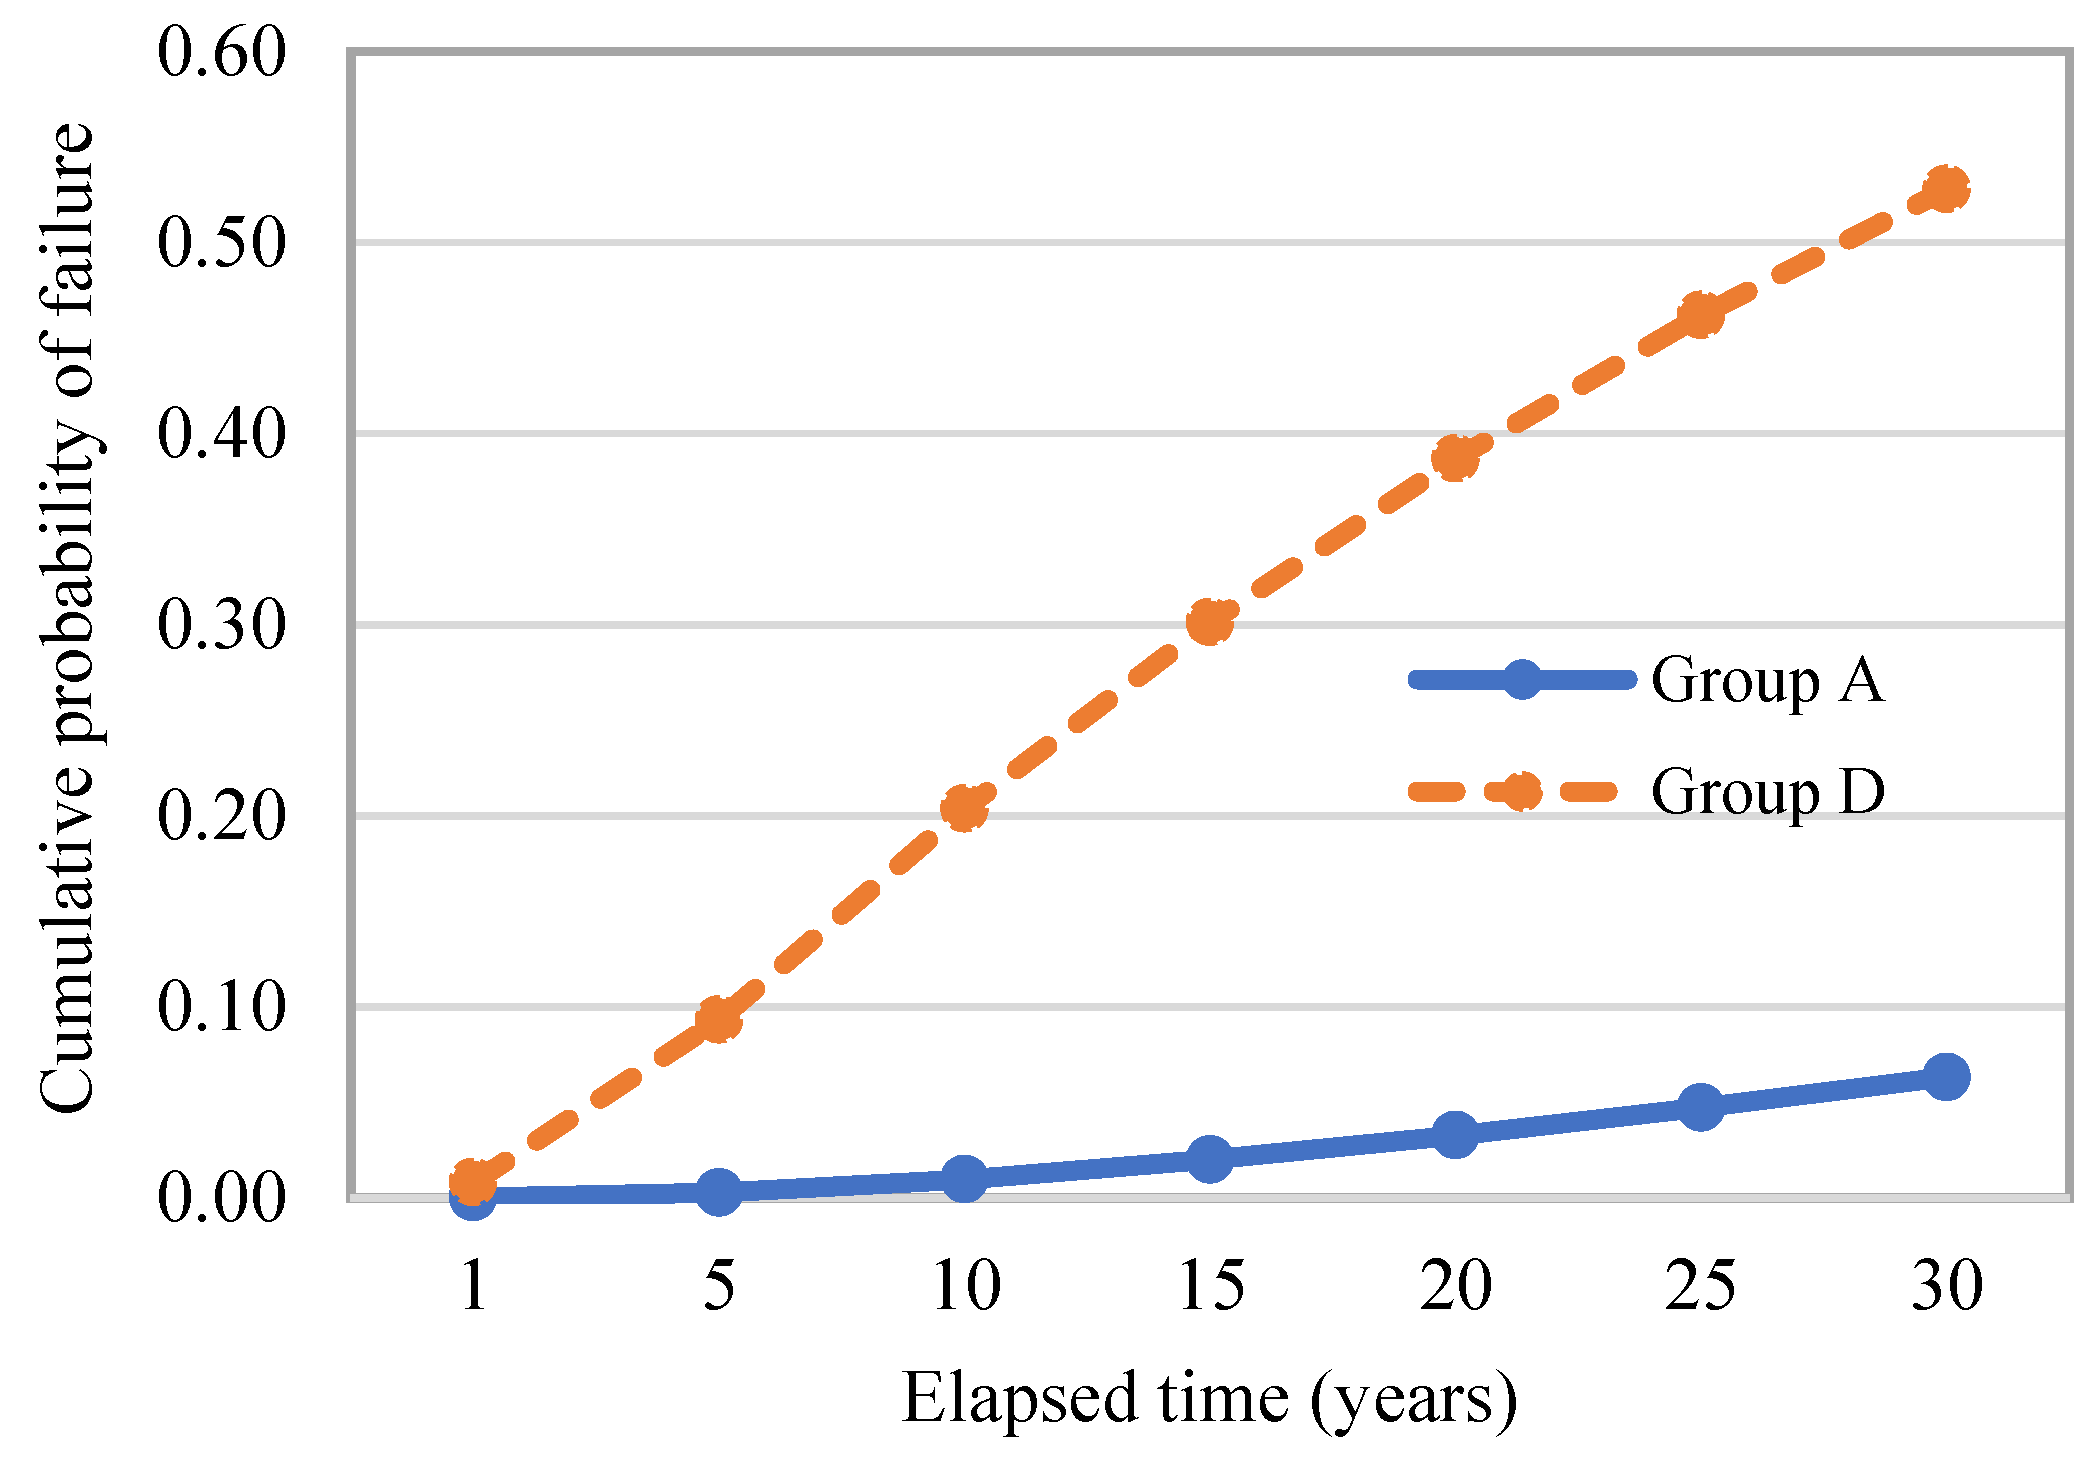
3.3. Analysis of the Risk of Deficiency by Age Group
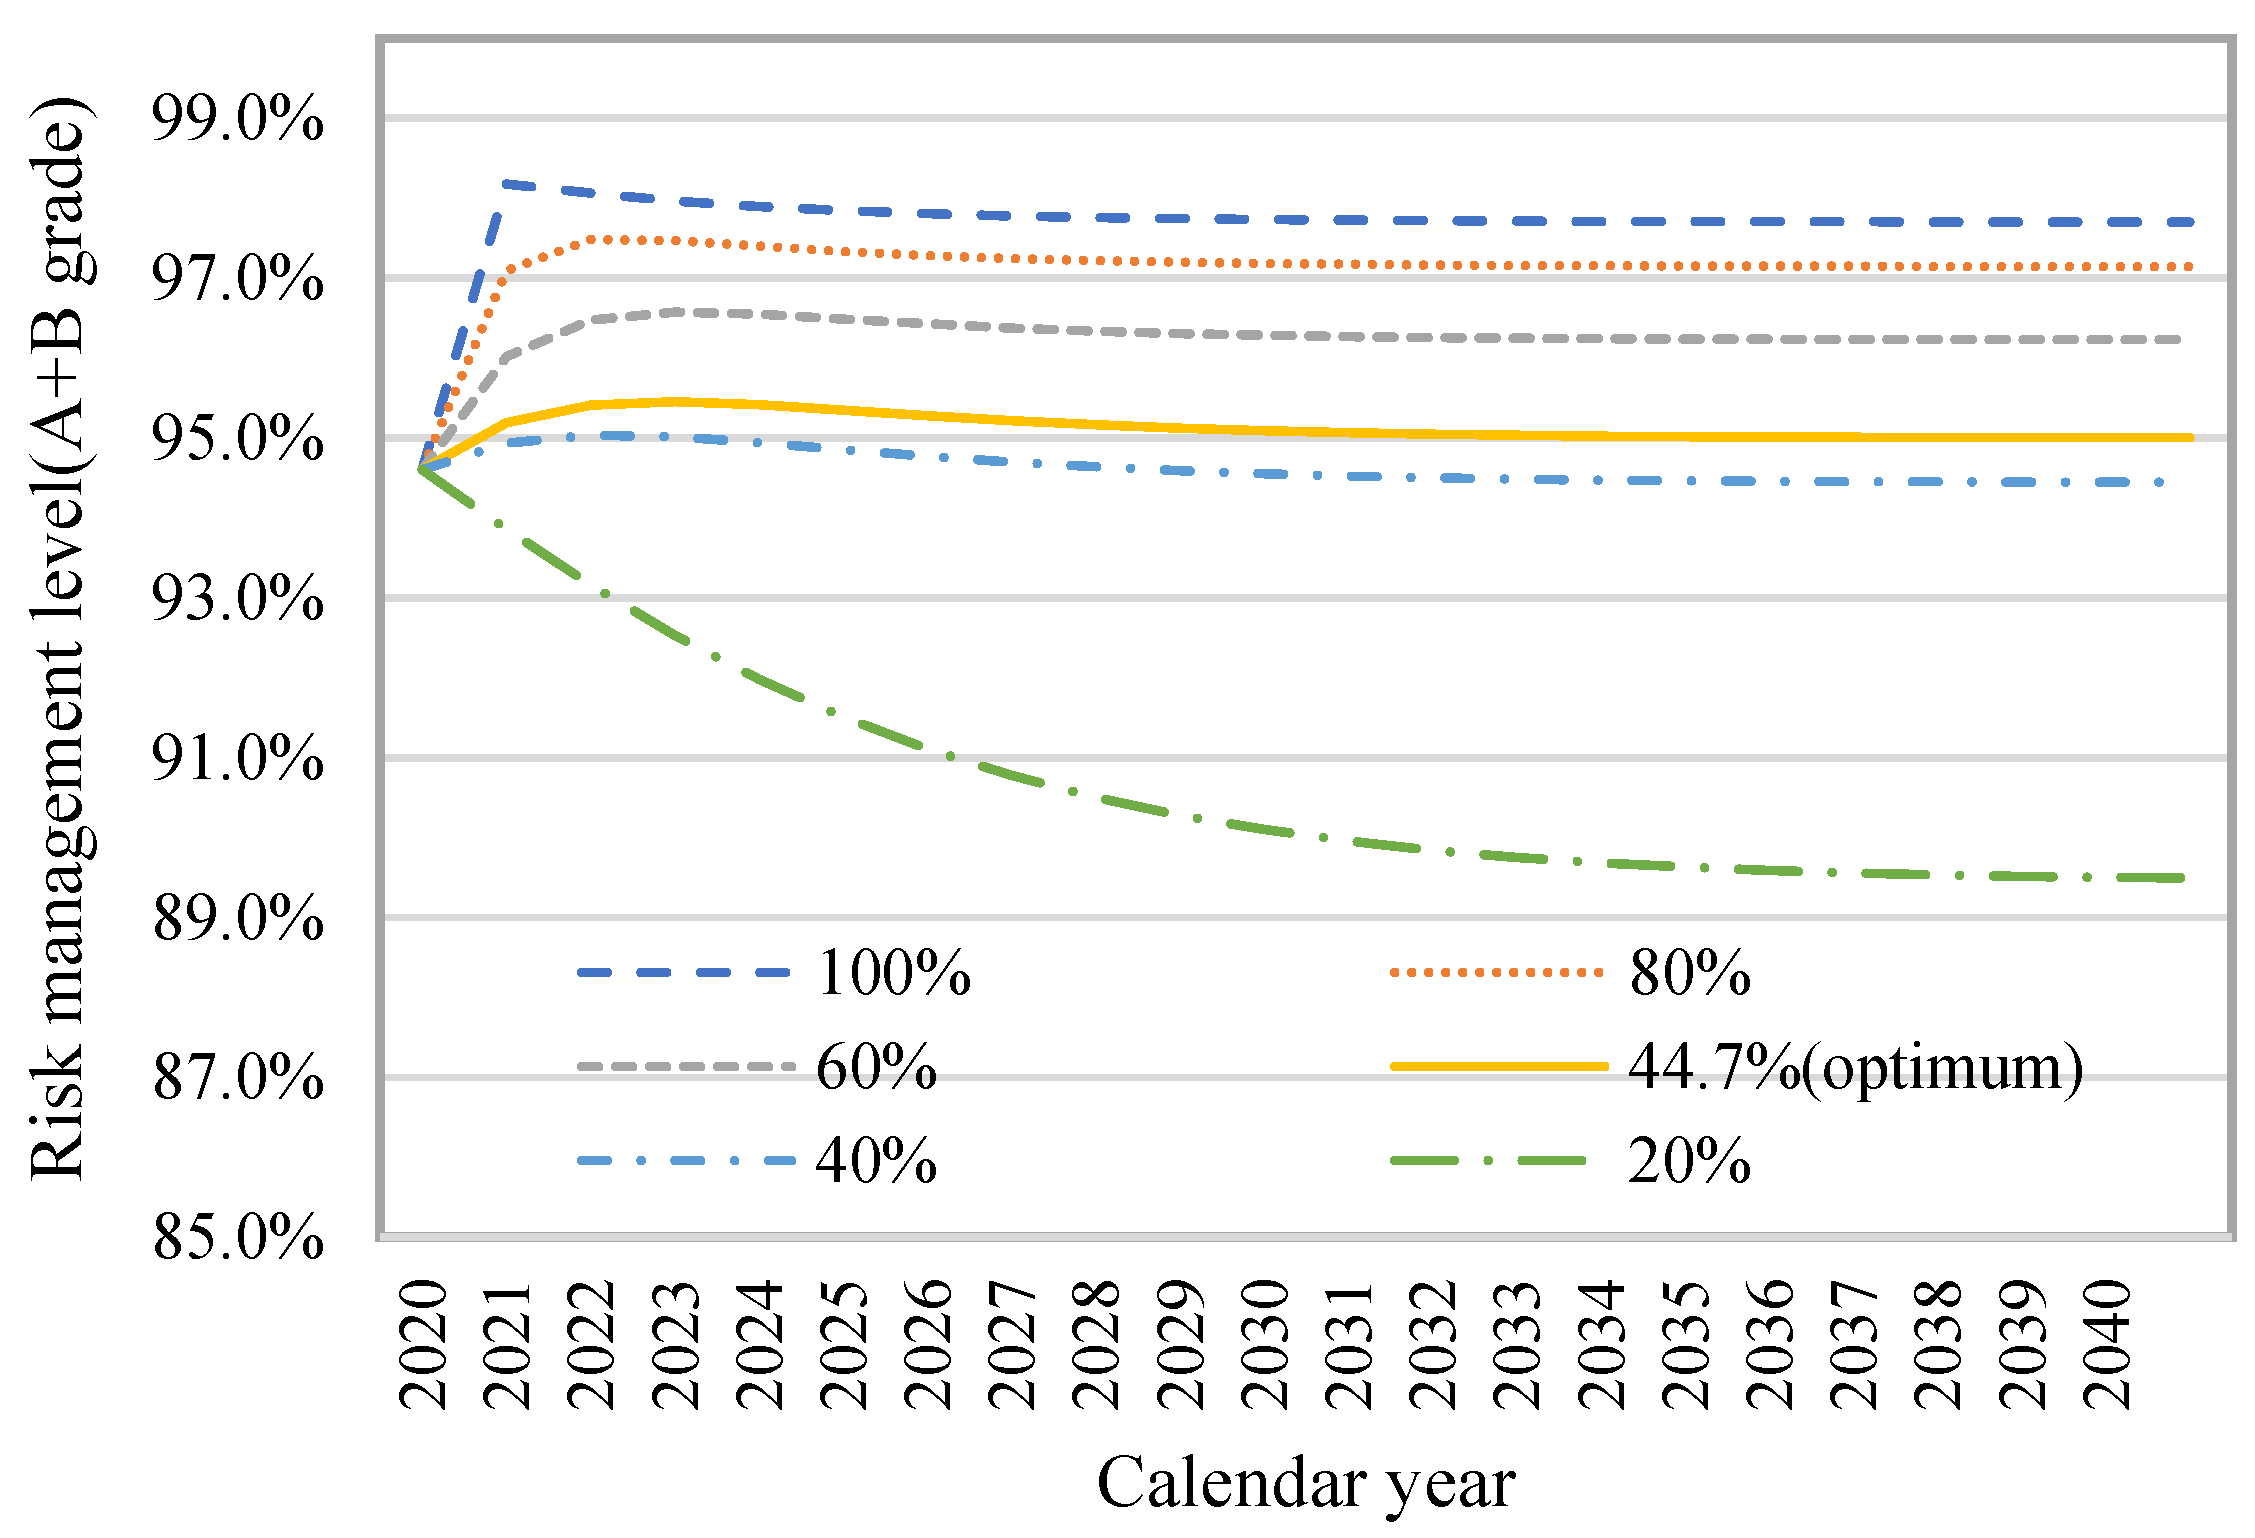
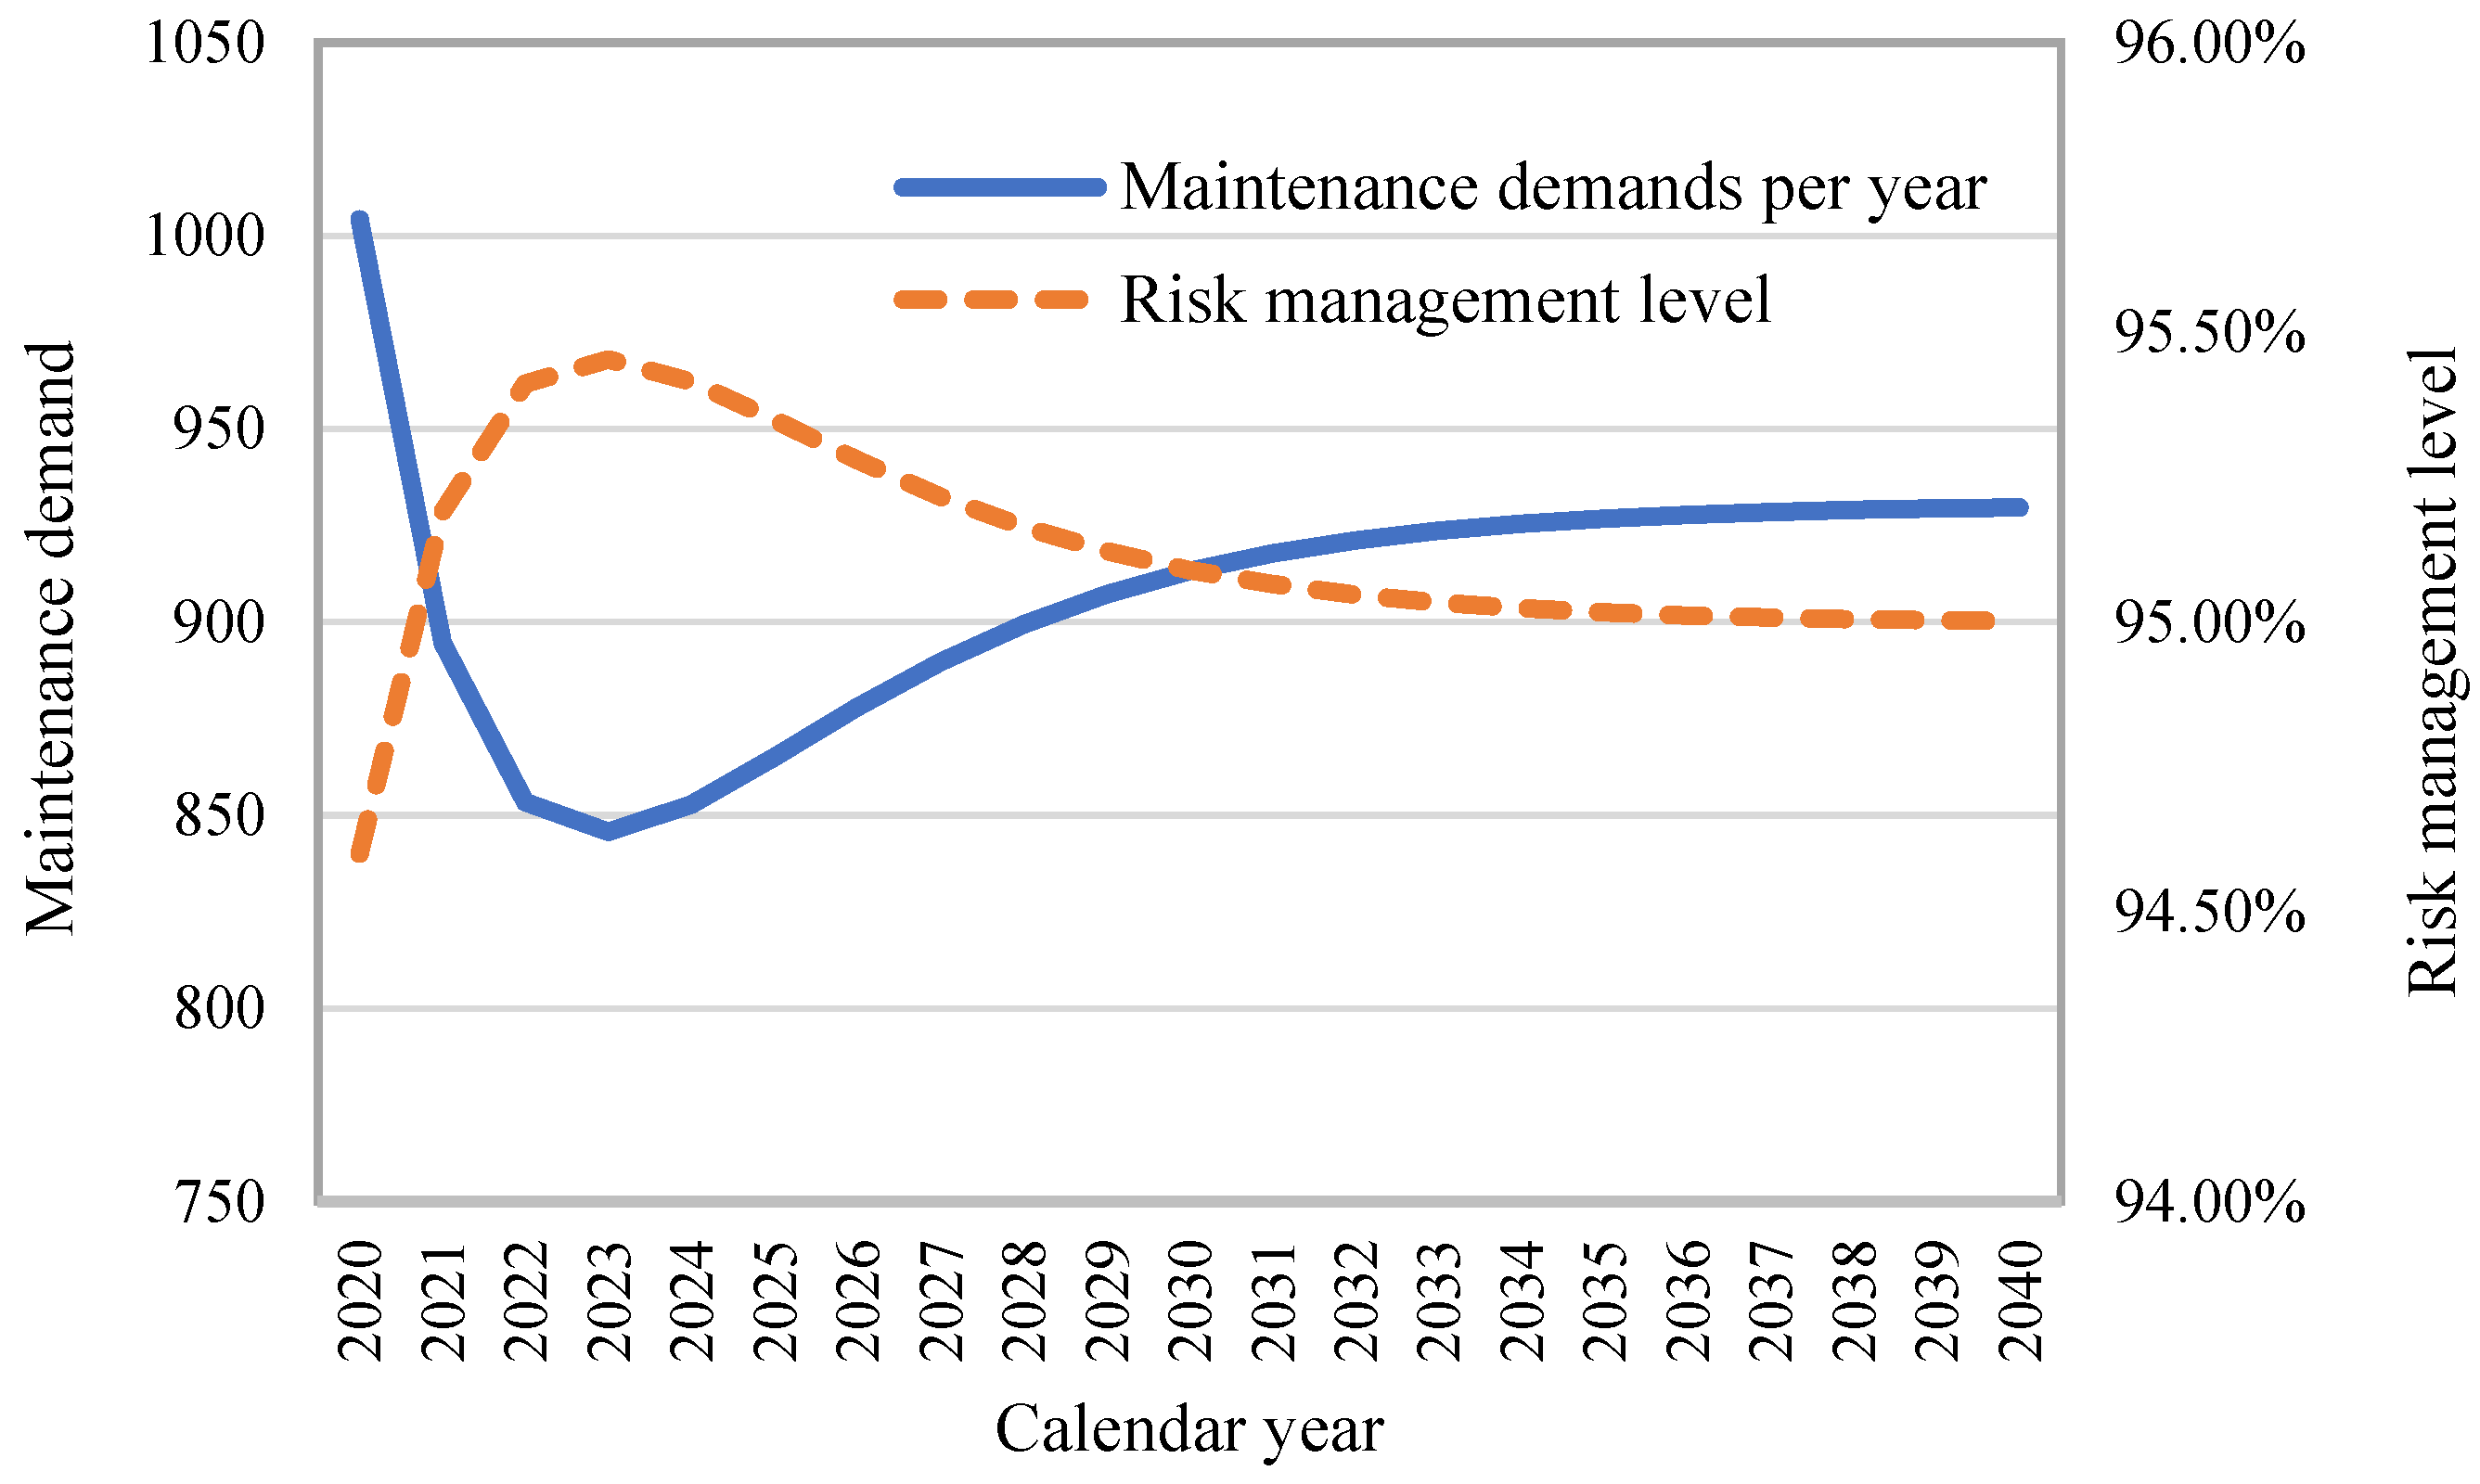
3.4. Maintenance Demand to Achieve the Target Level of Risk Management-Example
4. Discussion
- The life expectancy of old bridges used for more than 30 years is 14.4 years, which is 1/3 of the network average of 41.9 years.
- The probability of deficiencies of the old bridges is seven times higher than that of new bridges of 10 years old or less.
- Preventive maintenance can help prolong the life expectancy of a bridge; however, it cannot completely prevent the deterioration of the condition grade.
- In order to keep the bridge management risk level of ROK above 95% of A + B Grade, 44.7% of Grade C bridges must be continuously maintained every year.
Funding
Acknowledgments
Conflicts of Interest
References
- ISO (International Organization for Standardization). ISO 55000:2014 Asset Management-Overview, Principles and Terminology; International Organization for Standardization: Geneva, Switzerland, 2014; p. 14. [Google Scholar]
- ISO (International Organization for Standardization). ISO 55001:2014 Asset Management-Management Systems-Requirements; International Organization for Standardization: Geneva, Switzerland, 2014; pp. 4–5. [Google Scholar]
- IPWEA (Institute of Public Works Engineering Australasia). International Infrastructure Management Manual (International Edition 2015, 5th ed.; Institute of Public Works Engineering Australasia: North Sydney, Australasia, 2015; pp. 3|35–3|58. [Google Scholar]
- ASTM (American Society for Testing and Material). Standard Classification for Bridge Elements–Uniformat II (E2103/E2103M-19); ASTM International: West Conshohocken, PA, USA, 2019; pp. 1–21. [Google Scholar]
- ASCE (American Society of Civil Engineers). 2021 Infrastructure Report Card for America’s Infrastructure; American Society of Civil Engineers: Washington, DC, USA, 2020; pp. 18–25. [Google Scholar]
- Srikanth, I.; Arockiasamy, M. Deterioration models for prediction of remaining useful life of timber and concrete bridges: A review. J. Traffic Transp. Eng. 2020, 7, 152–173. [Google Scholar] [CrossRef]
- Wikipeida. Available online: https://en.wikipedia.org/wiki/Seongsu_Bridge (accessed on 15 May 2021).
- Wikipeida. Available online: https://en.wikipedia.org/wiki/List_of_bridge_failures (accessed on 15 May 2021).
- Ford, K.M.; Arman, M.; Labi, S.; Sinha, K.C.; Ashirole, A.; Thompson, P.; Li, Z. Methodology for Estimating Life Expectancies of Assets, Draft Final Report of NCHRP Project 08-17; Purdue University: West Lafayette, IN, USA, 2011; pp. 54–56. [Google Scholar]
- Estes, A.C.; Frangopol, D.M. Repair optimization of highway bridges using system reliability approach. J. Struct. Eng. 1999, 125, 766–775. [Google Scholar] [CrossRef] [Green Version]
- Sinha, K.C.; Labi, S.A.; McCullouch, B.G.; Bhargava, A.; Bai, Q. Updating and Enhancing the Indiana Bridge Management System (IBMS), Volume 1 (Technical Manual); Publication FHWA/IN/JTRP-2008/30; Indiana Department of Transportation and Purdue University: West Lafayette, IN, USA, 2009; pp. 97–107. [Google Scholar]
- Cope, A.R. Multiple-Criteria Life-Cycle Evaluation of Alternative Bridge Deck Reinforcement Materials Using Rank Matrix Analysis. Ph.D. Thesis, Purdue University, West Lafayette, IN, USA, 2009. [Google Scholar]
- Tsuda, Y.; Kaito, K.; Aoki, K.; Kobayashi, K. Estimating Markovian transition probabilities for bridge deterioration forecasting. J. Struct. Eng. Earthq. Eng. 2006, 23, 241s–256s. [Google Scholar] [CrossRef] [Green Version]
- Hallberg, D. Development and Adaptation of a Life Cycle Management System for Developed Work. Ph.D. Thesis, KTH Royal Institute of Technology, Stockholm, Sweden, 2005. [Google Scholar]
- Saeed, T.U.; Moomen, M.; Ahmed, A.; Murillo-Hoyos, J.; Volovski, M.; Labi, S. Performance evaluation and life prediction of highway concrete bridge superstructure across design types. J. Perform. Constr. Facil. 2017, 31, 1–14. [Google Scholar] [CrossRef]
- Lavrenz, S.M.; Saeed, T.U.; Murillo-Hoyos, J.; Volovski, M.; Labi, S. Can interdependency considerations enhance forecasts of bridge infrastructure condition? evidence using a multivariate regression approach. Struct. Infrastruct. Eng. 2020, 16, 1177–1185. [Google Scholar] [CrossRef]
- Saeed, T.U.; Qiao, Y.; Chen, S.; Alqadhi, S.; Zhang, Z.; Labi, S.; Sinha, K.C. Effects of Bridge Surface and Pavement Maintenance Activities on Asset Rating; Publication FHWA/IN/JTRP-2017/19; Indiana Department of Transportation and Purdue University: West Lafayette, IN, USA, 2017; pp. 1–56. [Google Scholar] [CrossRef]
- Saeed, T.U.; Qiao, Y.; Chen, S.; Gkritza, K.; Labi, S. Methodology for probabilistic modeling of highway bridge infrastructure condition: Accounting for improvement effectiveness and incorporating random effects. J. Infrastruct. Syst. 2017, 23, 1–11. [Google Scholar] [CrossRef]
- Wan, C.; Zhou, Z.; Li, S.; Ding, Y.; Xu, Z.; Yang, Z.; Xia, Y.; Yin, F. Development of a bridge management system on the building information modeling technology. Sustainability 2019, 11, 4583. [Google Scholar] [CrossRef] [Green Version]
- Safi, M.; Sundquist, H.; Karoumi, R. Cost-efficient procurement of bridge infrastructures by incorporating life-cycle cost analysis with bridge management systems. J. Bridge Eng. 2014, 20, 1–12. [Google Scholar] [CrossRef]
- Teresa, M.A.; Juni, E. Element Unit and Failure Costs and Functional Improvement Costs for Use in the Mn/DOT Pontis Bridge Management System; Minnesota Department of Transportation: St. Paul, MN, USA, 2003; pp. 1–51.
- Han, D. Empirical evaluation of utility of anti-frost layer in pavement structure considering regional climate characteristics. Intl. J. Pavement Eng. 2021, 1–8. [Google Scholar] [CrossRef]
- Kaito, K.; Kobayashi, K. Bayesian estimation of markov deterioration hazard model. J. Jpn. Soc. Civ. Eng. Part A 2007, 63, 336–355. (In Japanese) [Google Scholar] [CrossRef] [Green Version]
- Han, D.; Kaito, K.; Kobayashi, K. Application of bayesian estimation method with markov hazard model to improve deterioration forecasts for infrastructure asset management. KSCE J. Civ. Eng. 2014, 18, 2107–2119. [Google Scholar] [CrossRef]
- Obama, K.; Okada, K.; Kaito, K.; Kobayashi, K. Disaggregated hazard rates evaluation and bench-marking. J. Jpn. Soc. Civ. Eng. 2008, 64, 857–874. (In Japanese) [Google Scholar] [CrossRef] [Green Version]
- Kaito, K.; Kobayashi, K.; Aoki, K.; Matsuoka, K. Hierarchical bayesian estimation of mixed hazard models. J. Jpn. Soc. Civ. Eng. 2012, 68, 255–271. (In Japanese) [Google Scholar] [CrossRef] [Green Version]
- Han, D.; Lee, S. Stochastic forecasting of life expectancies considering multi-maintenance criteria and localized uncertainty in the pavement-deterioration process. J. Test. Eval. 2016, 44, 128–140. [Google Scholar] [CrossRef]
- Han, D.; Kaito, K.; Kobayashi, K.; Aoki, K. Performance evaluation of advanced pavement materials by bayesian markov mixture hazard model. KSCE J. Civ. Eng. 2017, 20, 729–737. [Google Scholar] [CrossRef]
- Train, K.E. Discrete Choice Methods with Simulation, 2nd ed.; Cambridge University Press: New York, NY, USA, 2009; pp. 199–202. [Google Scholar]
- MOLIT (Ministry of Land, Infrastructure and Transport). Basic Act on Sustainable Infrastructure Management.; National Act-17237; Ministry of Land, Infrastructure and Transport: Sejong-Si, Korea, 2020; p. 1. (In Korean)
- MOLIT (Ministry of Land, Infrastructure and Transport). Development of 1st Road Infrastructure Management Plan (2020~2025); Ministry of Land, Infrastructure and Transport: Sejong-Si, Korea, 2020; pp. 33–144. (In Korean)
- MOLIT (Ministry of Land, Infrastructure and Transport). Yearbook of Road Bridge and Tunnel Statistics in 2020; 11-1613000-000108-10; Ministry of Land, Infrastructure and Transport: Sejong-Si, Korea, 2020; p. 4. (In Korean)
- MOLIT (Ministry of Land, Infrastructure and Transport). Detailed Guidelines for Safety Inspection and Precise Safety Diagnosis-Bridge; RD-12-E6-024; Ministry of Land, Infrastructure and Transport: Sejong-Si, Korea, 2021; pp. 235–236. (In Korean)
- MOEF (Ministry of Economy and Finance). Guidelines for Accounting for Depreciation of Intangible and Intangible Assets; Ministry of Economy and Finance: Sejong-Si, Korea, 2011; p. 6. (In Korean)
- MOLIT (Ministry of Land, Infrastructure and Transport). Evaluation Standard for Performance Improvement Project of Road Facilities; Government Notice–2021/213; Ministry of Land, Infrastructure and Transport: Sejong-Si, Korea, 2021; pp. 7–16. (In Korean)
- MOLIT (Ministry of Land, Infrastructure and Transport). Management Standards for Road Facilities; Government Notice-2021/214; Ministry of Land, Infrastructure and Transport: Sejong-Si, Korea, 2021; p. 6. (In Korean)
- Geweke, J. Evaluating the accuracy of sampling-based approaches to the calculation of posterior moments. In Bayesian Statistics, 4th ed.; Bernardo, J.M., Berger, J.M., Dawid, A.P., Smith, A.F.M., Eds.; Oxford University Press: Oxford, UK, 1992; pp. 169–193. [Google Scholar]
- Koop, G.; Poirier, D.J.; Tobias, J.L. Bayesian Econometric Methods; Cambridge University Press: New York, NY, USA, 2007; pp. 128–157. [Google Scholar]


| Condition State | Definition | What to Be Done |
|---|---|---|
| A | Best condition without problems | - |
| B | A minor defect has occurred in the auxiliary member, but it does not interfere with its functioning, and some parts need to be repaired for improving durability. | Daily management |
| C | A minor defect has occurred in a main part, or a wide range of defects have occurred in an auxiliary part, but it does not interfere with the overall safety of the facility, and the main part needs repairs to prevent deterioration in its durability and functionality, or the auxiliary part needs simple reinforcement. | Maintenance of main and auxiliary parts (to be State A or B) |
| D | Urgent rehabilitation or reinforcement is required as the defects have occurred in a major part, and it is necessary to decide whether to restrict its use. | Emergency rehabilitation or reinforcement, and review of suspension of use of bridges |
| E | The use of the facility is immediately prohibited, and reinforcement or renovation is required because there is a risk to the safety of the facility due to serious defects in major parts. | Suspension of use of bridges |
| Groups | Grouping Standard | Num. of Sample Set | AADT |
|---|---|---|---|
| Total (Benchmark) | All samples | 30,040 | 32,164 |
| Group A | Less than 10 years | 15,860 | 27,592 |
| Group B | 10 to 20 years | 11,686 | 38,693 |
| Group C | 20 to 30 year | 2048 | 31,252 |
| Group D | Over 30 years | 446 | 27,855 |
|
Condition State | Betas (Geweke’s Z) | Explanatory Variables (Normalized Value by (0,1]) |
Heterogeneity Factors (Geweke’s Z) | |||||||||
|---|---|---|---|---|---|---|---|---|---|---|---|---|
| Benchmark | Benchmark | |||||||||||
| A to B | −1.34 | 0.16 | 0.099 | 0.085 | 0.119 | 0.096 | 0.086 | 1.000 | 0.181 | 0.335 | 0.285 | 2.943 |
| (0.09) | (0.01) | |||||||||||
| B to C | −3.73 | 0.87 | (−0.11) | (−0.09) | (−0.05) | (0.003) | ||||||
| (0.09) | (−0.06) | |||||||||||
| Condition State | Hazard Functions | Life Expectancy (Year) | ||||||||
|---|---|---|---|---|---|---|---|---|---|---|
| Benchmark | Group 1 | Group 2 | Group 3 | Group 4 | Benchmark | Group 1 | Group 2 | Group 3 | Group 4 | |
| A to B | 0.267 | 0.048 | 0.090 | 0.076 | 0.785 | 3.74 | 20.68 | 11.13 | 13.14 | 1.27 |
| B to C | 0.026 | 0.005 | 0.009 | 0.007 | 0.076 | 38.25 | 213.43 | 112.07 | 134.53 | 13.14 |
| Total life expectancy (year) | 41.99 | 234.12 | 123.20 | 147.68 | 14.41 | |||||
| Referred Deterioration Functions | Annual Condition Degrade Function | Duration (Year) | Cumulated Life Expectancy (Year) |
|---|---|---|---|
| Group1/State 1 | 0.0483 | 10.00 | 10.00 |
| Group2/State 1 | 0.0898 | 5.75 | 15.75 |
| Group2/State 2 | 0.0089 | 4.25 | 20.00 |
| Group3/State 2 | 0.0074 | 10.00 | 30.00 |
| Group4/State 2 | 0.0761 | 11.66 | 41.66 |
| State | Benchmark | Group A | Group B | Group C | Group D | ||||||||||
|---|---|---|---|---|---|---|---|---|---|---|---|---|---|---|---|
| A | B | C | A | B | C | A | B | C | A | B | C | A | B | C | |
| A | 0.766 | 0.231 | 0.003 | 0.953 | 0.047 | 0.0001 | 0.914 | 0.086 | 0.0004 | 0.927 | 0.073 | 0.0003 | 0.456 | 0.536 | 0.008 |
| B | - | 0.974 | 0.026 | - | 0.995 | 0.0047 | - | 0.991 | 0.0089 | - | 0.993 | 0.0074 | - | 0.974 | 0.026 |
| C | - | - | 1.000 | - | - | 1.0000 | - | - | 1.0000 | - | - | 1.0000 | - | - | 1.000 |
| POF | 2.90% | 0.48% | 0.93% | 0.77% | 3.38% | ||||||||||
| Elapsed Time (Year) | POF of Group A | POF of Group D | Times (Group D/A) |
|---|---|---|---|
| 1 | 0.0001 | 0.0080 | 71.5 |
| 5 | 0.0026 | 0.0930 | 35.8 |
| 10 | 0.0095 | 0.2036 | 21.3 |
| 15 | 0.0198 | 0.3011 | 15.2 |
| 20 | 0.0325 | 0.3868 | 11.9 |
| 25 | 0.0471 | 0.4619 | 9.8 |
| 30 | 0.0631 | 0.5279 | 8.4 |
| Total Number | A Grade | B Grade | C–E Grades | Note |
|---|---|---|---|---|
| 18,598 | 5078 | 12,517 | 1003 | Including expressway, national highways, and privately funded roads |
| (100.0%) | (27.3%) | (67.3%) | (5.4%) |
| Year | A Grade | B Grade | C~E Grades | Risk Management Level (=A + B Grade) | Maintenance Demands |
|---|---|---|---|---|---|
| 2020 | 0.273 | 0.673 | 0.054 | 94.60% | 1004 |
| 2021 | 0.233 | 0.719 | 0.048 | 95.19% | 895 |
| 2022 | 0.200 | 0.754 | 0.046 | 95.41% | 853 |
| 2023 | 0.174 | 0.781 | 0.045 | 95.45% | 846 |
| 2024 | 0.153 | 0.801 | 0.046 | 95.41% | 853 |
| 2025 | 0.138 | 0.816 | 0.047 | 95.35% | 865 |
| 2026 | 0.126 | 0.826 | 0.047 | 95.28% | 878 |
| 2027 | 0.118 | 0.834 | 0.048 | 95.22% | 890 |
| 2028 | 0.112 | 0.840 | 0.048 | 95.16% | 899 |
| 2029 | 0.107 | 0.844 | 0.049 | 95.12% | 907 |
| 2030 | 0.104 | 0.847 | 0.049 | 95.09% | 913 |
| 2031 | 0.101 | 0.849 | 0.049 | 95.07% | 918 |
| 2032 | 0.100 | 0.851 | 0.050 | 95.05% | 921 |
| 2033 | 0.098 | 0.852 | 0.050 | 95.03% | 924 |
| 2034 | 0.098 | 0.853 | 0.050 | 95.02% | 925 |
| 2035 | 0.097 | 0.853 | 0.050 | 95.02% | 927 |
| 2036 | 0.096 | 0.854 | 0.050 | 95.01% | 928 |
| 2037 | 0.096 | 0.854 | 0.050 | 95.01% | 928 |
| 2038 | 0.096 | 0.854 | 0.050 | 95.00% | 929 |
| 2039 | 0.096 | 0.854 | 0.050 | 95.00% | 929 |
| 2040 | 0.096 | 0.854 | 0.050 | 95.00% (Converged) | 930 |
Publisher’s Note: MDPI stays neutral with regard to jurisdictional claims in published maps and institutional affiliations. |
© 2021 by the author. Licensee MDPI, Basel, Switzerland. This article is an open access article distributed under the terms and conditions of the Creative Commons Attribution (CC BY) license (https://creativecommons.org/licenses/by/4.0/).
Share and Cite
Han, D. Heterogeneous Deterioration Process and Risk of Deficiencies of Aging Bridges for Transportation Asset Management. Sustainability 2021, 13, 7094. https://doi.org/10.3390/su13137094
Han D. Heterogeneous Deterioration Process and Risk of Deficiencies of Aging Bridges for Transportation Asset Management. Sustainability. 2021; 13(13):7094. https://doi.org/10.3390/su13137094
Chicago/Turabian StyleHan, Daeseok. 2021. "Heterogeneous Deterioration Process and Risk of Deficiencies of Aging Bridges for Transportation Asset Management" Sustainability 13, no. 13: 7094. https://doi.org/10.3390/su13137094
APA StyleHan, D. (2021). Heterogeneous Deterioration Process and Risk of Deficiencies of Aging Bridges for Transportation Asset Management. Sustainability, 13(13), 7094. https://doi.org/10.3390/su13137094