Abstract
The adsorption and desorption characteristics of cadmium (Cd) in uncontaminated soils have been investigated in numerous studies. However, similar studies on Cd-polluted soils from different sources, which exhibit complex physicochemical characteristics and internal interactions between Cd and the soil particles, are scarce. Therefore, in order to elucidate the adsorption and desorption characteristics of Cd in Cd polluted soils, six representative Cd-contaminated paddy soil samples were collected from farmlands in the vicinity of a steel plant (Soil 1), a smelter (Soil 2), a thermal power plant (Soil 3), two mining areas (Soil 4, the Dabaoshan mine, Shaoguan; Soil 5, a lead-zinc mine located at Lechang), and a paddy field irrigated with sewage at Zhongshan (Soil 6) in Guangdong Province, China. The analysis of the six soil samples showed that Cd adsorption fitted well to pseudo-second order as well as pseudo-first order kinetics; however, the pseudo-second order equation showed a better fit (R2 = 0.860–0.962), while Elovich and intraparticle kinetic models fitted the adsorption kinetics poorly. Further, the adsorption isotherms fitted well to both the Langmuir and Freundlich models, with the Freundlich model showing a better fit (R2 = 0.96–0.98). The following order was observed for the Cd(II) adsorption amount and rate: S5 > S6 > S1 > S3 > S2 > S4; meanwhile, the desorption amount and rate followed the opposite trend. Furthermore, the pH and soil organic matter were identified as the soil characteristics with the most significant impact on the adsorption and desorption behaviors of Cd(II) in the Cd-polluted soils.
1. Introduction
Cadmium is toxic to both plants and humans. Contamination by Cd is one of the most critical problems in the world that arouses considerable public health concerns [1,2,3]. Reportedly, anthropogenic activities, such as wastewater irrigation, have resulted in serious Cd contamination of paddy soils in some regions of China [4,5]. Cd in soils can easily be taken up by crops [6,7,8], and high levels of Cd in soils can result in Cd accumulation in crops and eventually in the bodies of humans via the food chain [9,10,11]. Upon entering the human body, Cd can be toxic, even at concentrations as low as 0.001 mg/L [12], Itai-itai disease is caused by the consumption of Cd-contaminated foods. The quantity [13] and concentration [14,15] of Cd that accumulates in crops is related to the availability of Cd in soils and can be affected by certain soil properties, including pH [16], soil organic matter (SOM) content [17,18], iron and manganese oxide contents [19], clay mineral content [20,21], and the composition of solids [22].
A series of complex physical interactions and chemical reactions, including adsorption–desorption, oxidation–reduction, precipitation–dissolution, ion exchange, and chelation reactions, occur when Cd enters the soil. Cd adsorption and desorption, which are important processes that occur on the soil surface, affect the concentration of the bioavailable Cd in soils as well as the Cd uptake by plants [23,24]. However, these processes also depend on the soil charge density and hydrolysis constant of Cd [5,25]. Previous studies have shown that clay minerals can facilitate Cd adsorption in loess soil [26]. Tran et al. [27] observed that soil pH and Cd concentration are the key factors that affect Cd adsorption and desorption by goethite at low equilibrium concentrations. However, in a study involving 18 soil types, Wang et al. reported that pH and CaCO3 are the dominant factors that affect Cd adsorption [28].
As mentioned above, Cd adsorption and desorption in different kinds of soils might be regulated by different factors. However, in most previous studies on Cd adsorption and desorption characteristics, uncontaminated soils were generally used; thus, there is limited knowledge regarding Cd adsorption and desorption behaviors in Cd-contaminated soils. The physicochemical properties of polluted soils are more complex than those of uncontaminated soils [29]; therefore, it is necessary to investigate Cd adsorption and desorption characteristics in polluted soils during the remediation of Cd-polluted soils.
In this study, six representative Cd-polluted type soils were sampled in Guangdong Province. The main objectives of this study were to: (1) investigate the adsorption kinetics and adsorption–desorption isotherms of Cd and (2) determine the effects of soil physicochemical properties on Cd adsorption–desorption by conducting batch experiments.
2. Materials and Methods
2.1. Soil Samples
Six representative Cd-polluted type soil samples were collected from the 0–20 cm plough layer of paddy fields in six different locations: Soil 1, located at 1 km from a steel plant at Shaoguan (24°42′ N, 113°38′ E); Soil 2, at 2 km from a smelter at Shaoguan (24°41′ N, 113°35′ E); Soil 3, at 2 km from a thermal power plant at Shaoguan (24°36′ N, 113°35′ E); Soil 4, at 16 km from the Dabaoshan mine at Shaoguan (24°46′ N, 113°49′ E); Soil 5, at 1 km from a lead-zinc mine at Lechang (25°51′ N, 113°24′ E); and Soil 6, at a sewage-irrigated paddy field in Zhongshan (22°54′ N, 113°41′ E). All six soil samples were paddy soil.
The soil samples were air dried and passed through 20 and 100 mesh.
pH: The soil pH value was determined based on a soil-to-water ratio of 1:2.5. The method is described as follows: A 10.00 g sample of 20 mesh air dried soil was placed into a 50 mL beaker, and 25 mL deionized water was added, then mixed for 5 min before standing for 30 min, and supernatant was measured by phs-3c acidimeter.
SOM: The concentration of SOM was determined by the K2Cr2O7 method [30], and the method is described as follows: A 0.20 g sample of 20 mesh air dried soil was placed into a hard test tube, and 5 mL potassium chromate and 5 mL concentrated sulfuric acid was added. This was then digested in an oil bath (170 °C–180 °C) for 5 min. The digestion solution was transferred to a 250 mL triangular flask and titrated with 0.2 mol/L Fe2SO4 with 2–3 drops of o-phenanthroline as an indicator. The content of SOM was calculated by the amount of Fe2SO4 consumed.
CEC: CECs were determined using the ammonium acetate centrifugal exchange method [31]. A 2.00 g sample of 20 mesh air dried soil was placed into a 100 mL centrifuge tube, and 60 mL 1 mol/L ammonium acetate (pH = 7.0) was added, stirred evenly, then centrifuged for 3–5 min. The treatment was repeated 3–5 times until there was no calcium ion reaction in the leaching solution (K-B indicator was added: blue indicated no calcium ion). Sixty milliliters of 95% ethanol was added and stirred evenly before being centrifuged for 3–5 min. The treatment was repeated 3–5 times until there was no ammonium ion reaction in the leaching solution (Nessler’s reagent was added: no yellow indicated no ammonium ion). The soil samples were washed by deionized water in a Kelvin flask; 0.5 g paraffin and 0.5 g solid MgO were addedand the solution distilled. Ammonium ions were absorbed with 25 mL boric acid indicator solution, and the absorption solution was titrated with hydrochloric acid standard solution.
Clay ratio: Clay ratio analysis was performed by the hydrometer method [31]. A 5.00 g sample of 20 mesh air dried soil was placed into a 50 mL centrifuge tube, and 40 mL 5% sodium pyrophosphate and 1 mol/L NaOH dilute dispersion was added. The solution was then shaken overnight before 2.5 mL clay suspension was sucked at a depth of 2.5 cm from the liquid level with a quantitative pipette, which was then dried and weighted. The percentage of clay content was calculated.
FeDCB and MnDCB: FeDCB and MnDCB were extracted by the sodium dithionate-citrate-bicarbonate (DCB) method [32]. A 1.00 g sample of 20 mesh air dried soil was placed into a 100 mL centrifuge tube, before 20 mL 0.3 mol/L sodium citrate and 2.5 mL 1 mol/L NaHCO3 were added. The solution was then heated to 80 °C in a water bath. Then, 0.5 g sodium bisulfite was added; the mixture was centrifuged after stirring for 15 min. The contents of Fe and Mn in the supernatant were determined by atomic absorption spectrometry.
FeAAO and MnAAO: FeAAO and MnAAO were extracted by the acidic ammonium oxalate method (AAO) [32]. A 2.00 g sample of 20 mesh air dried soil was placed into a 250 mL triangular flask, and 100 mL H2C2O4-(NH4) 2C2O4 extract was added according to 1:50 soil liquid ratio. The mixture was shaken at 20–25 °C for 2 h without light and then transferred to a 100 mL triangular flask for centrifugation and filtration. The contents of Fe and Mn in the supernatant were determined by atomic absorption spectrometry.
T-Cd: T-Cd was determined by a flame atomic adsorption spectrophotometer (AAS) after the HNO3–HF–HClO4 digestion process [33]. A 0.2000 g sample of 100 mesh air dried soil was placed into a 50 mL PTFE crucible, and 5 mL HNO3, 5 mL HF, and 3 mL HClO4 were added. The solution was then heated at 180 °C for 3 h. The mixture was brought to 25 mL, shaken well, and filtered. The contents of Cd in the filtrate were determined by atomic absorption spectrometry.
The physical and chemical properties of these soil samples are shown in Table 1. The pH values of the six samples ranged from 4.85 (S4) to 6.71 (S6). Additionally, the SOM concentrations of the six soil samples followed the order of S4 < S2 < S3 < S1 < S6 < S5; their cation exchange capacities (CECs) followed the order of S1 < S2 < S4 < S3 < S6 < S5, and their total Cd concentrations (T-Cd) followed the order of S6 < S4 < S5 < S3 < S1 < S2. The values of other parameters, such as free iron oxides (FeDCB), free manganese oxides (MnDCB), amorphous iron oxides (FeAAO), and amorphous manganese oxides (MnAAO), are shown in Table 1.

Table 1.
Physicochemical properties of selected soils.
2.2. Kinetics Adsorption Experiments
Kinetic adsorption experiments were conducted to determine the Cd adsorption rate of the six soil samples at a constant temperature of 25 °C. A cadmium stock solution (30 mg/L) was prepared from Cd(NO3)2, and a NaNO3 stock solution (0.01 mol /L) served as the background electrolyte. Soil samples (1 g) were equilibrated with 20 mL of the mixture solutions in a 100 mL polyethylene centrifuge tube. The mixture was shaken at 200 rpm on a constant-temperature shaker for 5, 10, 20, 30, 60, 120, 240, 480, 960, and 1440 min at 25 °C. Thereafter, the suspension was separated from the solid phase via centrifugation for 10 min at 5000 rpm. The Cd(II) concentration in the suspension solution was determined using an AAS. The amount of Cd(II) adsorbed by the soil samples at equilibrium qe (mg/kg) was calculated according to Equation (1) [34]:
where C0 (mg/L) and Ce (mg/L) represent the initial and final concentration of Cd(II), respectively, V (mL) represents the volume of the solution, and m (g) represents the mass of the soil sample.
2.3. Adsorption Kinetics Models
To investigate the rate law governing Cd(II) adsorption onto the six soil samples, Lagergren pseudo-first order, pseudo-second order, Elovich, and intraparticle diffusion kinetic models were applied to analyze the kinetic data.
The pseudo-first order kinetic equation is generally expressed as [35]:
where qe (mg/kg) and qt (mg/kg) represent the amount of Cd(II) adsorbed per unit adsorbent at equilibrium and at elapsed time, t (min), respectively, and k1 (min−1) represents the pseudo-first order rate constant for the adsorption process.
The pseudo-second order kinetic equation is generally represented as [35]:
where k2 (g/mg/min) represents the pseudo-second order rate constant. This pseudo-second order kinetic equation can be linearized as shown in Equation (4) [35]:
According to this equation, the ratio time/adsorbed amount is a linear function of time. The slope of the line corresponds to “qe,” and the lower the amount of Cd(II) adsorbed, the greater the slope of the curve. The Elovich equation is expressed as [35]:
where α represents the initial sorption rate (mg/g/min) and β represents the adsorption constant (g/mg) [36]. The intraparticle diffusion equation is expressed as [35]:
where ki represents the intraparticle diffusion rate constant (mg/g/min0.5) and I (mg/g) represents a constant that provides information regarding the thickness of the boundary layer. According to this model, if the plot of qt versus t0.5 is a straight line, then the adsorption process is controlled by intraparticle diffusion; however, if the data exhibit multi-linear plots, then two or more steps influence the adsorption process.
2.4. Isothermal Adsorption–Desorption Experiments
2.4.1. Adsorption Isotherm Experiments
A batch equilibration method was used to investigate the isothermal adsorption of Cd(II). A mixture containing 1 g of the soil samples and 20 mL of the Cd(NO3)2 solution at concentrations of 0, 10, 20, 40, 60, and 80 mg/L (with a 0.01 mol /L NaNO3 solution as the supporting electrolyte) was introduced into a 100 mL centrifuge tube. After shaking at 200 rpm for 16 h at 25 °C, the suspension was centrifuged at 5000 rpm for 10 min, and the Cd(II) concentration in the solution was determined using an AAS. The total amount of Cd(II) adsorbed at equilibrium, qe (mg/kg), was calculated using Equation (1).
2.4.2. Adsorption Isotherm Models
The data from the isotherm experiments were modeled by fitting them to Langmuir and Freundlich equations. The Langmuir sorption isotherm is usually expressed as [37]:
where Ce (mg/L) and qe (mg/g) represent the liquid-phase concentration and solid phase concentration of the adsorbate at equilibrium, respectively, qm (mg/g) represents the maximum adsorption capacity, and KL (L m/g) represents the adsorption equilibrium constant.
The Freundlich isotherm is represented as [37]:
where KF (mg/g) represents the Freundlich constant related to the sorption capacity and n represents the heterogeneity factor.
2.4.3. Desorption
The soil residue in the 100 mL centrifuge tube from the isotherm adsorption experiment was washed with alcohol three times, followed by rinsing with distilled water three times (25 mL each time). Thereafter, 20 mL of 0.01 mol/L NaNO3 was added to the tube, and the mixture was shaken for 16 h at 25 °C and centrifuged at 5000 rpm for 10 min for the determination of the Cd(II) concentration at equilibrium.
The amount of Cd(II) desorbed by the soils at equilibrium, qde (mg/kg), was calculated according to Equation (9) [37]:
where Cf (mg/L) denotes the final concentration of Cd(II) at equilibrium, V (mL) represents the volume of the solution, and m (g) represents the soil mass.
2.5. Statistical Analysis
Excel 2010 and SigmaPlot 10.0 were used to analyze the experimental data. Pearson correlation analysis was used to investigate the relationships between the soil characteristics and sorption parameters. There are several physical and chemical properties that have an effect on the characteristics of Cd adsorption onto soil particles, and these properties influence and restrict each other. To identify the factors that play the major role in this regard and eliminate secondary factors, a stepwise regression method was adopted. Regression analysis was made by SPSS version 21.0 between the pseudo-second order rate constant (k2), the maximum adsorption capacity (qm), the adsorption equilibrium constant (KL), the Freundlich constant related to the sorption capacity (KF), the heterogeneity factor (n), and eight different physical and chemical parameters of the soil (including pH, SOM, CEC, Clay, FeDCB, FeAAO, MnDCB, MnAAO), respectively.
3. Results and Discussion
3.1. Adsorption Kinetics
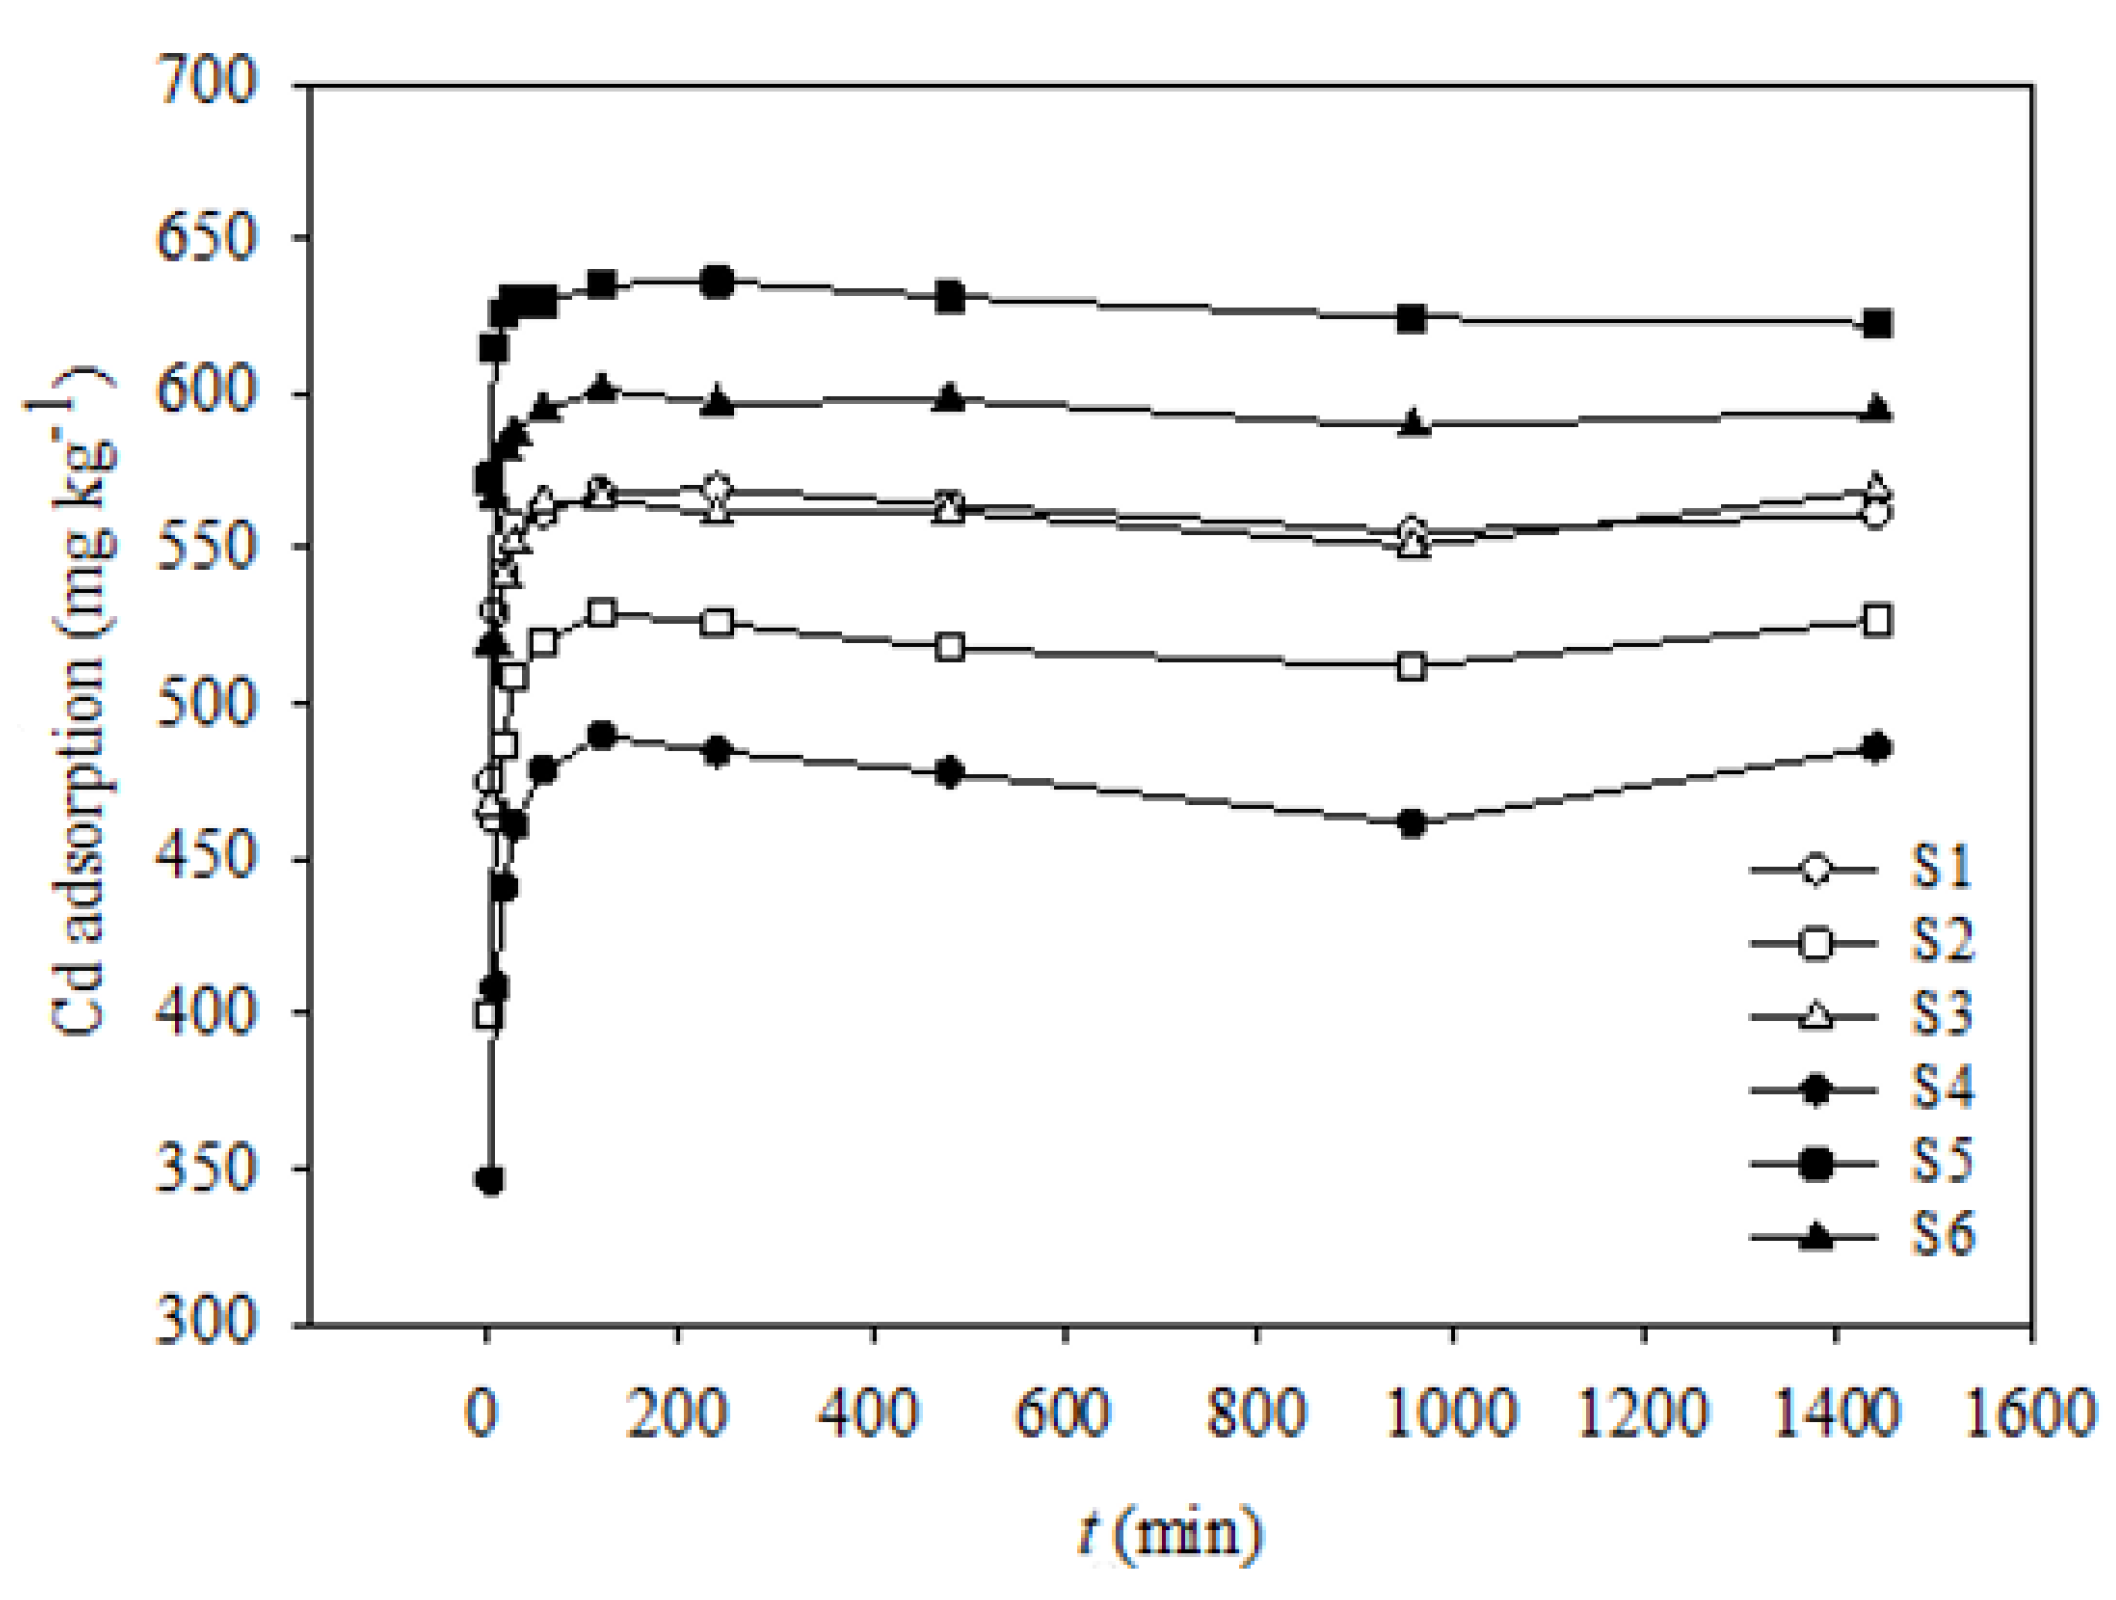
Figure 1 shows the results of the Cd(II) adsorption kinetics experiments with increasing time, from 5 to 1440 min. The shapes of the Cd(II) adsorption simulation curves corresponding to the six soil samples were similar; however, their adsorption capacities were significantly different, except for those of S1 and S3. The adsorption amounts of Cd(II) in all the soil samples increased remarkably within the first 30 min; however, after 60 min, the Cd(II) adsorption amounts corresponding to all six soil samples reached a plateau. Therefore, the Cd(II) adsorption process can be divided into rapid and slow stages, and the turning point appeared at 30–60 min.
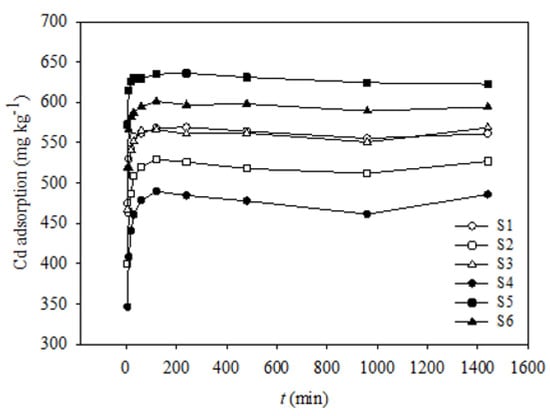
Figure 1.
Kinetics of Cd adsorption onto six soils.
Studies have shown that there are two adsorption types, namely, specific adsorption and non-specific adsorption [38]. Non-specific adsorption refers to the fast adsorption of metal ions onto soil particles via a simple Coulomb force, while specific adsorption refers to a relatively slow adsorption of metal ions onto soil particles owing to the formation of chelates or coprecipitation [39]. In this study, Cd(II) adsorption began with non-specific adsorption, and the fast initial adsorption rate possibly suggests that the binding sites on the external surface of the soil particles were sufficient for Cd(II) adsorption. As time elapsed, the number of binding sites decreased, such that non-specific adsorption could not take place; thus, specific adsorption became predominant. Similar Cd(II) adsorption patterns have also been reported by Huang et al. [38] and Gao et al. [40].
3.2. Kinetic Equations for Cd(II) Adsorption
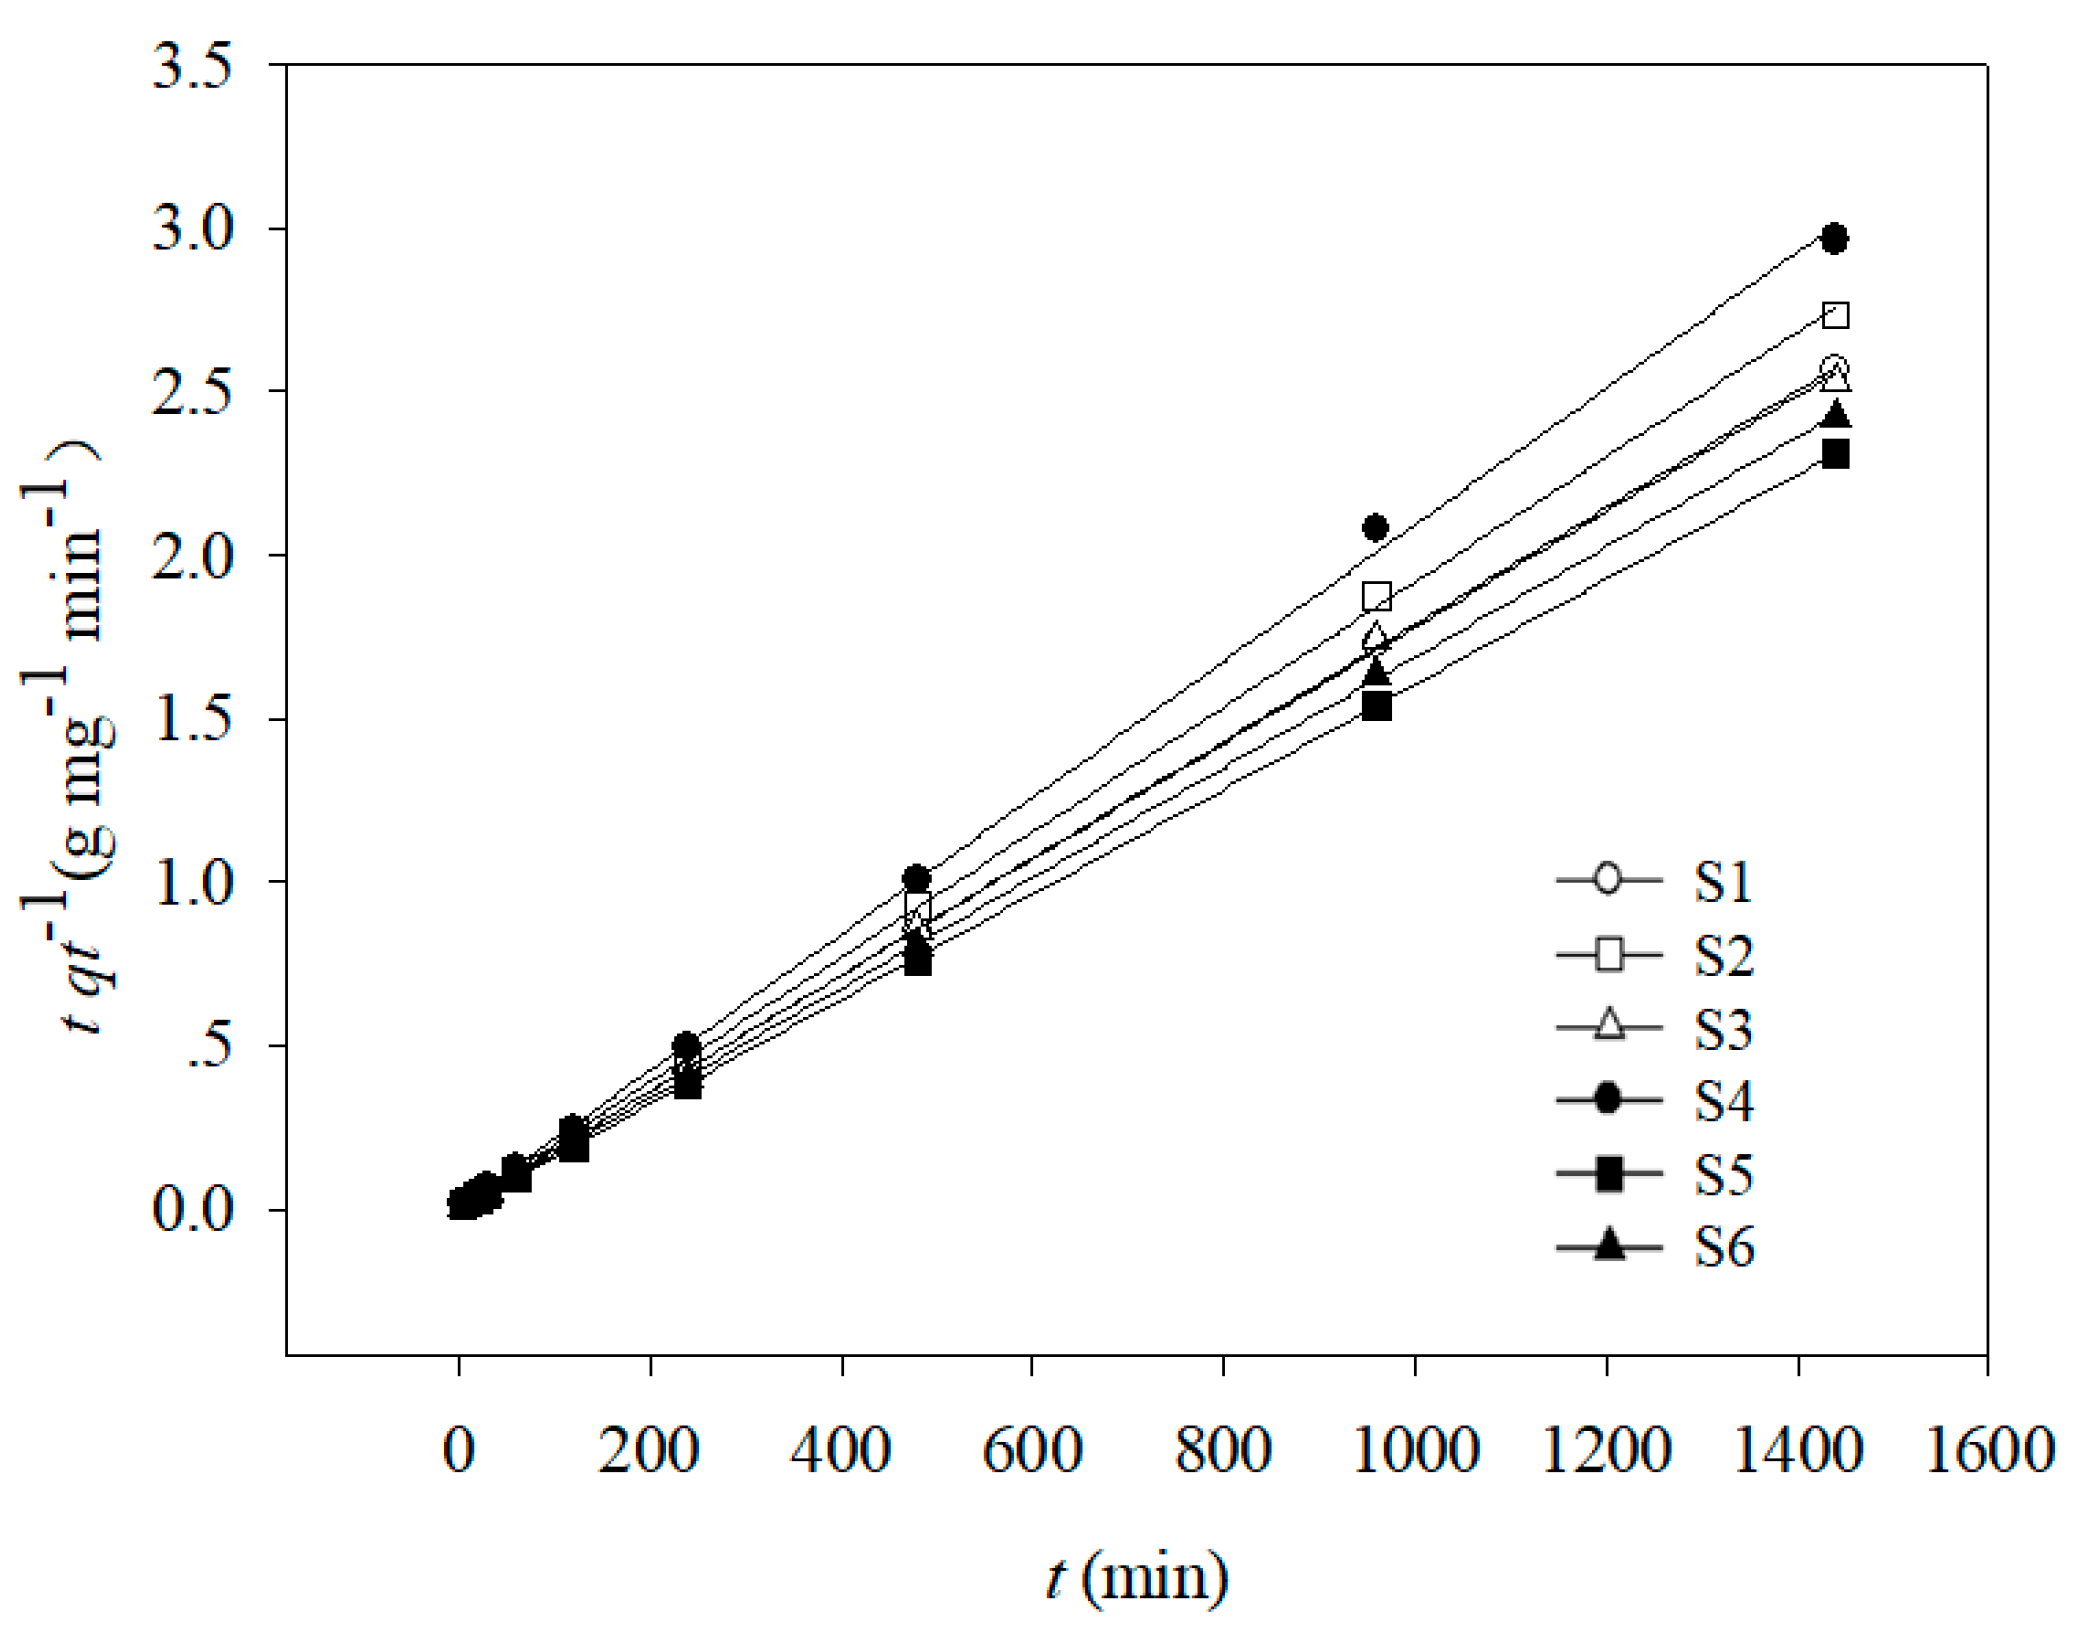
The parameters corresponding to pseudo-first order, pseudo-second order, Elovich, and intraparticle diffusion kinetic models are shown in Table 2 and Figure 2. The correlation coefficient values (R2) indicated that Cd(II) adsorption onto the six soil samples fitted well to the pseudo-first order and pseudo-second order kinetic equations but fitted poorly to Elovich and intraparticle diffusion kinetics. The pseudo-second order kinetic equation showed the best fit for Cd(II) adsorption, as indicated by the higher R2 values (0.860–0.962).
Table 2.
Parameter Values for the models of Pseudo-first order, Pseudo-second order, Elovich, Intraparticle diffusion, Langmuir, and Freundlich. R2 means the adsorption kinetic or the adsorption isotherm of Cd onto six soils.
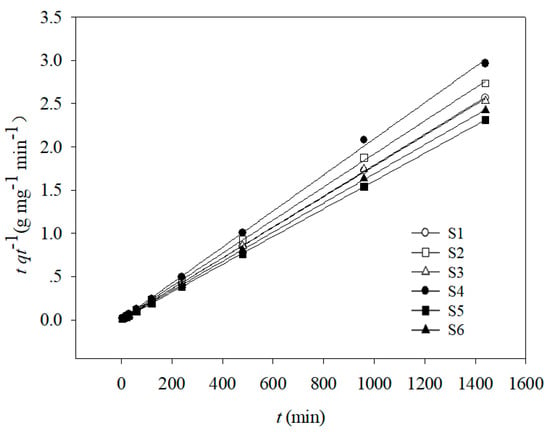
Figure 2.
Pseudo-second-order adsorption kinetics of Cd(II) onto six soils.
The Lagergren pseudo-second order kinetics equation can be used to describe the adsorption rates of elements in liquid-phase systems, and it has been one of the most commonly used equations for describing adsorption [41]. In this study, the good fit of the adsorption data with this pseudo-second order model suggests that the rate controlling step was chemical sorption, which is consistent with the results reported by Zhu et al. [42].
Both experimental studies and theoretical investigations have indicated that the “k2” value usually depends on soil properties. Stepwise multiple regression analysis was used to evaluate the effect of soil properties on the Cd(II) adsorption rate. Equation (10) indicated that the soil property with the most significant effect on “k2” was pH. This is consistent with the results of several previous studies [38,43,44,45]. The maximum “k2” value (3.46) corresponded to soil sample S5, which had the highest pH value (Table 2), followed by S6 > S1 > S3 > S2 > S4, with decreasing pH values.
Possibly, this phenomenon, which has been discussed in other similar studies [38,43], occurred because when the pH is lowered, the competition between heavy metal ions and the abundance of H+ for available binding sites increases, thereby limiting the adsorption of the heavy metal ions onto soil particles. Conversely, when the pH value increases, the competition becomes weaker; thus, more heavy metal ions are adsorbed. Therefore, low pH conditions favored Cd desorption from the soil particles into solution, increasing the possibly of their migration into the environment. Additionally, the pH also showed a significant effect on CEC, which is another major soil property that had an effect on cadmium adsorption; therefore, increasing the soil pH may enhance the Cd(II) adsorption rate owing to an increase in CEC [46]:
k2 = 1.16 pH—4.55 R2 = 0.91 p ≤ 0.05.
3.3. Adsorption Isotherms
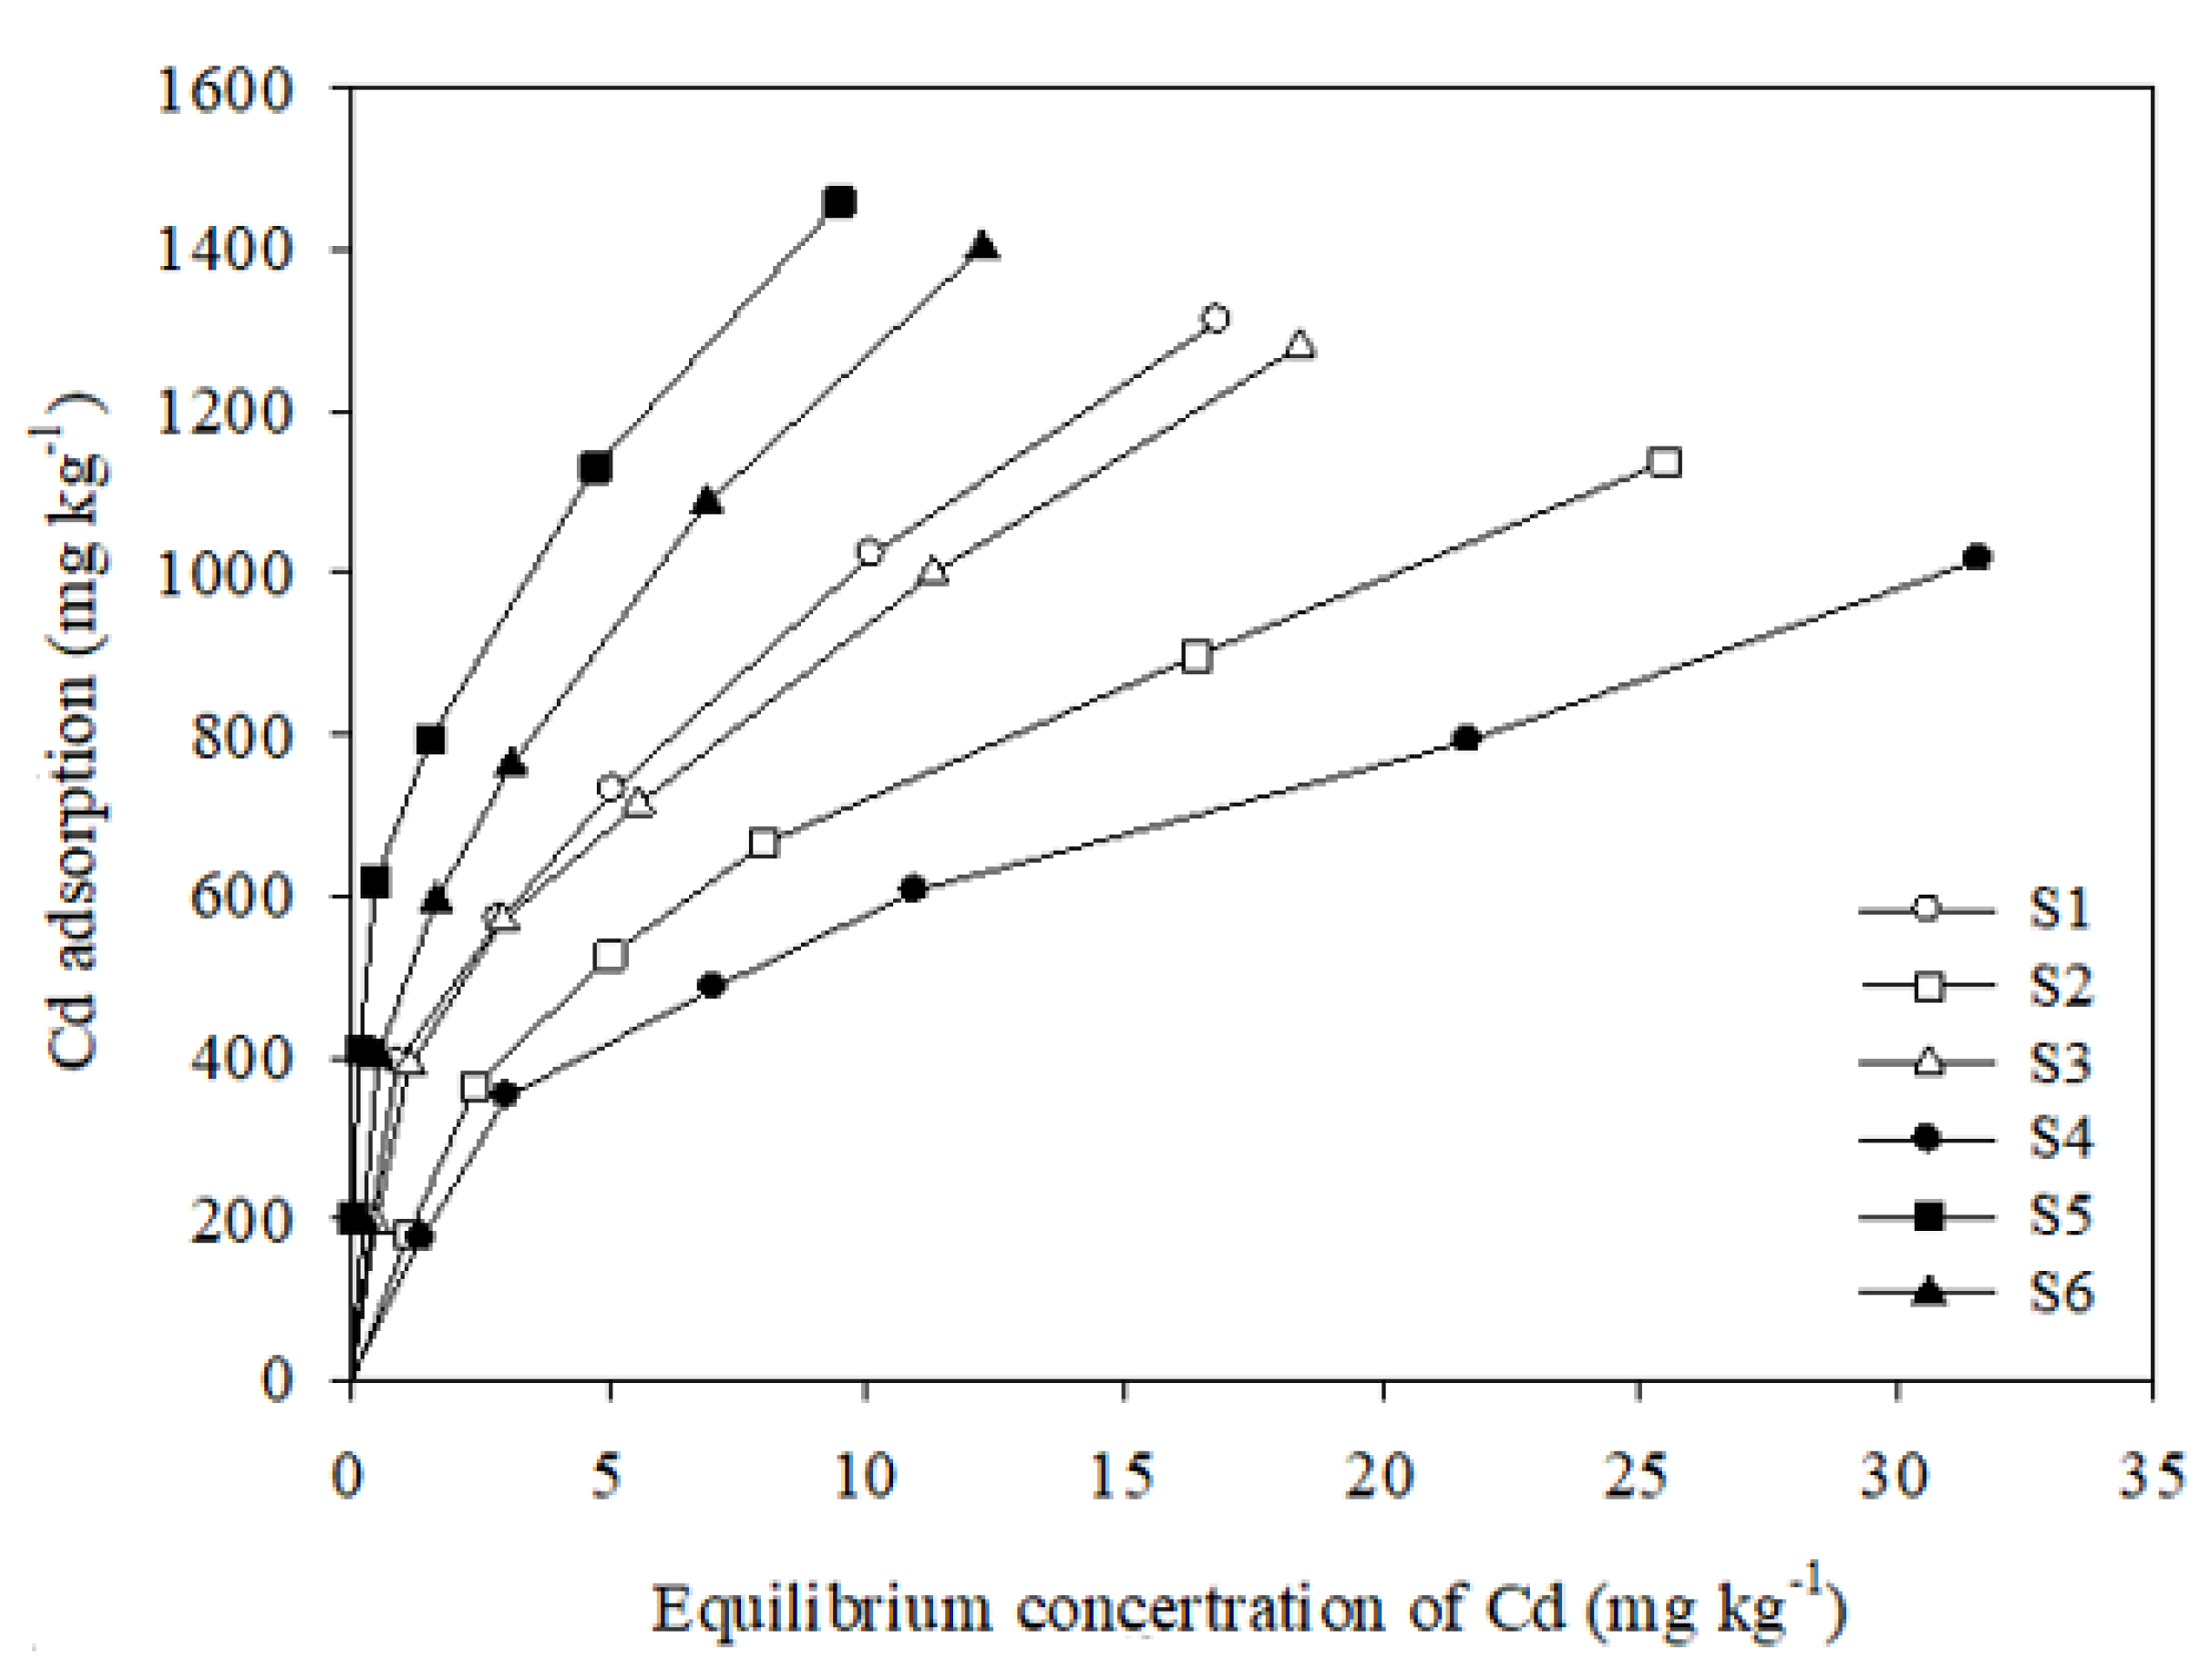
The adsorption isotherms for the adsorption of cadmium onto the six soil samples are shown in Figure 3. From the isotherm curves, the cadmium adsorption capacity of each soil sample increased as the equilibrium solute concentration increased. At low equilibrium concentrations, the Cd adsorption amount increased almost linearly, and, at high equilibrium concentrations, it tended to flatten; however, there were differences among the six soil samples. Sample S5 showed the maximum Cd adsorption amount, followed by S6 > S1 > S3 > S2 > S4.
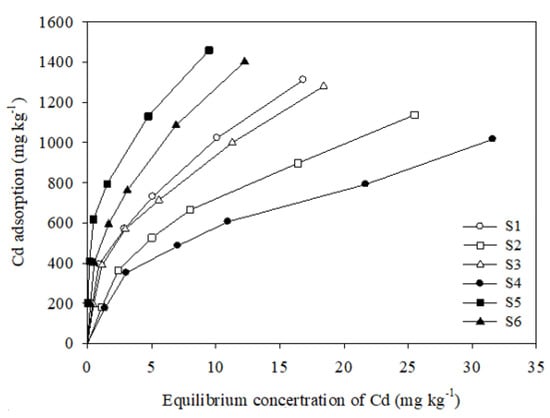
Figure 3.
Isotherms of Cd adsorption onto six soils.
3.4. Isotherm Equations for Cd(II) Adsorption
Langmuir and Freundlich models were used to fit the data corresponding to the isotherm adsorption of Cd onto the six soil samples. The squares of the determination coefficients (R2) are shown in Table 2.
The Langmuir isotherm is suitable for the description of monolayer adsorption on homogenous surfaces without any interaction between the absorbent and adsorbate and has been extensively employed to describe the adsorption behavior of phosphate ions onto soil particles. It has been widely applied in studying the progression of adsorption and precipitation [26,39,47]. The maximum adsorption capacity (qm) and the Langmuir adsorption constant (KL), which are related to bonding strength, were determined, and the Langmuir isotherm was well fitted with the experimental data (R2 = 0.96–0.98), as shown in Table 2. The adsorption bonding strength and the amount of Cd adsorbed onto the six soil samples were in the ranges 0.11–1.20 L/kg and 1204.9–1668.0 mg/kg, respectively. The maximum adsorption amount corresponded to sample S5, which showed the strongest Cd(II) adsorption affinity.
A stepwise multiple regression analysis among qm, KL, and the soil properties indicated that SOM was the main soil property controlling the Cd(II) maximum adsorption capacity, while pH was the main factor controlling adsorption bonding strength (Equations (11) and (12)).
A study conducted by Ahmed et al. [39] showed that, among the various soil constituents, organic matter has the largest adsorption capacity, which is an important factor that affects the soil adsorption capacity [38]. This is because SOM provides available surface sites for metal adsorption and facilitates the formation of metal–ligand complexes on the surface of soil particles. Further, they can also inhibit metal adsorption via the formation of non-extractable complexes with metal ions [5,39]:
qm = 17.67 SOM + 751.8 R2 = 0.92 p ≤ 0.05,
KL = 0.51 pH − 2.48 R2 = 0.89 p ≤ 0.05.
The Freundlich isotherm is an empirical equation that showed better adaptability. It has mainly been applied to heterogeneous surfaces with a non-uniform distribution of adsorption heat over the surface of the adsorbent because it assumes that the different adsorptive sites on the absorbent have different energies [48,49]. Cd adsorption isotherm data from the six soil samples fitted the Freundlich model better than the Langmuir model, as indicated by the higher R2 values (0.98–0.99). The Freundlich adsorption isotherm constant, which is indicative of the adsorption capacity (KF), as well as the degree of nonlinearity between the adsorption and solution concentration (n) are shown in Table 2.
The relationships between KF, n, and soil properties were described using a stepwise multiple regression analysis (Equations (13) and (14)), which indicated that the pH was the dominant soil property affecting KF and n, implying that the Cd adsorption capacity of the soil samples increased with a decrease in pH:
KF = 260.21 pH − 1102.82 R2 = 0.93 p ≤ 0.05,
n = 0.49 pH − 0.61 R2 = 0.95 p ≤ 0.05.
3.5. Desorption Isotherms
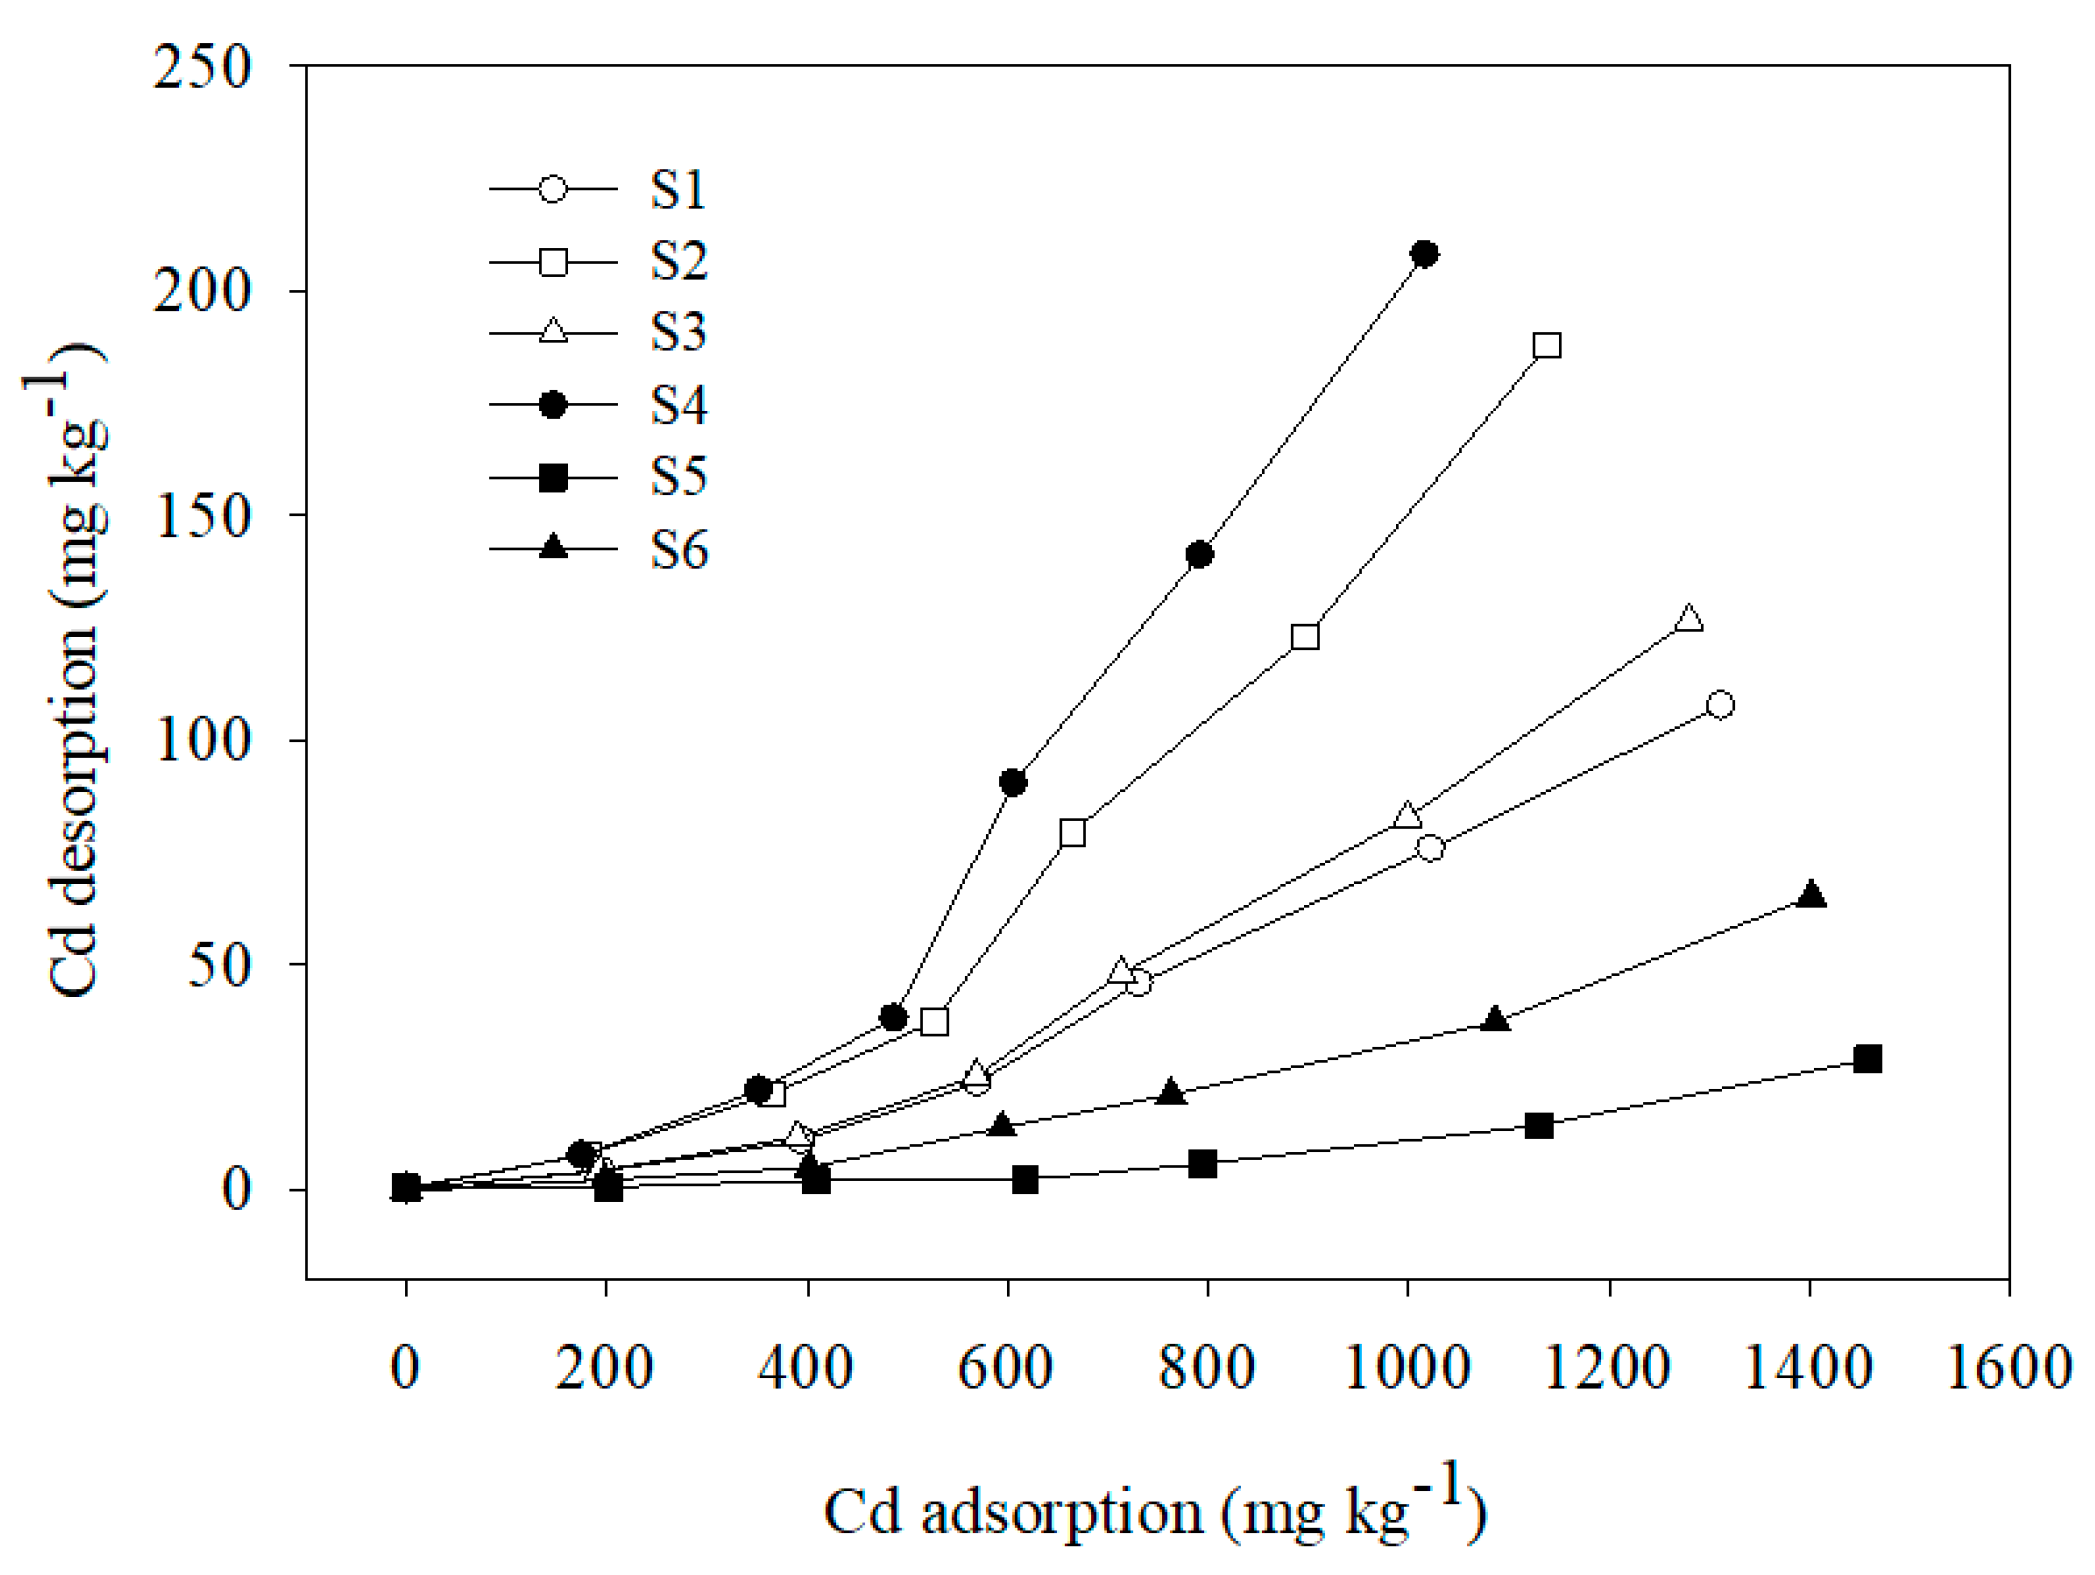
The results of Cd(II) desorption from the six soil samples (Figure 4) showed that Cd(II) desorption from the soil samples increased significantly as the Cd(II) adsorption amount increased. Thus, Cd desorption was related to the adsorption process. Specific adsorption decreased as the adsorption amount as well as the exchangeable adsorption amount increased. Thus, an increasing number of ions adsorbed onto low potential energy sites and easily desorbed at high adsorption amounts, leading to an increase in the amount of the adsorbed Cd(II) that desorbed into solution. The Cd(II) desorption amounts were significantly less than the adsorption amounts. This finding is consistent with previous reports [5,27,50,51] and indicates that Cd(II) desorption from the six soil samples was incomplete and only partially reversible.
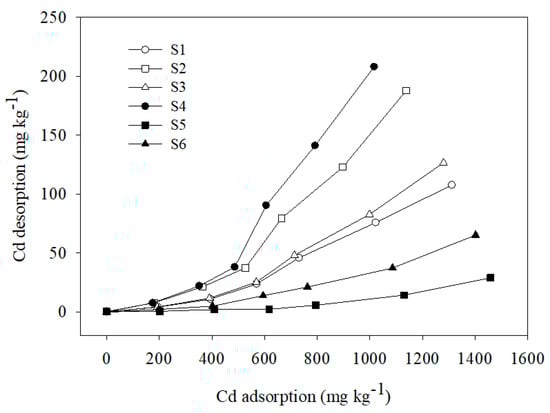
Figure 4.
Desorption curve of Cd onto six soils.
Considering the adsorption isotherms of the six soil samples, sample S4 showed the maximum Cd desorption amount, followed by S2, S3, S1, and S6, in order, with S5 showing the lowest desorption amount. Adsorbed ions that can be desorbed by unbuffered salts are ions that are absorbed electrostatically [5,52,53]. Therefore, the Cd(II) desorbed by NaNO3 was previously adsorbed via electrostatic attraction, so the desorption of Cd(II) represents the relative contribution of electrostatic adsorption to the total adsorption of Cd(II). The results of Cd(II) desorption corresponding to the six soil samples suggest that the Cd(II) adsorbed on sample S4 was characterized by a relatively higher mobility, which, due to Cd(II) adsorption via electrostatic attraction, was easily desorbed from the soil particles into solution. The increase in the Cd(II) desorption amount corresponding to the six soil samples may be attributed to the decrease in SOM content and pH. Specifically, SOM can form stable complexes with Cd(II) that cannot be desorbed by NaNO3 [5,54].
4. Conclusions
The results of Cd(II) adsorption kinetics experiments showed that Cd(II) adsorption was characterized by a rapid initial stage, which lasted for approximately 30–60 min; this was followed by slow desorption, indicating that the process involved two different mechanisms. Further, the kinetics of Cd(II) adsorption onto the six soil samples were adequately described by the pseudo-second order equation, and data from the isotherm adsorption experiments fitted well with both the Langmuir and Freundlich models; however, the Freundlich model showed a better fit. Furthermore, the highest adsorption amount and adsorption rate corresponded to sample S5, while the lowest values corresponded to sample S4. The soil properties with the most significant effect on the adsorption rate and the maximum adsorption amount were the pH and soil organic carbon content, respectively. Considering the adsorption isotherms, samples S4 and S5 showed the highest and lowest Cd(II) desorption amounts, respectively, and this could be attributed to the effects of SOM and pH.
Author Contributions
W.L., Y.L., R.W. contributed to the conception of the study; W.L., Y.L., G.L. performed the experiment; W.L., H.L., H.Y. contributed significantly to analysis and manuscript preparation; R.W., D.L., H.L. performed the data analyses and wrote the manuscript; T.D., Y.Z., R.W. helped perform the analysis with constructive discussions. All authors have read and agreed to the published version of the manuscript.
Funding
This research was funded by the National Science Foundation of China (41271266, 41877403). The views expressed herein are those of the authors and do not represent the views of the funding agencies or any of its subagencies.
Institutional Review Board Statement
Not applicable.
Informed Consent Statement
Not applicable.
Conflicts of Interest
The authors declare no conflict of interest.
References
- Unuabonah, E.; Adebowale, K.; Olu-Owolabi, B.; Yang, L.; Kong, L. Adsorption of Pb (II) and Cd (II) from aqueous solutions onto sodium tetraborate-modified Kaolinite clay: Equilibrium and thermodynamic studies. Hydrometallurgy 2008, 93, 1–9. [Google Scholar] [CrossRef]
- Fei, W.; Wang, L.J.; Li, J.S.; Sun, X.Y.; Han, W.Q. Adsorption behavior and mechanism of cadmium on strong-acid cation exchange resin. Trans. Nonferrous Met. Soc. China 2009, 19, 740–744. [Google Scholar]
- Khan, M.A.; Khan, S.; Khan, A.; Alam, M. Soil contamination with cadmium, consequences and remediation using organic amendments. Sci. Total Environ. 2017, 601–602, 1591–1605. [Google Scholar] [CrossRef]
- Li, P.; Wang, X.; Allinson, G.; Li, X.; Xiong, X. Risk assessment of heavy metals in soil previously irrigated with industrial wastewater in Shenyang, China. J. Hazard. Mater. 2009, 161, 516–521. [Google Scholar] [CrossRef] [PubMed]
- Ma, L.; Xu, R.; Jiang, J. Adsorption and desorption of Cu(II) and Pb(II) in paddy soils cultivated for various years in the subtropical China. J. Environ. Sci. 2010, 22, 689–695. [Google Scholar] [CrossRef]
- Lee, C.S.L.; Li, X.; Shi, W.; Cheung, S.C.N.; Thornton, I. Metal contamination in urban, suburban, and country park soils of Hong Kong: A study based on GIS and multivariate statistics. Sci. Total Environ. 2006, 356, 45–61. [Google Scholar] [CrossRef] [PubMed] [Green Version]
- Li, Z.; Ma, Z.; van der Kuijp, T.J.; Yuan, Z.; Huang, L. A review of soil heavy metal pollution from mines in China: Pollution and health risk assessment. Sci. Total Environ. 2014, 468–469, 843–853. [Google Scholar] [CrossRef]
- Luo, X.L.; Guo, Q.R.; Xie, Z.Y.; Yang, J.J.; Chai, Z.W.; Liu, X.; Wu, S.F. Study on heavy metal pollution in typical rural soils in Pearl River Delta area. Ecol. Environ. Sci. 2014, 23, 485–489. [Google Scholar]
- Mohapatra, M.; Anand, S. Studies on sorption of Cd(II) on Tata chromite mine overburden. J. Hazard. Mater. 2007, 148, 553–559. [Google Scholar] [CrossRef]
- Xinxin, Y.; Yibing, M.; Bo, S. Influence of soil type and genotype on Cd bioavailability and uptake by rice and implications for food safety. J. Environ. Sci. 2012, 24, 1647–1654. [Google Scholar]
- Wu, S.; Zhang, K.; Wang, X.; Jia, Y.; Sun, B.; Luo, T.; Meng, F.; Jin, Z.; Lin, D.; Shen, W.; et al. Enhanced adsorption of cadmium ions by 3D sulfonated reduced graphene oxide. Chem. Eng. J. 2015, 262, 1292–1302. [Google Scholar] [CrossRef]
- Huang, F.; Gao, L.-Y.; Deng, J.-H.; Chen, S.-H.; Cai, K.-Z. Quantitative contribution of Cd 2+ adsorption mechanisms by chicken-manure-derived biochars. Environ. Sci. Pollut. Res. 2018, 25, 28322–28334. [Google Scholar] [CrossRef]
- Zhao, Z.; Nie, T.; Yang, Z.; Zhou, W. The role of soil components in the sorption of tetracycline and heavy metals in soils. RSC Adv. 2018, 8, 32178–32187. [Google Scholar] [CrossRef] [Green Version]
- Srivastava, P.; Singh, B.; Angove, M. Competitive adsorption behavior of heavy metals on kaolinite. J. Colloid Interface Sci. 2005, 290, 28–38. [Google Scholar] [CrossRef] [PubMed]
- Mustafa, G.; Kookana, R.S.; Singh, B. Desorption of cadmium from goethite: Effects of pH, temperature and aging. Chemosphere 2006, 64, 856–865. [Google Scholar] [CrossRef]
- Gerritse, R.G.; Van Driel, W. The Relationship Between Adsorption of Trace Metals, Organic Matter, and pH in Temperate Soils. J. Environ. Qual. 1984, 13, 197–204. [Google Scholar] [CrossRef]
- Glover, L.J., II; Eick, M.J.; Brady, P.V. Desorption Kinetics of Cadmium2 and Lead2 from Goethite: Influence of Time and Organic Acids. Soil Sci. Soc. Am. J. 2002, 66, 797–804. [Google Scholar] [CrossRef]
- Shirvani, M.; Shariatmadari, H.; Kalbasi, M. Kinetics of cadmium desorption from fibrous silicate clay minerals: Influence of organic ligands and aging. Appl. Clay Sci. 2007, 37, 175–184. [Google Scholar] [CrossRef]
- Elliott, H.A.; Liberati, M.R.; Huang, C.P. Effect of iron oxide removal on heavy metal sorption by acid subsoils. Water Air Soil Pollut. 1986, 27, 379–389. [Google Scholar] [CrossRef]
- Singh, B.; Alloway, B.J.; Bochereau, F.J.M. Cadmium sorption behavior of natural and synthetic zeolites. Commun. Soil Sci. Plant Anal. 2000, 31, 2775–2786. [Google Scholar] [CrossRef]
- Jobstmann, H.; Singh, B. Cadmium Sorption by Hydroxy-Aluminium Interlayered Montmorillonite. Water Air Soil Pollut. 2001, 131, 203–215. [Google Scholar] [CrossRef]
- Spark, K.; Wells, J.; Johnson, B. Characterizing trace metal adsorption on kaolinite. Eur. J. Soil Sci. 1995, 46, 633–640. [Google Scholar] [CrossRef]
- Alaboudi, K.A.; Ahmed, B.; Brodie, G. Phytoremediation of Pb and Cd contaminated soils by using sunflower (Helianthus annuus) plant. Ann. Agric. Sci. 2018, 63, 123–127. [Google Scholar] [CrossRef]
- Wang, J.; Lv, J.; Fu, Y. Effects of organic acids on Cd adsorption and desorption by two anthropic soils. Front. Environ. Sci. Eng. 2012, 7, 19–30. [Google Scholar] [CrossRef]
- Pardo, M. Sorption of lead, copper, zinc, and cadmium by soils: Effect of nitriloacetic acid on metal retention. Commun. Soil Sci. Plant. Anal. 2000, 31, 31–40. [Google Scholar] [CrossRef]
- Sparks, D.L. Environmental Soil Chemistry, 2nd ed.; Elsevier: Amsterdam, The Netherlands, 2003. [Google Scholar]
- Wang, Y.; Tang, X.; Chen, Y.; Zhan, L.; Li, Z.; Tang, Q. Adsorption behavior and mechanism of Cd(II) on loess soil from China. J. Hazard. Mater. 2009, 172, 30–37. [Google Scholar] [CrossRef] [PubMed]
- Tran, Y.; Barry, D.; Bajracharya, K. Cadmium desorption in sand. Environ. Int. 2002, 28, 493–502. [Google Scholar] [CrossRef]
- Zhang, D.L.; Jin, M.G.; Fang, Y.; Zhou, X.; Mei, Y.U. Effect of different acidic conditions on the adsorption-desorption characteristics of Cd~(2+) in a silt loam. Soil Fertil. Sci. China 2014, 04, 29–34. [Google Scholar]
- Lu, R.K. Methods for Soil Agrochemistry Analysis; China Agricultural Science and Technology Press: Beijing, China, 2000. [Google Scholar]
- Klute, A. Physical and mineralogical methods; American Society of Agronomy: Madison, WI, USA, 1986. [Google Scholar]
- Pansu, M.; Gautheyrou, J. Handbook of Soil Analysis; Springer: Berlin/Heidelberg, Germany, 2006. [Google Scholar]
- Amacher, M.; Spark, D. Nickel, cadmium and lead. Methods Soil Anal. Part. Chem. Methods 1996, 5, 739–768. [Google Scholar]
- Nordberg, G.F.; Fowler, B.A.; Nordberg, M. (Eds.) Handbook on the Toxicology of Metals; Elsevier B.V.: Amestardam, The Netherlands, 2015. [Google Scholar]
- Fan, H.-T.; Sun, Y.; Tang, Q.; Li, W.-L.; Sun, T. Selective adsorption of antimony(III) from aqueous solution by ion-imprinted organic–inorganic hybrid sorbent: Kinetics, isotherms and thermodynamics. J. Taiwan Inst. Chem. Eng. 2014, 45, 2640–2648. [Google Scholar] [CrossRef]
- Zhou, Y.; Liu, X.; Xiang, Y.; Wang, P.; Zhang, J.; Zhang, F.; Wei, J.; Luo, L.; Lei, M.; Tang, L. Modification of biochar derived from sawdust and its application in removal of tetracycline and copper from aqueous solution: Adsorption mechanism and modelling. Bioresour. Technol. 2017, 245, 266–273. [Google Scholar] [CrossRef]
- Foo, K.Y.; Hameed, B.H. Insights into the modeling of adsorption isotherm systems. Chem. Eng. J. 2010, 156, 2–10. [Google Scholar] [CrossRef]
- Huang, B.; Li, Z.; Huang, J.; Guo, L.; Nie, X.; Wang, Y.; Zhang, Y.; Zeng, G. Adsorption characteristics of Cu and Zn onto various size fractions of aggregates from red paddy soil. J. Hazard. Mater. 2014, 264, 176–183. [Google Scholar] [CrossRef]
- Ahmed, I.; Helal, A.A.; El Aziz, N.A.; Gamal, R.; Shaker, N.O. Influence of some organic ligands on the adsorption of lead by agricultural soil. Arab. J. Chem. 2019, 12, 2540–2547. [Google Scholar] [CrossRef] [Green Version]
- Gao, R.; Xiang, L.; Hu, H.; Fu, Q.; Zhu, J.; Liu, Y.; Huang, G. High-efficiency removal capacities and quantitative sorption mechanisms of Pb by oxidized rape straw biochars. Sci. Total Environ. 2020, 699, 134262. [Google Scholar] [CrossRef]
- Gupta, S.S.; Bhattacharyya, K.G. Kinetics of adsorption of metal ions on inorganic materials: A review. Adv. Colloid Interface Sci. 2011, 162, 39–58. [Google Scholar] [CrossRef]
- Zhu, L.; Tong, L.; Zhao, N.; Wang, X.; Yang, X.; Lv, Y. Key factors and microscopic mechanisms controlling adsorption of cadmium by surface oxidized and aminated biochars. J. Hazard. Mater. 2020, 382, 121002. [Google Scholar] [CrossRef]
- Rashti, M.R.; Esfandbod, M.; Adhami, E.; Srivastava, P. Cadmium desorption behaviour in selected sub-tropical soils: Effects of soil properties. J. Geochem. Explor. 2014, 144, 230–236. [Google Scholar] [CrossRef]
- Komy, Z.R.; Shaker, A.M.; Heggy, S.E.; El-Sayed, M.E. Kinetic study for copper adsorption onto soil minerals in the absence and presence of humic acid. Chemosphere 2014, 99, 117–124. [Google Scholar] [CrossRef] [PubMed]
- Guo, Y.; Tang, W.; Wu, J.; Huang, Z.; Dai, J. Mechanism of Cu(Ⅱ) adsorption inhibition on biochar by its aging process. J. Environ. Sci. 2014, 26, 2123–2130. [Google Scholar] [CrossRef] [PubMed]
- Naidu, R.; Kookana, R.S.; Sumner, M.E.; Harter, R.D.; Tiller, K.G. Cadmium Sorption and Transport in Variable Charge Soils: A Review. J. Environ. Qual. 1997, 26, 602–617. [Google Scholar] [CrossRef]
- Choi, Y.-K.; Choi, T.-R.; Gurav, R.; Bhatia, S.K.; Park, Y.-L.; Kim, H.J.; Kan, E.; Yang, Y.-H. Adsorption behavior of tetracycline onto Spirulina sp. (microalgae)-derived biochars produced at different temperatures. Sci. Total Environ. 2020, 710, 136282. [Google Scholar] [CrossRef]
- Feng, Q.; Zhang, Z.; Chen, Y.; Liu, L.; Zhang, Z.; Chen, C. Adsorption and Desorption Characteristics of Arsenic on Soils: Kinetics, Equilibrium, and Effect of Fe(OH)3 Colloid, H2SiO3 Colloid and Phosphate. Procedia Environ. Sci. 2013, 18, 602–617. [Google Scholar] [CrossRef] [Green Version]
- Zhou, J.; Ma, F.; Guo, H. Adsorption behavior of tetracycline from aqueous solution on ferroferric oxide nanoparticles assisted powdered activated carbon. Chem. Eng. J. 2020, 384, 123290. [Google Scholar] [CrossRef]
- Zhao, X.; Jiang, T.; Du, B. Effect of organic matter and calcium carbonate on behaviors of cadmium adsorption–desorption on/from purple paddy soils. Chemosphere 2014, 99, 41–48. [Google Scholar] [CrossRef] [PubMed]
- Borggaard, O.K.; Holm, P.E.; Strobel, B.W. Potential of dissolved organic matter (DOM) to extract As, Cd, Co, Cr, Cu, Ni, Pb and Zn from polluted soils: A review. Geoderma 2019, 343, 235–246. [Google Scholar] [CrossRef]
- Xu, R.; Xiao, S.; Zhao, A.; Ji, G. Effect of Cr(VI) anions on adsorption and desorption behavior of Cu(II) in the colloidal systems of two authentic variable charge soils. J. Colloid Interface Sci. 2005, 284, 22–29. [Google Scholar] [CrossRef]
- Khan, M.A.; Khan, S.; Ding, X.; Khan, A.; Alam, M. The effects of biochar and rice husk on adsorption and desorption of cadmium on to soils with different water conditions (upland and saturated). Chemosphere 2018, 193, 1120–1126. [Google Scholar] [CrossRef] [PubMed]
- Guo, X.; Zhang, S.; Shan, X.-Q.; Luo, E.I.L.; Pei, Z.; Zhu, Y.-G.; Liu, T.; Xie, Y.-N.; Gault, A. Characterization of Pb, Cu, and Cd adsorption on particulate organic matter in soil. Environ. Toxicol. Chem. 2006, 25, 2366–2373. [Google Scholar] [CrossRef]
Publisher’s Note: MDPI stays neutral with regard to jurisdictional claims in published maps and institutional affiliations. |
© 2021 by the authors. Licensee MDPI, Basel, Switzerland. This article is an open access article distributed under the terms and conditions of the Creative Commons Attribution (CC BY) license (https://creativecommons.org/licenses/by/4.0/).