Article

Thermal Condition and Air Quality Investigation in Commercial Airliner Cabins

Department of Air Traffic, College of Civil Aviation, Nanjing University of Aeronautics and Astronautics, Nanjing 211106, China
*
Author to whom correspondence should be addressed.
These two authors contributed equally to this work.
Sustainability 2021, 13(13), 7047; https://doi.org/10.3390/su13137047
Submission received: 8 May 2021 / Revised: 17 June 2021 / Accepted: 18 June 2021 / Published: 23 June 2021
(This article belongs to the Special Issue Climate Change and the Built Environment)

Abstract

:
Cabin air quality and thermal conditions have a direct impact on passenger and flight crew’s health and comfort. In this study, in-cabin thermal environment and particulate matter (PM) exposures were investigated in four China domestic flights. The mean and standard deviation of the in-cabin carbon dioxide (CO2) concentrations in two tested flights are 1440 ± 111 ppm. The measured maximum in-cabin carbon monoxide (CO) concentration is 1.2 ppm, which is under the US Occupational Safety and Health Administration (OSHA) permissible exposure limit of 10 ppm. The tested relative humidity ranges from 13.8% to 67.0% with an average of 31.7%. The cabin pressure change rates at the end of the climbing stages and the beginning of the descending stages are close to 10 hPa·min−1, which might induce the uncomfortable feeling of passengers and crew members. PM mass concentrations were measured on four flights. The results show that PM concentrations decreased after the aircraft cabin door closed and were affected by severe turbulences. The highest in-cabin PM concentrations were observed in the oldest aircraft with an age of 13.2 years, and the waiting phase in this aircraft generated the highest exposures.

1. Introduction

Along with the rapid growth of the transportation industry, environmental health concerns constitute an essential impediment for people to choose their travel methods. Aircraft cabin is a unique micro-environment, which relies on the aircraft’s environmental control system (ECS) to adjust its air supply, cabin pressure (P), temperature (T), and relative humidity (RH) [1,2]. The air supplied to the aircraft cabin is a mixture of outside bleed air and interior recirculated air [2,3]. Both bleed air and return air contribute to in-cabin air pollution and affect the health of cabin crew and passengers [4,5]. The recirculated air contains various pollutants, such as airborne particles, volatile organic compounds, pathogenic bacteria, and viruses. The high-efficiency particulate air (HEPA) filter, as an air conditioning system component, intercepts both microscopic particles and larger ones, even microorganisms in return air, but the filters are rendered less effective if bypassed, improperly used, or clogged by particulate matter (PM) [6,7]. Ambient pollutants are also introduced to aircraft cabin by the ECS along with bleed air, especially when the aircraft is waiting or taxiing on the ground.
Research shows that, when the aircraft was taxiing on the ground and flying in the stratosphere, its in-cabin PM mass concentrations were higher than those when the aircraft was cruising in the troposphere [3]. According to Ren et al., the ultrafine particle (UFP) number concentrations in an MD-82 aircraft parked at Tianjin International Airport ranges from 1.0 × 10⁴ particles·cm−3 to 3.7 × 10⁴ particles·cm−3, which means waiting at 100 m downwind of the runway for 40 min, is equivalent to a 4-h exposure in typical urban conditions [8]. Commercial flights waiting on the ground will cause more fine particles to be deposited in their ECSs, and the deposition is harmful not only to the health of crew and passengers but also to the performance of the aircrafts [9,10]. During cruising, the particle concentration spikes show responses to severe turbulences (ST) and cabin activities [11,12].
The research of health and safety and thermal comfort of cabin crew and passengers has become one of the hot research topics in the past decades. Many health issues of frequent air travelers and cabin crew are related to their in-cabin experiences. The health issues include mental stress, high altitude conditions, hormonal dysregulation, physical inactivity, fatigue, and biological infections, and the health risks during waiting and taxiing phases are more worthy of attention [13,14,15,16]. Pang, L. et al. indicated that the thermal comfort is not controlled well in some short-haul flights, which lead to overheating or undercooling, and an adaptive model was developed to help crew control the temperature and RH [17]. Some studies observed arid inside aircraft cabin during the cruise phase [18]. When assessing mental performance, the in-cabin temperature has a greater impact than the carbon dioxide (CO2) concentration does on a flight [19]. Tang et al. indicated that the heart rates increase significantly with the increase of exposure time in the aircraft cabin [20]. However, Zitter et al. found no difference between aircraft using 100% fresh air and 50% recirculated air in terms of the passenger likelihood of cold symptoms during the week after their flights [6]. This research investigates the realistic thermal environment and particulate matter (PM) exposures in four Chinese domestic flights, aiming to explore the in-cabin factors affecting airliner crew and passengers’ comfort and health, in order to provide preliminary data and directions for future studies on their safety and health.

2. Experiment and Methods

The experiments were performed on four different airliners in April 2019. As Figure 1 shows, the four airliners executed two China domestic round trips starting and ending at Nanjing Lukou International Airport (NKG). The first round trip headed to and flew back from Guangzhou Baiyun International Airport (CAN), and the second round trip headed to and flew back from Haikou Meilan International Airport (HAK). The planned flight duration of these single way trips is about two hours. A blank flight log (FL) form was prepared by the researchers and filled out by the pilots after the aircraft landed. The FL collected information about the aircraft model, age, capacity, flight duration, cruising altitude, and flight distance. Researchers in the flights recorded all cabin activities and severe turbulences.
PM concentrations were measured throughout all of the four tested flights (E1 through E4), however, due to the limitation of instrument availability, the CO2 and CO concentrations, cabin pressure, temperature, and RH were only monitored in the second-round trip (E3 and E4 only). Although a previous study shows that the sampling location inside the cabin did not well impact the measurements due to the strong ventilation, the in-cabin sampling locations in this study are all close to the rear-mounted jet engines in the four tested flights [21].
Table 1 summarizes the aircraft and flight information of the four tested airliners, and the environmental parameters collected on them. The airliner ages range from 0.7 to 13.2 years, according to the information collected from the FL and the Umetrip website [22]. Each tested flight was divided into four phases in sequence starting from the cabin door closed to the cabin door reopened, based on the researcher’s observations. The four phases are waiting, taxiing-out, inflight, and taxiing-in phases. The inflight phase is the period from the aircraft leaving the ground till touching the ground again. The taxiing phase is the aircraft rolling on the airport ground. People may divide flight time into various phases based on their research needs. For example, Li et al. divided the flight phase into five segments to study the source apportionment of the airborne particles in the commercial aircraft cabin environment, such as taxiing, climbing, cruising, descending, taxiing segments [4]. Park et al. divided the flight into nine phases to study the local and overall thermal comfort in an aircraft cabin and their interrelations, such as processing, boarding, taxiing, take off, climb, cruise, landing, descending, post-processing phases [23].
Table 2 summarizes the instrument information. During the experiments, a Particulate Matter Sensor (PMS) 3003 (Plantower Inc., Beijing, China) was deployed to monitor the PM mass concentrations throughout all tested flights. The measurements were recorded with one-second intervals and conveyed simultaneously to a laptop that the researcher carried onto the flights together with the instrument. The suspended particles scatter the laser beams in the PMS 3003, and the scattered light is collected at a certain angle to obtain a curve of the intensity. Then, the microprocessor uses an algorithm to obtain the equivalent particle sizes and the number concentrations per unit volume. Finally, they were converted to total mass concentrations of different particle size ranges. The PMS 3003 has been calibrated against a TSI DustTrak 8532 for PM2.5 (R2 = 0.89). A 2.5 μm size-selective impactor was installed onto the DustTrak 8532 inlet before the calibration, and the calibration was done both indoor and outdoor to cover a 0–50 μg m−3 reading range. In E3 and E4, the CO2 and CO concentrations, along with the cabin pressure, temperature, and RH, were measured with a Q-Trak Indoor Air Quality Monitor 7575 (TSI Inc., Shoreview, MN, USA). These instruments were placed under the seat to avoid the panic among passengers. All data were recorded with a one-second interval automatically. One-minute averages were calculated for further analysis. The SPSS statistics 22 (IBM Inc, Endicott, NY, USA.) program was used for statistical analysis.
The air exchange rates (AER) inside the tested aircraft cabin can be calculated using CO2 as the tracer. The in-cabin CO2 mass balance model is shown in Equation (1) below,
V c a b i n × d C i n d t = E + Q ( C o u t C i n )
where V c a b i n is the aircraft cabin volume (excludes cockpit), V c a b i n = 139 m3 in this study for Airbus 320. C i n and C o u t are the in-cabin and out-cabin CO2 concentrations in ppm. 405 ppm is used as the outside-cabin CO2 concentration in the stratosphere. t is time. E is the in-cabin CO2 emission rate (0.4 L⋅min−1 per person) [24]. Q is the flow rate of outside-air being introduced to in-cabin.
Equation (1) can be converted into the discrete form as shown in Equation (2),
C i n ( t + Δ t ) C i n ( t Δ t ) 2 Δ t = A E R ( t ) × [ C o u t ( t ) C i n ( t ) ] + E V
where Δ t is the time change, A E R ( t ) equals to Q/V in min−1 at time t.

3. Results and Discussion

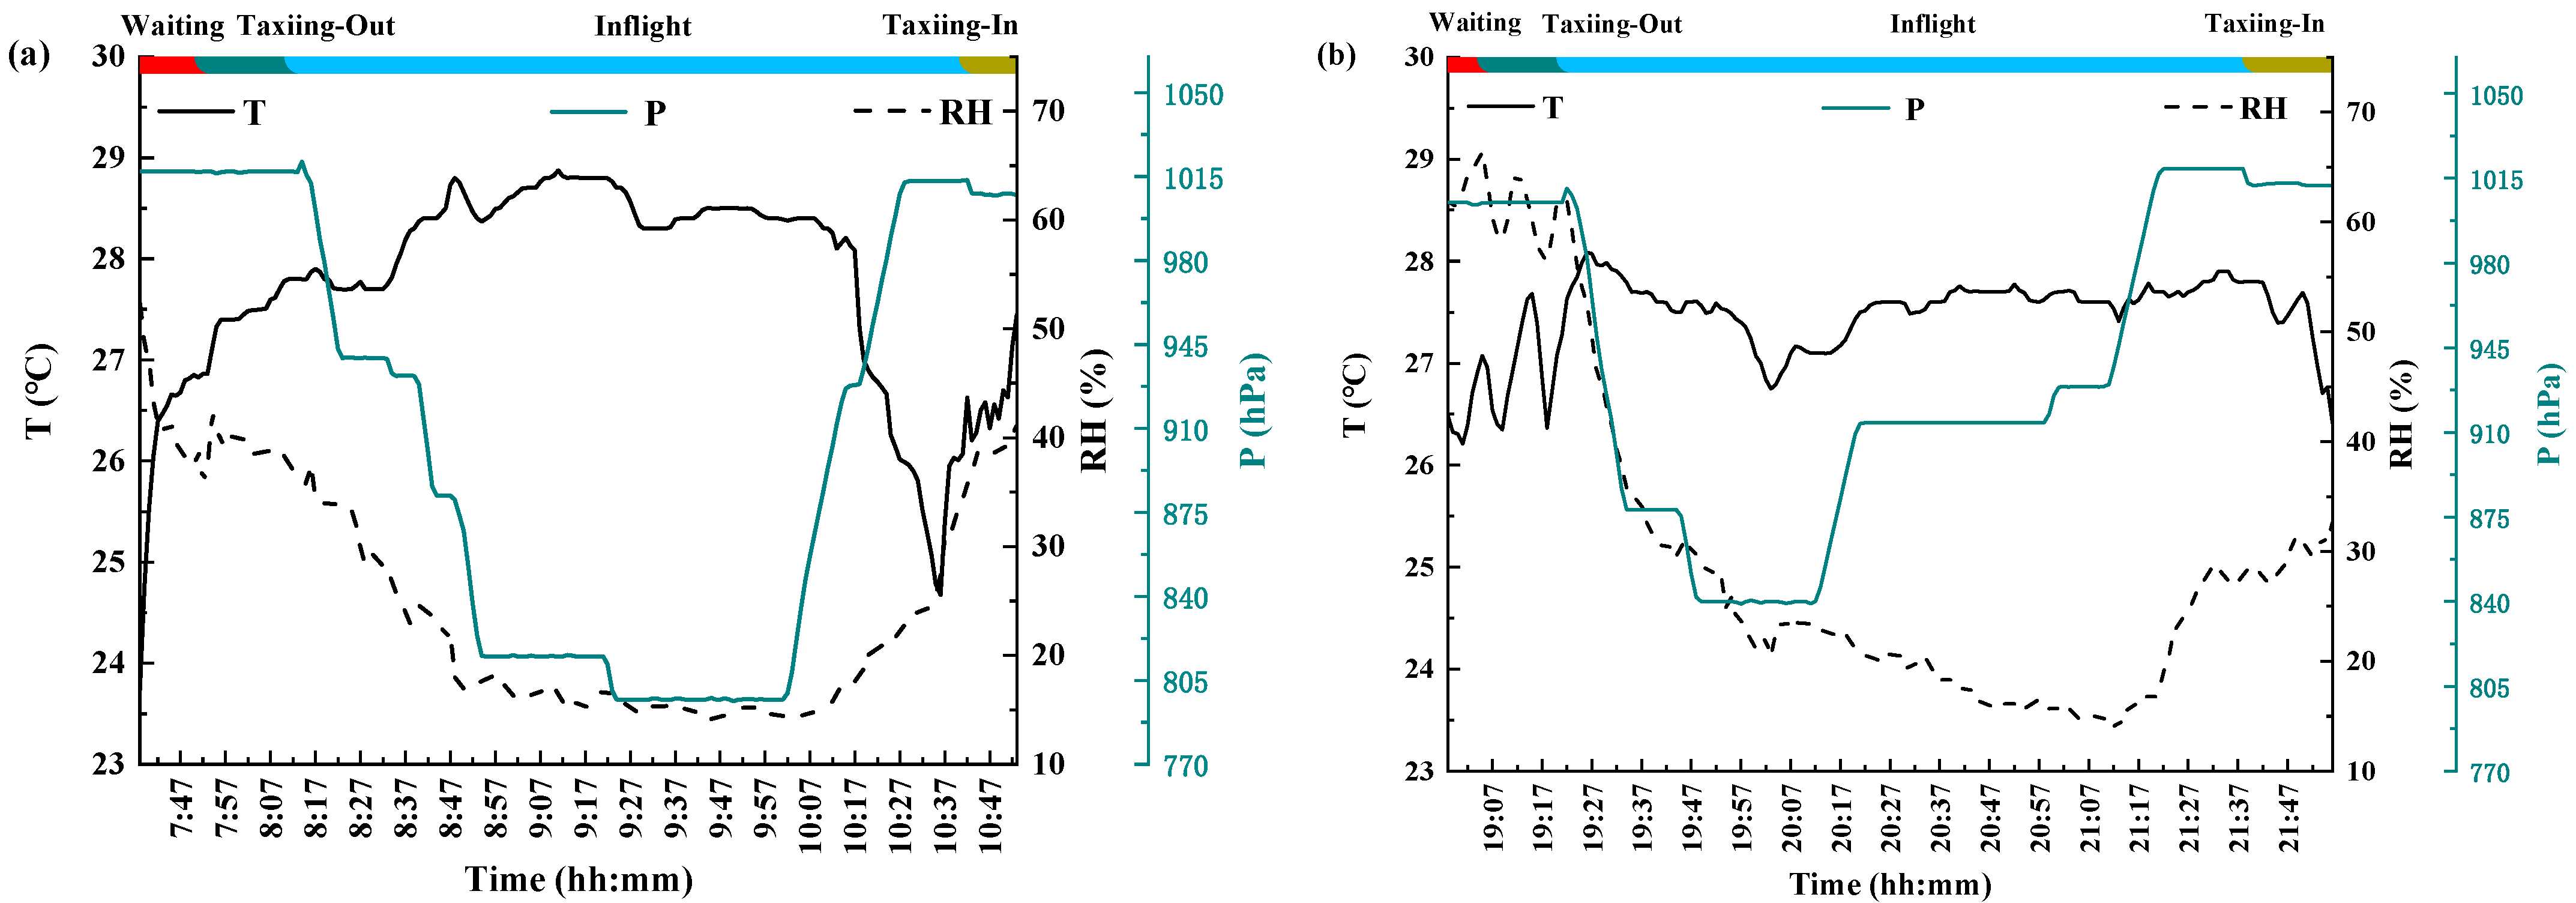
3.1. Temperature, Relative Humidity, and Cabin Pressure

Table 3 summarizes the in-cabin temperature, pressure, and RH measurements in E3 and E4. Figure 2 shows their time series. The temperature and RH levels in E3 and E4 fluctuated within similar narrow ranges. The means of the E3 and E4 in-cabin temperature are 27.5 and 27.2 °C, respectively. The RH in E3 ranges from 14.0 to 66.4% with a mean of 29.7%, and the RH in E4 ranges from 13.8 to 67.0% with a mean of 33.6%. The means and standard deviations (SD) of the measured cabin pressure in E3 and E4 are 910 ± 91 hPa and 938 ± 64 hPa, respectively (Table 3). The mean ± SD of in-cabin T, RH, and P in E3 and E4 were applied to calculate the Predicted Mean Votes (PMV) and Predicted Percentage of Dissatisfied (PPD) based on ASHRAE Standard 55 [25], while assuming the mean passenger metabolic rate is 1.0 met (sit quietly in their seats), the in-cabin air speed is 0.1 m/s, and their clothing level is 0.61 clo (classic spring clothing: thin pants+long-sleeved shirts+socks+shoes, etc). The calculated means of PMV in E3 and E4 are 0.51 and 0.45, with ranges of (0.23, 0.80) and (−0.11, 1.09), respectively, which indicate that the E3 passengers feel neutral but the E4 passengers feel either neutral or slightly warm. The calculated means of PPD in E3 and E4 are 10% and 9%, with ranges of (6%, 18%) and (5%, 28%), respectively, which indicate the percentage of people who might feel discomfort with the thermal conditions in these flights.
Martinez provides guidelines on aircraft thermal environment in his “Aircraft Environment Control” [26]. It recommends the ECS to provide comfort conditions with a temperature of 22.0 ± 2.0 °C, cabin pressure of 900~1000 hPa, and RH levels of 50.0~70.0% [26]. Table 3 and Figure 2 show that the means of the measured temperature in E3 and E4 are over 5.0 °C higher than the recommended, and the mean measured RH is only about half of the middle value of Martinez recommended range. The cabin pressure also fluctuated a bit off the recommended range. However, the mean measured RH of this study is 1.7 (E3) and 1.9 (E4) times higher than the average of Cui et al.’s measurements of 17.45% [18,26].
The in-cabin RH is usually controlled for two reasons: (1) lower the RH to reduce the chance of metal corrosion in the aircraft; (2) maintain comfort and low health risk environment for cabin workers and passengers. The previous study shows that aluminum alloy corrodes much faster in the environment where the RH is higher than 70.0% [27]. Both Martinez and Cui et al. indicate that the aircraft in-cabin RH is often kept as low as 10.0~20.0% to avoid condensation problems on cold walls and equipment, which tend to corrode metals and boost micro-organism growth [18,26]. However, low humidity in aircraft cabin usually induce the feelings of dry skin, dry mucous membranes, and eye irritation, especially on long haul flights over 3 h [28]. For example, Uchiyama et al. found that increased dry eye symptoms were significantly associated with the low RH environmental conditions during air travel [29]. However, there is no conclusion of the correlation between biohazards and the cabin RH so far. Korves et al. indicated that low humidity suppresses the spread of bacteria [30], but Liu et al. found that the bacterial concentrations in the airliners decrease as the RH increases, and the number of colonies per cubic meter at 22.0% RH is 7.3 times of that at 30.0% RH [31]. Liu et al. recommended maintaining the aircraft cabin RH of 30.0% ± 3.0% considering both the aircraft safety and the thermal comfort and health [31]. The means of RH measurements in our study are close to this recommendation, but the ranges are much larger because we tested the cabin conditions from the cabin door closed to the door reopen. While the cabin doors were open to the ambient for passenger boarding and getting off, the departure or arrival airport weather conditions determine the temperature and RH at the start and endpoints of the tested flights. For example, at the departing time in E4, the instant RH in the cabin was over 65.0% when the aircraft cabin door was just closed, because it was raining at HAK at that moment (Figure 2b). The RH levels went down during the inflight phase to their minimum values around 14% and then started to go up when the aircrafts descended (Figure 2).
Most commercial aircraft cabin air supply systems provide a mixture of 50% fresh air and 50% recirculated air to the cabin [32,33,34,35]. The cabin air gets exhausted through the grills on the cabin floor, and 50% of it is recirculated by the aircraft ventilation system. Dehumidifiers are installed in most aircrafts to remove the moisture in bleed air before the air enters the turbine and provide a relatively dry condition. However, no aircraft has a humidifier to increase the RH when the air enters the cabin. Besides, bleed air is processed by an ozone converter mostly installed behind the fresh air extraction port of the compressor of a jet engine to decompose the ozone in bleed air. Then, the dry air after ozone removal, mixed with recirculated air, is delivered into the cabin by the diffusers above the passenger seats. Because there is almost no moisture in the stratosphere, the cabin air keeps losing moisture when the aircraft is cruising, and the in-cabin RH keeps decreasing until the aircraft descends to the troposphere, where the ambient air contains moisture.
The cabin pressure change depends on the combined effects of the amount of supply air, leak air, and exhaust air. The supply air is usually adequate and stable if the ECS functions well, and the leak air is not under control during the flight. Therefore, the cabin pressure adjustment is mainly controlled by the amount of exhaust air, that is, by the outflow valve. The automatic adjustment mode is most frequently used, while the cabin pressure is controlled by a cabin pressure controller (CPC) based on the signal from the flight management guidance computer (FMGC). There are two CPCs installed with paired motors, but only one CPC operates while the other one remains on standby. The active CPC uses the landing elevation and corrected sea level pressure data from the FMGS to optimize the pressure schedule, and sends command signals to its respective motor, which directs the outflow value to the commanded position. The active CPC pressurizes the aircraft through 6 modes: ground, takeoff, cruise, descent, and abort. These modes are impacted by cabin altitude. Thus, the measured cabin pressure levels did not show smooth trends in E3 and E4 (Figure 2). In this study, the fluctuation ranges of cabin pressure in E3 and E4 are 225 hPa (796 to 1021 hPa) and 180 hPa (839 to 1019 hPa), respectively. According to Martinez 2015, a sudden change of cabin pressure over 30 hPa causes pain and vertigo, and the change rate of cabin pressure should be less than 10 hPa·min−1 to decrease the risk of otitis media-related with air traveling [26]. Our measurements show that the cabin pressure change rates during E3 and E4 at the end of the climbing stage and the beginning of the descending stage are close to 1 kPa·min−1, and these might have induced the eardrum pains and transient hearing loss among passengers and crew members (Figure 2). The researchers riding on the aircrafts felt ear pains during those occasions.
In E4, the cabin pressure rises sharply from 20: 12 to 20: 22 (Figure 2b). This is because the E4 flight was scheduled to stop at Yichun Mingyueshan Airport (YIC) before landing on NKG (HAK→YIC→NKG). However, after the aircraft descended, it gave up approaching the YIC airport due to the unexpected meteorological conditions. The pressure change pattern in E4 indicates that the aircraft did not go back to the regular cruising altitude for the rest of the flight.

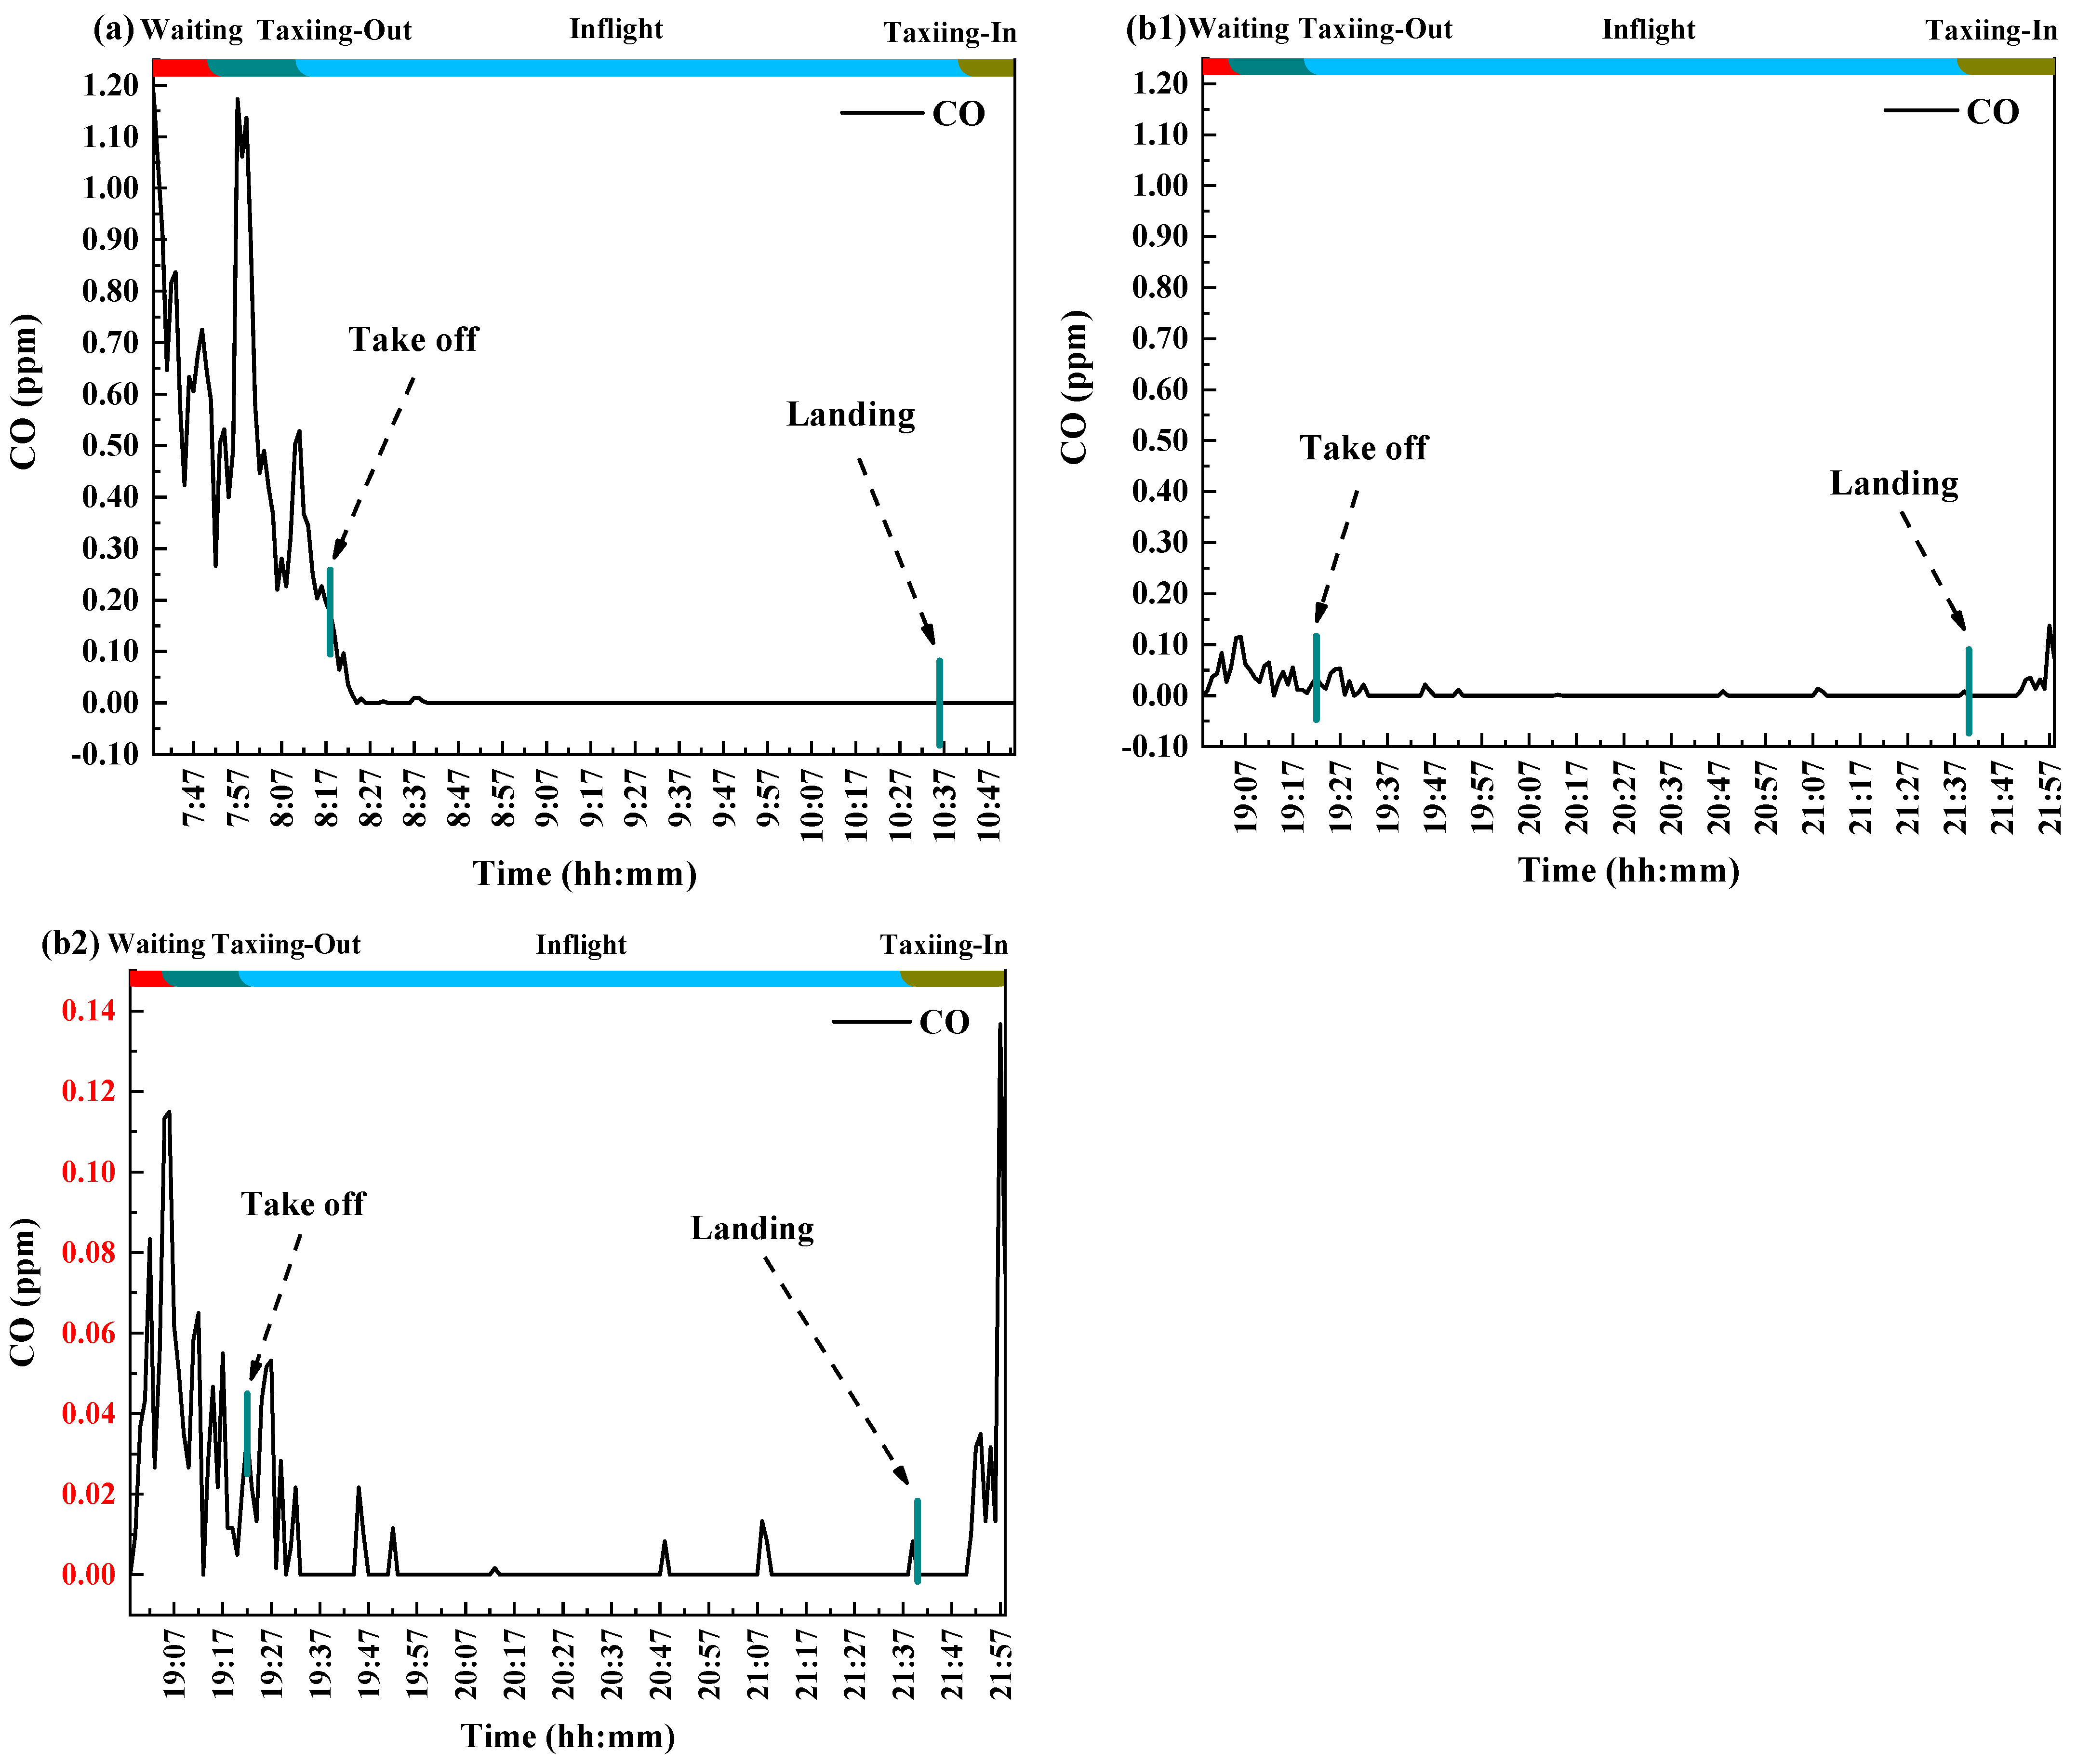
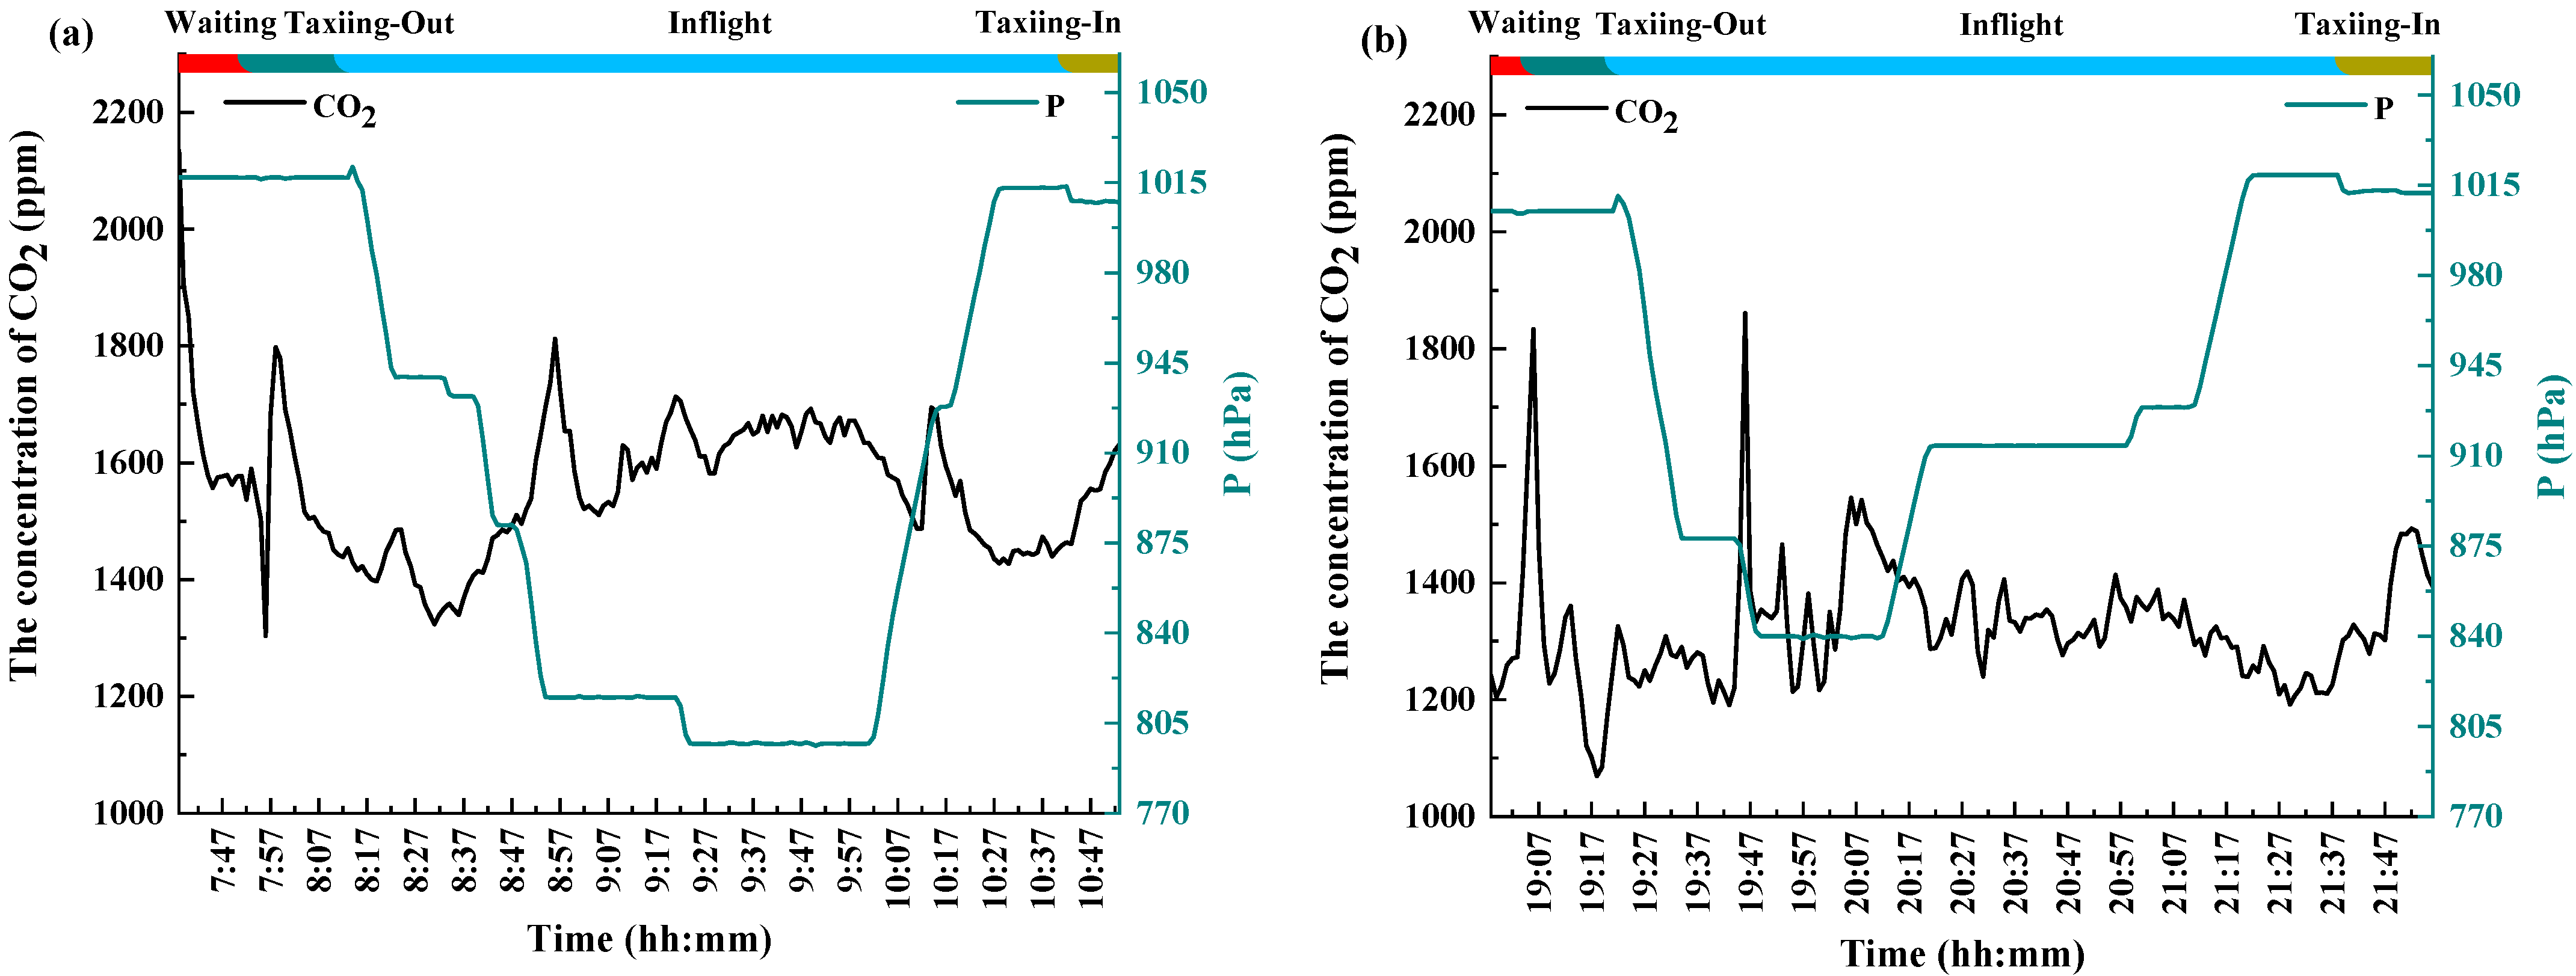
3.2. Carbon Dioxide and Carbon Monoxide

As shown in Table 4, the measured CO2 concentrations range from 1304 to 2135 ppm in E3, and from 1069 to 1861 ppm in E4. The mean and standard deviation of CO2 concentrations in E3 were 1557 ± 117 ppm, and 1323 ± 104 ppm in E4 (Table 4). In this study, the aircraft type of E3 and E4 is Airbus 320 with a passenger compartment volume of 139 m3. However, the E3 aircraft has 174 seats, while the E4 has 158 seats, and both of them were fully loaded. The E3 aircraft is more occupied and older (5.9 yr vs. 3.6 yr) than E4, and these might explain the higher mean CO2 in E3.
Figure 3 shows the CO2 concentration time series in E3 and E4. There is an obvious spike at the end of the waiting phase and the beginning of the taxiing-out phase in both E3 and E4. This is because the aircraft power supply system was switched from the auxiliary power unit (APU) to the jet engine at the end of the waiting phase, so the air conditioner was not working continuously at that moment. Additionally, a huge amount of CO2 was emitted while the aviation fuel started burning and was introduced into the aircraft cabin with the jet engine bleed air while the aircraft was not moving. The Cao et al. study also shows that the ground operation segments have higher in-cabin CO2 concentrations than the cruising segments, due to the inadequate ground ventilation by APU and the higher metabolic rates of people during boarding [36]. In this study, the CO2 concentration decreases during the taxiing-out phase and has another rise during the inflight phase after cabin pressure drop, which is similar to the study of Cao et al. [36].
Additionally, when the cabin pressure was raised for descending, the CO2 concentrations decrease apparently because more ambient air was introduced into the cabin, and the passenger breathing load of cabin CO2 was diluted.
The US Occupational Safety and Health Administration (OSHA) has established an 8-h occupational exposure limit (OEL) for a CO2 concentration of 5000 ppm [21]. The CO2 concentrations in E3 and E4 were all below this OEL. According to the US National Institute for Occupational Safety and Health (NIOSH), chronic exposure to elevated indoor CO2 levels is associated with the following symptoms: drowsiness (1000 to 2000 ppm); headaches, sleepiness, stagnant, stale, stuffiness, loss of attention, increased heart rate, and slight nausea (2000 to 5000 ppm) [37]. The results in E3 and E4 are both in the drowsiness range. The in-cabin mean CO2 concentration level of this study is similar to previous studies, and the measurements in the European Union Aviation Safety Agency (EASA) reports [21,36,38].
The mean CO2 concentration in E3 and E4 are 1.4 and 1.2 times higher than the mean level of 10 tested flights in the Cui et al. study (1096 ppm) [18]. Cui et al. tested Boeing 737 actual flights with a passenger compartment volume of 108 m3 configured with 120 seats (8-seat first class, 112 economy class). However, in that study, the average occupancy is 82.8%, although the average space of each seat is similar to our study. If we use the reference ambient CO2 concentration of 405 ppm [39,40], the mean level of CO2 concentration in E3 and E4 is about 3.5 times the reference ambient CO2 concentration.
The calculated AERs of E3 and E4 are 0.32 min−1 and 0.43 min−1, respectively. That means on average, the E3 aircraft cabin introduces a whole cabin volume of fresh outside air into the cabin once every 3.10 min, and the E4 aircraft cabin introduces a whole cabin volume of fresh outside air into the cabin once every 2.45 min. These results are similar to the report of the Aviation Public Health Initiative (APHI), and satisfy design guide from Airbus and Boeing (the volume of cabin air exchanges once every 2–3 min) [41].
The CO concentrations in both E3 and E4 flights are below or equal to 1.18 ppm. The sensitivity and accuracy (±3 ppm) of the TSI CO sensor we used in this experiment are not sufficient to detect the low CO levels inside the realistic flight cabin, however, the collected data are within the instrument detection range and can be used as reference. The US OSHA has established an 8-h Permissible Exposure Limit for CO of 35.00 ppm. Because significant risks of cardiovascular disease mortality have been associated with CO exposure [42], the US Federal Aviation Administration (FAA) defines the limits for unhealthy CO exposure of 10.00 ppm time-weighted average. The sampling results in this study are all below these limits.
Although the measured CO concentrations are far below the recommended permissible limits, and are not supposed to have any adverse health effects on flight passengers and cabin crew, the CO sampling results are still a very good index to show the aircraft self-pollution and airport effects. Figure 4 indicates that the CO concentrations during the waiting phase and taxiing phases are higher than those in the inflight phase due to the incomplete combustion of fuel and the polluted cabin air intake. There was almost no CO during the inflight phase, but the concentrations returned to a relatively high level after aircraft landed on the destination airports in E4. When the aircraft waits for taxiing out after the cabin door closed, the idling engine generates CO due to the incomplete combustion of the aviation fuel. Besides, the ground support equipment (GSE) emits CO that enters the aircraft cabin under certain conditions [43]. However, CO is not usually present in the cabin under normal operating conditions during the inflight phase [43]. Thus, longer waiting and taxiing time in the airport might increase passengers’ CO exposures.
The in-cabin CO concentrations can be influenced by the airport CO levels, ground wind direction, jet engine status, and the cabin ventilation system status. Figure 4.b2 shows a magnified view of the CO concentrations in the aircraft cabin during E4. The average CO concentration in E3 is ten times of that in E4. The maximum CO readings occur during the taxiing-out stage of E3, however they are all below the allowable limits, such as the 9 ppm for outside air (USEPA) and 15 ppm for indoor (ASHREA). The aircraft age of E3 is also older than that of E4 (Table 1), which may also contribute to higher CO concentrations in E3 flight. CO spikes coincidence with the PM spikes at waiting and taxiing phases in E3 and E4 indicate self-pollution and the airport effects on in-cabin air (Figure 4).

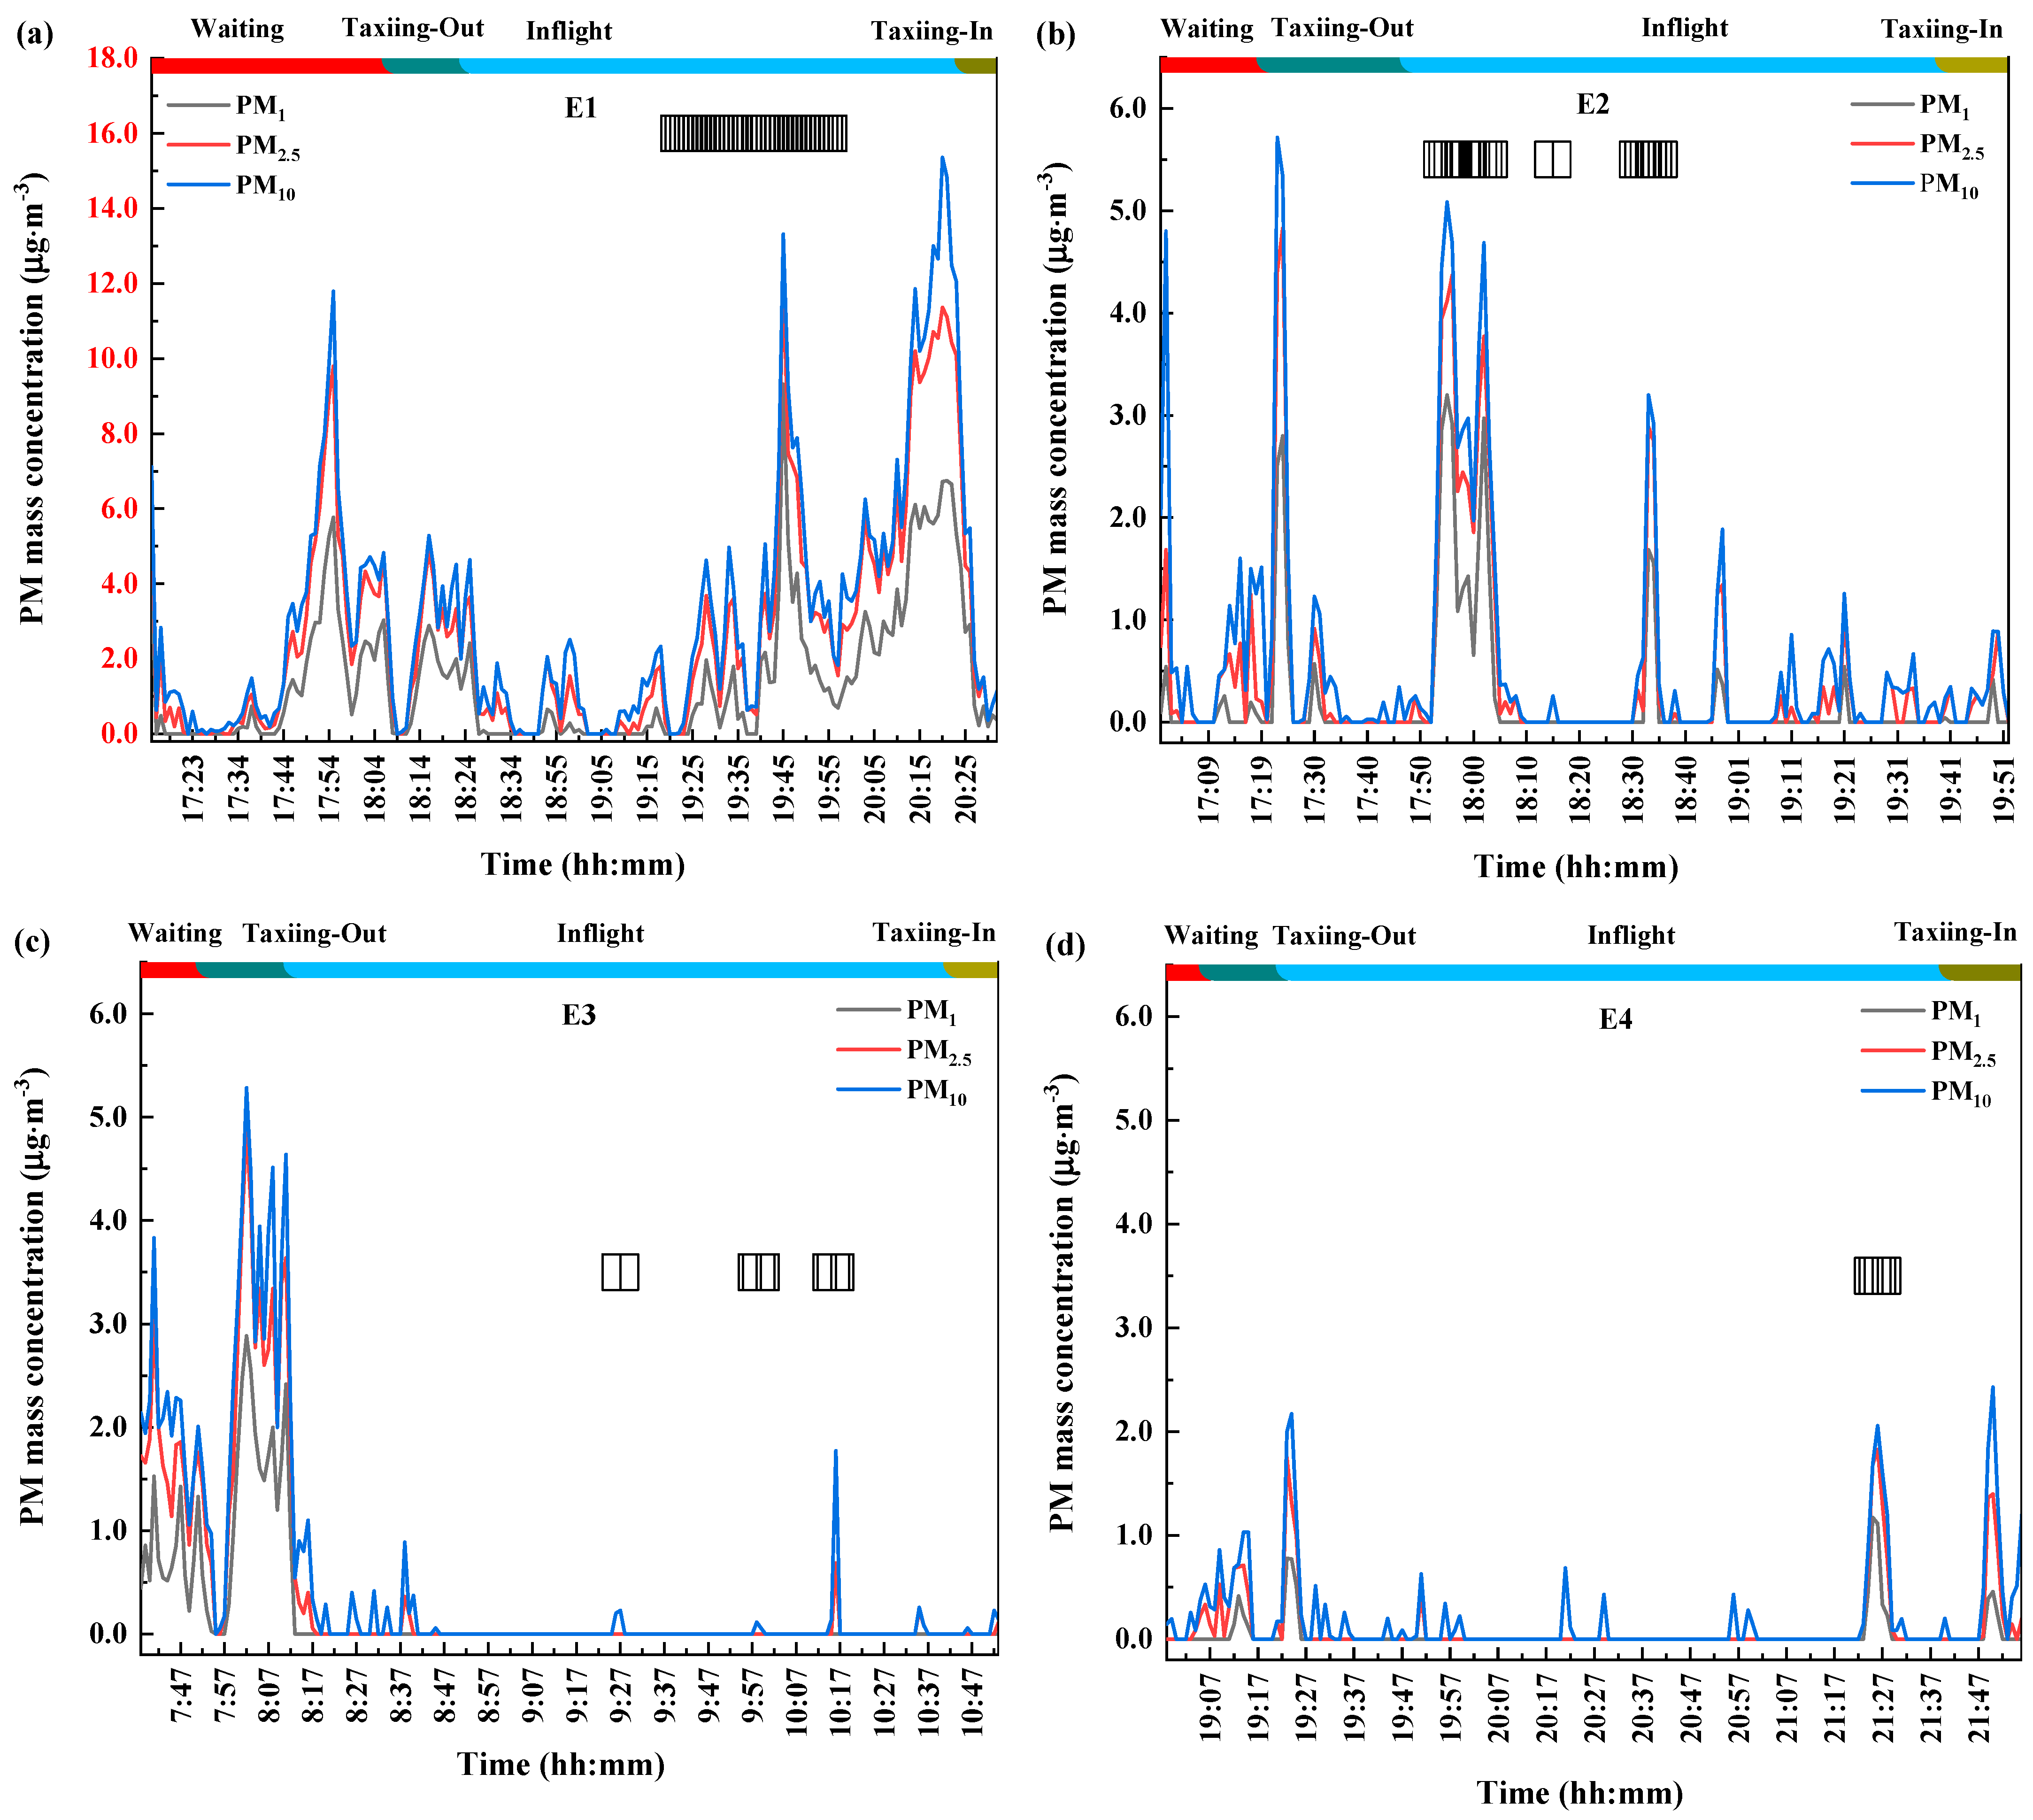
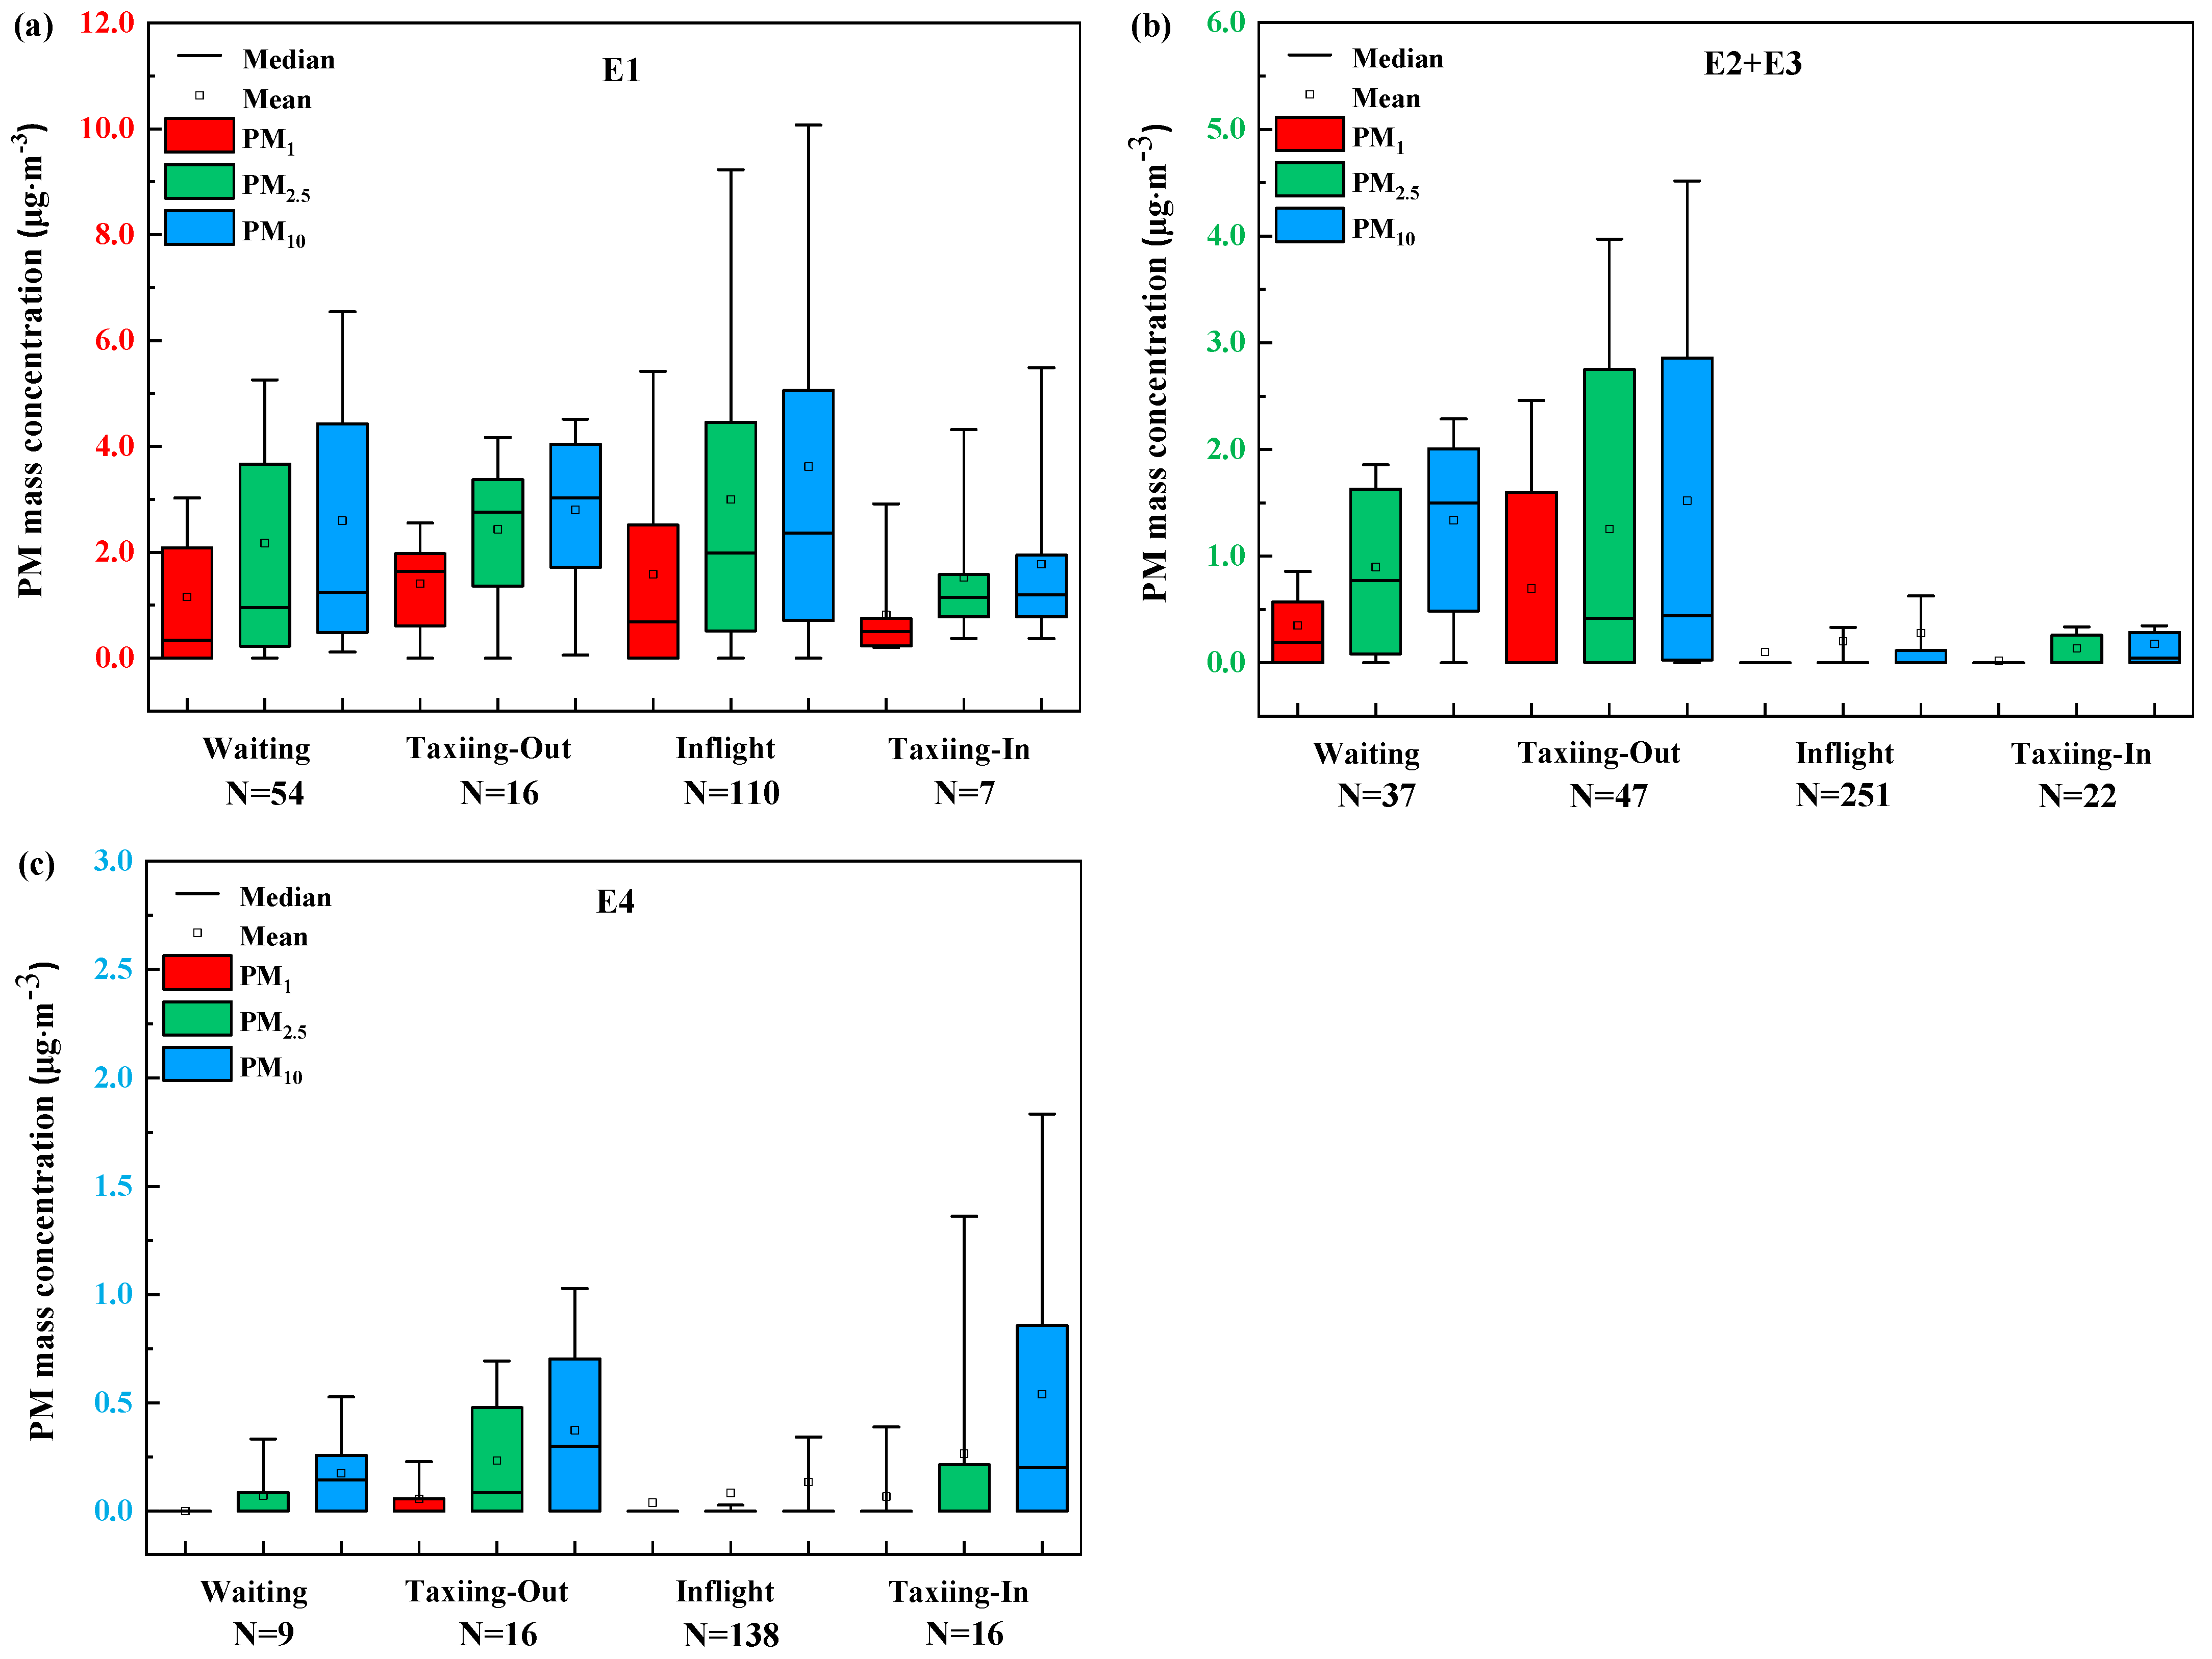
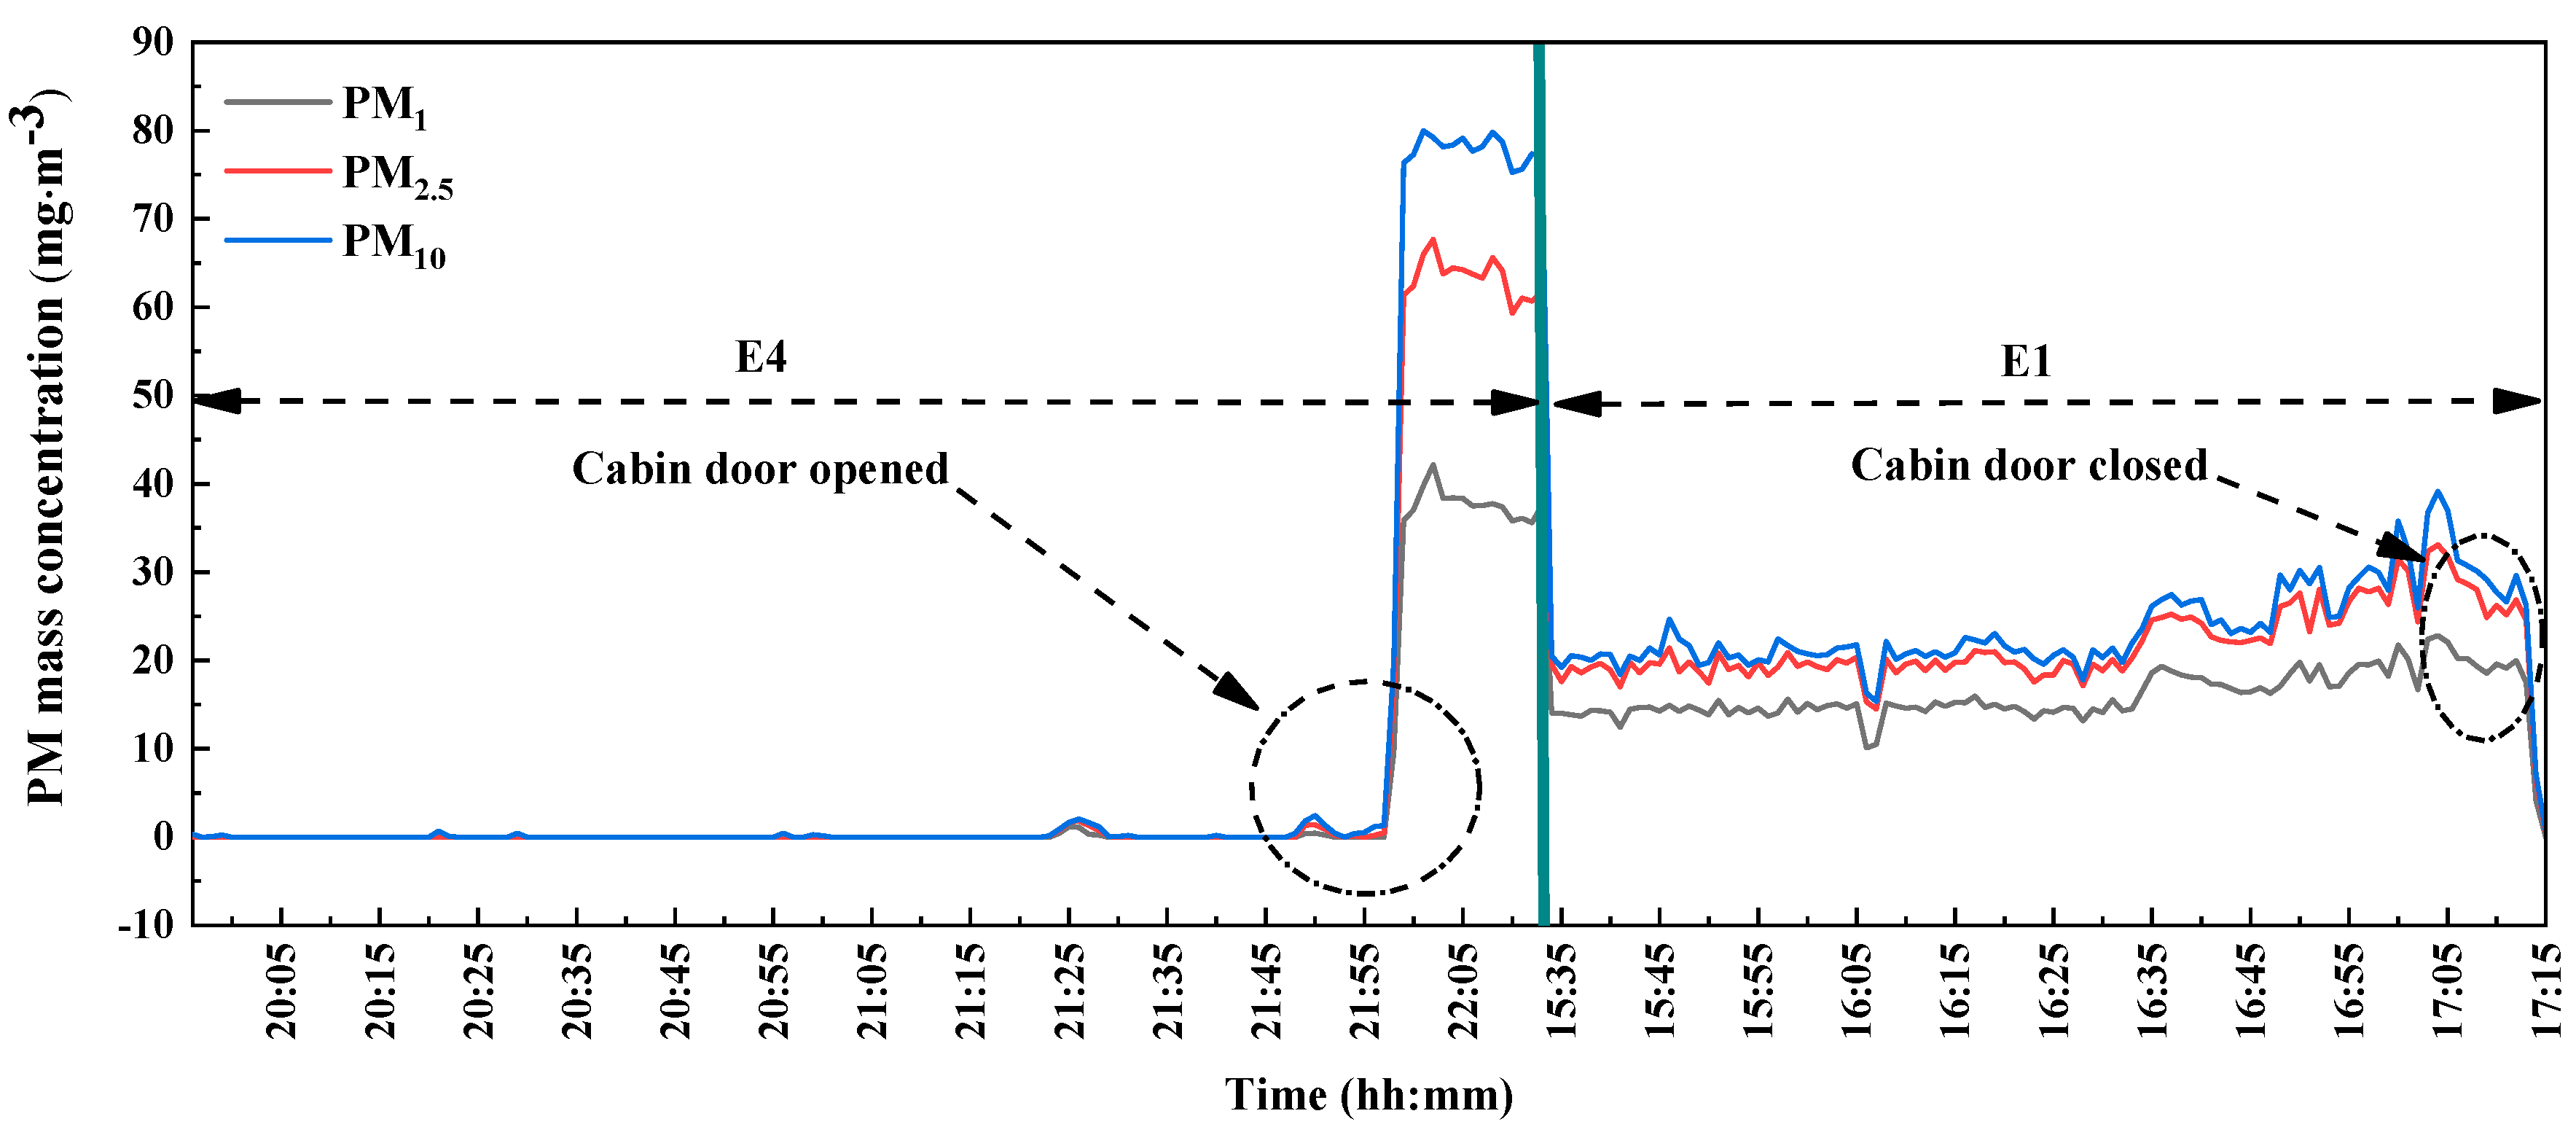
3.3. Particle Concentrations

The in-cabin particle measurements are summarized in Table 5, and their time series with manually recorded turbulence shakes are shown in Figure 5. The mean mass concentrations of PM1, PM2.5, and PM10 in E1 are 1.42, 2.66, and 3.19 μg·m−3, respectively, which are consistently the highest among the four tested flights. The mean mass concentrations of PM1, PM2.5, and PM10 in E4 are 0.04, 0.15, and 0.26 μg·m−3, respectively, which are consistently the lowest among the four tested flights. The mean PM1, PM2.5, and PM10 mass concentrations in E2 are close to but consistently higher than those in E3 (Table 5). Table 5 also indicates that the maximum PM1, PM2.5, and PM10 concentrations were all observed in E1, which are 9.31, 12.37, and 15.36 μg·m−3, respectively. Moreover, the standard deviations of PM mass concentrations in E1 are also the highest among all flights, which indicate that the concentration variations are most prominent in E1. It is necessary to note that the sensitivity and accuracy (±10 μg m−3 @ 0~100 μg m−3) of the PMS sensor we used in this experiment are not sufficient to detect the low PM levels inside the realistic flight cabin, however, the collected data are within the instrument detection range and can be used as reference.
Based on our record, the E1 is the oldest aircraft with a 13.2 yr age, which is about 2.24 times older than the second oldest one of 5.6 yr age (Table 1). Deposition and re-suspension of particles on the interior of the air duct system and cabin can be much more prominent in E1, and its filtration in the ventilation system might not be working as well as other tested aircrafts due to its age [9,10,11,44]. In addition, severe turbulences during the inflight phases were recorded by researchers in this study. The coincidences of the PM spikes were observed from time series (Figure 5). The PM re-suspension was apparent in all tested flights, however, E1 was affected most because the aircraft experienced more turbulences during the flight.
These results implicate that frequent deep cleaning of the air ducts and interior surface of the aircraft cabin is essential in reducing in-cabin PM concentrations during the flight. The civil airport is usually highly polluted with fine and ultrafine particles due to its business, and the aircraft air conditioning systems collect a large amount of PM during their ground operation. The aircraft cabin is a unique environment that has the chance to get unstable experiences, and different levels of re-suspension may occur. Without deep cleaning, particles can be accumulated for years and re-suspend to cabin air and human breathing zone. Based on our knowledge, the civil aviation industry has grown rapidly in decades, and many aircrafts were scheduled for very fast cleaning and maintenance due to their tight schedule. Although most of the aircraft being used in China domestic flights are pretty new, there are still many aircraft older than ten years. More frequent thorough cleaning of the ECS and the interior surfaces of these aircraft cabins is recommended to lower cabin crew and passenger’s PM exposures. The self-cleaning functions of the ECS can be explored by the aircraft manufacturer for their future design.
One-way Analysis of Variance (ANOVA) and t-tests were used to compare the PM mass concentrations among different flights, and the results show that E1 and E4 are significantly different from those in E2 and E3, while the PM mass concentrations in E2 and E3 are not significantly different (α = 0.05). Therefore, E2 and E3 measurements are grouped together for further analysis, but E1 and E4 are analyzed separately.
The boxplots of PM mass concentrations in E1 in different flight phases are shown in Figure 6a. The E2 and E3 PM data were combined and showed in Figure 6b. The results indicate that the average PM mass concentrations in the taxiing-out phase are about two times higher than those in the taxiing-in phase (Figure 6b). Figure 6c shows the PM10 mass concentrations rise after the E4 flight landing on the destination airport. After the E4 flight landing on NKG, ground particles entered the air conditioning system with the bleed air from the jet engine. The in-cabin CO concentrations show a rise at the same time (Figure 4). These indicate the departure and destination airports may affect the cabin interior environment during waiting and taxiing phases.
The taxiing-out and taxiing-in phases mean PM mass concentrations have no significant differences in all tested flight (α = 0.05). The inflight phase’s mean PM mass concentrations in E2 + E3 and E4 are significantly lower than other phases on the same flight, however, the inflight PM levels in E1 were not different from other phases (α = 0.05). The time series show E1 has experienced more frequent turbulences with longer durations than other tested flights. In addition, as mentioned, the E1 aircraft is 13.2 years old and the particle deposition could be severe in the ECS ducts and the interior surfaces of in the cabin. The turbulences made the particles re-suspended and the inflight phase PM concentrations increased. Beside the inflight phase, the waiting and taxiing phases PM in E1 were significantly higher than the comparable phases on other flights. Especially, the mean PM10 mass concentration of the E1 waiting phase is about 2 μg·m−3, and the maximum PM10 concentration reaches 12 μg·m−3. The waiting time in E1 was elongated to about an hour due to the air traffic control. The results show that reducing flight waiting time is helpful to lower cabin crew and passengers’ PM exposures. If the flight delays for a long time, waiting in the terminal buildings instead of staying inside the aircraft cabin will reduce passenger PM exposures.
To find out the airport condition effects on the cabin air quality, Figure 7 compares the PM time series right before and after the cabin doors closed or opened at NKG in E1 and E4, respectively. The mass concentrations of the PM1, PM2.5, PM10 reach 37.67, 63.29, 77.88 μg·m−3, respectively, 10 min after the E4 cabin door opened. The mean mass concentrations of the PM1, PM2.5, PM10 were 16.09, 21.92, 23.73 μg·m−3, respectively, at 10 min before the cabin door closed in E1. The difference may be due to the airport running and particle accumulation time at NKG is longer in E4, because the E4 arrival time is around 10 p.m. Not like the E1 data at NKG, the mass concentrations of PM1, PM2.5, and PM10 were quite different during the E4 landing time. This is probably because the smaller particles grew up to bigger ones at the evening/night time comparing with the freshly emitted smaller ones in the afternoon time (Figure 7).
In this study, we first time measured cabin pressure changes along with thermal environment parameters and particle exposures in actual flight cabins. In-cabin thermal environment and PM concentrations were investigated. However, it should be noted that our study has several limitations. For example, due to the instrument availability and restrictions for real flights, only four actual domestic flights were tested for PM mass concentrations, and the thermal environment parameters were only collected in two flights. PM number concentrations were not measured in this study. The time lag effects for thermal parameters and different size particles cannot be clearly identified from current data. The airport emission sources and their effects on the in-cabin exposures cannot be associated with this study’s results. In addition, the time of closing the cabin door, and severe turbulences were recorded manually, so human errors are unavoidable.

4. Conclusions

In the tested realistic domestic flights, the average in-cabin temperature is 27.4 °C, RH is 31.7%, and cabin pressure is 924 hPa, which are close to other in-cabin studies. However, the measured mean temperature is 5 °C higher, and the RH is 20% lower than the Martinez 2015 recommendations. The cabin pressure change rates at the end of the climbing stage and the beginning of the descending stage are close to 10 hPa·min−1, and this rate may induce the uncomfortable feeling of passengers and crew members.
The monitored CO2 concentrations vary from 1069 to 2135 ppm, with an average and standard deviation of 1440 ± 111 ppm. The CO concentrations are lower than 1.20 ppm all the time, which are under the US OSHA and FAA exposure limits.
From our observations, the mean PM mass concentrations in the oldest aircraft are significantly higher than those in the other aircrafts, and the waiting phases mean PM mass concentration is significantly higher than other phases in the oldest aircraft. In addition, there are apparent concentration spikes when the aircraft encountered severe turbulence. These results suggest particle deposition and re-suspension inside aircraft, and assume frequent thorough cleaning in commercial airliners and avoiding severe turbulence routes could be of help to reduce the passengers and cabin crew exposures. However, since only four flights were tested in this study, more research needs to be done to make the aircraft age effects on PM more conclusive.

Author Contributions

Conceptualization, N.Y. and H.L.; methodology, N.Y.; software, Y.Z.; validation, N.Y., Y.Z. and M.Z.; formal analysis, H.L.; investigation, Y.Z.; resources, Y.Z.; data curation, Y.Z.; writing—original draft preparation, Y.Z.; writing—review and editing, N.Y.; visualization, Y.Z.; supervision, N.Y.; project administration, N.Y.; funding acquisition, N.Y. and M.Z. All authors have read and agreed to the published version of the manuscript.

Funding

This research was funded by the Nanjing University of Aeronautics and Astronautics New Faculty Start-up fund, grant number 90YAH19018; This research was also funded by the Postgraduate Research & Practice Innovation Program of Jiangsu Province, grant number SJCX20_0067.

Institutional Review Board Statement

Not applicable.

Informed Consent Statement

Not applicable.

Data Availability Statement

Not applicable.

Acknowledgments

The authors sincerely thank Quan Ye for helping with the field measurement and preliminary data processing. Special thanks should also be given to Jie Li for providing the needed instruments during experiments.

Conflicts of Interest

The authors declare no conflict of interest.

References

  1. Giaconia, C.; Orioli, A.; Di Gangi, A. Air quality and relative humidity in commercial aircrafts: An experimental investigation on short-haul domestic flights. Build. Environ. 2013, 67, 69–81. [Google Scholar] [CrossRef] [Green Version]
  2. Bull, K. Cabin air filtration: Helping to protect occupants from infectious diseases. Travel Med. Infect. Dis. 2008, 6, 142–144. [Google Scholar] [CrossRef]
  3. Guan, J.; Jia, Y.; Wei, Z.; Tian, X. Temporal variations of ultrafine particle concentrations in aircraft cabin: A field study. Build. Environ. 2019, 153, 118–127. [Google Scholar] [CrossRef]
  4. Li, Z.; Guan, J.; Xudong, Y.; Lin, C.-H. Source apportionment of airborne particles in commercial aircraft cabin environment: Contributions from outside and inside of cabin. Atmos. Environ. 2014, 89, 119–128. [Google Scholar] [CrossRef]
  5. Chen, W.; Liu, J.; Li, F.; Cao, X.; Li, J.; Zhu, X.; Chen, Q. Ventilation similarity of an aircraft cabin mockup with a real MD-82 commercial airliner. Build. Environ. 2017, 111, 80–90. [Google Scholar] [CrossRef]
  6. Zitter, J.N.; Mazonson, P.D.; Miller, D.P.; Hulley, S.B.; Balmes, J.R. Aircraft cabin air recirculation and symptoms of the common cold. JAMA 2002, 288, 483–486. [Google Scholar] [CrossRef] [PubMed] [Green Version]
  7. Daisey, J.M.; Angell, W.J.; Apte, M.G. Indoor air quality, ventilation and health symptoms in schools: An analysis of existing information. Indoor Air 2003, 13, 53–64. [Google Scholar] [CrossRef] [PubMed]
  8. Ren, J.; Liu, J.; Cao, X.; Li, F.; Li, J. Ultrafine particles in the cabin of a waiting commercial airliner at Tianjin International Airport, China. Indoor Built Environ. 2017, 27, 1247–1258. [Google Scholar] [CrossRef]
  9. Cao, Q.; Liu, Y.; Liu, W.; Lin, C.-H.; Wei, D.; Baughcum, S.; Norris, S.; Shen, X.; Long, Z.; Chen, Q. Experimental study of particle deposition in the environmental control systems of commercial airliners. Build. Environ. 2016, 96, 62–71. [Google Scholar] [CrossRef]
  10. Cao, Q.; Xu, Q.; Liu, W.; Lin, C.-H.; Wei, D.; Baughcum, S.; Norris, S.; Chen, Q. In-flight monitoring of particle deposition in the environmental control systems of commercial airliners in China. Atmos. Environ. 2017, 154, 118–128. [Google Scholar] [CrossRef]
  11. Walton, C.; Crump, D.; Harrison, P. Aircraft Cabin Air Sampling Study; Part 1 of the Final Report; Institute of Environment and Health, Cranfield University: Cranfield, UK, 2011. [Google Scholar]
  12. Walton, C.; Crump, D.; Harrison, P. Aircraft Cabin Air Sampling Study; Part 2 of the Final Report, Institute of Environment and Health, Cranfield University. April 2011. Available online: https://dspace.lib.cranfield.ac.uk/handle/1826/5306 (accessed on 8 May 2021).
  13. Lang, M.; Society, C.P.; Committee, C.P. Air travel and children’s health issues. Paediatr. Child Health 2007, 12, 45–50. [Google Scholar]
  14. Chaturvedi, A.K. Aerospace toxicology overview: Aerial application and cabin air quality. In Reviews of Environmental Contamination and Toxicology; Springer: Berlin, Germany, 2012; pp. 15–40. [Google Scholar]
  15. Seabridge, A.; Morgan, S. Air Travel and Health: A Systems Perspective; Wiley: Hoboken, NJ, USA, 2011. [Google Scholar]
  16. Kim, J.-N.; Lee, B.-M. Risk management of free radicals involved in air travel syndromes by antioxidants. J. Toxicol. Environ. Health Part B 2018, 21, 47–60. [Google Scholar] [CrossRef] [PubMed]
  17. Pang, L.; Qin, Y.; Liu, D.; Liu, M. Thermal comfort assessment in civil aircraft cabins. Chin. J. Aeronaut. 2014, 27, 210–216. [Google Scholar] [CrossRef] [Green Version]
  18. Cui, W.; Wu, T.; Ouyang, Q.; Zhu, Y. Passenger thermal comfort and behavior: A field investigation in commercial aircraft cabins. Indoor Air 2017, 27, 94–103. [Google Scholar] [CrossRef]
  19. Jia, S.; Lai, D.; Kang, J.; Li, J.; Liu, J. Evaluation of relative weights for temperature, CO2, and noise in the aircraft cabin environment. Build. Environ. 2018, 131, 108–116. [Google Scholar] [CrossRef]
  20. Tang, C.-S.; Wu, T.-Y.; Chuang, K.-J.; Chang, T.-Y.; Chuang, H.-C.; Lung, S.-C.C.; Chang, L.-T. Impacts of In-Cabin Exposure to Size-Fractionated Particulate Matters and Carbon Monoxide on Changes in Heart Rate Variability for Healthy Public Transit Commuters. Atmosphere 2019, 10, 409. [Google Scholar] [CrossRef] [Green Version]
  21. Schuchardt, S.; Bitsch, A.; Koch, W.; Rosenberger, W. CAQ: Preliminary Cabin Air Quality Measurement Campaign; Final Report EASA_REP_RESEA_2014_4; EASA: Fraunhofer ITEM, Germany, 2017.
  22. Travel Sky Technology Co., Ltd. Umetrip. Available online: http://www.umetrip.com/mskyweb/main/index.html?hrefParam=index (accessed on 8 May 2021).
  23. Park, S.; Hellwig, R.T.; Grün, G.; Holm, A. Local and overall thermal comfort in an aircraft cabin and their interrelations. Build. Environ. 2011, 46, 1056–1064. [Google Scholar] [CrossRef]
  24. Fu, C.C.; Li, L.; Lee, A. A practical study on reducing CO2 density in educational buildings in North-East China. J. Constr. Res. 2019, 65, 65881289. [Google Scholar] [CrossRef]
  25. ASHRAE. Standard 55–2020. In Thermal Environmental Conditions for Human Occupancy (ANSI Approved); ASHRAE: Atlanta, GA, USA, 2021. [Google Scholar]
  26. Martinez, I. Aircraft Environmental Control. Available online: http://webserver.dmt.upm.es/~isidoro/tc3/Aircraft%20ECS.pdf (accessed on 8 May 2021).
  27. Li, C.; Ma, Y.; Li, Y.; Wang, F. EIS monitoring study of atmospheric corrosion under variable relative humidity. Corros. Sci. 2010, 52, 3677–3686. [Google Scholar] [CrossRef]
  28. Nagda, N.L.; Hodgson, M. Low relative humidity and aircraft cabin air quality. Indoor Air 2001, 11, 200–214. [Google Scholar] [CrossRef] [PubMed]
  29. Uchiyama, E.; Aronowicz, J.D.; Butovich, I.A.; McCulley, J.P. Increased Evaporative Rates in Laboratory Testing Conditions Simulating Airplane Cabin Relative Humidity: An Important Factor for Dry Eye Syndrome. Eye Contact Lens Sci. Clin. Pract. 2007, 33, 174–176. [Google Scholar] [CrossRef]
  30. Korves, T.; Piceno, Y.; Tom, L.; DeSantis, T.; Jones, B.; Andersen, G.; Hwang, G. Bacterial communities in commercial aircraft high-efficiency particulate air (HEPA) filters assessed by PhyloChip analysis. Indoor Air 2013, 23, 50–61. [Google Scholar] [CrossRef] [PubMed]
  31. Liu, M.; Liu, J.; Ren, J.; Liu, L.; Chen, R.; Li, Y. Bacterial community in commercial airliner cabins in China. Int. J. Environ. Health Res. 2020, 30, 284–295. [Google Scholar] [CrossRef]
  32. Withers, M.R.; Christopher, G.W. Aeromedical evacuation of biological warfare casualties: A treatise on infectious diseases on aircraft. Mil. Med. 2000, 165 (Suppl. 3), 1–21. [Google Scholar] [CrossRef] [Green Version]
  33. Hocking Martin, B. Trends in Cabin Air Quality of Commercial Aircraft: Industry and Passenger Perspectives. In Reviews on Environmental Health; University of Victoria: Victoria, BC, Canada, 2002; Volume 17, p. 1. [Google Scholar]
  34. Bagshaw, M.; Illig, P. 47—The Aircraft Cabin Environment. In Travel Medicine, 4th ed.; Keystone, J.S., Kozarsky, P.E., Connor, B.A., Nothdurft, H.D., Mendelson, M., Leder, K., Eds.; Elsevier: London, UK, 2019; pp. 429–436. [Google Scholar]
  35. Dygert, R.K.; Dang, T.Q. Mitigation of cross-contamination in an aircraft cabin via localized exhaust. Build. Environ. 2010, 45, 2015–2026. [Google Scholar] [CrossRef]
  36. Cao, X.; Zevitas, C.D.; Spengler, J.D.; Coull, B.; McNeely, E.; Jones, B.; Loo, S.M.; MacNaughton, P.; Allen, J.G. The on-board carbon dioxide concentrations and ventilation performance in passenger cabins of US domestic flights. Indoor Built Environ. 2019, 28, 761–771. [Google Scholar] [CrossRef]
  37. Henderson, R. Carbon dioxide measures up as a real hazard. Occup. Health Saf. 2006, 75, 64, 68. [Google Scholar]
  38. Rosenberger, W. Effect of charcoal equipped HEPA filters on cabin air quality in aircraft. A case study including smell event related in-flight measurements. Build. Environ. 2018, 143, 358–365. [Google Scholar] [CrossRef]
  39. Schnelle Jr, K.B.; Dunn, R.F.; Ternes, M.E. Air Pollution Control Technology Handbook; CRC Press: Boca Raton, FL, USA, 2015. [Google Scholar]
  40. Schultz, J.A.; Hartmann, M.; Heinemann, S.; Janke, J.; Jürgens, C.; Oertel, D.; Rücker, G.; Thonfeld, F.; Rienow, A. DIEGO: A Multispectral Thermal Mission for Earth Observation on the International Space Station. Eur. J. Remote Sens. 2019, 53, 28–38. [Google Scholar] [CrossRef] [Green Version]
  41. Marcus, L. Assessment of Risks of SARS-CoV-2 Transmission During Air Travel and Non-Pharmaceutical Interventions to Reduce Risk, Phase One Report: Gate-to-Gate Travel Onboard Aircraft. In Faculty and Scientists at the Harvard TH Chan School of Public Health; Harvard University: Cambridge, MA, USA, 2020. [Google Scholar]
  42. Liu, C.; Yin, P.; Chen, R.; Meng, X.; Wang, L.; Niu, Y.; Lin, Z.; Liu, Y.; Liu, J.; Qi, J. Ambient carbon monoxide and cardiovascular mortality: A nationwide time-series analysis in 272 cities in China. Lancet Planet. Health 2018, 2, 12–18. [Google Scholar] [CrossRef] [Green Version]
  43. Dechow, M.; Nurcombe, C.A.H. Aircraft Environmental Control Systems. In Air Quality in Airplane Cabins and Similar Enclosed Spaces; Hocking, M., Ed.; Springer: Berlin/Heidelberg, Germany, 2005; pp. 3–24. [Google Scholar]
  44. Zhou, Y.; Deng, Y.; Wu, P.; Cao, S.-J. The effects of ventilation and floor heating systems on the dispersion and deposition of fine particles in an enclosed environment. Build. Environ. 2017, 125, 192–205. [Google Scholar] [CrossRef]
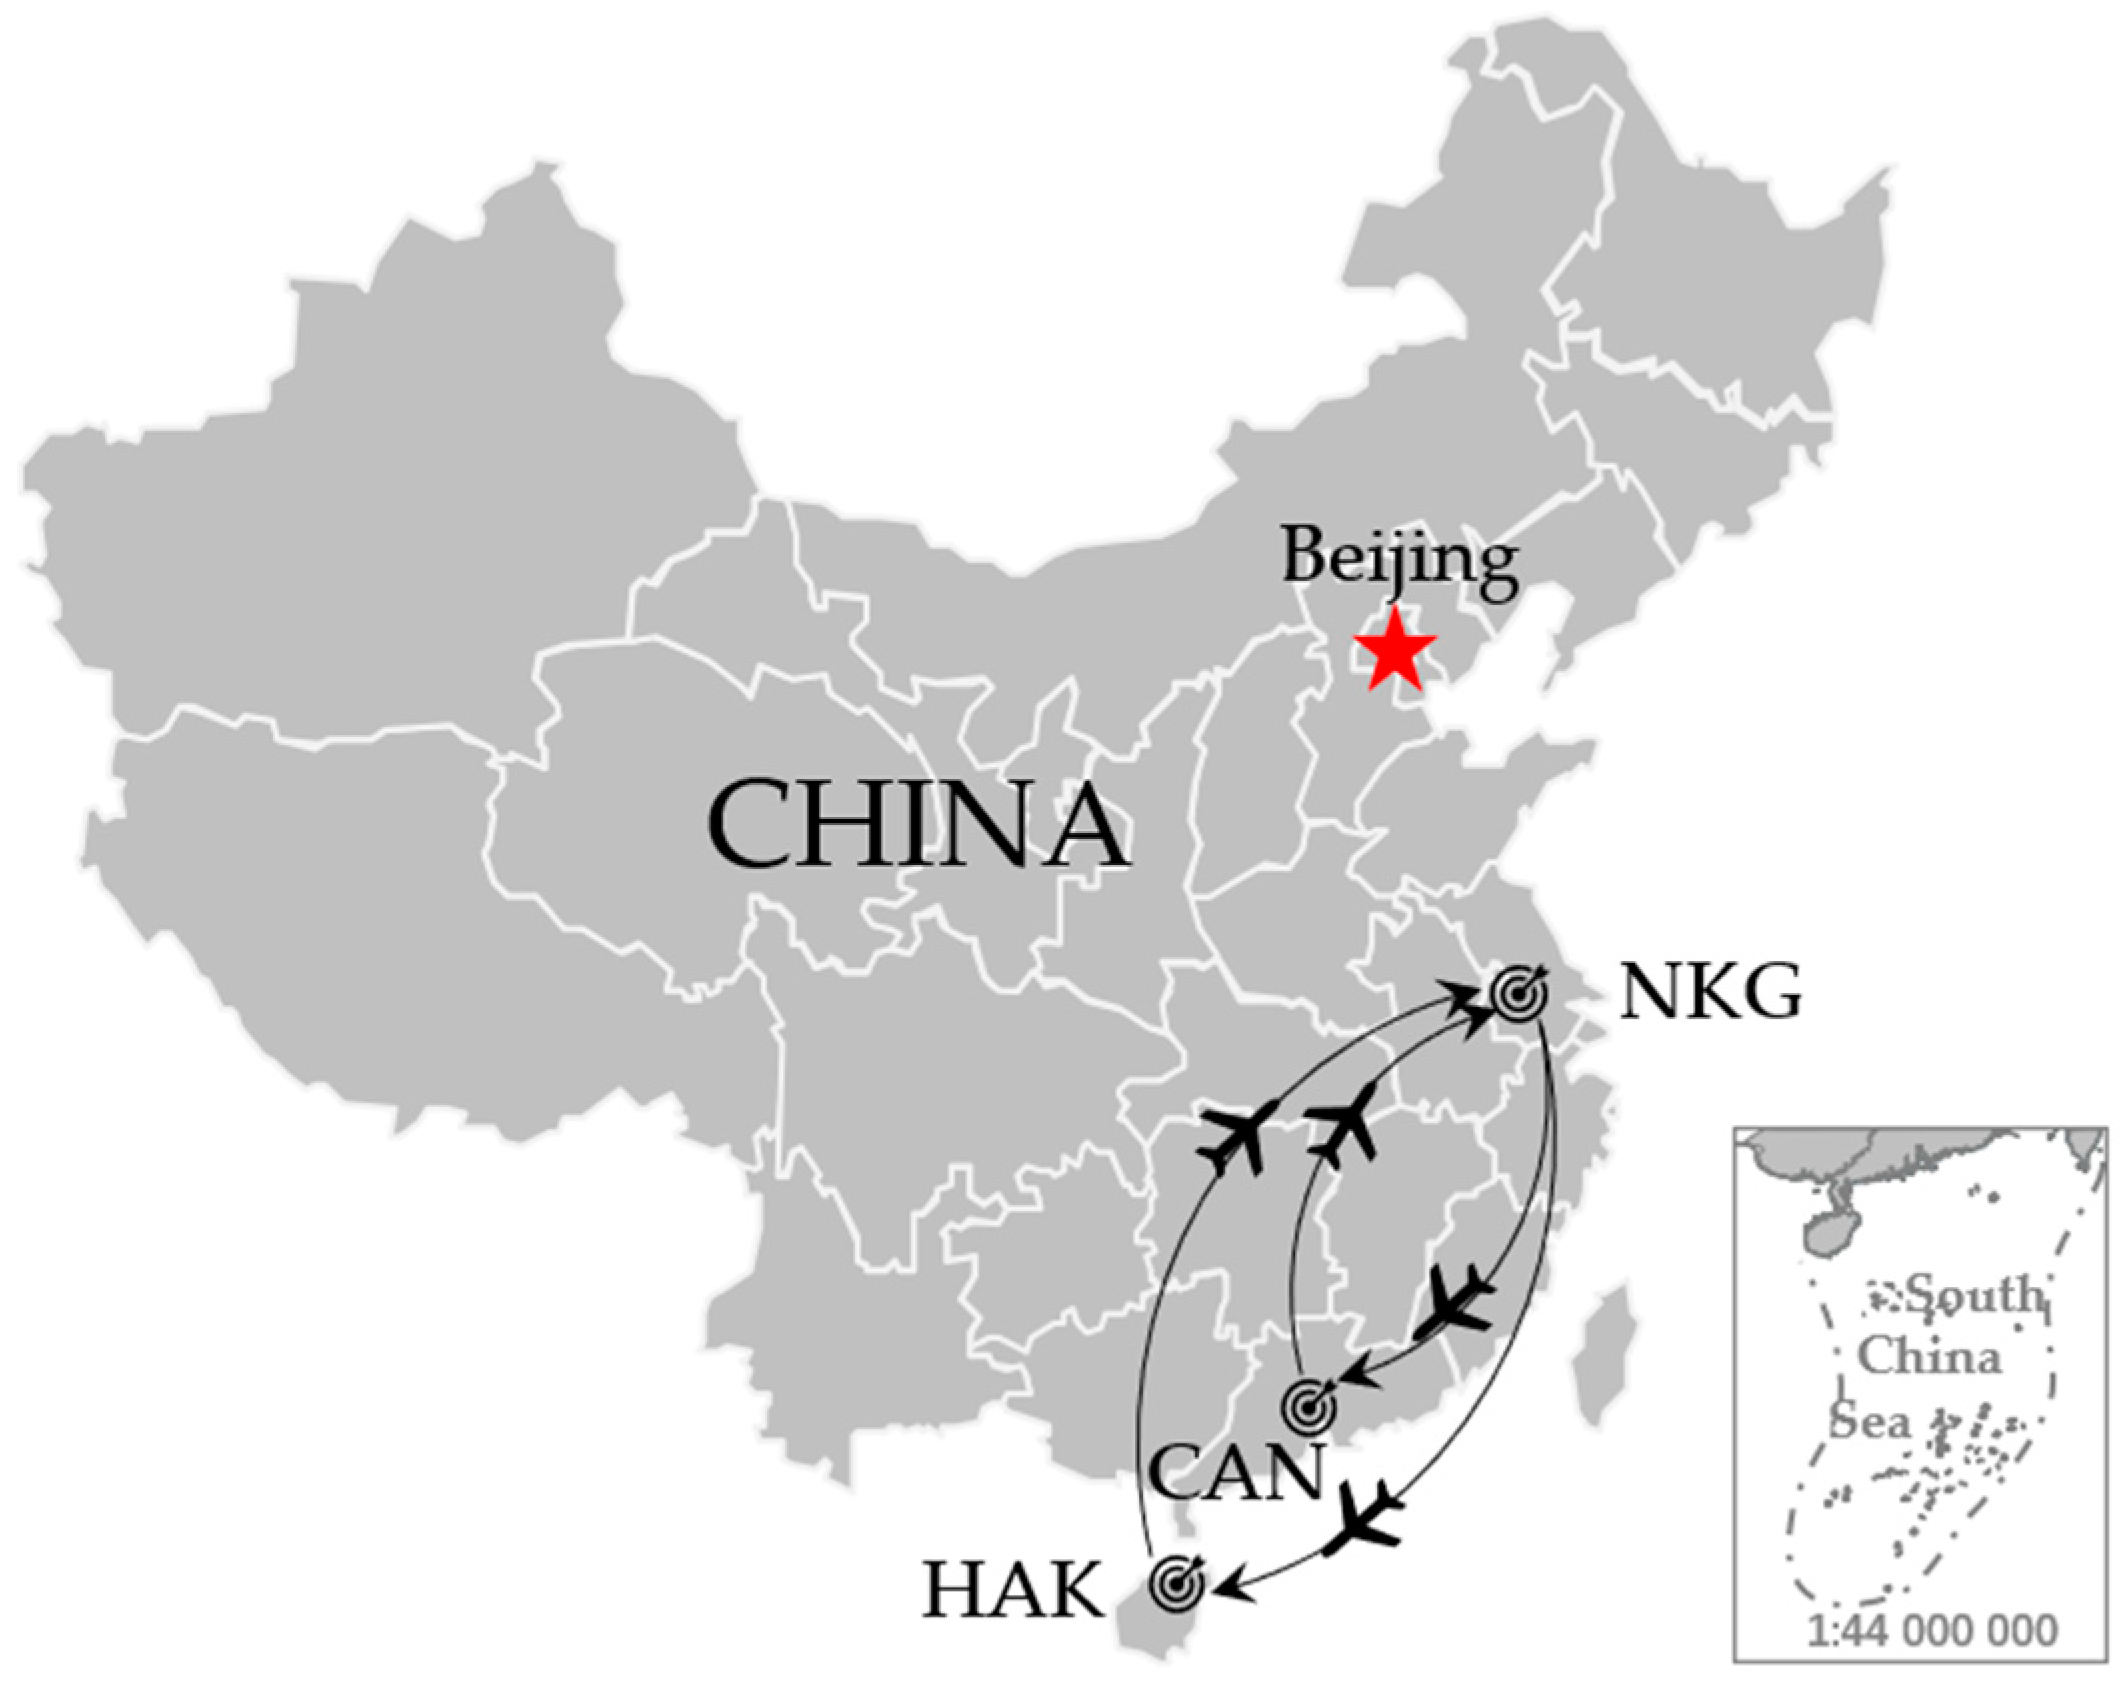
Figure 1. The tested round trips from Nanjing Lukou International Airport (NKG). The destinations are Guangzhou Baiyun International Airport (CAN) and Haikou Meilan International Airport (HAK).
Sustainability 13 07047 g001
Figure 2. The RH, temperature, and cabin pressure time series in E3 (a) and E4 (b).
Sustainability 13 07047 g002
Figure 3. Time series of the cabin pressure and CO2 in E3 (a) and E4 (b).
Sustainability 13 07047 g003
Figure 4. CO concentrations in E3 (a) and E4 (b1) same scale with (a); (b2) magnified scale.
Sustainability 13 07047 g004
Figure 5. The PM mass concentration time series in aircraft cabins (Grid symbols indicate the time of severe turbulence) ((a): E1; (b): E2; (c): E3; (d): E4).
Sustainability 13 07047 g005
Figure 6. The boxplot of PM mass concentration divided by flight phases ((a): E1; (b): E2 + E3; (c): E4). Boxes indicate 25% and 75%, whiskers indicate 10% and 90%.
Sustainability 13 07047 g006
Figure 7. The PM mass concentration instant changes at NKG when the cabin doors open or close in E1 and E4.
Sustainability 13 07047 g007
Table 1. Information about the tested flights.
IDFlightDateAircraft TypeAircraft
Age (Year)
Flight Duration
(min)
Passengers
Onboard
Total SeatsSampling LocationParameters Collected
E1NKG→CAN18 April 2019Airbus 31913.213512812819FPM
E2CAN→NKG20 April 2019Airbus 3210.713519519531BPM
E3NKG→HAK27 April 2019Airbus 3205.917517417424EPM, CO2, CO, P, T, RH
E4HAK→NKG28 April 2019Airbus 3203.617015815820EPM, CO2, CO, P, T, RH
Table 2. Instrument Information.
InstrumentParameters CollectedUnitIntervalRangeAccuracy
PMS Model 3003PM1/PM2.5/PM10μg m−31 s0~1000 μg m−3±10% @ 100~500 μg m−3
±10 μg m−3 @ 0~100 μg m−3
Q-Trak indoor air quality monitor 7575CO2ppm1 s0~5000 ppm±50 ppm
COppm1 s0~500 ppm±3 ppm
PhPa1 s689.5~1241.1 hPa±2% of Reading
RH%1 s5~95% RH±3% RH
T°C1 s0~60 °C±0.5 °C
Table 3. Statistics of temperature, RH, and cabin pressure in E3 and E4.
IDSample Size (N)T (°C)RH (%)P (hPa)
Mean ± SD
(min, max)
Mean ± SD
(min, max)
Mean ± SD
(min, max)
E319627.5 ± 0.4
(26.2, 28.1)
29.7 ± 15.3
(14.0, 66.4)
910 ± 91
(796, 1021)
E417927.2 ± 1.2
(21.0, 28.1)
33.6 ± 17.5
(13.8, 67.0)
938 ± 64
(839, 1019)
Table 4. Summary of in-cabin CO and CO2 concentrations in measured flights.
IDSample Size
(N)
CO (ppm)CO2 (ppm)
Mean ± SD
(min, max)
Mean ± SD
(min, max)
E31960.12 ± 0.26
(0.00, 1.18)
1557 ± 117
(1304, 2135)
E41790.01 ± 0.02
(0.00, 0.12)
1323 ± 104
(1069, 1861)
Table 5. Summary of in-cabin PM mass concentrations in measured flights.
IDSample Size (N)PM1 (μg m−3)PM2.5 (μg m−3)PM10 (μg m−3)
Mean ± SD
(min, max)
Mean ± SD
(min, max)
Mean ± SD
(min, max)
E12131.42 ± 1.81
(0.00, 9.31)
2.66 ± 2.90
(0.00, 12.37)
3.19 ± 3.34
(0.00, 15.36)
E21610.21 ± 0.62
(0.00, 3.20)
0.44 ± 0.97
(0.00, 4.83)
0.62 ± 1.18
(0.00, 5.71)
E31960.19 ± 0.53
(0.00, 2.89)
0.38 ± 0.92
(0.00, 4.89)
0.48 ± 1.08
(0.00, 5.29)
E41790.04 ± 0.16
(0.00, 1.17)
0.15 ± 0.37
(0.00, 1.83)
0.26 ± 0.51
(0.00, 2.43)
Publisher’s Note: MDPI stays neutral with regard to jurisdictional claims in published maps and institutional affiliations.

