Article

The Monitoring of Selected Heavy Metals Content and Bioavailability in the Soil-Plant System and Its Impact on Sustainability in Agribusiness Food Chains

by
Melánia Feszterová
1,*,
Lýdia Porubcová
1 and
Anna Tirpáková
1,2
1
Faculty of Natural Science, Constantine the Philosopher University in Nitra, Tr. A. Hlinku 1, 94901 Nitra, Slovakia
2
Department of School Education, Faculty of Humanities, Tomas Bata University in Zlín, Štefáníkova 5670, 76001 Zlín, Czech Republic
*
Author to whom correspondence should be addressed.
Sustainability 2021, 13(13), 7021; https://doi.org/10.3390/su13137021
Submission received: 11 May 2021 / Revised: 18 June 2021 / Accepted: 20 June 2021 / Published: 22 June 2021

Abstract

:
This study assisted in identifying and preventing the increase in heavy metals in soil and winter wheat. Its accumulation can affect cultivated crops, quality and crop yields, and consumers’ health. Selected heavy metals were analyzed using the GTAAS method. They were undertaken on selected heavy metals content (Cd, Cu, Pb, and Zn) in arable soils at three sites in Slovakia and their accumulation in parts of cultivated winter wheat. Our study showed that the limit value of Cd in soil samples was exceeded in the monitored arable soils from 2017–2019. The average content values of Cu and Zn did not exceed the limit values, even in Pb values (except for the spring period). The analyses also showed that the heavy metals content for plants bioavailable in soil did not exceed the statutory critical values for Cd, Cu, and Zn’s average content values. However, Pb content exceeded permitted critical values. Heavy metals bioaccumulation (Zn, Cu) was within the limit values in wheat. Analyzed Cd content in wheat roots and Pb content were determined in all parts of wheat except grain. The study showed that grain from cultivated winter wheat in monitored arable soils is not a risk for consumers.

1. Introduction

According to the European Union Agency for the Protection of the Environment, heavy metals are one of the primary pollutants in soil and are being considered a severe environmental issue [1,2]. Soil quality is crucial for crop production (it determines the possible composition of food and supported nutrient intake through the root system), human health [3,4,5,6,7,8], and the sustainability of ecosystems [2]. Interest in local organic food has increased in developed countries. Therefore, it is crucial to be aware of the spatial distribution and concentrations of toxic and potentially toxic elements in soils [9,10,11,12,13,14] and their transport to plants [15,16,17,18].
Although much progress has been achieved in understanding the links between soil and human health, we still do not have much knowledge about the complex interactions between them. Therefore, research in this area is still needed [2].

1.1. Heavy Metals in Soil–Plant Systems

Factors affecting the process of soil contamination and thus sustainable agriculture are, for example: human activity, the organic carbon content in the soil, pH, available phosphorus, soil structure, and the capacity of exchangeable cations [19,20,21,22,23]. Soil contamination can damage and cause deterioration of water quality and have a negative impact on the environment [24,25,26]. Many studies have found that land-use change [27], cultivated plants, surrounding transport networks and hydrology of the territory [28,29], diversity of land use [30], and different ways of maintaining the soil are related to soil contamination [27,28,29,30,31,32,33].
Although plants need some heavy metals (e.g., Cu and Zn) for their growth and development, excessive amounts of these elements can be toxic for them [34]. Excessive concentrations of certain heavy metals (e.g., Cu and Zn) that contaminate the soil usually reduce plant growth and the soil’s biological activity, ultimately leading to the loss of organic elements in the soil [35,36]. Functional groups of organic substances (alcohols, phenols, carbonyl groups, and carboxyl groups) can dissociate their hydrogen ions and separate metal cations by chelation [37,38]. If the organic elements added to the soil remain stable, the chelated metals will remain immobilized in the soil. However, organic acids, able to form soluble complexes with heavy metals, could increase the mobility of these heavy metals [39]. Changes within the soil can have different effects on metal mobility and bioavailability for plants [40,41,42,43].
Heavy metals such as Cd, Pb, Hg, and As are globally dangerous environmental contaminants [44,45]. Their effect on plants causes typical signs of toxicity and an overall decrease in biomass with a potential reduction in yields [46]. The plant fights against the toxicity of heavy metals by activating enzymes eliminating reactive oxygen species [47], and by accumulating compounds that increase the chelation or sequestration of heavy metals [48]. As reported by Chandrasekaran et al., the toxicity and mobility of heavy metals in the soil ecosystem depends on factors such as the total concentration of heavy metals, the specific chemical form, and the binding status of the elements and its properties [49]. Identifying the relationships between soil properties and plant absorption regarding heavy metals can be used as a basis for setting soil guideline values to ensure the protection of human health from crop consumption, and to promote compliance with food standards [9,50] and sustainable agriculture.

1.2. Chemical and Toxicological Aproperties of Selected Contaminants

Cadmium belongs to the group of cumulative metals and, if the concentration is exceeded, it has a toxic effect on both plant and animal organisms [46,51]. Cd in agricultural soils can be transferred to crops very easily which creates a potential health risk to consumers [9]. Concerning plant foods, the highest concentrations are present in cereals (e.g., wheat—especially whole grains) and rice, leafy vegetables, potatoes, and root vegetables [52,53]. Cadmium is a potentially toxic risk element, as it naturally occurs as an impurity in many phosphate fertilizers [9,45,54].
Copper is one of the essential trace elements for plant and animal organisms and plays a role in basic physiological processes [46,55]. This metal can accumulate in the soil due to human activity [56]. While an excess of copper inhibits plant growth and impairs critical cellular processes [57], it acts as both an antioxidant and a prooxidant [58].
Lead enters the soil via anthropogenic sources (leaded petrol, lead-based paint, lead mining and smelting, and other industrial activities) [59]. Therefore, soil is consequently one of the largest contaminants [59,60]. Lead is a bioaccumulative toxic element, which does not degrade in the environment. Plants take up Pb only in minimal amounts and it is stored mainly in their roots [61]. Pb has a phytotoxic effect only at very high concentrations (from 100 ppm to 500 ppm) [60,62]. Due to the toxicity of lead (Pb) compounds, its intake from food is one of the riskiest [46,63]. The most common source of Pb exposure for humans is the ingestion of contaminated food and drinking water [46,63,64,65].
Higher concentrations of nutrients such as Fe and Zn present in foods can harm the human body [11,66]. Zinc in the optimal concentration interval is one of the essential elements for plant and animal organisms [46]. The primary source of Zn in the soil is geo-logical material [67,68]. Contamination by zinc can be affected by surface horizons (fertilizer addition) [69] and soil unit. In addition to its existence as a free element or chelate complex in soil solution, Zn can be adsorbed on the surface of solid particles [70].
Many studies have shown the differing nature of the composition of plant pollution by risk elements in soils, including their transition from soil to plants [1,6,11,17,20,43,63,68]. However, only a few studies have analyzed soil units and heavy metal mobility in them. Moreover, very few researchers have explored the combined effect of mobility of heavy elements in soil units in the agricultural literature and compared their transition in selected parts of the plants. Therefore, our study’s originality is in that it shows the mobility of heavy metals in soil units and their transition to cultivated plants.
This study aim was to analyze the content of selected heavy metals (Cd, Cu, Pb, Zn) in agricultural land in three selected localities in Slovakia (the cadastre of the municipality of Zlaté Moravce, Nitra region). The achieved results were compared in the years 2017–2019 in different periods (spring and autumn) in selected soil sampling depths. Analyzed soil samples from selected localities (Localities I–III) represent soil units in which correlations between heavy metal contents (Cd, Cu, Pb, Zn) were analyzed. The values of selected factors (pH and TOC) and their influence on the mobility of heavy metals in the soil in two seasons and three selected localities were monitored. In the agricultural land–plants system, the determined heavy metals affect the cultivated crop. The content of heavy metals in plant samples (root, stem, leaves, and grain) of winter wheat can cause hygienic defects. Therefore, we investigated the transfer of selected heavy metals to individual parts of the cultivated crop (winter wheat), focusing on sustainable agriculture and the quality of cultivated plants.

2. Materials and Methods
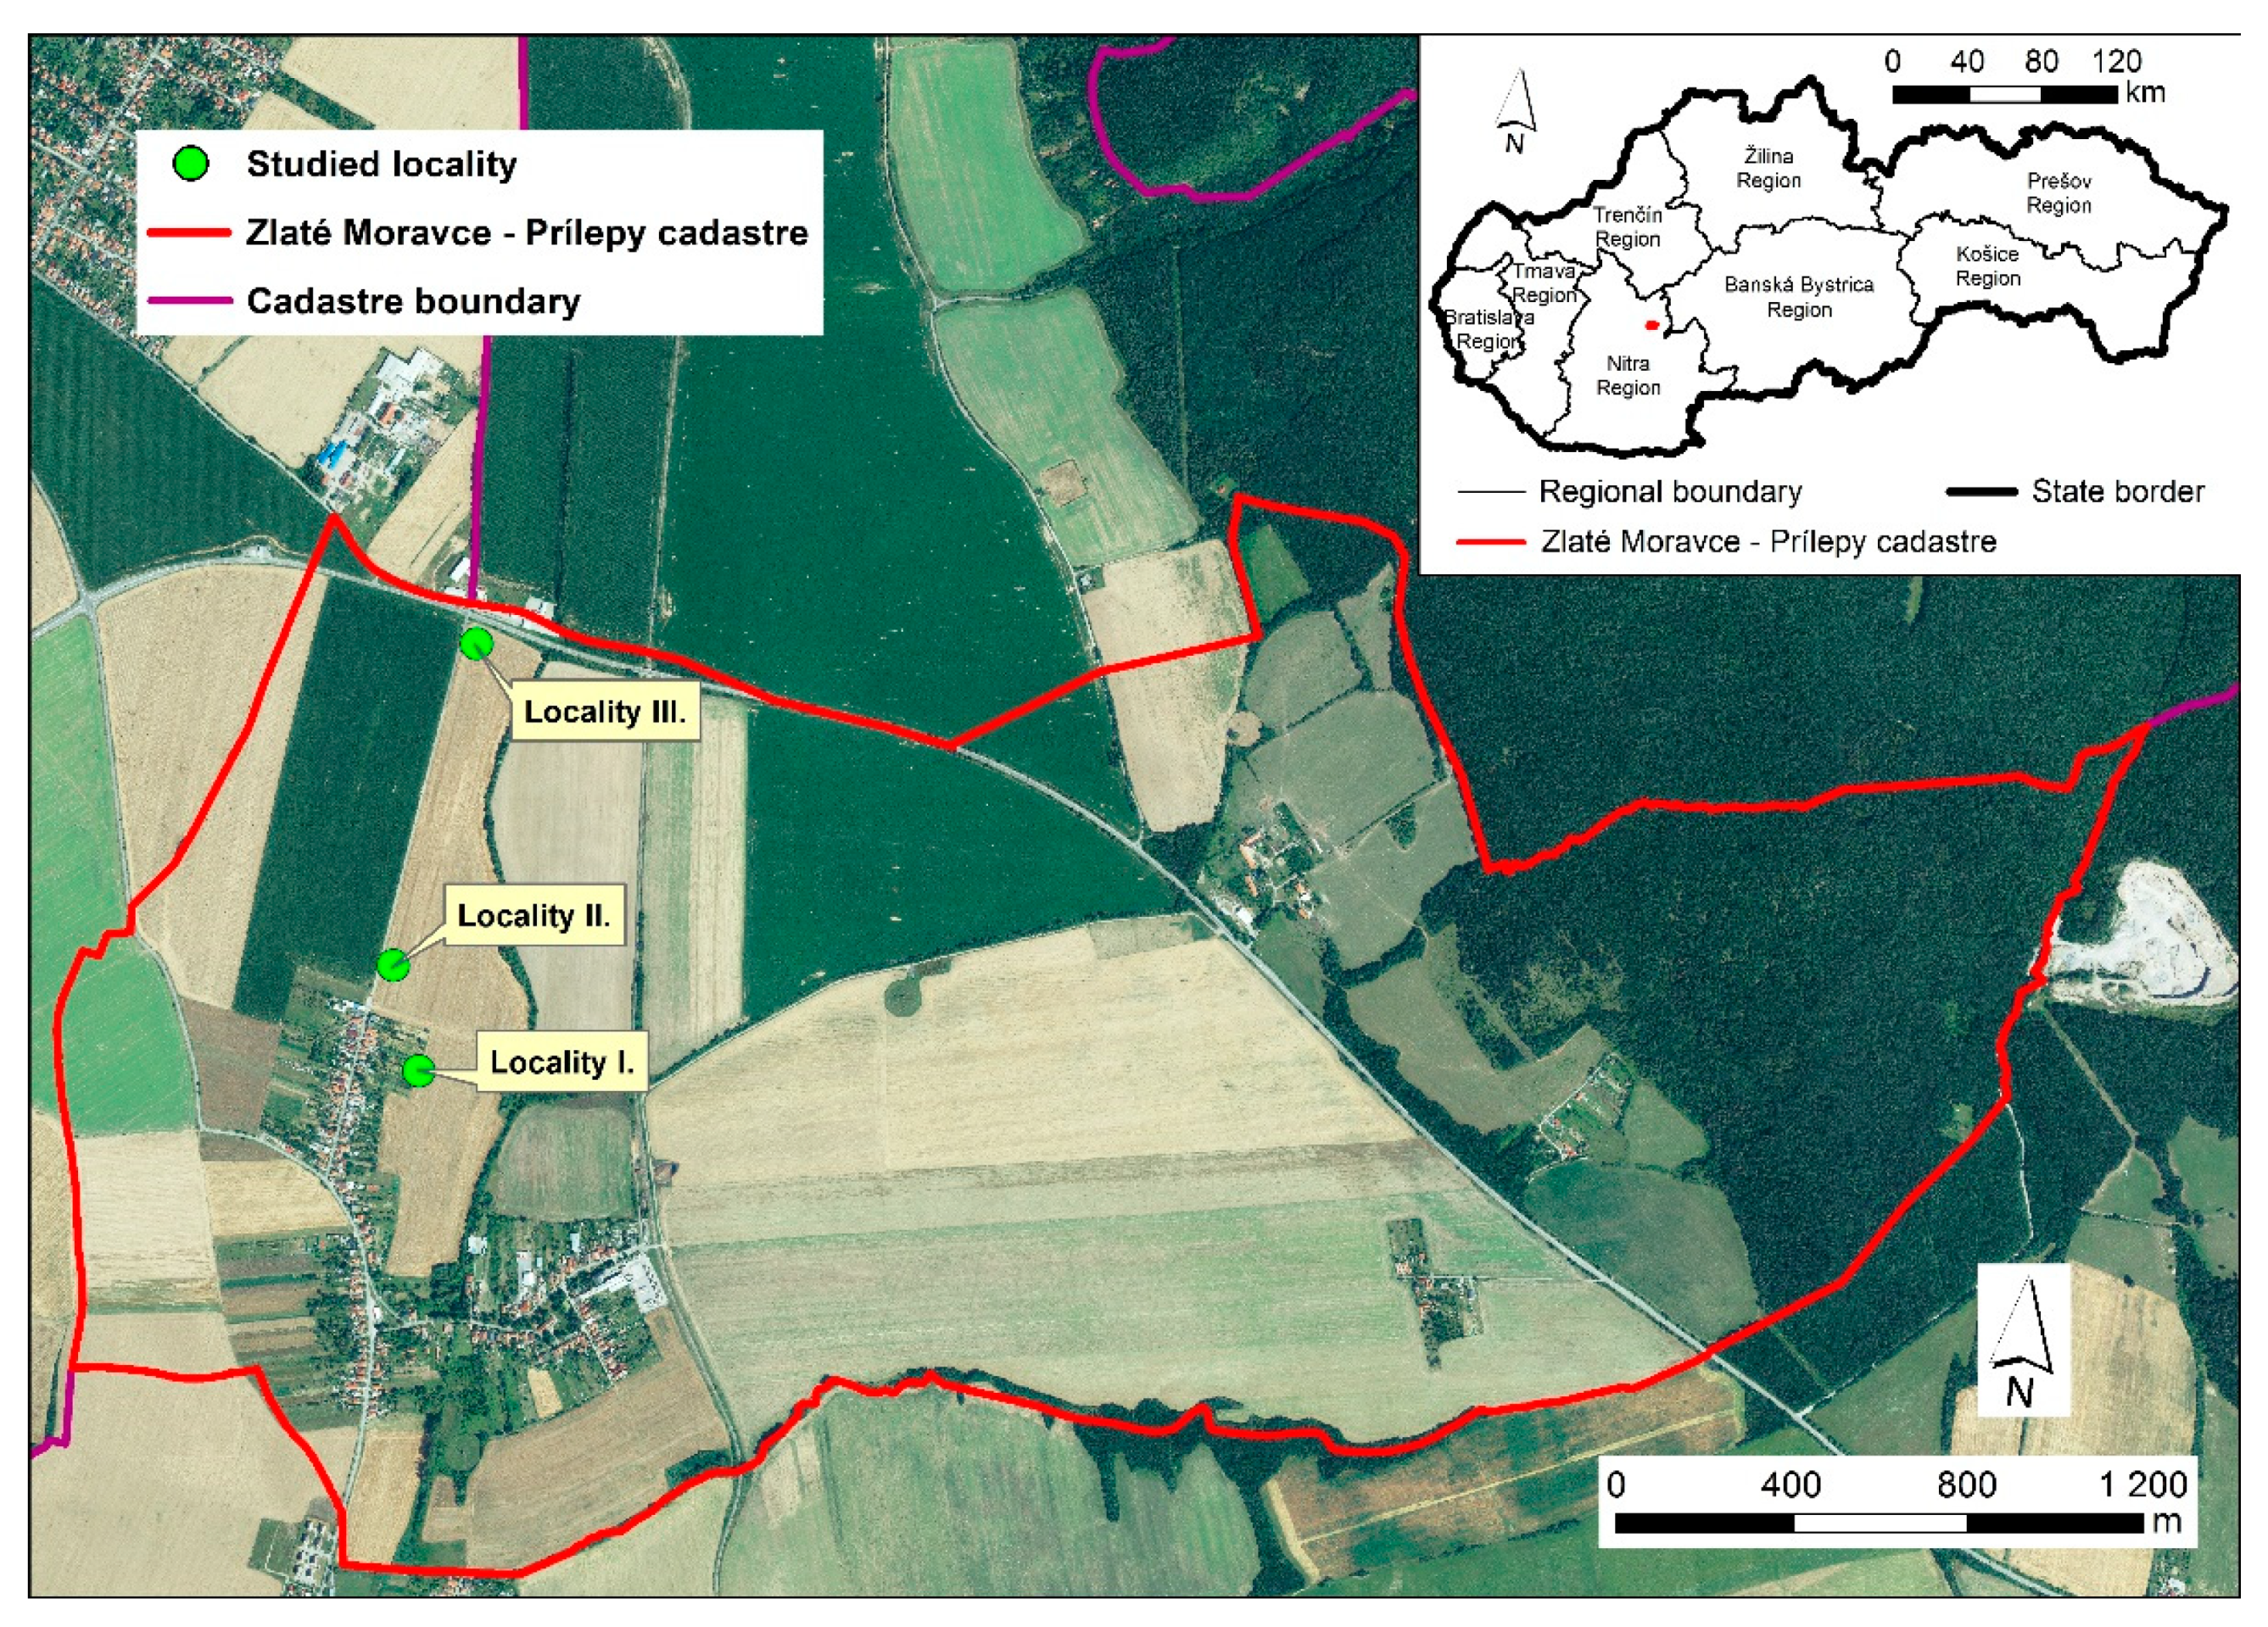
2.1. Study Area

The measurements were carried out at 3 different sites (Localities I–III) to 5 depths (Table 1), in the Zlaté Moravce district (the Nitra region, the southwestern part of Slovakia) in the northwestern part of the Hronská Hills (Figure 1). We focused on sites within one district (Zlaté Moravce) to show the differences in heavy metal content and monitored parameters of arable soil.
Locality I corresponded to arable soil borders in the east with a small wood and in the west it borders the suburb of Zlaté Moravce-Prílepy. Locality II is located north-northeast of the suburb of Zlaté Moravce-Prílepy. The arable soil examined from Locality III was adjacent to the 1st class road no. 65.
Most of the Zlaté Moravce (Zlate Moraveths) cadastre is on the Danubian Upland but its eastern part lies in Pohronský Inovec (Pohrone Inoveth) [72], in the valley of the Žitava River (Zhitava) on the border of western and central Slovakia [73]. It is located in the lowlands (170–300 m above sea level) [72].
Young tertiary clays, siltstones, and gravelly formations with artesian water horizons form a flat piece of land and spread to the hilly area on the Pohronská and Žitavská hill (pahorkatina) and the slopes of Pohronský Inovec. Of the pedological conditions, on the surface, there were Quaternary loess, clays, and river sediments (leached brown soils and alluvial soils) [73]. On the loess of the hills were brown soils along with the Žitava River alluvial soils of Fluvisols. Brown forest soils of Cambisols predominate in Tribeč and Pohronský Inovec [73]. The floodplains were covered with modal to gley Fluvisols. These soils are deep, medium-heavy (loam) to heavy (clay-loam) soils. The agricultural area was dominated by high-quality deep clay brown soils and Luvisols, modal to Pseudogley. The most widespread soils in the foothills to mountainous areas were modal, Pseudogley, and Luvisol Cambisols. Soil types and subtypes of two soil groups predominate in the area, namely groups of leached soils and groups of brown soils: Brown soil (B), Luvisol (LV), and Cambisol (CM) [74].
The Zlaté Moravce district’s climatic characteristic belonged to the European-continental climate area of the temperate zone with ocean air, which is transformed into continental. The Zlaté Moravce region is one of the warmest regions in Slovakia [72]. The lowland part belongs to the warm part; the mountains to the moderately warm climatic region [73]. The flow of air masses is conditioned by the area’s morphology, with prevailing east and northwest winds. Average temperatures in the monitored areas ranged from −6.4 °C to 23.1 °C.

Monitored Sites (Localities I–III)-Arable Lands for Cultivating Cereals

Fertilization via 200 kg·ha−1 NPK (a purely natural organic fertilizer which contains N 5%, P 2%, K 8%), sowing, 200 kg·ha−1 LAV (NH4NO3 with limestone, pure content of N is 27%), 200 kg·ha−1 LAV, and 120 kg·ha−1 LAV, was applied along with the fungicide Hutton to the monitored arable lands (Localities I–III) before the cultivation of wheat durum (Triticum durum) (autumn 2016/spring 2017). After machine harvesting, the crushed straw was incorporated into the soil.
Canola oil (Brassica napus L.) was grown at Locality I (autumn 2017/spring 2018), sowing, 200 kg·ha−1 NPK, herbicide Butisan 400 SC, fungicide Albukol, in spring, 200 kg·ha−1 DAM (DAM = liquid nitrogen fertilizer), 180 kg·ha−1 LAV, 100 kg·ha−1 DAM 390 (DAM 390 = liquid nitrogen fertilizer contains 30% nitrogen) and boron 1 kg, fungicide Pictor, Boscalid, 2x insecticide Decis ew 50, and insecticide Nurelle D.
Within Locality II and Locality III (autumn 2017/spring 2018), after ploughing 200 kg·ha−1 NPK, sowing wheat durum (Triticum durum), 200 kg·ha−1 LAV, 200 kg·ha1 LAV, 120 kg·ha−1 LAV, the Hutton fungicide was applied. After machine harvesting, the crushed straw was incorporated into the soil.
After ploughing, 180 kg·ha−1 NPK, the sowing of wheat (Triticum aestivum L.) (autumn 2018/spring 2019), 150 kg·ha−1 LAV, 200 kg·ha−1 LAV, 200 kg·ha−1 LAV, the Hutton fungicide, Tebuconzole, and insecticide Markate 50 were applied. After mechanical harvesting, the straw was incorporated into the soil. At the end of the summer, and at the beginning of autumn 2018, Localities I–III, the sowing of Canola oil (Brassica napus L.) took place, utilizing 200 kg·ha−1 NPK fertilizer.

2.2. Equipment and Analytical Procedure

The heavy metal analysis included a series of measurements carried out from spring 2017–autumn 2019. During this period, 240 soil samples were taken from 3 selected localities (soil units), which were used as arable land (Localities I–III). Soil samples were taken from 5 depths (from 0.0 m to 0.5 m). The analysis of all soil samples, e.g., pH (pH(H2O, pH(KCl)) and TOC were repeated three times. From the analyzed soil samples, we obtained the total content of heavy metals (Cd, Cu, Pb, and Zn) and the values of heavy metal content to the bioavailability of plants, which we evaluated based on permitted limit values. The contents of selected heavy metals (Cd, Cu, Pb, and Zn) were analyzed in various parts of the plants’ material. The transition of heavy metals into the soil–plant system was monitored in durum wheat (Triticum durum) (for analyses, the following were examined: root, stalk, leaf, and grain from Localities I–III).
According to the Decree of the Ministry of Labour, Social Affairs and Family of the Slovak Republic No. 59/2013 Coll. and subsequent amendments for contamination detection, at least one average sample was taken from every area of 10 ha (at least 9 sampling points/places) with homogeneous soil in the area under examination [75]. For heterogeneous soil in the mentioned area, average samples were taken from each part. For analytical determination of heavy metal limit values, we used air-dried soil samples, sieved to fine soil with a particle size below 2 mm. First, the soil samples were analyzed in an aqua regia solution. The results were analyzed in accordance with the Decree of the Ministry of Agriculture and Rural Development of the Slovak Republic No. 508/2004 Coll. and with an amendment of certain acts [76].
In accordance with van Reeuwijk, we analyzed pH values in soil samples (water to soil = 2.5:1, v:m) [77]. We determined an active soil reaction (pH(H2O)) in distilled water and an exchange soil reaction (pHKCl) in a solution of 1 mol·dm−3 KCl (Centralchem, Ltd.; Bratislava, Slovakia). The solution was mixed. The suspension was shaken in a Unimax 2010 horizontal shaker (Heidolph Instrument, GmbH, Schwabach, Germany) for 20 min. After shaking, the samples were filtered through filter paper Filtrak 390 (Munktell & Filtrak, GmbH, Bärenstein, Germany) and measured by a pH meter (inoLab Multi 9310 SET I; Labo SK, Ltd., Bratislava, Slovakia). In all experiments, the chemical reagents (ACS grade) were dissolved using distilled and deionized (DDI) water produced using a MilliporeSigma™ Synergy™ Ultrapure Water Purification System (Meck Millipore, Bedford, MA, USA).
According to the Tjurin method modified by Nikitina, we determined the total organic carbon content (TOC) in soil samples and the various separated fractions [78]. From the equation DH = CHA/TOC.100 [%], we calculated the humification degree of humified substances [79].
For the determination of metal content (Cd, Pb, Cu, and Zn), we used atomic absorption spectroscopy (GT AAS; Agilent Technologies, GTA 120 Graphite Tube Atomizer, Hermes LabSystems, Ltd.; Bratislava, Slovakia). Soil samples were measured in duplicate in a Graphite Atomic Absorption Spectrophotometer for Cd, Cu, Pb, and Zn quantification. Compound samples were mineralized before analysis (Ethos One; Chromspec Slovakia, Ltd., Šaľa, Slovakia). Soil samples were mineralized in aqua regia (HCl = 37%; HNO3 p.a. ≥ 65%; chemicals from Sigma Aldrich, Ltd.; Bratislava, Slovakia) for determining the content of risk elements. Soil samples were extracted in NH4NO3 for the contents of bioavailable forms of heavy metals.
In plant samples (leaf, root, and stalk of wheat winter grain), heavy metals (Cd, Pb, Cu, and Zn) were measured in duplicate by the GT AAS method [80]. The plant parts were dried at room temperature, mineralized in an extract of HNO3 and H2O2 (HNO3 ≥ 65%; 67%; H2O2 ≥ 30%; from Sigma Aldrich, Ltd., Bratislava, Slovakia). We used the leaching method with 1 mol·dm−3 NH4NO3 (NH4NO3 ≥ 98%; Sigma Aldrich, Ltd.; Bratislava, Slovakia) to determine the selected risk elements’ content (Cd, Cu, Pb, Zn) accessible to plants.

2.3. Statistical Analysis

As previously mentioned, the measured values obtained from soil samples were analyzed using selected statistical methods. Specifically, to verify the normality of the sample distribution, the Shapiro–Wilk test was chosen. We used the Wilcoxon two-sample test to confirm the statistical significance of the differences between the sampling periods (spring and autumn). In the following analysis, we used the Kruskal–Wallis test. To calculate the degree of interdependence between the observed variables, the Spearman’s rank correlation coefficient was applied [81]. We performed the calculations in the STATISTICA program 9.0 Standard Plus CZ (StatSoft Inc., Tulsa, OK, USA).
The null hypothesis H0 was tested against the alternative hypothesis: H1. The samples are not from the same population, i.e., there are significant differences between variables. The p-value expresses the probability of error if the null hypothesis is rejected in favor of the alternative hypothesis: H1. If this probability is smaller than 0.05 resp. 0.01, the tested hypothesis H0 is rejected at the significance level α = 0.05 resp. α = 0.01. Otherwise, we cannot reject the tested hypothesis H0.

3. Results

3.1. Heavy Metals in Soil Units of Localities I–III

At Localities I–III, soil samples were taken in two seasons (spring, autumn). As previously stated, we examined the content of heavy metals (Cd, Cu, Pb, and Zn) in the soil samples (Table 2, Table 3 and Table 4).
Based on the results (Table 2, Table 3 and Table 4), the limit value of cadmium (0.70 mg·kg−1) was exceeded in all three arable lands in the observed periods (spring and autumn) between 2017–2019. The Cd contamination in arable lands in springs 2017–2019 decreased as follows: Locality I (1.33 mg·kg−1; excess by 90%) > Locality III (1.31 mg·kg−1; excess by 87.1%) > Locality II (1.28 mg·kg−1; excess by 82.9%). The lowest Cd concentration during the observed spring periods was at Locality I (in 2017 depth 0.2–0.3 m and 2018 depth 0.3–0.4 m) and at Locality II (in 2019 depths 0.2–0.3 m and 0.4–0.5 m). Below limit, Cd concentrations were recorded at Locality I in 2018 (0.60 mg·kg−1, depth 0.4–0.5 m) and Locality II in 2019 (0.40 mg·kg−1, depth 0.3–0.4 m). The highest Cd concentration was found in spring 2019 at Locality I (2.40 mg·kg−1, depth 0.3–0.4 m).
Based on the average Cd values shown in Table 2, Table 3 and Table 4, it can be stated that in autumn periods, the Cd content in the examined arable lands decreased every year. The lowest Cd concentration during autumn periods was at Locality I in 2019 (0.40 mg·kg−1, depth 0.0–0.1 m); the highest Cd concentration was in 2017 (2.80 mg·kg−1). The limit Cd value was exceeded in all three observed arable lands in autumn (2017–2019). The average Cd content in autumn in all the observed years was the highest at Locality II (1.77 mg·kg−1; excess by 152.9%) > Locality III (1.76 mg·kg−1; excess by 151.4%) > Locality I (1.59 mg·kg−1; excess by 127.1%).
As the soil samples’ analyses indicated (Table 2, Table 3 and Table 4), they did not exceed the limit values of copper (60 mg·kg−1) and zinc (150 mg·kg−1) in any of the examined arable lands during any of the analyzed periods (spring and autumn) 2017–2019. The average Cu content at the localities decreased as follows: spring-Locality II (19.73 mg·kg−1) > Locality I (18.24 mg·kg−1) > Locality III (17.52 mg·kg−1); autumn-Locality II (20.33 mg·kg−1) > Locality I (19.76 mg·kg−1) > Locality III (18.44 mg·kg−1). The highest spring Cu concentration was recorded at Locality I (24.40 mg·kg−1, depth 0.4–0.5 m) in 2019, while the lowest spring Cu concentration was found at Locality III (12.60 mg·kg−1, depth 0.3–0.4 m) in 2019. The lowest autumn Cu concentration was in 2019 at Locality III (15.20 mg·kg−1, depth 0.4–0.5 m), while the highest autumn Cu concentration was 2017 at Locality I (25.00 mg·kg−1, depth 0.0–0.1 m).
The limit value of lead (70 mg·kg−1) was exceeded in spring samples 2017–2019, while in autumn samples, the limit value was not exceeded (Table 2, Table 3 and Table 4). The Pb limit value in spring samples was exceeded as follows: at Locality I (80.00 mg·kg−1, depth 0.3–0.4 m; 76.00 mg·kg−1, depth 0.4–0.5 m), in spring 2018 and 2019 (76.00 mg·kg−1, depth 0.2–0.3 m; 72.00 mg·kg−1, depth 0.3–0.4 m; 80.00 mg·kg−1, depth 0.4–0.5 m); at Localities II and III in all the examined depths in spring 2019. The spring average Pb content in 2017–2019 decreased in the observed arable lands: Locality II (60,13 mg·kg−1)> Locality I (60.00 mg·kg1) > Locality III (57.07 mg·kg−1). At Locality III, the spring average Pb content values decreased as follows: in 2019 (77.60 mg·kg−1; exceeding the limit value by 10.9%) > 2018 (52.00 mg·kg−1) > 2017 (41.60 mg·kg−1). The lowest spring Pb concentration was recorded in 2017 at Locality I (depth 0.0–0.1 m) and Locality III (36.00 mg·kg−1, depth 0.3–0.4 m). The highest spring Pb concentration was found in 2019 at Locality II (84.00 mg·kg−1, depth 0.1–0.2 m). Although the average values did not exceed the Pb limit value, in some autumn samples taken from various depths, the Pb contamination did exceed the limit value. At Locality III, in autumn samples, the average Pb content decreased as follows: 2018 (67.60 mg·kg−1) > 2019 (65.60 mg·kg−1) > 2017 (41.60 mg·kg−1). The highest autumn Pb contamination was found at Locality I in 2017 (84.00 mg·kg−1, depth 0.0–0.1 m; exceeding the limit value by 20%). The lowest autumn Pb contamination was recorded at Locality III (32.00 mg·kg−1, depth 0.2–0.3 m) in 2017. The average autumn Pb content in 2017–2019 decreased as follows: Locality II (61.07 mg·kg−1) > Locality III (58.27 mg·kg−1) > Locality I (55.87 mg·kg−1).
The lowest spring zinc concentration in the observed arable lands was found at Locality III (44.36 mg·kg−1, depth 0.3–0.4 m) in 2017. At Locality I, the highest spring Zn concentration (70.56 mg·kg−1, depth 0.4–0.5 m) was recorded in 2019. The highest spring average Zn content during 2017–2019 was at Locality II (60.10 mg·kg−1) > Locality I > (58.12 mg·kg−1) > Locality III (53.53 mg·kg−1). The highest autumn Zn concentration was re-corded at Locality I (87.90 mg·kg−1, depth 0.0–0.1 m) in 2017; the lowest autumn Zn concentration was at Locality III (33.84 mg·kg−1, depth 0.4–0.5 m) in 2019. The highest autumn average Zn content during 2017–2019 was at Locality II (60.75 mg·kg−1) > Locality III (55.54 mg·kg−1) > Locality II (54.32 mg·kg−1).

Correlations Analysis between Selected Heavy Metals Contents at Localities I–III

Using statistical methods, the correlations between the heavy metals’ contents (Cd, Cu, Pb, and Zn) at Localities I–III were studied. The calculated values of the correlation coefficients are summarized in Table 5.
Based on the results (Table 5) of the statistical analysis, it can be stated that there was a significant degree of correlation between the Zn and Cu contents (r = 0.5903) and between the Zn and Pb contents (r = 0.6613) in spring samples from Locality I. A high correlation degree (r = 0.8088) was recorded between the Cu and Pb contents. Based on the value of the correlation coefficient between Zn and Cd content, there was no significant correlation between them, and there were only a mild correlation degree between the other elements.
Between the Zn and Cu content in autumn samples from Locality I, the value of the correlation coefficient was r = 0.7037, which means that the correlation was high between the contents of the examined elements. Between the Zn and Pb content (r = 0.5885) and the Cu and Pb contents (r = 0.6697) the correlation degree was significant. The correlations between the contents of the other elements were none or only mild.
The correlation coefficient between the Zn and Cu contents in spring samples from Locality II was r = 0.9272, i.e., the correlation between the observed elements contents was very tight. Between the Zn and Cd contents (r = −0.5375), and between the Zn and Pb contents (r = 0.5655) the correlation was significant. In contrast, the correlations between the contents of the other examined elements were only mild.
Based on the calculated correlation coefficients, we argued that between the Cu and Cd contents (r = 0.5262) and between the Cd and Pb contents (r = −0.5971) in autumn samples from Locality II, there were significant correlations. The correlations between the contents of the other analyzed elements from this locality were none or only mild.
The value of the correlation coefficient between the Zn and Cu contents in the soil in spring samples from Locality III was r = 0.8704, which indicates a high correlation. Table 5 shows that, between the Zn and Pb contents, there was a significant degree of correlation (r = 0.5653). The correlations between the contents of the other analyzed elements were only mild or even non-existent.
Lastly, based on the calculated values of correlation coefficients summarized in Table 5, it can be stated that between the Zn and Cu contents (r = 0.8853) and between the Cd and Pb contents (r = −0.7186) in autumn samples from Locality III, there was a high degree of correlation. The value of the correlation coefficient between the Cu and Cd contents was r = −0.5501. In contrast, the correlation coefficient between the Cu and Pb contents was r = 0.5829, which indicates a significant degree of correlation. Based on the calculated correlation coefficients shown in Table 5, the correlations between the contents of Zn and Cd/Pb were only mild.

3.2. Influence of Selected Factors (pH and TOC) on the Mobility of Heavy Metals in Soil

The obtained results (Table 6, Table 7, Table 8, Table 9 and Table 10) were related to the influence of soil factors (pH and TOC) on the mobility of heavy metals at Localities I–III expressed through their correlations.

3.2.1. pH Values in Soil Units of Localities I–III

The average pH values of active and exchangeable soil reaction in the observed periods at Locality I ranged from neutral to acidic, at Locality II from neutral to mildly acidic, and at Locality III from mildly alkaline to neutral. The average values of active and exchangeable soil reaction in the observed periods are summarized in Table 6a,b.

3.2.2. Correlation Analysis between pH Values and Heavy Metal Contents

In our study, we analyzed the correlations between the concentrations of the heavy metals and the pH(H2O) values at the observed localities (Localities I–III) (Table 7).
The correlation coefficients were calculated between all the recorded pH values and the heavy metals concentrations in two seasons (spring and autumn) in 2017–2019. The rank correlation coefficient was also applied to calculate the degree of interdependence between the observed variables [81].
As Table 7 shows, the value of the correlation coefficient between the Zn content and pH(spring) at Locality I was r = 0.5594, which means that there was a significant degree of correlation between the observed variables. As indicated by the value of the correlation coefficient between the Cd content and pH(spring) (r = −0.7265), there was a high negative correlation between these variables. The values of correlation coefficients between the contents of other heavy metals in soil samples and the pH(H2O) values indicate that the degree of correlation was none or only mild between these variables.
Based on the calculated correlation coefficients, we argued that between the Zn content and pH(spring) (r = 0.6440), between the Cu content and pH(spring) (r = 0.5558), and between the Cu content and pH(autumn) (r = −0.6894) at Locality II there were significant correlations. A high correlation degree (r = 0.8420) was observed between the Pb content and pH(spring). The values of correlation coefficients between the contents of the other heavy metals and pH(H2O) suggest zero or only mild interdependence between the observed variables.
As indicated by the results in Table 7, there was a significant interdependence between the Pb content and pH(spring) (r = 0.6637), between the Cd content and pH(autumn) (r = −0.6234), and between the Pb content and pH(autumn) (r = 0.5633) at Locality III. There was no interdependence in the other cases of heavy metal contents and values of pH(H2O).

3.2.3. Analysis of Total Organic Carbon Content

In the arable lands (Localities I–III) where inorganic fertilizers were used before so-wing, regarding the crops´ requirements and ploughing in the residuals after harvest, the average values of total organic carbon (henceforth TOC) at Localities I and II were low. In contrast, at Locality III, the average TOC was medium (Table 8).
Based on the obtained data, the average TOC content in 2017–2019 was as follows: at Locality I the TOC decreased from medium to low; at Locality II the TOC content increased from low to medium; and at Locality III the TOC remained medium.

Analysis of Differences between Seasons in pH(H2O), pH(KCl) Values and TOC Content

As Table 8 shows, the average TOC values at the three localities vary throughout seasons. Our objective was to determine if the recorded data regarding pH(H2O), pH(KCl), and TOC in two seasons (spring and autumn) are statistically significantly different.
The results in Table 9 suggest that the recorded pH(H2O) values differ significantly in two seasons; in other words, two seasons differ significantly in pH(H2O) values. The differences between the values of the other examined variables (pH(KCI) and TOC) in two seasons are not statistically significant.

Analysis of Differences between Localities I–III in pH(H2O) and pH(KCl) Values and TOC Content in Soil

As the results shown in Table 6, Table 7, Table 8 and Table 9 indicate, between Localities I–III in the examined variables—recorded values of pH(H2O), pH(KCl), and TOC in the soil in two seasons (spring and autumn)—there are some differences. The multiple comparison results (p-values) for springs 2017–2019 are summarized in Table 10.
Based on the results shown in Table 10, it can be seen that in the springs of the examined years, Localities I and III differed significantly in the recorded pH(H2O) values. In the studied years’ springs, the localities’ average pH values were as follows: at Locality I pH = 6.47; at Locality II pH = 7.37; and at Locality III pH = 7.44 (Table 6a).
An analogous procedure was performed to verify the statistical significance of the differences between Localities I–III in recorded pH(KCI) values in the soil samples (Table 10). The statistical analysis proved that in the springs from 2017–2019, Locality III differed significantly from Locality I in pH(KCI) values. The average pH(KCI) values in the springs from 2017–2019 at the three localities were as follows: at Locality I pH(KCl) = 5.50; at Locality II pH(KCl) = 6.44; and at Locality III pH(KCl) = 6.72 (Table 6b).
The same statistical methods were applied to test the statistical significance of the differences in the TOC´s variable between the localities. Based on the Kruskal–Wallis test results, the TOC in the soil samples from the three examined localities in the springs from 2017–2019 are not significantly different.
Lastly, the Kruskal–Wallis test was applied to verify if the three localities (Localities I–III) differ significantly in three variables (pH(H2O), pH(KCl), and TOC values) in the autumns from 2017–2019. Based on the results summarized in Table 11, it can be seen that Localities I and III differed significantly in the recorded values of pH(H2O).
Therefore, pH(H2O) values recorded in the soil samples taken from the examined localities in the autumns from 2017–2019 are significantly different. The average pH(H2O) values in the localities during the periods in question were as follows: at Locality I pH(H2O) = 6.76; at Locality II pH(H2O) = 7.11; and at Locality III pH(H2O) = 7.35 (Table 6a).
As the results in Table 11 suggest, in the autumns from 2017–2019, Locality III differed significantly from Locality I in pH(KCI) values recorded in the soil samples. In other words, the recorded pH(KCI) values of the soil samples taken from Localities I and III in the autumns from 2017–2019 are significantly different. The average pH(KCI) values in the autumns from 2017–2019 at the three localities are as follows: at Locality I pH(KCl) = 5.4; at Locality II pH(KCl) = 5.95; and at Locality III pH(KCl) = 6.48 (Table 6b).
The same procedure was applied to test the statistical significance of the differences between the examined localities in the variable TOC recorded in the soil samples. The TOC values recorded in the soil samples taken from the localities in autumns 2017–2019 do not differ significantly.
It should be noted that the concentrations of the examined heavy metals (Cd, Cu, Pb, and Zn) in soil samples were evaluated in terms of the decree currently in force by the method of dissolution in aqua regia. The evaluation of the relation between the agricultural land and plants was also performed by means of NH4NO3 (c(NH4NO3) = 1 mol dm−3) leachate to make the analysis more complex (Table 12) [76].
The comparison of heavy metal contents (Cd, Cu, Pb, and Zn) in soil samples obtained using dissolution in aqua regia exceeded the limit value of Cd (0.70 mg·kg−1) in all three localities throughout the examined periods (spring and autumn, 2017–2019) (Table 2, Table 3 and Table 4). In NH4NO3 leach, Cd contents (0.10 mg·kg−1) did not exceed the critical value in any of the three localities (Table 12). The Pb contents (limit value Pb = 70 mg·kg−1) found in the soil samples by means of aqua regia dissolution in the springs from 2017–2019 were exceeded in Localities II and III in 2018 (Table 2, Table 3 and Table 4). Although in the autumn samples, the average Pb contents obtained with aqua regia dissolution did not exceed the limit values, in autumn samples taken from some depths, the concentration of Pb did exceed the limit values. In NH4NO3 leach, Pb contents (0.1 mg·kg−1) exceeded all three localities’ critical values (Table 12). Particular attention should be paid to Pb due to its determinative role in evaluating soil contamination and potential environmental hazard. Furthermore, Pb is not an essential element, it is more toxic to life forms, and can be easily absorbed by organisms.
Based on the results of the soil analyses done using aqua regia dissolution (Table 2, Table 3 and Table 4), we can conclude that the limit values of copper (60 mg·kg−1) and zinc (150 mg·kg−1) in the examined arable lands did not exceed limits in any of the studied periods (spring and autumn) 2017–2019. In NH4NO3 leach, Cu and Zn contents did not exceed the critical values (Cu = 1.0 mg·kg−1, Zn = 2.0 mg·kg−1) (Table 12). The comparison of results shows that the excessive concentrations of the given elements concerning the limit and critical values are identical. Soil samples analyzed in NH4NO3 leach, and their comparison with critical values, are essential in evaluating agricultural land and plants’ relation. Industrialization and urbanization increase soil contamination, resulting in harmful environmental safety effects, including plants.
As Table 13 suggests, the average contents of Zn, Cd, and Cu in the examined years 2017–2019 did not exceed the critical values [75] in the studied localities where analyzed plant material was obtained. An exception was the values of Pb, which exceeded the allowed critical value at all three localities throughout the examined years. The heavy metals were analyzed in various plant parts of winter wheat (root, stalk, leaf, and kernel). The contents of heavy metals in the plant parts are summarized in Table 13.
An increase in heavy metal content in plants may cause their hygienic defects. According to the Decree of the Ministry of Agriculture and Rural Development and the Ministry of Health of the Slovak Republic No. 14300/2007-OL, through which the title of the Foodstuff Code of the Slovak Republic is issued, stating the limits for contaminants in foodstuff, the maximum permissible Cd content in kernels (MAA = Maximum Allowable Amount; MAA Cd = 0.2 mg kg−1 for wheat) was not exceeded in the analyzed parts of plants grown in Localities I–III [82,83]. Nor was the maximum permissible Pb content in kernels (MAA Pb = 0.2 mg kg−1 for grain) exceeded from the examined localities.
A rather complex issue is the bioavailability of elements in terms of the interactions between agricultural land and plants. The evaluation of bioaccumulation of elements from the geological environment in the food chain is based on the analysis of the translocation of potentially toxic elements from soil to specific, locally grown plant products, e.g., cereals [84]. The relative bioavailability is expressed through the bioaccumulation coefficient (BAC). Its calculation is based on the element’s content in a plant in proportion to the element’s total content in the soil. The bioaccumulation measure of potentially toxic elements in plants is evaluated based on BAC values in terms of the classification suggested by Selinus et al. [85]. The average BAC values (BAC = the element’s content in a plant/the element’s total content in the soil) in the examined years 2017–2019 are summarized in Table 14.

4. Discussion

Based on the researched results and analyses of the measured values of heavy metals in arable soils (Table 2, Table 3 and Table 4) at the monitored localities in the surface layer, we conclude that the content values of Cu and Zn did not exceed the limit values in any of the monitored periods. Zn’s average contents did not reach even 50% of the permitted limit value in arable soils. When comparing these results with the study of Wang et al. [86], we conclude that these two heavy metals (Cu and Zn) are not identical in this study. The results of Wang et al. [86] accord with our findings—they exceeded the limit content value of Pb in the surface layer in 2019 at Localities II -III. They are also identical with the exceeded Cd limit values in the surface layer in all monitored arable soils (except autumn 2019 at Locality I). Our results also confirm the conclusions of the authors Yuanan et al. [87]; in general, the heavy metals in the soil’s surface layers indicate the impact of human activity. Soil contamination by Cd can be caused by, amongst other reasons, the use of large amounts of inorganic fertilizers, mainly phosphorus fertilizers [88,89,90,91], and also agrochemicals [44], which were also used in the localities we monitored.
Our results confirm the findings of Rodríguez-Bocanegra et al. [11], who observed in their study that contents of Cu, Pb, and Zn are higher in the topsoil than in the subsoil. We think this was caused by natural geological subsoil, mineralogical and geochemical character, or groundwater. Parent rocks (e.g., granite and sandstone) also affect soil contamination, especially Cd, Cu, and Zn. Similar conclusions were reached by Feng et al. [92].
We also found differences in the content values of Pb. When compared with our results, we agree with the study by Roca et al. [93] that limited mobility and strong incorporation of Pb in organic matter leads to bioaccumulation of this element in horizons of surface soil rich in humus.
By running the analyses, we found out that soil samples were contaminated most by Cd. Simultaneously, low to medium contamination of heavy metals was recorded with Cu, Pb, and Zn (except the content values of Pb in selected localities in the springs from 2017–2019). This study agrees with the findings of Li et al. [94]. The source of even low or medium contamination of Cu, Pb, and Zn could be exhaust fumes from transport (road no. 65 is near Locality III). On the other hand, exceeding the allowed Cd limit values could have been affected by fertilization and industrial emissions. This statement correlates with Li et al. [94] and Feng et al. [92]. Our results also confirm the theory of Ye et al. [95], that the spatiotemporal dynamics of heavy metals (Cd, Cu, Zn, and Pb) may be due to the physical and chemical properties of the soil.
In soil samples from Localities I–III, which we analyzed, we were interested in how heavy metal content values changed after the application of fertilizers within three years. During the observed period, the input of heavy metals was as follows: Pb > Cu = Zn > Cd (Localities I–II) and Pb > Cu > Zn > Cd (Locality III). Our results are similar to those measured by Belon et al. [96] and Hu et al. [97]. We differ between these two heavy metals: Pb and Zn. In the analyses of the content values of Cd and Cu in arable soil, the average content of Cd had a decreasing trend for the whole monitored period. The content values of Cu increased from 2017 to 2018 and decreased from 2018 to 2019. When comparing these results with the study of Zhao et al. [98], we conclude that the average content values of Cd are not identical to this study. The trends observed differ from those found in arable land by Shao et al. [99] for the last 15 years. The reason for this difference may be reduced inputs from anthropogenic sources (reduced application of fungicide-based copper). From the results obtained from the study by Hu et al. [97], heavy metals in fertilizers represent an environmental risk.
Based on the correlation coefficients of the calculated values of the contents of the monitored heavy metals in the soil, we reached the following results. At Locality II and Locality III in the autumn periods 2017–2019, the metals Cu and Cd were negatively correlated with each other (Table 5), i.e., with increasing Cu content values, the Cd content decreased and vice versa. This is consistent with the finding made by Huang et al. [100]. In contrast, Demková et al. [101], in their study, noted that all studied heavy metals were significantly positively correlated with each other, except for the relationship between the total Cu and Cd content.
If we consider the pH(H2O) values (Table 7), which affect the mobility of heavy metals, based on the calculated correlation coefficients in the autumn period with increasing pH(H2O), Cu content at Locality II and Cd content at Locality III were decreased. Huang et al. [100] reached similar results. Our study showed that, due to the experimental characteristic and TOC contents in the autumn period in the observed years, TOC contents in soil samples taken from the monitored localities are not statistically significantly different. Instead, we agree with Li et al. [94], who concluded that the soil’s physicochemical properties mainly influenced the soil’s contamination.
The correlation coefficient between the heavy metal Zn content and Cu and Pb content were evident in all three arable soils in the spring periods of 2017–2019 (Table 5). A similar result was reached by Demková et al. [101]. If there is a significant correlation between the elements, it is that they originate from the same source. Chai et al. [102] reports that the positive correlations between Cu, Pb, and Zn may reflect their soil´s geochemical affinities.
It was also confirmed, based on the calculated values of the correlation coefficients, that the high degree of bonding was between the contents of the metals Zn and Cu at Locality I (autumn) and Locality III (spring and autumn). At Locality II, a very close correlation was observed between the contents of metals Zn and Cu. A high degree of correlation was also confirmed between the contents of metals Cd and Pb at Locality III (autumn) and between the contents of metals Cu and Pb at Locality I (spring). Lv and Wang [103] obtained similar results. The correlation of Cd with other heavy metals may have a mixed source (e.g., lithogenic and anthropogenic) or different geochemical properties from other heavy metals in the soil, as reported by Chai et al. [102]. The authors Yuanan et al. [87] stated that, in general, high values of the correlation coefficients between the contents of the heavy metals are likely to contribute to the same or closely related sources. The contents of the heavy metals Cu, Pb, and Zn, can be interconnected and are probably partially influenced by biological factors, the content of organic substances in the soil, and/or pollution [104].
We also used the correlation coefficient to measure statistical dependence between pH values (spring and autumn) and heavy metal content. We chose this particular method per Zhao et al. [105], who stated in their study that correlation analysis is an effective method for revealing the relationship between heavy metals in soil and soil properties. Based on the calculated values of the correlation coefficients, we confirmed that the Zn content also increases at Locality I with the increase in the pH (spring) value. The Zn content has a much lower affinity to the soil’s organic matters so that the pH soil instead drives the total concentration of the Zn content and the Zn2+ activity in the soil solution [106]. In the case of Cd, by increasing pH (autumn), the Cd value decreases (i.e., Cd mobility is more prominent in an acidic environment). At Locality II, Cu and Zn contents had higher concentrations in neutral soil pH. The concentration of Cu and Zn in an acidic environment is higher than in the alkaline state [107]. We calculated a statistically significant correlation between the Cu content and pH (spring and autumn) values. In the spring period, the Cu content increased with increasing pH values (Table 6a) and in the autumn period vice versa. Cu adsorption in soil has a stronger pH dependence than Cd [108]. Heavy metals become more soluble (leachable) under acidic conditions [109]. Hydrolysis of Cu at pH = 6 increases its retention in the soil, while Cd hydrolyzes up to pH = 8 [108]. At Locality III, a significant degree of binding was evident between Pb content and pH (spring and autumn) values, and between Cd content and pH (autumn) values. According to Kim et al. [110], the relative mobility of Cd in the soil solution is higher than Pb. Li et al. [94] claim that higher concentrations of heavy metals have been observed at localities with higher pH values. According to Zhang et al. [111], low soil pH values are associated with some elements’ intense leaching. The monitored soils’ relatively high pH values could explain the weak correlation between pH and risk elements.
In our case, the correlation relationships were statistically significant between the contents of all heavy metals and the pH values, but the degree of their binding was different. It did not match the results obtained by Demková et al. [101] and Zhao et al. [105]. The results we researched correspond to the results obtained by Wang et al. [112]. Bołzan [108] states that metal cations’ mobility increases with increasing soil pH values due to the formation of metal complexes with dissolved organic matter. Heavy metals tend to accumulate in soils with high pH values and organic substance content with a heavier structure [113]. One possible reason could be the low mobility of heavy metals in clay and alkaline soils [114].
By analyzing the total organic carbon content, we found that arable soils (Localities I–II) had a low TOC content in the monitored years. Similar values were measured as well by Šimanský et al. [115]. Each soil has its carbon capacity, and therefore, despite the addition of large amounts of carbon, the soil may not increase its carbon content proportionately [116]. An indispensable role of the ecosystem is the soil’s organic carbon storage [117], depending on the balance of its inputs and outputs [118]. The post-harvest residues after combining harvesting into the soil were involved in the monitored localities, but the TOC contents were still low. These results do not fully correspond to the findings of Körschens et al. [119] and Cong et al. [117], stating that low organic carbon stocks are in soils that are not used for agricultural crop production (plant residues are not incorporated in soil). The decline in soil organic carbon reserves and possible loss in agricultural soils can also be affected by climate change and lower average annual temperatures [120,121,122,123,124]. Häring et al. [125] state that TOC stocks did not change depending on climatic, vegetation, and soil conditions. The authors Jiang et al. [126] indicate that soil factors and anthropogenic activities were directly influenced by soil’s organic carbon content. However, long-term studies have shown that practices such as better fertilizer management, fertilization and composting, residue incorporation, crop rotation, green manure, reduced tillage, and modification of the irrigation method increase carbon formation and storage in the soil [127]. According to Lal et al. [128], these practices support sustainable agriculture and mitigate climate change.
At the monitored localities, we found that organic carbon content decreases depending on the depth in all soil units (Table 8). This matches the results obtained by Liu et al. [129] and Brady and Weil [130]. Studies that look at the impact of agrotechnical practices on TOC stocks primarily focus on the soil profile’s surface layers [131]. According to Rumpel and Kögel-Knabner [132], the primary sources of organic matter in the subsoil are dissolved organic carbon, plant roots and root secretions, and particles’ transport from the surface. By analyzing the results, we concluded that for the storage of organic carbon in surface and subsurface soil layers of the monitored localities, fertilization with NPK fertilizers had an effect. The results of further long-term experiments showed that with the application of inorganic fertilizers, the organic carbon content in the soil changed and either increased [116,133] or remained at the same level, or only slightly increased over the years [127]. Only the average TOC content, calculated from measured TOC values at Locality III (Table 8) corresponded with the results of Zhang et al. [134]. It is known that maintaining organic carbon stocks in agricultural soils is essential to ensure food security. Under long-term constant management and environmental conditions, agricultural stocks of organic carbon are in a dynamic balance between C inputs (crop residues, organic fertilizers, and decomposition of soil organic matter) [135].
In the final part, we analyzed the statistically significant difference of three monitored localities in the observed features: pH(H2O), pH(KCl), and TOC values in two seasons (spring and autumn, 2017–2019). The Kruskal–Wallis test confirmed that the observed values were statistically significantly different (Table 10 and Table 11). The multiple comparison test confirmed that Locality III was statistically significantly different from Locality I in pH (active and exchange) values. The results correspond to the works of several other authors [136,137,138,139]. According to Balang [137], the exchange soil reaction expresses a more stable, long-term soil condition than the active soil reaction. Different soil units and the same land use had different soil pH values [138]. Most studies that monitor soil acidification during periods focus only on the topsoil, and attention is generally focused on the transition from neutral to acidic soil pH [136,139]. There is no statistically significant difference in TOC content analyzed in soil samples. Soil organic carbon content can decrease soil acidification and affect soil pH values [140]. In the current pedogenesis stage, Slovak agricultural soils’ carbon content is only satisfactory [141]. Changes in soil organic carbon levels in arable soil vary depending on the soil type [140].
By analyzing the content of heavy metals in plant parts (Table 13), we found that at Localities I–III, higher values of heavy metals were determined in the root system than in other new parts of the wheat. Bioavailable forms of Zn and Cu content in soil samples did not exceed the critical values. Pb content values exceeded the limit value for heavy metals concerning agricultural land and plant-critical values (Table 12). Xing et al. [142] state in their work that pollution of agricultural land often leads to increased concentrations of Cd and Pb in crops such as wheat. Rodriguez-Bocanegra et al. [11] found in their study that the analyzed soil had high contamination of Cu, Pb and Zn content mainly in arable soil. Many of these heavy metals were bioavailable to plants, especially Zn. Besides that, they confirmed that plants generally accumulate a higher content of heavy metals in the root system than in other new parts. The authors Kumpiene et al. [143] state that phosphorus application reduces bioavailable Pb, thus reducing accumulation in plant shoots. This corresponds to the conclusions we reached in our research.
Cd occurred only in the root, in the above-ground parts in our analyzed parts of wheat, and Cd content was not found in the grain. We recorded lead in the root and the above-ground parts of wheat, but there was zero grain content. We conclude that the accumulation of Cd in plant, can be influenced by pH values, TOC values, plant nutrients, and the plant itself (species, variety, or cultivar). Gao et al. [144] reached similar conclusions. According to McLaughlin et al. [145], environmental factors may promote greater Cd uptake by increased flux to the root. The addition of Ca2+ ions through liming can lead to increased Cd solubility and availability to plants [146]. Plants grown on low pH soils, where Cd’s solubility is highest, may pose a potentially high risk to consumers. Wheat grown on soils with low Zn and P bioavailability may have higher Cd concentrations in the grains [54]. The availability of macronutrients and micronutrients, such as Zn, also affect Cd’s absorption in plants [147]. Cadmium slows down the root system’s growth and causes chlorosis, even necrosis, with an overall decrease in biomass and yields [26]. We have reached similar results in our research as well. By analyzing the plants, we found that the accumulation of Zn content in crops depends primarily on Zn’s soil availability. In our measurements, Zn content did not exceed the permitted limit value in any monitored localities. Studies by other researchers have shown that Zn’s availability in the soil depends not only on the total Zn content of the soil but also on the influence of the physicochemical properties of the soil [148,149]. The low availability of Zn is often reported for wheat grains [70]. It is essential to improve Zn’s availability in crops through agricultural management practices such as zinc fertilizer application [150].
At Localities I–III, we also included in the calculation the results of analyses of whole plant parts (Table 13). According to the bioaccumulation coefficient values, potentially heavy metals, Zn and Cu, in monitored localities can be classified into a class among the elements with an average intensity of accumulation. The calculated values of the bioaccumulation coefficient Cd for Locality I place it among the negligible accumulated metals. But for Locality II and Locality III these are intensively accumulated metals. The bioaccumulation coefficient values in all monitored localities classify Pb among the metals with average accumulation intensity. A similar conclusion was reached by Peijnenburg et al. [151]. Furthermore, according to Norouzi et al. [152] and Demková et al. [153], the concentrations of heavy metals in plants depend on the root uptake associated with the bioavailability of the elements in the soil or by dry and wet deposition on the external organs of plants. Heavy metals that bind to solid particles in the atmosphere can enter and contaminate the soil, given that the absorption of metal in higher plants occurs through the roots and leaves.

5. Conclusions

Our task is to avoid increasing concentrations of heavy metals in soil. Their accumulation affects the soil’s ability to provide safe food, affects the quality and yields of cultivated crops, and impacts consumers’ health. This is especially true for the contents of heavy metals with a high degree of biotoxicity.
Today, different procedures are used regarding sustainable agriculture; one possibility is the circular economy. The circular economy is focused on the (re)design of processes and products, aiming to minimize negative environmental impacts by reducing the use of non-renewable resources and improving waste management [154]. Agricultural production seeks to prevent soil degradation [155] and use amounts of fertilizer that do not change the soil’s properties [135] while still increasing plant yields and productivity. This agricultural activity is a sustainable development component which affects food producers in difficult qualitative and quantitative conditions. Agricultural ecosystems are an important component in the production of food of plant and animal origin for humans. Heavy metal bioaccumulation in edible parts of plants seriously affects environmental components, the food chain, and the quality of people’s lives, especially today, when the growing number of emerging diseases such as COVID-19 represents an increasing health risk.
The data obtained from the study on the content of heavy metals in soil and cereals grown in this soil should lead to appropriate measures related to food safety [156]. These are preventive measures to exclude heavy metals from the food chain. They may also include checking the bioavailability of the elements (e.g., by liming or using other methods to demobilize heavy metals), growing plants other than cereals on the affected land, and eventually remediation actions. The assessment results based on the soil samples from our study also highlight the need for spatially intensified and thematically broadened monitoring of soil resources in a monitored area. Heavy metals can be in agricultural soil from anthropogenic sources (transport and industrial) and dry and wet deposition. This also applies to the monitored sites; whose arable soils are in the vicinity of inhabited urban areas or near roads where the limits of Cd and Pb heavy metal content have been exceeded.
The main reasons for Cd’s presence in the soil can be the use of large amounts of inorganic fertilizers, agrochemicals, and atmospheric deposits. Higher Pb contents may be mainly from anthropogenic sources (burning of fossil fuels and municipal sources), including transport and industrial resources. Exceeding the limits of heavy metals results in a threat to human health and direct negative economic impacts. To reduce heavy metals in the soil, stricter regulation of ash emissions during the coal combustion process could be introduced, especially in winter seasons, to mitigate the growing agricultural use of these heavy metals in arable soils. One effective solution to prevent and reduce soil contamination is for surface layers of soil to contain buffers, which would prevent pollutants from reaching deeper into the soil.
Regular monitoring and evaluation of the heavy metal content in soil units are of primary importance in this field. Current knowledge points to a comprehensive approach to tackling soil contamination and cultivated crops (plants) with heavy metals, which is necessary to maintain the soil’s ecological function and ensure the health and food safety of cultivated cereals.

Author Contributions

Conceptualization: M.F.; L.P. and A.T.; methodology: M.F. and L.P.; validation: A.T.; formal analysis: A.T. and M.F.; data curation: A.T. and M.F.; writing—original draft preparation: M.F., L.P. and A.T.; writing—review and editing: M.F. All authors have read and agreed to the published version of the manuscript.

Funding

This research received no external funding.

Institutional Review Board Statement

Not applicable.

Informed Consent Statement

Not applicable.

Data Availability Statement

The data presented in this study is available upon request from the corresponding author.

Acknowledgments

This work has been supported by the Cultural and Educational Grant Agency (KEGA) of the Ministry of Education, Science, Research, and Sport of the Slovak Republic under the Grant No. 015UKF-4/2022, co-founded by the European Community under project No. 26220220180: Building Research Centre “AgroBioTech”, and the Slovak Research and Development Agency under the contract No. APVV-14-0446.

Conflicts of Interest

The authors declare no conflict of interest.

References

  1. Zhang, S.; Lin, H.; Deng, L.; Gong, G.; Jia, Y.; Xu, X.; Li, T.; Li, Y.; Chen, H. Cadmium tolerance and accumulation characteristics of Siegesbeckia orientalis L. Ecol. Eng. 2013, 51, 133–139. [Google Scholar] [CrossRef]
  2. Steffan, J.J.; Brevik, E.C.; Burgess, L.C.; Cerdàcet, A. The effect of soil on human health: An overview. Eur. J. Soil Sci. 2018, 69, 159–171. [Google Scholar] [CrossRef] [Green Version]
  3. Brevik, E.C. Soils and human health: An overview. In Soils and Human Health; Brevik, E.C., Burgess, L.C., Eds.; CRC Press: Boca Raton, FL, USA, 2013; pp. 29–56. [Google Scholar]
  4. Von Lindern, I.; Spalinger, S.; Stifelman, M.L.; Stanek, L.W.; Bartrem, C. Estimating Children’s Soil/Dust Ingestion Rates through Retrospective Analyses of Blood Lead Biomonitoring from the Bunker Hill Superfund Site in Idaho. Environ. Health Perspect. 2016, 124, 1462–1470. [Google Scholar] [CrossRef] [PubMed] [Green Version]
  5. Xing, W.; Zhao, Q.; Scheckel, K.; Zheng, L.; Li, L. Inhalation bioaccessibility of Cd, Cu, Pb and Zn and speciation of Pb in particulate matter fractions from areas with different pollution characteristics in Henan Province, China. Ecotoxicol. Environ. Saf. 2019, 175, 192–200. [Google Scholar] [CrossRef]
  6. Brevik, E.C.; Burgess, L.C. Soil: Influence on Human Health. In Encyclopedia of Environmental Management; Jorgensen, S.V., Ed.; CRC Press: Boca Raton, FL, USA, 2015; pp. 1–13. [Google Scholar]
  7. Steinnes, E. Soils and human health. In Sustaining Soil Productivity in Response to Global Climate Change: Science, Policy, and Ethics; Sauer, T., Norman, J.M., Sivakumar, M.V.K., Eds.; John Wiley & Sons. Inc.: Chichester, UK, 2011; pp. 79–86. [Google Scholar]
  8. Green, H.; Broun, P.; Cakmak, I.; Condon, L.; Fedoroff, N.; Gonzalez-Valero, J.; Graham, I.; Lewis, J.; Moloney, M.; Oniang’O, R.K.; et al. Planting seeds for the future of food. J. Sci. Food Agric. 2016, 96, 1409–1414. [Google Scholar] [CrossRef] [PubMed] [Green Version]
  9. Tóth, G.; Hermann, T.; Da Silva, M.; Montanarella, L. Heavy metals in agricultural soils of the European Union with implications for food safety. Environ. Int. 2016, 88, 299–309. [Google Scholar] [CrossRef]
  10. Zeng, Y.; Lai, Z.; Yang, W.; Li, H. Distribution of heavy metals in surface sediments from the Pearl River outlets. South China: Five-year monitoring program. Fresen. Environ. Bull. 2018, 27, 574–583. [Google Scholar]
  11. Rodríguez-Bocanegra, J.; Roca, N.; Febrero, A.; Bort, J. Assessment of heavy metal tolerance in two plant species growing in experimental disturbed polluted urban soil. J. Soil. Sediment. 2018, 18, 2305–2317. [Google Scholar] [CrossRef]
  12. Zhang, X.; Yang, L.; Li, Y.; Li, H.; Wang, W.; Ye, B. Impacts of lead/zinc mining and smelting on the environment and human health in China. Environ. Monit. Assess. 2012, 184, 2261–2273. [Google Scholar] [CrossRef]
  13. Pepper, I.L. The Soil Health-Human Health Nexus. Crit. Rev. Environ. Sci. Technol. 2013, 43, 2617–2652. [Google Scholar] [CrossRef]
  14. Oliver, M.A.; Gregory, P.J. Soil, food security and human health: A review. Eur. J. Soil Sci. 2014, 66, 257–276. [Google Scholar] [CrossRef]
  15. Pandey, S.; Parvez, S.; Sayeed, I.; Haque, R.; Bin-Hafeez, B.; Raisuddin, S. Biomarkers of oxidative stress: A comparative study of river Yamuna fish Wallago attu (Bl. & Schn.). Sci. Total Environ. 2003, 309, 105–115. [Google Scholar] [CrossRef]
  16. Li, Z.; Ma, Z.; van der Kuijp, T.J.; Yuan, Z.; Huang, L. A review of soil heavy metal pollution from mines in China: Pollution and health risk assessment. Sci. Total Environ. 2014, 468-469, 843–853. [Google Scholar] [CrossRef]
  17. Satpathy, D.; Reddy, M.V.; Dhal, S.P. Risk Assessment of Heavy Metals Contamination in Paddy Soil, Plants, and Grains (Oryza sativa L.) at the East Coast of India. BioMed Res. Int. 2014, 2014, 1–11. [Google Scholar] [CrossRef] [PubMed] [Green Version]
  18. Hu, B.; Wang, J.; Jin, B.; Li, Y.; Shi, Z. Assessment of the potential health risks of heavy metals in soils in a coastal industrial region of the Yangtze River Delta. Environ. Sci. Pollut. Res. Int. 2017, 24, 19816–19826. [Google Scholar] [CrossRef] [PubMed]
  19. Liu, Q.; Liu, J.; Wang, Q.; Wang, Y. Source identification and availability of heavy metals in peri-urban vegetable soils: A case study from China. Hum. Ecol. Risk Assess. Int. J. 2016, 22, 1–14. [Google Scholar]
  20. Navarrete, I.A.; Gabiana, C.; Dumo, J.R.E.; Salmo Severino, S.G., III; Guzman, M.A.L.G.; Valera, N.S.; Espiritu, E.Q. Heavy metal concentrations in soils and vegetation in urban areas of Quezon City. Philippines. Environ. Monit. Assess. 2017, 189, 1–15. [Google Scholar] [CrossRef]
  21. Stocking, M.A. Tropical Soils and Food Security: The Next 50 Years. Science 2003, 302, 1356–1359. [Google Scholar] [CrossRef] [Green Version]
  22. Combs, G.F., Jr. Geological impacts on nutrition. In Essentials of Medical Geology; Selinus, O., Alloway, B., Centeno, J.A., Finkelman, R.B., Fuge, R., Lindh, U., Smedley, P., Eds.; Elsevier: Dordrecht, The Netherlands, 2005; pp. 161–177. [Google Scholar]
  23. Henry, J.M.; Cring, F.D. Geophagy: An anthropological perspective. In Soils and Human Health; Brevik, E.C., Burgess, L.C., Eds.; CRC Press: Boca Raton, FL, USA, 2013; pp. 179–198. [Google Scholar]
  24. Nagajyoti, P.C.; Lee, K.D.; Sreekanth, T.V.M.; Nagajyoti, P.C.; Lee, K.D.; Sreekanth, T.V.M. Heavy metals, occurrence and toxicity for plants: A review. Environ. Chem. Lett. 2010, 8, 199–216. [Google Scholar] [CrossRef]
  25. Rattan, R.; Datta, S.; Chhonkar, P.; Suribabu, K.; Singh, A. Long-term impact of irrigation with sewage effluents on heavy metal content in soils, crops and groundwater—A case study. Agric. Ecosyst. Environ. 2005, 109, 310–322. [Google Scholar] [CrossRef]
  26. Urminská, J.; Tóth, T.; Prokeinová, R.B.; Ondrišík, P. The effect of the selected remediation medium on the cadmium bioavailability in the selected ecosystem in the Southwestern locality of Slovakia. Ekológia 2019, 38, 214–224. [Google Scholar] [CrossRef] [Green Version]
  27. Wu, L.; Pan, X.; Chen, L.; Huang, Y.; Teng, Y.; Luo, Y.; Christie, P. Occurrence and distribution of heavy metals and tetracyclines in agricultural soils after typical land use change in east China. Environ. Sci. Pollut. Res. Int. 2013, 20, 8342–8354. [Google Scholar] [CrossRef] [PubMed]
  28. Ding, Q.; Cheng, G.; Wang, Y.; Zhuang, D. Effects of natural factors on the spatial distribution of heavy metals in soils surrounding mining regions. Sci. Total Environ. 2017, 578, 577–585. [Google Scholar] [CrossRef] [PubMed]
  29. Shen, F.; Liao, R.; Ali, A.; Mahar, A.; Guo, D.; Li, R.; Xining, S.; Awasthi, M.K.; Wang, Q.; Zhang, Z. Spatial distribution and risk assessment of heavy metals in soil near a Pb/Zn smelter in Feng County, China. Ecotoxico. Environ. Saf. 2017, 139, 254–262. [Google Scholar] [CrossRef]
  30. Lin, Y.-P.; Teng, T.-P.; Chang, T.-K. Multivariate analysis of soil heavy metal pollution and landscape pattern in Changhua county in Taiwan. Landsc. Urban Plan. 2002, 62, 19–35. [Google Scholar] [CrossRef]
  31. Shi, T.; Ma, J.; Wu, X.; Ju, T.; Lin, X.; Zhang, Y.; Li, X.; Gong, Y.; Hou, H.; Zhao, L.; et al. Inventories of heavy metal inputs and outputs to and from agricultural soils: A review. Ecotoxicol. Environ. Saf. 2018, 164, 118–124. [Google Scholar] [CrossRef]
  32. Hauptvogl, M.; Kotrla, M.; Prčík, M.; Pauková, Ž.; Kováčik, M.; Lošák, T. Phytoremediation Potential of Fast-Growing Energy Plants: Challenges and Perspectives—A Review. Pol. J. Environ. Stud. 2019, 29, 505–516. [Google Scholar] [CrossRef] [Green Version]
  33. Schwarz, K.; Pickett, S.T.A.; Lathrop, R.G.; Weathers, K.C.; Pouyat, R.V.; Cadenasso, M.L. The effects of the urban built environment on the spatial distribution of lead in residential soils. Environ. Pollut. 2012, 163, 32–39. [Google Scholar] [CrossRef]
  34. Djingova, R.; Kuleff, I. Instrumental Techniques for Trace Analysis. In Trace Elements—Their Distribution and Effects in the Environment; Vernet, J.P., Ed.; Elsevier: London, UK, 2000; pp. 137–185. [Google Scholar]
  35. Hu, W.; Huang, B.; Tian, K.; Holm, P.E.; Zhang, Y. Heavy metals in intensive greenhouse vegetable production systems along Yellow Sea of China: Levels, transfer and health risk. Chemosphere 2017, 167, 82–90. [Google Scholar] [CrossRef] [PubMed]
  36. Viventsova, E.; Kumpiene, J.; Gunneriusson, L.; Holmgren, A. Changes in soil organic matter composition and quantity with distance to a nickel smelter—a case study on the Kola Peninsula, NW Russia. Geoderma 2005, 127, 216–226. [Google Scholar] [CrossRef]
  37. Park, J.H.; Lamb, D.; Paneerselvam, P.; Choppala, G.; Bolan, N.; Chung, J.-W. Role of organic amendments on enhanced bioremediation of heavy metal(loid) contaminated soils. J. Hazard. Mater. 2011, 185, 549–574. [Google Scholar] [CrossRef]
  38. Mahar, A.; Wang, P.; Li, R.; Zhang, Z. Immobilization of Lead and Cadmium in Contaminated Soil Using Amendments: A Review. Pedosphere 2015, 25, 555–568. [Google Scholar] [CrossRef]
  39. Wiszniewska, A.; Hanus-Fajerska, E.; Muszyńska, E.; Ciarkowska, K. Natural Organic Amendments for Improved Phytoremediation of Polluted Soils: A Review of Recent Progress. Pedosphere 2016, 26, 1–12. [Google Scholar] [CrossRef]
  40. Beesley, L.; Moreno-Jiménez, E.; Gomez-Eyles, J.L.; Harris, E.; Robinson, B.; Sizmur, T. A review of biochars’ potential role in the remediation. revegetation and restoration of contaminated soils. Environ. Pollut. 2011, 159, 3269–3282. [Google Scholar] [CrossRef] [PubMed]
  41. Komárek, M.; Vanek, A.; Ettler, V. Chemical stabilization of metals and arsenic in contaminated soils using oxides—A review. Environ. Pollut. 2013, 172, 9–22. [Google Scholar] [CrossRef]
  42. Bolan, N.; Kunhikrishnan, A.; Thangarajan, R.; Kumpiene, J.; Park, J.; Makino, T.; Kirkham, M.B.; Scheckel, K. Remediation of heavy metal(loid)s contaminated soils—To mobilize or to immobilize? J. Hazard. Mater. 2014, 266, 141–166. [Google Scholar] [CrossRef]
  43. Hernandez-Soriano, M.C.; Jimenez-Lopez, J.C. Effects of soil water content and organic matter addition on the speciation and bioavailability of heavy metals. Sci. Total Environ. 2012, 423, 55–61. [Google Scholar] [CrossRef]
  44. Jing, F.; Chen, C.; Chen, X.; Liu, W.; Wen, X.; Hu, S.; Yang, Z.; Guo, B.; Xu, Y.; Yu, Q. Effects of wheat straw derived biochar on cadmium availability in a paddy soil and its accumulation in rice. Environ. Pollut. 2020, 257, 113592. [Google Scholar] [CrossRef]
  45. Nordberg, G.F.; Fowler, B.; Nordberg, M. Cadmium. In Handbook on the Toxicology of Metals, 4th ed.; Nordberg, G.F., Fowler, B.A., Nordberg, M., Eds.; Elsevier: Amsterdam, The Netherlands, 2015; Volume 2, pp. 667–716. [Google Scholar]
  46. Makovníková, J.; Barančíková, G.; Dlapa, P.; Dercová, K. Anorganické kontaminanty v pôdnom ekosystéme. Chem. Listy 2006, 100, 424–432. [Google Scholar]
  47. Halušková, L.; Valentovičová, K.; Huttová, J.; Mistrík, I.; Tamás, L. Effect of heavy metals on root growth and peroxidase activity in barley root tip. Acta Physiol. Plant. 2010, 32, 59–65. [Google Scholar] [CrossRef]
  48. Cobbett, C.; Goldsbrough, P. Phytochelatins and Metallothioneins: Roles in Heavy Metal Detoxification and Homeostasis. Annu. Rev. Plant Biol. 2002, 53, 159–182. [Google Scholar] [CrossRef] [PubMed] [Green Version]
  49. Chandrasekaran, A.; Ravisankar, R.; Harikrishnan, N.; Satapathy, K.; Prasad, M.; Kanagasabapathy, K. Multivariate statistical analysis of heavy metal concentration in soils of Yelagiri Hills, Tamilnadu, India—Spectroscopical approach. Spectrochim. Acta Part A Mol. Biomol. Spectrosc. 2015, 137, 589–600. [Google Scholar] [CrossRef]
  50. Yang, Y.; Chen, W.; Wang, M.; Peng, C. Regional accumulation characteristics of cadmium in vegetables: Influencing factors, transfer model and indication of soil threshold content. Environ. Pollut. 2016, 219, 1036–1043. [Google Scholar] [CrossRef]
  51. Hunter, P. A toxic brew we cannot live without-Micronutrients give insights into the interplay between geochemistry and evolutionary biology. EMBO Rep. 2008, 9, 15–18. [Google Scholar] [CrossRef] [Green Version]
  52. Engström, A.; Michaëlsson, K.; Vahter, M.; Julin, B.; Wolk, A.; Åkesson, A. Associations between dietary cadmium exposure and bone mineral density and risk of osteoporosis and fractures among women. Bone 2012, 50, 1372–1378. [Google Scholar] [CrossRef]
  53. Ju, Y.-R.; Chen, W.-Y.; Liao, C.-M. Assessing human exposure risk to cadmium through inhalation and seafood consumption. J. Hazard. Mater. 2012, 227-228, 353–361. [Google Scholar] [CrossRef]
  54. Yi, Z.; Lehto, N.J.; Robinson, B.H.; Cavanagh, J.-A.E. Environmental and edaphic factors affecting soil cadmium uptake by spinach, potatoes, onion and wheat. Sci. Total Environ. 2020, 713, 136694. [Google Scholar] [CrossRef]
  55. Braungardt, C.B.; Achterberg, E.P.; Axelsson, B.; Buffle, J.; Graziottin, F.; Howell, K.A.; Illuminati, S.; Scarponi, G.; Tappin, A.D.; Tercier-Waeber, M.-L.; et al. Analysis of dissolved metal fractions in coastal waters: An inter-comparison of five voltammetric in situ profiling (VIP) systems. Mar. Chem. 2009, 114, 47–55. [Google Scholar] [CrossRef]
  56. Vamerali, T.; Bandiera, M.; Mosca, G. Field crops for phytoremediation of metal-contaminated land. A review. Environ. Chem. Lett. 2009, 8, 1–17. [Google Scholar] [CrossRef]
  57. Yruela, I. Copper in plants: Acquisition, transport and interactions. Funct. Plant Biol. 2009, 36, 409–430. [Google Scholar] [CrossRef] [PubMed] [Green Version]
  58. Bhattacharya, P.T.; Misra, S.R.; Hussain, M. Nutrition Aspects of Essential Trace Elements in Oral Health and Disease: An Extensive Rewiew. Scientifica 2016, 2016, 5464373. [Google Scholar] [CrossRef] [Green Version]
  59. Balabanova, B.; Stafilov, T.; Šajn, R.; Andonovska, K.B. Quantitative assessment of metal elements using moss species as biomonitors in downwind area of lead-zinc mine. J. Environ. Sci. Health Part A 2016, 52, 290–301. [Google Scholar] [CrossRef]
  60. Nabulo, G.; Oryem-Origa, H.; Diamond, M. Assessment of lead, cadmium, and zinc contamination of roadside soils, surface films, and vegetables in Kampala City, Uganda. Environ. Res. 2006, 101, 42–52. [Google Scholar] [CrossRef] [PubMed]
  61. Beneš, S. Obsahy a Bilance Prvků ve Sférach Životního Prostředí, II. část; Ministerstvo Zemědelství ČR: Praha, Czech Republic, 1994; 184p. [Google Scholar]
  62. Matovic, V.; Buha, A.; Ðukić-Ćosić, D.; Bulat, Z. Insight into the oxidative stress induced by lead and/or cadmium in blood, liver and kidneys. Food Chem. Toxicol. 2015, 78, 130–140. [Google Scholar] [CrossRef] [PubMed]
  63. Hronec, O.; Tóth, J.; Tomáš, J. Cudzorodé Látky a Ich Riziká; Harlequin Quality Ltd.: Košice, Slovakia, 2002; 200p. [Google Scholar]
  64. Vallascas, E.; De Micco, A.; Deiana, F.; Banni, S.; Sanna, E. Adipose tissue: Another target organ for lead accumulation? A study on sardinian children (Italy). Am. J. Hum. Biol. 2013, 25, 789–794. [Google Scholar] [CrossRef] [PubMed]
  65. Li, Y.; Wu, S.; Xiang, Y.; Liang, X. An investigation of outpatient children’s blood lead level in Wuhan China. PLoS ONE 2014, 9, e95284. [Google Scholar] [CrossRef]
  66. Morgan, R. Soil. heavy metals, and human health. In Soils and Human Health; Brevik, E.C., Burgess, L.C., Eds.; CRC Press: Boca Raton, FL, USA, 2013; pp. 59–82. [Google Scholar]
  67. Sharma, V.K.; McDonald, T.J.; Sohn, M.; Anquandah, G.A.K.; Pettine, M.; Zboril, R. Biogeochemistry of selenium. A review. Environ. Chem. Lett. 2015, 13, 49–58. [Google Scholar] [CrossRef]
  68. Alloway, B.J. Zinc in Soil and Crop Nutrition, 2nd ed.; IZA and IFA: Brussels, Belgium; Paris, France, 2008; 135p. [Google Scholar]
  69. Baize, D.; Sterckeman, T. Of the necessity of knowledge of the natural pedo-geochemical background content in the evaluation of the contamination of soils by trace elements. Sci. Total Environ. 2001, 264, 127–139. [Google Scholar] [CrossRef]
  70. Liu, Y.-M.; Liu, D.-Y.; Zhao, Q.-Y.; Zhang, W.; Chen, X.-X.; Xu, S.-J.; Zou, C.-Q. Zinc fractions in soils and uptake in winter wheat as affected by repeated applications of zinc fertilizer. Soil Tillage Res. 2020, 200, 104612. [Google Scholar] [CrossRef]
  71. Linkeš, V.; Pestún, V.; Džatko, M. Príručka Pre Používanie Máp Bonitovaných Pôdno—Ekologických Jednotiek. Príručka Pre Bonitáciu Poľnohospodárskych Pôd, 3rd ed.; VÚPÚ: Bratislava, Slovakia, 1996; 104p. [Google Scholar]
  72. Bátora, M.; Zaťko, M. Zlaté Moravce, 1st ed.; Mestský úrad: Zlaté Moravce, Slovakia, 1998; 373p. [Google Scholar]
  73. Süle, P.; Šüle, P.M.L.; Adamová, M. Encyklopédia Miest a obcí Slovenska; PS-LINE. spol. s r. o.: Lučenec, Slovakia, 2005; 960p. [Google Scholar]
  74. Balkovič, J.; Bedrna, Z.; Bublinec, E.; Čurlík, J.; Dlapa, P.; Fulajtár, E.; Gömöryová, E.; Gregor, J.; Hanes, J.; Houšková, B.; et al. Morfogenetický Klasifikačný Systém Pôd Slovenska. In Bazálna Referenčná Taxonómia, 2nd ed.; SPS. NPPC VÚPOP: Bratislava, Slovakia, 2014; 96p. [Google Scholar]
  75. Decree of the National Council of the Slovak Republic No. 59/2013 Coll. Ministry of Agriculture and Rural Development of the Slovak Republic, which amends Decree of the Ministry of Agriculture of the Slovak Republic No. 508/2004 Coll., Which Implements § 27 of Act No. 220/2004 Coll. on the Protection and Use of Agricultural Land and Amending Act No. 245/2003 Coll. on Integrated Prevention and Control of Environmental Pollution and Amendments to Certain Acts. Available online: https://www.slov-lex.sk/vyhladavanie-pravnych-predpisov?text=59%2F2013%20 (accessed on 2 February 2021).
  76. Decree of the Ministry of Agriculture of the Slovak Republic No. 508/2004 Coll., Which Implements § 27 of Act No. 220/2004 Coll. on the Protection and Use of Agricultural Land and Amending Act No. 245/2003 Coll. on Integrated Prevention and Control of Environmental Pollution and Amendments to Certain Acts. Available online: https://www.slov-lex.sk/pravne-predpisy/SK/ZZ/2004/508/20130401 (accessed on 5 February 2021).
  77. Van Reeuwijk, L.P. Producer for Soil Analysis; International Soil reference and Information Centre: Wageningen, The Netherlands, 2002; 120p. [Google Scholar]
  78. Orlov, D.S.; Grišina, L.A. Praktikum po Chimiji Gumusa; Izdateľstvo Moskovskovo Uniresiteta: Moscow, Russia, 1981; 124p. [Google Scholar]
  79. Grišina, L.A. Gumusoobrazovanije i Gumusnoe Sostojanije Počv; Izd. MU: Moskva, Russia, 1986; 242p. [Google Scholar]
  80. Liu, W.-X.; Shen, L.-F.; Liu, J.-W.; Wang, Y.-W.; Li, S.-R. Uptake of Toxic Heavy Metals by Rice (Oryza sativa L.) Cultivated in the Agricultural Soil near Zhengzhou City, People’s Republic of China. Bull. Environ. Contam. Toxicol. 2007, 79, 209–213. [Google Scholar] [CrossRef]
  81. Markechová, D.; Stehlíková, B.; Tirpáková, A. Štatistické Metódy a ich Aplikácie; UKF: Nitra, Slovakia, 2011; 534p. [Google Scholar]
  82. Decree of the Ministry of Agriculture of the Slovak Republic and the Ministry of Health of the Slovak Republic of 29 October 2007 no. 14300/2007-OL. amending the Decree of the Ministry of Agriculture of the Slovak Republic and the Ministry of Health of the Slovak Republic of 11 September 2006 no. 18558/2006-SL. Issuing the Title of the Food Code of the Slovak Republic regulating Contaminants in Foodstuffs. Available online: https://www.mpsr.sk/index.php?navID=126&year=2007&ofs1=4 (accessed on 15 March 2021).
  83. State Veterinary and Food Administration of the Slovak Republic. Food Code of the Slovak Republic. Available online: https://www.svps.sk/legislativa/legislativa_kodex.asp (accessed on 15 February 2021).
  84. Rapant, S.; Cvečková, V.; Jurkovič, Ľ.; Macek, J. Aplikovaná Medicínska Geochémia; Univerzita Komenského v Bratislave: Bratislava, Slovakia, 2019; 163p. [Google Scholar]
  85. Essentials of Medical Geology: Impacts of the Natural Environment on Public Health; Selinus, O.; Alloway, B.J.; Centeno, J.A.; Finkelman, R.B.; Fuge, R.; Lindh, U.; Smedley, P. (Eds.) Elsevier Acadamic Press: Burlington, MA, USA, 2005; 793p. [Google Scholar]
  86. Wang, Z.; Xiao, J.; Wang, L.; Liang, T.; Guo, Q.; Guan, Y.; Rinklebe, J. Elucidating the differentiation of soil heavy metals under different land uses with geographically weighted regression and self-organizing map. Environ. Pollut. 2020, 260, 114065. [Google Scholar] [CrossRef]
  87. Yuanan, H.; He, K.; Sun, Z.; Chen, G.; Cheng, H. Quantitative source apportionment of heavy metal(loid)s in the agricultural soils of an industrializing region and associated model uncertainty. J. Hazard. Mater. 2020, 391, 122244. [Google Scholar] [CrossRef]
  88. Chen, T.; Wong, J.; Zhou, H.; Wong, M. Assessment of trace metal distribution and contamination in surface soils of Hong Kong. Environ. Pollut. 1997, 96, 61–68. [Google Scholar] [CrossRef]
  89. Huang, B.; Shi, X.; Yu, D.; Öborn, I.; Blombäck, K.; Pagella, T.; Wang, H.; Sun, W.; Sinclair, F.L. Environmental assessment of small-scale vegetable farming systems in peri-urban areas of the Yangtze River Delta Region, China. Agric. Ecosyst. Environ. 2006, 112, 391–402. [Google Scholar] [CrossRef]
  90. Duan, Q.; Lee, J.; Liu, Y.; Chen, H.; Hu, H. Distribution of Heavy Metal Pollution in Surface Soil Samples in China: A Graphical Review. Bull. Environ. Contam. Toxicol. 2016, 97, 303–309. [Google Scholar] [CrossRef] [PubMed]
  91. Khan, M.A.; Khan, S.; Khan, A.; Alam, M. Soil contamination with cadmium, consequences and remediation using organic amendments. Sci. Total Environ. 2017, 601–602, 1591–1605. [Google Scholar] [CrossRef] [PubMed]
  92. Feng, W.; Guo, Z.; Peng, C.; Xiao, X.; Shi, L.; Zeng, P.; Ran, H.; Xue, Q. Atmospheric bulk deposition of heavy metal(loid)s in central south China: Fluxes, influencing factors and implication for paddy soils. J. Hazard. Mater. 2019, 371, 634–642. [Google Scholar] [CrossRef] [PubMed]
  93. Roca, N.; Pazos, M.S.; Bech, J. Background levels of potentially toxic elements in soils: A case study in Catamarca (a semiarid region in Argentina). Catena 2012, 92, 55–66. [Google Scholar] [CrossRef]
  94. Li, C.; Sun, G.; Wu, Z.; Zhong, H.; Wang, R.; Liu, X.; Guo, Z.; Cheng, J. Soil physiochemical properties and landscape patterns control trace metal contamination at the urban-rural interface in southern China. Environ. Pollut. 2019, 250, 537–545. [Google Scholar] [CrossRef]
  95. Ye, C.; Butler, O.M.; Du, M.; Liu, W.; Zhang, Q. Spatio-temporal dynamics, drivers and potential sources of heavy metal pollution in riparian soils along a 600 kilometre stream gradient in Central China. Sci. Total Environ. 2019, 651, 1935–1945. [Google Scholar] [CrossRef]
  96. Belon, E.; Boisson, M.; Deportes, I.; Eglin, T.; Feix, I.; Bispo, A.; Galsomies, L.; Leblond, S.; Guellier, C. An inventory of trace elements inputs to French agricultural soils. Sci. Total Environ. 2012, 439, 87–95. [Google Scholar] [CrossRef] [PubMed]
  97. Hu, W.; Wang, H.; Dong, L.; Huang, B.; Borggaard, O.K.; Hansen, H.C.B.; He, Y.; Holm, P.E. Source identification of heavy metals in peri-urban agricultural soils of southeast China: An integrated approach. Environ. Pollut. 2018, 237, 650–661. [Google Scholar] [CrossRef] [PubMed]
  98. Zhao, S.; Qiu, S.; He, P. Changes of heavy metals in soil and wheat grain under long-term environmental impact and fertilization practices in North China. J. Plant Nutr. 2018, 41, 1970–1979. [Google Scholar] [CrossRef]
  99. Shao, D.; Zhan, Y.; Zhou, W.; Zhu, L. Current status and temporal trend of heavy metals in farmland soil of the Yangtze River Delta Region: Field survey and meta-analysis. Environ. Pollut. 2016, 219, 329–336. [Google Scholar] [CrossRef] [PubMed]
  100. Huang, J.; Guo, S.; Zeng, G.-M.; Li, F.; Gu, Y.; Shi, Y.; Shi, L.; Liu, W.; Peng, S. A new exploration of health risk assessment quantification from sources of soil heavy metals under different land use. Environ. Pollut. 2018, 243, 49–58. [Google Scholar] [CrossRef] [PubMed]
  101. Demková, L.; Bobulská, L.; Fazekášová, D. Toxicity of heavy metals to soil biological and chemical properties in conditions of environmentally polluted area middle Spiš (Slovakia). Carpath. J. Earth Env. 2015, 10, 193–201. [Google Scholar]
  102. Chai, Y.; Guo, J.; Chai, S.; Cai, J.; Xue, L.; Zhang, Q. Source identification of eight heavy metals in grassland soils by multivariate analysis from the Baicheng–Songyuan area, Jilin Province, Northeast China. Chemosphere 2015, 134, 67–75. [Google Scholar] [CrossRef]
  103. Lv, J.; Wang, J. Multi-scale analysis of heavy metals sources in soils of Jiangsu Coast. Eastern China. Chemosphere 2018, 212, 964–973. [Google Scholar] [CrossRef] [PubMed]
  104. Zupančič, N. Influence of climate factors on soil heavy metal content in Slovenia. J. Soils Sediments 2017, 17, 1073–1083. [Google Scholar] [CrossRef]
  105. Zhao, K.; Zhang, L.; Dong, J.; Wu, J.; Ye, Z.; Zhao, W.; Ding, L.; Fu, W. Risk assessment, spatial patterns and source apportionment of soil heavy metals in a typical Chinese hickory plantation region of southeastern China. Geoderma 2020, 360, 1–11. [Google Scholar] [CrossRef]
  106. Laurent, C.; Bravin, M.N.; Crouzet, O.; Pelosi, C.; Tillard, E.; Lecomte, P.; Lamy, I. Increased soil pH and dissolved organic matter after a decade of organic fertilizer application mitigates copper and zinc availability despite contamination. Sci. Total Environ. 2020, 709, 135927. [Google Scholar] [CrossRef]
  107. Jones, J.B. Soil pH. Liming, and liming materials. In Agronomic Handbook Management of Crops, Soils and Their Fertility; CRC Press: Washington, DC, USA, 2002; pp. 237–251. [Google Scholar]
  108. Bołzan, B.D. Effect of pH and soil environment. World News Nat. Sci. 2017, 8, 50–60. [Google Scholar]
  109. Wilson, M.; Bell, N. Acid deposition and heavy metal mobilization. Appl. Geochem. 1996, 11, 133–137. [Google Scholar] [CrossRef]
  110. Kim, R.-Y.; Yoon, J.-K.; Kim, T.-S.; Yang, J.E.; Owens, G.; Kim, K.-R. Bioavailability of heavy metals in soils: Definitions and practical implementation—A critical review. Environ. Geochem. Health 2015, 37, 1041–1061. [Google Scholar] [CrossRef] [PubMed]
  111. Zhang, X.P.; Deng, W.; Yang, X.M. The background concentrations of 13 soil trace elements and their relationships to parent materials and vegetation in Xizang (Tibet), China. J. Asian Earth Sci. 2002, 21, 167–174. [Google Scholar] [CrossRef]
  112. Wang, Z.; Hong, C.; Xing, Y.; Wang, K.; Li, Y.; Feng, L.; Ma, S. Spatial distribution and sources of heavy metals in natural pasture soil around copper-molybdenum mine in Northeast China. Ecotoxicol. Environ. Saf. 2018, 154, 329–336. [Google Scholar] [CrossRef]
  113. Kosheleva, N.E.; Kasimov, N.S.; Vlasov, D.V. Factors of the accumulation of heavy metals and metalloids at geochemical barriers in urban soils. Eurasian Soil Sci. 2015, 48, 476–492. [Google Scholar] [CrossRef]
  114. Khorshid, M.S.H.; Thiele-Bruhn, S. Contamination status and assessment of urban and non-urban soils in the region of Sulaimani City, Kurdistan, Iraq. Environ. Earth Sci. 2016, 75, 1171. [Google Scholar] [CrossRef]
  115. Šimanský, V.; Bajčan, D.; Ducsay, L. The effect of organic matter on aggregation under different soil management practices in a vineyard in an extremely humid year. Catena 2013, 101, 108–113. [Google Scholar] [CrossRef]
  116. Purakayastha, T.; Rudrappa, L.; Singh, D.; Swarup, A.; Bhadraray, S. Long-term impact of fertilizers on soil organic carbon pools and sequestration rates in maize–wheat–cowpea cropping system. Geoderma 2008, 144, 370–378. [Google Scholar] [CrossRef]
  117. Cong, W.-F.; van Ruijven, J.; Mommer, L.; De Deyn, G.B.; Berendse, F.; Hoffland, E. Plant species richness promotes soil carbon and nitrogen stocks in grasslands without legumes. J. Ecol. 2014, 102, 1163–1170. [Google Scholar] [CrossRef]
  118. Sistla, S.A.; Moore, J.C.; Simpson, R.T.; Gough, L.; Shaver, G.R.; Schimel, J.P. Long-term warming restructures Arctic tundra without changing net soil carbon storage. Nature 2013, 497, 615–618. [Google Scholar] [CrossRef]
  119. Körschens, M.; Albert, E.; Armbruster, M.; Barkusky, D.; Baumecker, M.; Behle-Schalk, L.; Bischoff, R.; Čergan, Z.; Ellmer, F.; Herbst, F.; et al. Effect of mineral and organic fertilization on crop yield, nitrogen uptake, carbon and nitrogen balances, as well as soil organic carbon content and dynamics: Results from 20 European long-term field experiments of the twenty-first century. Arch. Agron. Soil Sci. 2013, 59, 1017–1040. [Google Scholar] [CrossRef]
  120. Von Lützow, M.; Kögel-Knaber, I. Temperature sensitivity of soil organic matter decomposition—What do we know? Biol. Fert. Soils 2009, 46, 1–15. [Google Scholar] [CrossRef]
  121. Tarnocai, C.; Canadell, J.; Schuur, E.A.G.; Kuhry, P.; Mazhitova, G.; Zimov, S. Soil organic carbon pools in the northern circumpolar permafrost region. Glob. Biogeochem. Cycles 2009, 23, 1–11. [Google Scholar] [CrossRef]
  122. Conant, R.T.; Ryan, M.G.; Agren, G.I.; Birge, H.E.; Davidson, E.A.; Eliasson, P.E.; Evans, S.E.; Frey, S.D.; Giardina, C.H.P.; Hopkins, F.M.; et al. Temperature and soil organic matter decomposition rates—synthesis of current knowledge and a way forward. Glob. Chang. Biol. 2011, 17, 3392–3404. [Google Scholar] [CrossRef]
  123. Scharlemann, J.; Tanner, E.V.; Hiederer, R.; Kapos, V. Global soil carbon: Understanding and managing the largest terrestrial carbon pool. Carbon Manag. 2014, 5, 81–91. [Google Scholar] [CrossRef]
  124. Wiesmeier, M.; Poeplau, C.; Sierra, C.; Maier, H.; Frühauf, C.; Hübner, R.; Kühnel, A.; Spoerlein, P.; Geuß, U.; Hangen, E.; et al. Projected loss of soil organic carbon in temperate agricultural soils in the 21st century: Effects of climate change and carbon input trends. Sci. Rep. 2016, 6, 1–17. [Google Scholar] [CrossRef] [PubMed] [Green Version]
  125. Haring, V.; Fischer, H.; Cadisch, G.; Stahr, K. Implication of erosion on the assessment of decomposition and humification of soil organic carbon after land use change in tropical agricultural systems. Soil Biol. Biochem. 2013, 65, 158–167. [Google Scholar] [CrossRef]
  126. Jiang, G.; Xu, M.; He, X.; Zhang, W.; Huang, S.; Yang, X.; Liu, H.; Peng, C.; Shirato, Y.; Iizumi, T.; et al. Soil organic carbon sequestration in upland soils of northern China under variable fertilizer management and climate change scenarios. Glob. Biogeochem. Cycles 2014, 28, 319–333. [Google Scholar] [CrossRef]
  127. Nayak, A.; Gangwar, B.; Shukla, A.K.; Mazumdar, S.P.; Kumar, A.; Raja, R.; Kumar, A.; Kumar, V.; Rai, P.; Mohan, U. Long-term effect of different integrated nutrient management on soil organic carbon and its fractions and sustainability of rice–wheat system in Indo Gangetic Plains of India. Field Crops Res. 2012, 127, 129–139. [Google Scholar] [CrossRef]
  128. Lal, R.; Kimble, J.M.; Follett, R.F.; Cole, C.V. The Potential of U.S. Cropland to Sequester Carbon and Mitigate the Greenhouse Effect; Sleeping Bear Press: Chelsea, MI, USA, 1998; 128p. [Google Scholar]
  129. Liu, X.; Han, X.; Song, C.; Herbert, S.J.; Xing, B. Soil Organic Carbon Dynamics in Black Soils of China Under Different Agricultural Management Systems. Commun. Soil Sci. Plant Anal. 2003, 34, 973–984. [Google Scholar] [CrossRef]
  130. Brady, N.C.; Weil, R.R. The Nature and Properties of Soils, 14th ed.; Pearson Education Inc.: Upper Saddle River, NJ, USA, 2008; 965p. [Google Scholar]
  131. Syswerda, S.; Corbin, A.; Mokma, D.; Kravchenko, A.; Robertson, G. Agricultural Management and Soil Carbon Storage in Surface vs. Deep Layers. Soil Sci. Soc. Am. J. 2011, 75, 92–101. [Google Scholar] [CrossRef] [Green Version]
  132. Rumpel, C.; Kögel-Knabner, I. Deep soil organic matter—a key but poorly understood component of terrestrial C cycle. Plant Soil 2011, 338, 143–158. [Google Scholar] [CrossRef]
  133. Zhang, W.; Xu, M.; Wang, B.; Wang, X. Soil organic carbon, total nitrogen and grain yields under long-term fertilizations in the upland red soil of southern China. Nutr. Cycl. Agroecosystems 2008, 84, 59–69. [Google Scholar] [CrossRef]
  134. Zhang, J.; Balkovič, J.; Azevedo, L.B.; Skalský, R.; Bouwman, A.F.; Xu, G.; Wang, J.; Xu, M.; Yu, C. Analyzing and modelling the effect of long-term fertilizer management on crop yield and soil organic carbon in China. Sci. Total Environ. 2018, 627, 361–372. [Google Scholar] [CrossRef]
  135. Galati, A.; Crescimanno, M.; Gristina, L.; Keesstra, S.; Novara, A. Actual provision as an alternative criterion to improve the efficiency of payments for ecosystem services for C sequestration in semiarid vineyards. Agric. Syst. 2016, 144, 58–64. [Google Scholar] [CrossRef]
  136. Guo, J.H.; Liu, X.J.; Zhang, Y.; Shen, J.L.; Han, W.X.; Zhang, W.F.; Christie, P.; Goulding, K.; Vitousek, P.M.; Zhang, F.; et al. Significant Acidification in Major Chinese Croplands. Science 2010, 327, 1008–1010. [Google Scholar] [CrossRef] [PubMed] [Green Version]
  137. Paľove-Balang, P. Príjem a Transport Minerálnych Látok v Rastlinách; Univerzita Pavla Jozefa Šafárika: Košice, Slovakia, 2012; pp. 11–12. [Google Scholar]
  138. Filippi, P.; Cattle, S.R.; Bishop, T.; Odeh, I.O.; Pringle, M.J. Digital soil monitoring of top- and sub-soil pH with bivariate linear mixed models. Geoderma 2018, 322, 149–162. [Google Scholar] [CrossRef]
  139. Marchant, B.P.; Crawford, D.M.; Robinson, N.J. What can legacy datasets tell us about soil quality trends? Soil acidity in Victoria. In Proceeding of the IOP Conference Series: Earth and Environmental Science, Bendigo, Australia, 24–27 March 2014. [Google Scholar]
  140. Bowman, W.D.; Cleveland, C.C.; Halada, Ĺ.; Hreško, J.; Baron, J.S. Negative impact of nitrogen deposition on soil buffering capacity. Nat. Geosci. 2008, 1, 767–770. [Google Scholar] [CrossRef]
  141. Bielek, P. Kompendium Praktického Pôdoznalectva, 1st ed.; Slovenská poľnohospodárska Univerzita: Nitra, Slovakia, 2014; 244p. [Google Scholar]
  142. Xing, W.; Zhang, H.; Scheckel, K.G.; Li, L. Heavy metal and metalloid concentrations in components of 25 wheat (Triticum aestivum) varieties in the vicinity of lead smelters in Henan province, China. Environ. Monit. Assess. 2016, 188, 1–10. [Google Scholar] [CrossRef]
  143. Kumpiene, J.; Antelo, J.; Brännvall, E.; Carabante, I.; Ek, K.; Komárek, M.; Söderberg, C.; Wårell, L. In situ chemical stabilization of trace element-contaminated soil—Field demonstrations and barriers to transition from laboratory to the field—A review. Appl. Geochem. 2019, 100, 335–351. [Google Scholar] [CrossRef]
  144. Gao, X.; Brown, K.R.; Racz, G.J.; Grant, C.A. Concentration of cadmium in durum wheat as affected by time, source and placement of nitrogen fertilization under reduced and conventional-tillage management. Plant Soil 2010, 337, 341–354. [Google Scholar] [CrossRef]
  145. McLaughlin, M.J.; Smolders, E.; Degryse, F.; Rietra, R. Uptake of Metals from Soil into Vegetables. In Dealing with Contaminated Sites; Swartjes, F., Ed.; Springer: Dordrecht, The Netherland, 2011; pp. 325–367. [Google Scholar]
  146. Shaheen, S.; Rinklebe, J. Impact of emerging and low cost alternative amendments on the (im)mobilization and phytoavailability of Cd and Pb in a contaminated floodplain soil. Ecol. Eng. 2015, 74, 319–326. [Google Scholar] [CrossRef]
  147. Chaney, R.L. Food Safety Issues for Mineral and Organic Fertilizers. Adv. Agron. 2012, 117, 51–116. [Google Scholar] [CrossRef]
  148. Soltani, S.M.; Hanafi, M.M.; Wahid, S.A.; Kharidah, S.M.S. Zinc fractionation of tropical paddy soils and their relationships with selected soil properties. Chem. Speciat. Bioavailab. 2015, 27, 53–61. [Google Scholar] [CrossRef]
  149. Antoniadis, V.; Shaheen, S.; Tsadilas, C.; Selim, M.H.; Rinklebe, J. Zinc sorption by different soils as affected by selective removal of carbonates and hydrous oxides. Appl. Geochem. 2018, 88, 49–58. [Google Scholar] [CrossRef]
  150. Cakmak, I.; Kutman, U.B. Agronomic biofortification of cereals with zinc: A review. Eur. J. Soil Sci. 2018, 69, 172–180. [Google Scholar] [CrossRef] [Green Version]
  151. Peijnenburg, W.J.; Zablotskaja, M.; Vijver, M.G. Monitoring metals in terrestrial environments within a bioavailability framework and a focus on soil extraction. Ecotoxicol. Environ. Saf. 2007, 67, 163–179. [Google Scholar] [CrossRef]
  152. Norouzi, S.; Khademi, H.; Cano, A.F.; Acosta, J. Using plane tree leaves for biomonitoring of dust borne heavy metals: A case study from Isfahan, Central Iran. Ecol. Indic. 2015, 57, 64–73. [Google Scholar] [CrossRef]
  153. Demková, L.; Árvay, J.; Bobulská, L.; Tomáš, J.; Stanovič, R.; Lošák, T.; Harangozo, L.; Vollmannová, A.; Bystrická, J.; Musilová, J.; et al. Accumulation and environmental risk assessment of heavy metals in soil and plants of four different ecosystems in a former polymetallic ores mining and smelting area (Slovakia). J. Environ. Sci. Health Part A 2017, 52, 479–490. [Google Scholar] [CrossRef] [PubMed]
  154. Galati, A.; Schifani, G.; Crescimanno, M.; Vrontis, D.; Migliore, G. Innovation strategies geared toward the circular economy: A case study of the organic olive-oil industry. RivISTA. Studi Sulla Sostenibilita 2018, 2018, 137–158. [Google Scholar] [CrossRef]
  155. Galati, A.; Gristina, L.; Crescimanno, M.; Barone, E.; Novara, A. Towards More Efficient Incentives for Agri-environment Measures in Degraded and Eroded Vineyards. Land Degrad. Dev. 2015, 26, 557–564. [Google Scholar] [CrossRef]
  156. International Organization for Standardization. ISO 22000: 2018 Food Safety Management Systems—Requirements for Any Organization in the Food Chain, 2nd ed.; International Organization for Standardization: Geneva, Switzerland, 2018. [Google Scholar]
Figure 1. Monitored area (Localities I–III).
Sustainability 13 07021 g001
Table 1. Zlaté Moravce-Prílepy: monitored area of soil sampling.
LocalitiesCoordinatesType of LandUse of SitesSoil Unit Designation
According to BPEJ 1
Locality I48°21′53.5″ N
18°24′59.4″ E
Arable landFor growing wheatsBrown soils typical, on loess, medium (moderate)-heavy
Locality II48°22′01.1″ N
18°24′55.6″ E
Arable landFor growing wheatsBrown soils (type) on
loess clays, heavy
Locality III48°22′25.3″ N
18°25′01.8″ E
Arable landFor growing wheatsBrown soils typical, on loess, medium (moderate)-heavy
1 [71] designation according to BPEJ (BPEJ is the soil evaluation method on the territory and nationally used table for classifying how land is used). For example: brown soils typical, on loess, medium (moderate)-heavy is classified as number 44, which classifies its parts, structure, system of updating, and its use by evaluation of soil. BPEJ: Categorization of soil-ecological units.
Table 2. The content of heavy metals (mg·kg−1) at Locality I.
Metal Concentration201720182019
SpringAve ± SDMinMaxAve ± SDMinMaxAve ± SDMinMax
Cd1.32 ± 0.590.201.800.96 ± 0.480.201.401.72 ± 0.481.202.40
Cu16.00 ± 1.3914.4017.6019.68 ± 0.5719.0020.6019.04 ± 2.8216.0024.40
Pb45.60 ± 6.1236.0054.0056.76 ± 1.8254.9459.9465.68 ± 3.0162.5270.56
Zn51.91 ± 2.3748.5254.8271.20 ± 5.8864.0080.0063.20 ± 16.3338.0080.00
AutumnAve ± SDMinMaxAve ± SDMinMaxAve ± SDMinMax
Cd2.32 ± 0.481.402.801.52 ± 0.101.401.600.92 ± 0.390.401.60
Cu20.48 ± 2.3318.4025.0019.88 ± 1.7218.2022.6018.92 ± 0.4918.4019.80
Pb59.42 ± 14.7247.7087.9058.64 ± 8.0149.5070.9244.9 ± 7.8334.9652.40
Zn55.20 ± 14.7346.0084.0060.00 ± 11.1040.0074.0052.40 ± 9.9140.0066.00
Notice: Ave ± SD = Average ± Standard Deviation. Min = min. value; Max = max. value.
Table 3. The content of heavy metals (mg·kg−1) at Locality II.
Metal Concentration201720182019
SpringAve ± SDMinMaxAve ± SDMinMaxAve ± SDMinMax
Cd1.56 ± 0.151.401.801.48 ± 0.161.201.600.80 ± 0.670.201.80
Cu16.96 ± 0.7016.0018.0021.28 ± 0.9220.0022.8020.96 ± 0.8220.0022.00
Pb46.00 ± 6.3238.0056.0054.80 ± 7.7646.0066.0079.60 ± 2.9476.0084.00
Zn54.692 ± 2.0252.3656.9462.05 ± 3.4957.0667.1863.56 ± 2.6560.2866.54
AutumnAve ± SDMinMaxAve ± SDMinMaxAve ± SDMinMax
Cd2.48 ± 0.322.002.801.68 ± 0.101.601.801.16 ± 0.230.801.40
Cu21.60 ± 0.6620.4022.4019.68 ± 0.8118.6020.4019.72 ± 1.1218.0021.00
Pb47.20 ± 3.2542.0052.0065.60 ± 14.1138.0078.0070.40 ± 4.9666.0080.00
Zn61.80 ± 5.8954.7672.5865.22 ± 8.0454.9274.6655.24 ± 6.9445.0463.20
Notice: Ave ± SD = Average ± Standard Deviation. Min = min. value; Max = max. value.
Table 4. The content of heavy metals (mg·kg−1) at Locality III.
Metal Concentration201720182019
SpringAve ± SDMinMaxAve ± SDMinMaxAve ± SDMinMax
Cd1.44 ± 0.411.002.201.44 ± 0.271.001.801.04 ± 0.230.801.40
Cu14.56 ± 12.6012.6016.0019.40 ± 2.9015.6022.4018.60 ± 1.9915.8020.60
Pb41.60 ± 3.8836.0046.0052.00 ± 4.9044.0058.0077.60 ± 1.9676.0080.00
Zn48.30 ± 2.6944.3652.4455.10 ± 4.7749.2861.1257.20 ± 2.8152.4660.86
AutumnAve ± SDMinMaxAve ± SDMinMaxAve ± SDMinMax
Cd2.52 ± 0.272.002.801.60 ± 0.131.401.801.16 ± 0.390.801.80
Cu17.52 ± 0.9816.4018.8019.36 ± 1.2017.4021.0018.44 ± 2.2915.2021.00
Pb41.60 ± 4.9632.0046.0067.60 ± 4.0862.0074.0065.60 ± 5.5760.0076.00
Zn52.10 ± 6.4244.6462.7058.08 ± 4.7450.7863.8656.44 ± 18.6733.8486.66
Notice: Ave ± SD = Average ± Standard Deviation. Min = min. value; Max = max. value.
Table 5. Correlation coefficients between heavy metals contents (Cd, Cu, Pb, and Zn) at Localities I–III.
Season2017–2019 (Spring) 2017–2019 (Autumn)
Metal cont. 1CuCdPbMetal cont. 1CuCdPb
Zn0.5903−0.02770.6613Zn0.70370.00720.5885
Locality ICu-−0.45860.8088Cu-−0.03630.6697
Cd -−0.4947Cd--−0.3004
Locality IIZn0.9272−0.53750.5655Zn0.35160.14020.2478
Cu-−0.47930.4919Cu-0.5262−0.2480
Cd -−0.3224Cd -−0.5971
Locality IIIZn0.8704−0.21380.5653Zn0.8853−0.46270.4758
Cu-−0.29290.4018Cu-−0.55010.5829
Cd--−0.2977Cd--−0.7186
1 Metal cont. = Metal contaminant.
Table 6. (a) pH(H2O) values (spring, autumn 2017–2019). (b) pH(KCl) values (spring, autumn 2017–2019).
(a)
Localities201720182019
SpringAve ± SDMinMaxMedianAve ± SDMinMaxMedianAve ± SDMinMaxMedian
Locality I6.41 ± 0.116.266.606.406.21 ± 0.175.966.466.156.78 ± 0.056.716.866.76
Locality II7.09 ± 0.057.007.157.087.38 ± 0.057.327.457.377.64 ± 0.057.567.717.63
Locality III7.22 ± 0.077.127.317.227.56 ± 0.087.467.667.527.55 ± 0.097.467.707.50
AutumnAve ± SDMinMaxMedianAve ± SDMinMaxMedianAve ± SDMinMaxMedian
Locality I
Locality II
Locality III
6.40 ± 0.106.246.536.416.84 ± 0.096.757.016.817.03 ± 0.066.957.107.03
6.59 ± 0.176.416.806.527.76 ± 0.057.717.847.777.18 ± 0.246.767.437.31
6.81 ± 0.296.417.156.837.59 ± 0.147.407.857.497.65 ± 0.097.507.767.66
(b)
Localities201720182019
SpringAve ± SDMinMaxMedianAve ± SDMinMaxMedianAve ± SDMinMaxMedian
Locality I6.06 ± 0.075.956.156.085.15 ± 0.284.815.525.055.29 ± 0.314.805.655.31
Locality II6.64 ± 0.236.256.966.636.33 ± 0.186.116.556.306.35 ± 0.336.086.926.11
Locality III6.80 ± 0.136.616.956.826.71 ± 0.196.426.896.826.65 ± 0.076.556.726.67
AutumnAve ± SDMinMaxMedianAve ± SDMinMaxMedianAve ± SDMinMaxMedian
Locality I
Locality II
Locality III
5.09 ± 0.134.895.245.055.59 ± 0.275.245.955.575.57 ± 0.265.145.815.73
5.49 ± 0.055.435.565.476.48 ± 0.306.106.836.476.37 ± 0.196.066.616.34
6.05 ± 0.105.876.146.116.76 ± 0.086.646.876.766.64 ± 0.086.536.766.62
Table 7. Correlation coefficients between concentrations of heavy metals and p(H2O) values at Localities I–III in 2017–2019 (spring and autumn).
Metal ContaminantLocality ILocality IILocality III
pHspringautumnspringautumnspringautumn
Cd0.3915−0.7265−0.3368−0.3103−0.0481−0.6234
Cu−0.2023−0.08590.5558−0.68940.2543−0.0484
Pb−0.07440.26170.84200.33240.66370.5633
Zn0.5594−0.27500.64400.18950.2272−0.2466
Table 8. Average TOC content (%) at Localities I–III in 2017–2019 (spring and autumn).
TOC ContentLocalities
IIIIII
Years201720182019201720182019201720182019
TOC spring1.320.870.881.031.340.901.231.601.43
TOC spring Ave.1.021.091.42
TOC autumn1.041.101.181.080.951.311.241.461.22
TOC autumn Ave.1.111.221.31
Note: Ave. = Average.
Table 9. Mann–Whitney test results (spring–autumn).
Monitor CharacterSpring–Autumn
Zp-Value
pH(H2O)−4.2380.000 1
pH(KCl)−1.3970.162
TOC0.4370.662
1 Statistically different values.
Table 10. Multiple comparison of pH values (pH(H2O) and pH(KCl)) spring period.
LocalitiespH(H2O)pH(KCl)
Locality ILocality IILocality IIILocality ILocality IILocality III
Locality I-0.28800.0003 1-0.15760.0010 1
Locality II -1.0000 -1.0000
Locality III - -
1 Statistically different values.
Table 11. Multiple comparison of pH values (pH(H2O and pH(KCl)) autumn period.
LocalitiespH(H2O)pH(KCl)
Locality ILocality IILocality IIILocality ILocality IILocality III
Locality I-1.00000.0200 1-0.48440.0080 1
Locality II -1.0000 -1.0000
Locality III - -
1 Statistically different values.
Table 12. Average content of heavy metals in soil samples (in 1 mol·dm−3 leachate NH4NO3) in 2017–2019.
LocalitiesSeasonsCd 1Cu 1Pb 1Zn 1
(mg·kg−1)(mg·kg−1)(mg·kg−1)(mg·kg−1)
Locality ISpring0.080.640.251.28
Autumn0.060.630.711.25
Locality IISpring0.040.670.261.34
Autumn0.080.870.991.22
Locality IIISpring0.040.660.351.32
Autumn0.070.671.051.33
1 The limit value for heavy metals in relation to agricultural land and plant-critical values (in mg kg−1 dry matter in leachate 1 mol·dm−3 NH4NO3) for Cd = 0.1 mg kg−1, Cu = 1.0 mg kg−1, Pb = 0.1 mg kg−1, and Zn = 2.0 mg kg−1 [76].
Table 13. Average contents of heavy metals in plant samples (dry material in mg kg−1) in 2017–2019.
LocalitiesPart of PlantCdCuPbZn
Locality Iroot0.3015.502.4061.95
stalk0.002.000.608.14
leaf0.002.901.703.54
grain0.004.400.0025.47
Locality IIroot0.3022.102.6085.41
stalk0.001.800.755.65
leaf0.003.601.804.00
grain0.004.100.0018.38
Locality IIIroot0.2018.002.9044.40
stalk0.007.200.8513.66
leaf0.006.401.8516.38
grain0.004.200.0021.98
Table 14. Bioaccumulation coefficient for potential heavy metals.
Arable SoilsSeasonsBioaccumulation Coefficient
CdCuPbZn
Locality ISpring4.670.730.090.63
Autumn0.000.790.080.53
Locality IISpring6.000.630.060.53
Autumn3.330.660.070.56
Locality IIISpring4.000.560.070.61
Autumn4.000.590.090.89
Publisher’s Note: MDPI stays neutral with regard to jurisdictional claims in published maps and institutional affiliations.

