Article

Impacts of Urbanization and Technology on Carbon Dioxide Emissions of Yangtze River Economic Belt at Two Stages: Based on an Extended STIRPAT Model

1
College of Economics and Management, Nanjing University of Aeronautics and Astronautics, Nanjing 211106, China
2
College of Management, Nanjing University of Posts and Telecommunications, Nanjing 210003, China
*
Author to whom correspondence should be addressed.
Sustainability 2021, 13(13), 7022; https://doi.org/10.3390/su13137022
Submission received: 14 May 2021 / Revised: 12 June 2021 / Accepted: 17 June 2021 / Published: 22 June 2021

Abstract

:
In the Yangtze River Economic Belt (YREB), one of the most important challenges at present is to promote green, low-carbon development. This study attempted to explore the impact of different dimensions of urbanization and technology on CO2 emissions at different stages in YREB by using an extended STIRPAT model on provincial panel data from 2000 to 2017. To examine the change differences based on the different effects of urbanization and technology on CO2 emissions, we divided the total study period into two stages according to the change trends of CO2 emissions and considered the YREB as a whole as well as the lower, middle, and upper reaches individually. The main findings are as follows. First, an inverted U relationship was found between economic urbanization and CO2 emissions for the entire study period along with the period of a rapid rise in CO2 emissions (Stage I) only in YREB and the upper reaches, while in the stable change period (Stage II), the inverted U relationship existed in the upper and lower reaches. An inverted U relationship between technology and CO2 emissions was only found in the middle reaches for Stage I and in the middle and lower reaches for Stage II. Second, during the entire study period, economic urbanization had the greatest inhibitory effect on carbon dioxide emissions, followed by energy intensity and population urbanization; during Stage I, the main reduction factors were economic urbanization and energy intensity, and population urbanization had a non-significant impact. Third, per capita gross domestic product (GDP) and population size had a positive impact on CO2 emission increases. Specifically, during Stage II, the fitting effect was not good (R2 is 0.3948), and the whole formula was not significant. In lower reaches, the economic urbanization had a positive impact at Stage I, the energy intensity had a rebound effect and per capita GDP had a non-significant impact at Stage II.

1. Introduction

In recent years there has been an increasing number of extreme weather events caused by global warming, which has generated a significant impact on the economic and social development of various countries around the world and has raised great concerns among various governments and international organizations. In the UN Climate Summit held in September 2019, Chinese representatives once again affirmatively declared that China would earnestly perform its obligations under the United Nations Framework Convention on Climate Change (UNFCCC) and Paris Agreement, and would duly realize the submitted Intended Nationally Determined Contribution (INDC). In other words, efforts will be made to reduce the carbon dioxide emission per unit of GDP by 60~65% by 2030 from its level in 2005, achieve the peak carbon dioxide emission around 2030, and reach the peak value as soon as possible. In order to achieve this objective, China has rigorously developed a green low-carbon economy in recent years based on the concept that “lucid waters and lush mountains are invaluable assets.” The Yangtze River Economic Belt (YREB) is a convergence zone in the Belt and Road Initiative of China. The rapid development of this economy has made GDP increase sharply. According to the Center for Yangtze River Delta and Economic Belt Research [1], in 2018, the total GDP of 11 provinces and municipalities in YREB accounted for 44.76% of the national total and increased by nearly 1 percentage point compared with the year before. General Secretary Xi Jinping has emphasized many times that priority should be given to ecologically friendly and green development in YREB. Under the guidance of policies, has there been any significant change in the characteristics of carbon dioxide emissions in YREB? When the characteristics of these emissions change, how to control them and sustain a high quality of development becomes an important question. Moreover, the overall population of YREB accounts for more than 40% of the national population. According to statistical data from the National Bureau of Statistics of China [2], the development of urbanization increased rapidly, and the proportion of the urban population in YREB increased from 41.3% in 2005 to 58.3% in 2018. Improvement in urbanization promotes economic growth, which enables the centralized and optimized allocation of resources and promotes improvement in technological development. YREB has a significant strategic position in China. It traverses East, West, and Central China and has unique advantages in terms of scientific research and talent. As the urbanization and technological development of YREB are both in the lead in China, what is the influence of urbanization and technology on carbon dioxide emissions? Can the emission reduction effect of technological progress offset the increase in demand caused by urban development and economic development? Consequently, it is necessary to discuss the influence of urbanization and technological development on CO2 emissions during the economic development of YREB.
Previous studies on the relationship between urbanization, technology development, and carbon dioxide emissions can fall into three strands. The first focuses on the relationship between urbanization and CO2 emissions. In this group, some scholars have found that the development of urbanization has led to the increase in CO2 emissions. Ali et al. [3] (2019) investigated the impact of urbanization on CO2 emissions in Pakistan, and their results show that urbanization would cause the increase in CO2 emissions in both the long run and the short run, and the results of Granger causality tests show that there was unidirectional causality from urbanization to CO2 emissions. In the research of Abbasi et al. [4] (2020) on the influence of urbanization on CO2 emissions in eight Asian countries, they found that urbanization had positive and important effects on CO2 emissions. Similar research results were found by Kang et al. [5] (2020), Wang and Su [6] (2019), Nosheen et al. [7] (2020) and Li et al. [8] (2015)—they all found that urbanization was an important factor causing the increase in CO2 emissions. On the other hand, some scholars found that the development of urbanization led to the decrease in CO2 emissions. For example, in their research involving five African countries, Lin et al. [9] (2016) found that urbanization presented a significantly negative correlation with CO2 emissions. According to the study of Yu et al. [10] (2020), city size showed a negative correlation with CO2 emissions based on urban agglomeration in the Yangtze River Delta in China, and they also found that the carbon emission efficiency of urban agglomeration was higher. Other scholars have studied the relationship between the two from different dimensions. Wang et al. [11] (2017) discussed the influence of urbanization development on CO2 emissions from the three dimensions—economic urbanization, land urbanization and population urbanization—and their results show that all three dimensions had a positive impact on CO2 emissions. In their research based on the space panel model, Fan et al. [12] (2019) found that the urbanization level had a direct negative influence on CO2 emissions, but the spatial spillover effect was significantly positive. Based on the investigation of three major urban agglomerations in China, Hu et al. [13] (2015) found that the relationship between urbanization and CO2 emissions was exactly opposite in the three urban agglomerations: in the Yangtze River Delta Area, urbanization had a significant inhibition effect on CO2 emissions; in the Beijing–Tianjin–Hebei area, urbanization presented a significant promotion of CO2 emissions; in the Pearl River Delta region, urbanization and CO2 emission presented a U-shape curve relationship.
The second strand of studies concentrates its attention on the relationship between the level of technology and CO2 emission. The research of Yang et al. [14] (2019) revealed that technological progress is the main factor that positively affects CO2 emission reduction at present. Hu’s [15] (2018) research on agricultural CO2 emission showed that the progress achieved in agricultural technology had a significant effect on reducing agricultural emissions. Hashmi and Alam [16] showed that a 1% increase in environmentally friendly patents reduces carbon emissions by 0.017%. Some researchers found that there were different influences between the level of technology and CO2 emission when different income levels were considered. In their research on the different development stages of Xinjiang, Wang et al. [17] (2017) found that, before the adoption of the reform and opening-up policy, technological progress led to the increase in CO2 emission, but after the reform and opening-up, technological progress was an important contributor to carbon emission reduction. The findings of Shuai et al. [18] (2017) showed that the higher the income level was, the greater the impact technology had on CO2 emission. Although technological progress is the main approach for emissions reduction, some studies have revealed that there was little effect between technology and CO2 emission. Charfeddine and Kahia [19] (2019) evaluate the impact of renewable energy on CO2 emission; their finding showed renewable energy only had a slight influence on emissions. Some studies have found there was a rebound effect of CO2 emission on technological progress [20]. Cheng et al. [21] (2018) found that the impact of technological change on CO2 emission was not significant because of the rebound effect of CO2 emission.
The third strand investigates the impact of both urbanization and the level of technology on carbon dioxide emissions. Jin et al. [22] (2019) found that, although technological progress had reduced emissions, it could not offset the indirect emissions caused by the large amount and rapid growth of urban residents’ consumption. Arshed et al. [23] (2021) explored the impact of urbanization and technology on CO2 emission in terms of agriculture, service, and industry sectors. Their results showed technology could control the emissions, urbanization increased the emissions, while in the services sector, urbanization reduced emissions.
According to current research results, economic growth is often accompanied by the progress of urbanization and technology. Both at the national level (e.g., [3,4,5,16]) and at the provincial level (e.g., [21]), similar results have been found. However, most existing works regard urbanization or technology as a single variable, and few studies investigate the influence of urbanization and technology on carbon dioxide emissions at the same time. YREB spans the eastern, central, and western regions in China, which represent different levels of economic development, urbanization, and technology. Therefore, in this paper, we explore the influence of both urbanization and technology on emissions of YREB from 2000 to 2017. According to the Environmental Kuznets Curve (EKC) hypothesis [24], the relationship between economic growth and pollutants is an inverse U-shape curve; many researchers have examined the existence of EKC between economic growth and emissions. Some studies have confirmed the existence of EKC curves [25,26], and others have verified other shapes of curves, such as U-shape [23], inverse N-shape [27] and N-shape [28]. Based on the EKC hypothesis, we also explore whether the impact of urbanization and technological development on emissions presents a Kuznets curve, which will be discussed in the later section.
In terms of research objects, many of them are countries [16,18,19,29,30,31]. In the study of China, researchers generally take industries [32], provinces [33] and important economic regions of Beijing–Tianjin–Hebei [34] and the Yangtze River Delta [10] as research objects, while few studies consider YREB. In terms of research methods, some researchers have used econometric models, such as the ARDL-VECM model, to explore the long-term co-integration relationship between influencing factors and carbon dioxide emissions, as well as the short-term effect, and to test whether Granger causality exists between the variables [3,4]; the spatial panel econometric model has been used to investigate the spatial correlation of variables [11,12,21]; the panel threshold regression model has been used to explore the impact of variables on emissions in different stages [35,36]. Some researchers have used the extended STIRPAT model and considered not only the impact of population, affluence, and technology on emissions, but also the influence of urbanization [8,9,13,22], foreign direct investment [8,37], energy structure [9,17], and industrial structure [10,13]. The STIRPAT model has been widely used because of its good ductility. Consequently, this paper employs the extended STIRPAT model to explore the influence of population, affluence, urbanization and the level of technology on emissions in YREB. Most researchers have divided the research samples into several stages by income level or economic development [17,18], but few have divided by the different changes in emissions. Promoted by government policies, the effects of energy saving and emissions reduction have begun to show, so we separated the samples into two stages with the trends of CO2 emission, used the extended STIRPAT model separately in the different stages and attempted to find changes in the influence factors.

2. Methods and Data

2.1. Carbon Dioxide Emissions Estimation Model

There are no direct statistics of carbon dioxide emissions in the statistical yearbook. The common practice is to estimate based on energy consumption. Chen [38] (2011) classified the different carbon dioxide emissions estimation methods into two categories: top-down and bottom-up accounting. The top-down CO2 emission accounting system decomposes layer upon layer from top to bottom and has a wide use. Therefore, in this paper, a top-down accounting method of CO2 emissions refers to the 2006 IPCC Guidelines for National Greenhouse Gas Inventories (IPCC, 2006) [39], and the consumptions of eight primary energy types (coal, coke, crude oil, gasoline, kerosene, diesel, fuel oil and natural gas) from the China Energy Statistical Yearbook [40]. CO2 emissions estimation formula is as follows:
C = C i = i j E i j E F j
E F j = C F j · C C j · C O F j · 44 / 12
where C represents the total CO2 emissions; i denotes provinces and municipalities; Ci represents the CO2 emissions from province i; j denotes the energy type; Eij is the consumption of energy type j from province i; EFj is the CO2 emission factor of energy type j; CFj is the conversion factor for the fuel to the energy type j on a net calorific value basis; CCj is the carbon content of energy type j; COFj is the fraction of oxidized carbon of energy type j; 44/12 is the molecular weight ratio of CO2 to C. The CO2 emission factors of the eight energy types are shown in Table 1.

2.2. STIRPAT Model and Extension

Ehrlich and Holdren [41] (1970) proposed the IPAT theory, based on which, the environmental impacts are interpreted as population, affluence and technology, which is represented as
I = P × A × T
where I represents the environmental impact, P refers to the population, A refers to the affluence and T refers to the technology. However, such a quantitative equation assumes that the influences of various impact factors are proportional [42]. For example, if the population scale has doubled, its influence on the environment will also double, which is inconsistent with the reality. In order to address this limitation, Dietz and Rosa [43] (1994) extended the IPAT model and constructed the random model STIRPAT, which makes it easier to convert to a linear model and extend the model, so it has achieved broader applications. The basic formula of STIRPAT model is
It = aPtbAtcTtdet
where, I, P, A and T have the same meaning as in the IPAT model; a is the constant; b, c, and d are the elastic nexus of P, A, and T, respectively; e is the error term; t indicates year. The natural logarithm is taken on both sides, and Equation (4) is converted to a linear model:
lnIt = a + blnPt + clnAt + dlnTt + Ɛt
where, a and Ɛ are, respectively, the log of a and the log of e from Equation (4).
Equation (5) has been extended by other variables to analyze their impacts on CO2 emissions, as stated in the introduction. In order to investigate the influence of urbanization and technology on CO2 emissions, we extended Equation (5) by the urbanization and research and development efficiency, which may affect CO2 emissions. Furthermore, following Wang and Li [11,44], we divided urbanization into two dimensions: population urbanization and economic urbanization. Some researchers have added squared terms (e.g., urbanization [45,46], foreign direct investment [37]) into the model to examine the Kuznets curve relationship, so we used per capita GDP to represent affluence and used energy intensity (the GDP per unit standard coal of energy consumption) to represent technology, and the squared terms of the economic urbanization and energy intensity were extended to examine the Kuznets curve relationship between urbanization and CO2 emissions and between technology and CO2 emissions in YREB. Equation (5) can thus be extended as follows:
lnC i t = α 0 + α 1 lnP i t + α 2 lnPU i t + α 3 lnAGDP i t + α 41 lnEU i t + α 42 lnEU i t 2 + α 5 lnRE i t + α 61 lnEI i t + α 62 lnEI i t 2 + ε i t
where, i represents different provinces, t indicates the year, C is the total CO2 emissions, P is the total population, PU is population urbanization, measured as the proportion of urban household population in the total population; AGDP is per capita GDP; EU is economic urbanization, measured as the proportion of secondary and tertiary industries in GDP; RE is research and development (R&D) efficiency, measured as the number of domestic patent licenses; EI is energy intensity, measured as the energy use per unit of GDP; α is the parameter to be estimated; Ɛ is the random error term.
In Equation (6), if α41 > 0, and α42 < 0, the relationship between economic urbanization and carbon dioxide emissions presents an “inverted U-shape” curve; on the contrary, if α41 < 0 and α42 > 0, the relationship between economic urbanization and emissions presents a “U-shape” curve; if α41 ≠ 0 and α42 = 0, the relationship between economic urbanization and emissions is linear. α61 and α62 have the same meaning.

2.3. Estimation Procedure

We used the statistics software Stata STATA 15 (StataCorp LLC, College Station, TX, USA) for all our estimations. The estimation procedure is as follows: Step 1: A descriptive statistical method is used to analyze the characteristics of the changes in CO2 emissions. According to the changes in CO2 emissions, the research period was divided into different change stages.
Step 2: In order to ensure the effectiveness of estimated results and to prevent spurious regression, the panel unit root test is necessary. The IPS (Im-Pesaran-Shin) panel unit root test (Im, Pesaran and Shin, 2003 [47]) has the small sample properties. In this paper, N = 11, T = 18 and the IPS test is conducted. The LLC (Levin-Lin-Chu) test [18] as a common panel unit root test method is also used.
Step 3: The Kao test (Kao, 1999 [48]) is employed to verify the cointegration relationship among variables.
Step 4: STIRPAT is used to estimate the total study period and the different stages of CO2 emissions, and to explore the different effects of each variable on CO2 emissions. The F test and Hausman test are conducted to select the appropriate regression model in Stata. The panel-data model can be divided into a pooled regression model, a fixed effects regression model (FE), and a random effects regression model (RE). The F test is conducted to test whether the pooled model or the fixed effects regression model is more appropriate. If p > 0.05, the original hypothesis will be accepted, which indicates that the pooled model is superior to FE; on the contrary, if p ≤ 0.05, the original hypothesis will be rejected, which implies that FE should be selected. The Hausman test is carried out to test whether the fixed effects regression model or the random effects regression model is more appropriate. If p > 0.05, the RE should be chosen; on the contrary, if p ≤ 0.05, then the FE should be chosen.

2.4. Data Sources and Data Description

As some data of 2018 is unavailable, in this paper, balanced panel data are constructed by using nine provinces and two municipalities of YREB from 2000 to 2017. Since YREB spans nine provinces and two municipalities, in order to investigate the different influencing factors of carbon dioxide emissions in different regions, we divide YREB into three regions according to the distribution of urban agglomerations: the upper reaches (including Sichuan, Chongqing, Yunnan and Guizhou), the middle reaches (Hunan, Hubei, Jiangxi and Anhui), and the lower reaches (Jiangsu, Zhejiang and Shanghai). Definitions of variables in Equation (6) are given in Table 2. The energy-related CO2 emissions are estimated with Equation (1). The other variables are obtained from statistical yearbooks, where total population, household registered population, gross regional product, per capita gross regional product, and the number of domestic patent licenses were collected from China Statistical Yearbooks (2001–2018) [49], and energy consumption was collected from the China Energy Statistical Yearbook (2001–2018) [40]. In order to eliminate the price factor, GDP takes the price of 2000 as the constant price. The patent indicates the specific output of R&D input. A licensed patent is an achievement in novelty, creativity and practicality, while a pending patent in application might not be granted with the license, which cannot truly reflect the technological progress of economy and society, so we chose the number of patent licenses instead of the number of patent applications. As the number of foreign patent licenses cannot be collected, in this paper, RE is represented with the number of domestic patent licenses.
Figure 1 shows the changes in CO2 emissions in the YREB and in the upper, middle and lower reaches individually. In the YREB, we can divide the changes into two stages, the rapid growth from 2000 to 2011and the gentle growth from 2011 to 2017. With the continuous reduction of economic growth and the upgrading of the industrial structure [50], the carbon dioxide emissions of the YREB have little change from 2011 to 2017. The average annual growth rate of CO2 emissions in 2011–2017 was only 0.5%, and it was far lower than 9.2% in 2001–2011. There is a similar trend in CO2 emissions in the upper, middle and lower reaches. The value of CO2 emissions is the highest in the lower reaches, followed by the middle reaches and then the upper reaches.

3. Empirical Analysis of Panel Data

3.1. Unit Root Test and Co-Integration Test

Table 3 shows the results of the IPS panel unit root test and the LLC panel unit root test. The data both in level and first difference were input into IPS and LLC tests. As shown in Table 3, the level partly passes the LLC and IPS tests, while the first difference all significantly passes both tests under the level of 1%, and all the variables are stationary. Therefore, the cointegration test and regression analysis can be conducted.
The results of the co-integration test are listed in Table 4. In the table, “cointegrating vector: same” and “AR parameter: same” indicate that all panel units in the KAO test have the same cointegrating vector, and different individuals have the same autoregressive coefficient of the residual. In the lower part of Table 4, five different test statistics are reported. The statistics significantly reject the original hypothesis that “no cointegration exists”. That is, the cointegration relationship exists between the CO2 emissions and other variables, which means there are long-term stable relationships among variables.

3.2. Regression Results

The xtreg command in Stata was used for the panel regression of Equation (6). According to the F test and the Hausman test, the random effects regression model estimations for YREB, the upper reaches and the lower reaches and the fixed effect regression model estimation for the middle reaches are presented in Table 5.
In Table 5, the values of regression R-square are all above 0.9, which indicate that the model construction is reasonable and can well interpret the relationships between the dependent variable and independent variables.
The total population variable presents a positive and significant effect on CO2 emissions in the Yangtze River Economic Belt and the upper and the lower reaches, but the coefficient is not significant in the middle reaches.
The population urbanization variable indicates a negative and significant effect on CO2 emissions in the Yangtze River Economic Belt and the upper reaches; however, this variable shows a positive and significant effect in the middle and lower reaches.
The per capita GDP variable exerts a positive and significant influence in YREB and all three regions individually.
The economic urbanization variable presents a negative and significant effect on carbon dioxide emissions in YREB and the upper reaches, but the relationship is positive and non-significant in the middle and lower reaches. The coefficient of the square term of economic urbanization is significantly negative at the 1% level in YREB and the upper reaches, but the quadratic coefficient is non-significant in the middle and lower reaches.
The research and development (R&D) efficiency variable indicates a positive and significant effect on CO2 emissions, but the results are not significant in the upper, middle and lower reaches.
The energy intensity variable presents a positive and significant effect on carbon dioxide emissions in YREB and all three regions individually. The quadratic coefficient of the energy intensity is significantly negative only in the middle reaches.

3.3. Two Stage Regression Results

As shown in Figure 1, we classified the research period into two stages according to the trend of CO2 emissions. The first stage (I) is from 2000 to 2011, and the second stage (II) is from 2011 to 2017. Stage I is a rapid increasing period of change, while Stage II is a steady period of change. Equation (6) is used for a regression estimate for each stage. The results are shown in Table 6.
The total population variable presents a positive and significant effect on CO2 emissions in the Yangtze River Economic Belt and the upper and lower reaches in Stage I, but the coefficient is not significant in the middle reaches. In Stage II, it presents a positive and significant effect only in the upper reaches and a non-significant effect in the other regions.
The population urbanization variable at two stages are similar: there is a negative and significant effect on CO2 emissions in the upper reaches, and the results are non-significant in the YREB and the lower reaches. However, a positive and significant effect was found in the middle reaches.
The per capita GDP variable exerts a positive and significant influence in the YREB and the upper, middle and lower reaches in both stages, except in the lower reaches in Stage II, where the coefficient is not significant.
The economic urbanization variable presents a negative and significant effect on carbon dioxide emissions in the YREB and the upper reaches, but the relationship is positive and non-significant in the middle reaches and is positive and significant in the lower reaches in Stage I. A negative and significant effect is indicated in the upper and lower reaches, and the estimate results are non-significant in the YREB and the middle reaches in Stage II.
The research and development (R&D) efficiency variable indicates a negative and significant effect on CO2 emissions in the upper reaches in Stage I, while it presents a non-significant effect in the other regions in both stages.
The energy intensity variable presents a positive and significant effect on carbon dioxide emissions in the YREB and all three regions in both stages, except for the lower reaches in Stage II, for which a negative and significant effect is indicated.

4. Discussion

This part is divided into two parts: a discussion of the regression results and one of the regression results of the two stages.

4.1. Regression Results

Table 5 shows that the total population is one of the main causes of CO2 emission increases. In the YREB, the coefficient of population scale is 0.838. That is, a 1% increase in total population increases CO2 emissions by 0.838% with other variables remaining constant. This result implies that the expansion in population can lead to an increase in CO2 emissions. The research of many scholars has also shown that population is the main factor that affects emissions [8,10,17,18], and the products bought to meet their consumers’ requirements will cause an increase in emissions in an indirect manner [22].
The impact of population urbanization on CO2 emissions is quite different in different regions. The population urbanization level of the YREB and the upper reaches is not high and at a stage of fast growth, and the fast development of urbanization can generate a significant aggregation effect, which improves the industrial structure. Population urbanization can help optimize the industrial structure and improve urban sewage disposal facilities, and the agglomeration effect of resource concentration can reduce carbon dioxide emissions [13,51]. In the process of urbanization, a large portion of the rural population moves to cities and towns. The labor transfers from primary and secondary industries to tertiary industry, and the resource structure can become more optimized. Therefore, the inhibition effect, compared with the facilitation effect, of population urbanization on carbon dioxide emissions will then be greater due to the growth in the urban population in the YREB and the upper reaches. Therefore, the relationship between population urbanization and emissions is significantly negative in the YREB and the upper reaches. On the contrary, a rapid expansion in urban population leads to advancing demands on cities’ housing and other supporting infrastructure. Some findings show that urban buildings are the main cause of the increase in emissions [52]. Carbon dioxide emissions from buildings accounted for 67.6% of annual urban emissions [53]. The agglomeration effect on emissions is weakened, so the relationship between population urbanization and emissions is significantly positive in the middle and lower reaches. This result echoes the fact that there is a positive U-shaped relationship between population urbanization and CO2 emissions in the Yangtze River Delta [54].
The per capita GDP is another main factor in the rise of CO2 emissions. The coefficient is 0.968 at the 1% level of significance in the YREB, which means a 1% increase in the per capita GDP can increase CO2 emissions by 0.968% if other variables are invariant. This finding accords with the fact that economic development is still the main influencing factor on the growth of emissions at the current stage [18,25]. This situation is more prominent in the upper reaches of Yangtze River. Here, the coefficient of per capita GDP is 1.284 at a 1% level of significance, and this is the area where affluence has the greatest influence on CO2 emissions in YREB. This result can explain why the upper reaches have fast economic growth. With the help of a one-belt-one-road strategy, western provinces have been further opening up and gradually become the leaders of GDP growth in China. The GDP growth of Guizhou, Yunnan, Chongqing and Sichuan has, in recent years, been the strongest in China. Chongqing had the strongest GDP growth from 2014 to 2016 (10.9%, 11%, and 10.7% respectively), and Guizhou had the strongest GDP growth in 2017 and 2018 (10.2% and 9.1%, respectively) [55].
Economic urbanization promotes the continuous growth and agglomeration of the urban manufacturing industry and service industry, optimizes the industrial structure and facilitates the in-depth development of urbanization [56]. That is, economic urbanization development can reduce carbon dioxide emissions. The scale effect generated by the agglomeration of the manufacturing and service industries in cities can effectively reduce the waste of resources. The development of tertiary industries, especially the high-tech industry, requires little fossil fuel energy, which reduces emissions. The coefficient is −6.172 at a 1% level, which is the most important influence in the decline of emissions in the upper reaches of the Yangtze River. Based on the quadratic coefficient, it can be inferred that the relationship between the economic urbanization level and emissions presents an inverted U-shape curve in the YREB and the upper reaches. In recent years, with the transformation and upgrading of the industrial structure, high-tech industries and emerging industries developed rapidly. For example, high-tech industries have played a substantial role in Guizhou’s economic development. Statistics show that, in 2017, the annual added value of high-tech industries increased by 39.9% over the previous year, accounting for 8.1% of the added value of industries above Designated Size [57]. However, the relationship is non-significant in the middle and lower reaches. The probable reason for this is that the industry in the middle and lower reaches is relatively developed and is an important force in promoting economic development, and coal accounts for the main component of the energy consumption structure. On the other hand, since the implementation of the 11th Five Year Plan in 2006, the state has paid attention to sustainable development and has put forward energy conservation and clean development strategies. All regions began to adjust the economic structure and transform the economic growth mode. Therefore, the effect of economic urbanization on CO2 emissions in the middle and lower reaches is not significant.
The R&D efficiency of CO2 emissions has little effect. Although the result is significance in the YREB, the coefficient is only 0.038 at the 10% level of significance. A possible explanation is that there is a lag period from when the patent became licensed for practical application. There are some problems, such as a low ratio and low efficiency in the process of transformation from patent to technology and from technology to benefit, and a long development cycle for technology. Many existing technologies should be used with cost reductions via research and innovation to meet future demands for net zero of CO2 emission [58]. There are regional differences in the effect of low-carbon technology progress on carbon emissions. Only when the economic development and urbanization reach a certain stage will low-carbon technology progress affect carbon emissions [59]. The YREB and the upper, middle and lower reaches have different levels of technological progress and economic development, so the influence of R&D efficiency on carbon dioxide emissions is insignificant.
The energy intensity is the main factor to reduce carbon dioxide emissions. The energy intensity reflects the energy input per unit output. With the development of energy conservation, clean energy, and carbon capture technologies, the energy intensity continuously declines from 1.35 ton standard coal/104 yuan in 2000 to 0.46 ton standard coal/104 yuan in 2017. The coefficient is 1.042 at the 1% significance level, which indicates that the energy intensity decreased 1% every time, carbon dioxide emissions can decrease 1.042% if other variables are invariant. Similar results are found in [60,61,62]. The quadratic coefficient shows that a linear relationship between energy intensity and carbon dioxide emissions almost does not exist.

4.2. Two-Stage Regression Results

Table 6 shows that the influencing factors on carbon dioxide emissions differ greatly at different stages of CO2 emissions changes.
At the stage of rapid growth in carbon emissions, the population scale and per capita GDP are the main causes of the increase in carbon dioxide emissions in YREB and the upper, middle, and lower reaches of Yangtze Valley. The energy intensity is the main factor for the decrease in emissions. R&D efficiency has little effect on emissions. Urbanization development, be it population urbanization or economic urbanization, has different impacts on emissions in YREB and the upper, middle and lower reaches of the Yangtze Valley, and this result may be related to the great differences in urbanization development and economic development in those areas. Generally, the results are in agreement with the estimation results of the panel regression.
However, an interesting finding is that the value of the regression R-square of the YREB is 0.3948 in Stage II, which is less than 0.5, which indicates that the estimation results cannot be used to well interpret the relationship between the dependent variable and independent variables. Under the influence of policy and technology development, China’s change in carbon dioxide emissions has obviously stabilized. With the new changes, the influencing factors of emissions in the YREB have also changed greatly. Only the per capita GDP and energy intensity are positively correlated with emissions, and other influencing factors are not significant. Although the R-square is not significant, the results show that economic growth is the main reason for the increase in emissions, while the continuous reduction of energy intensity is the main force for emissions reduction, which is consistent with previous findings [63].
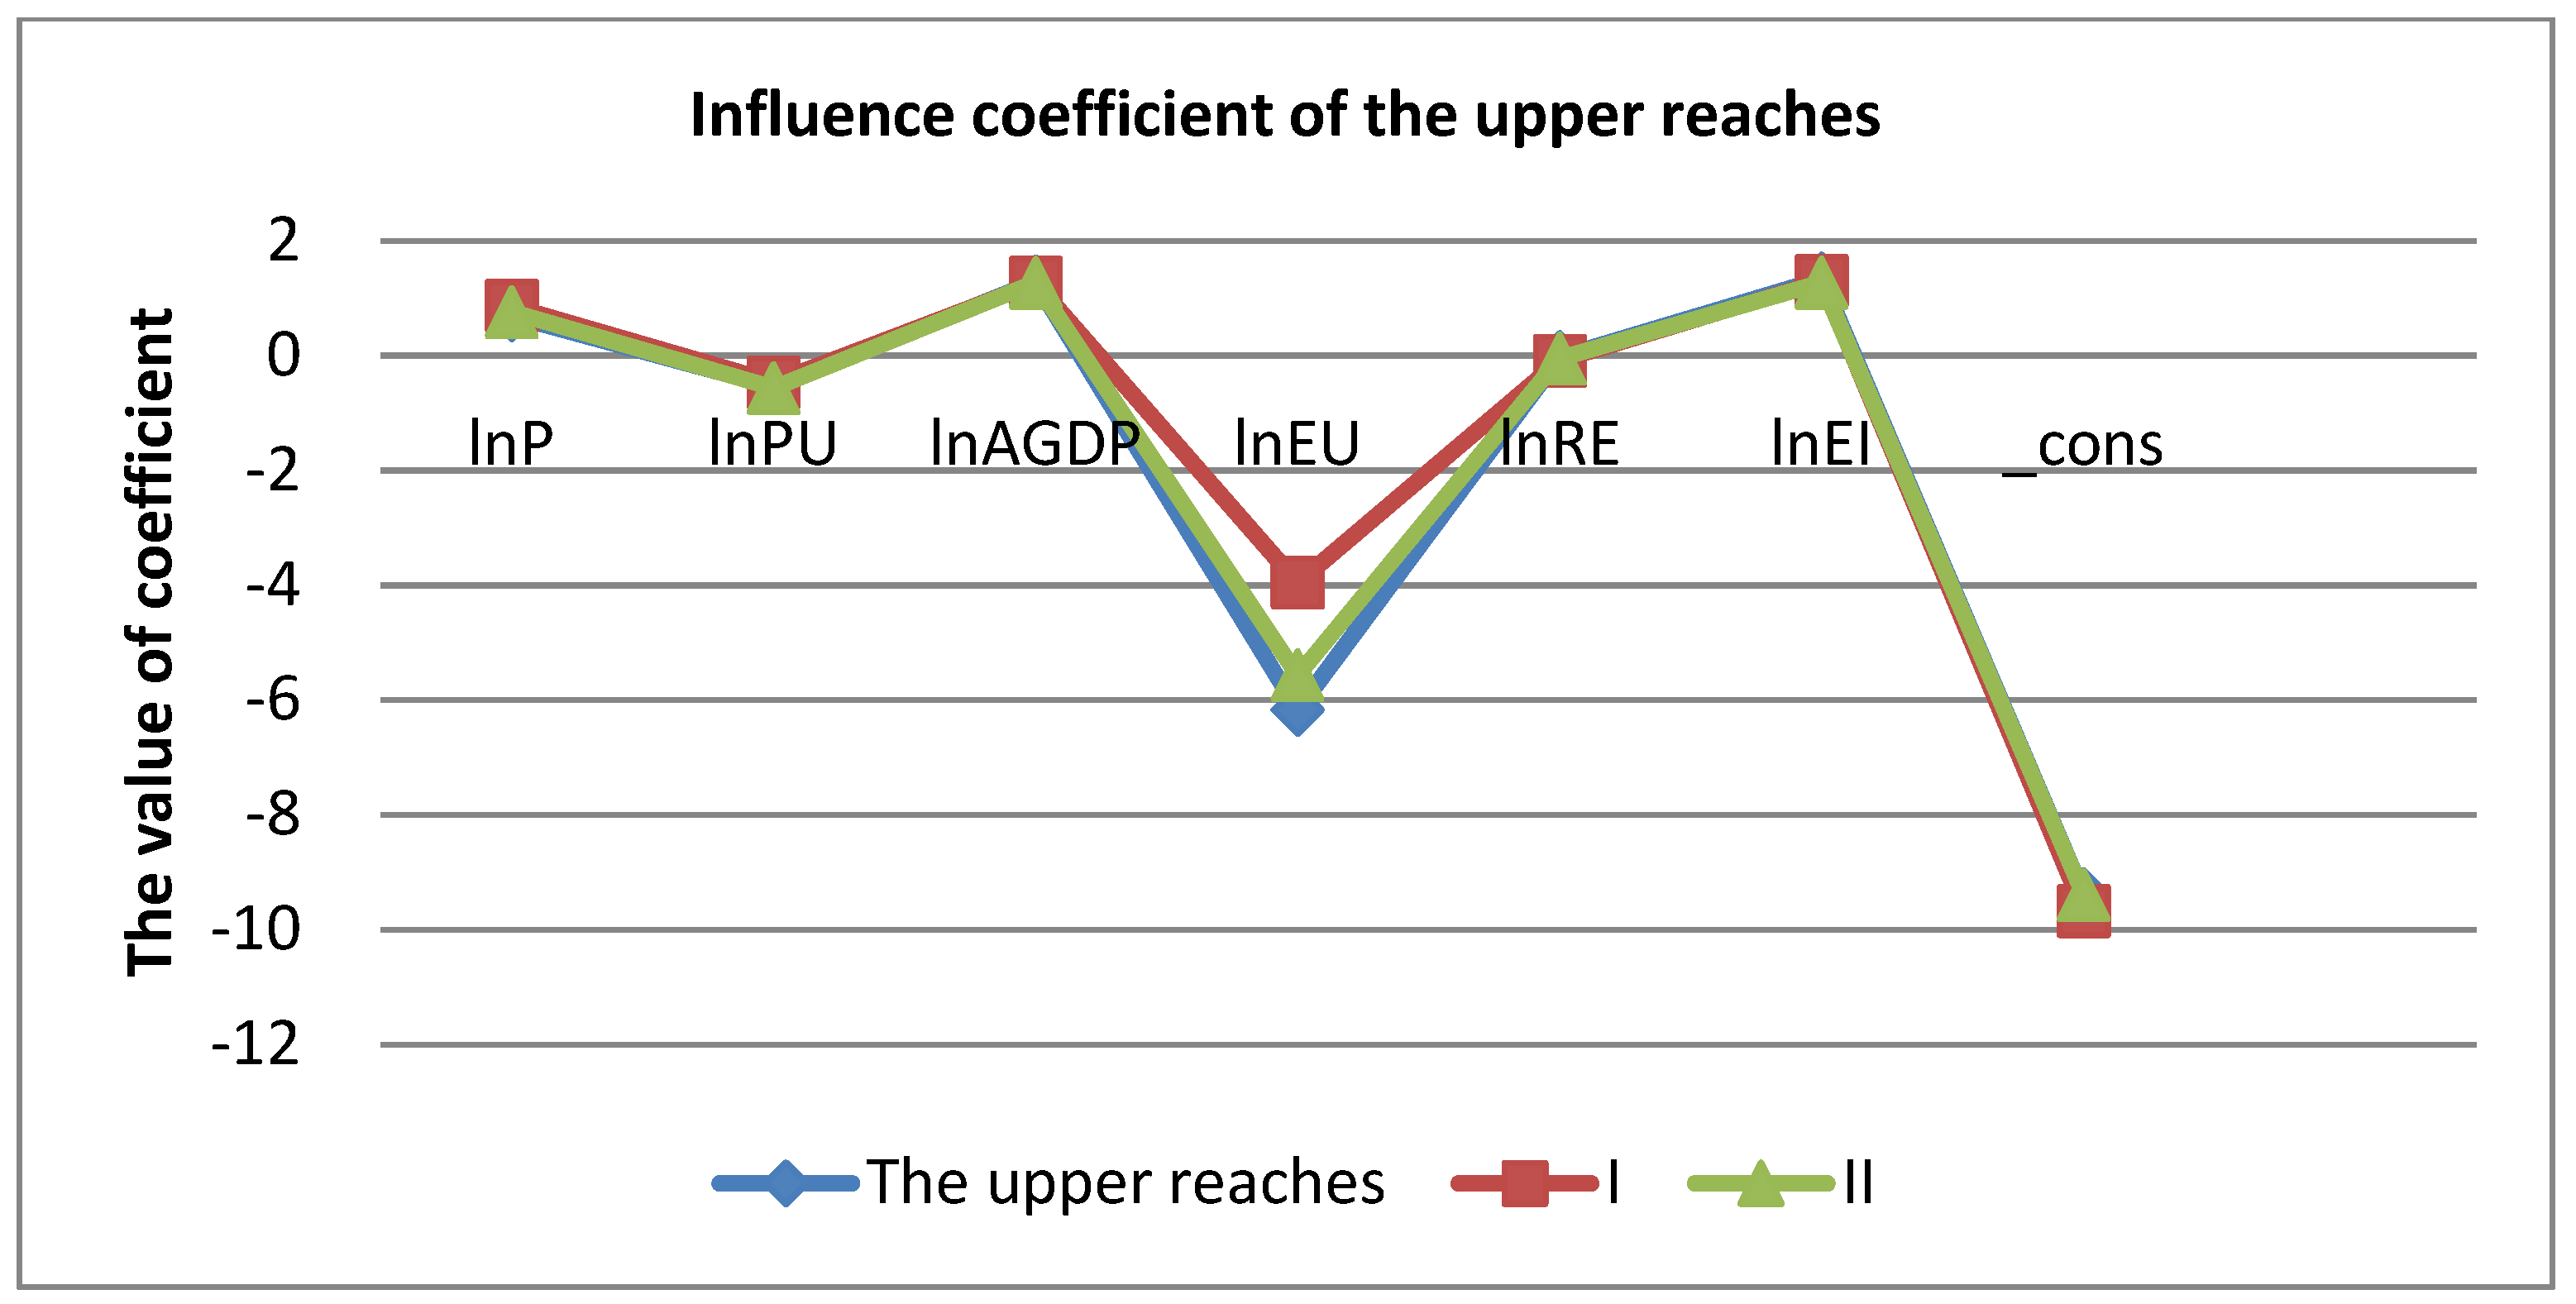
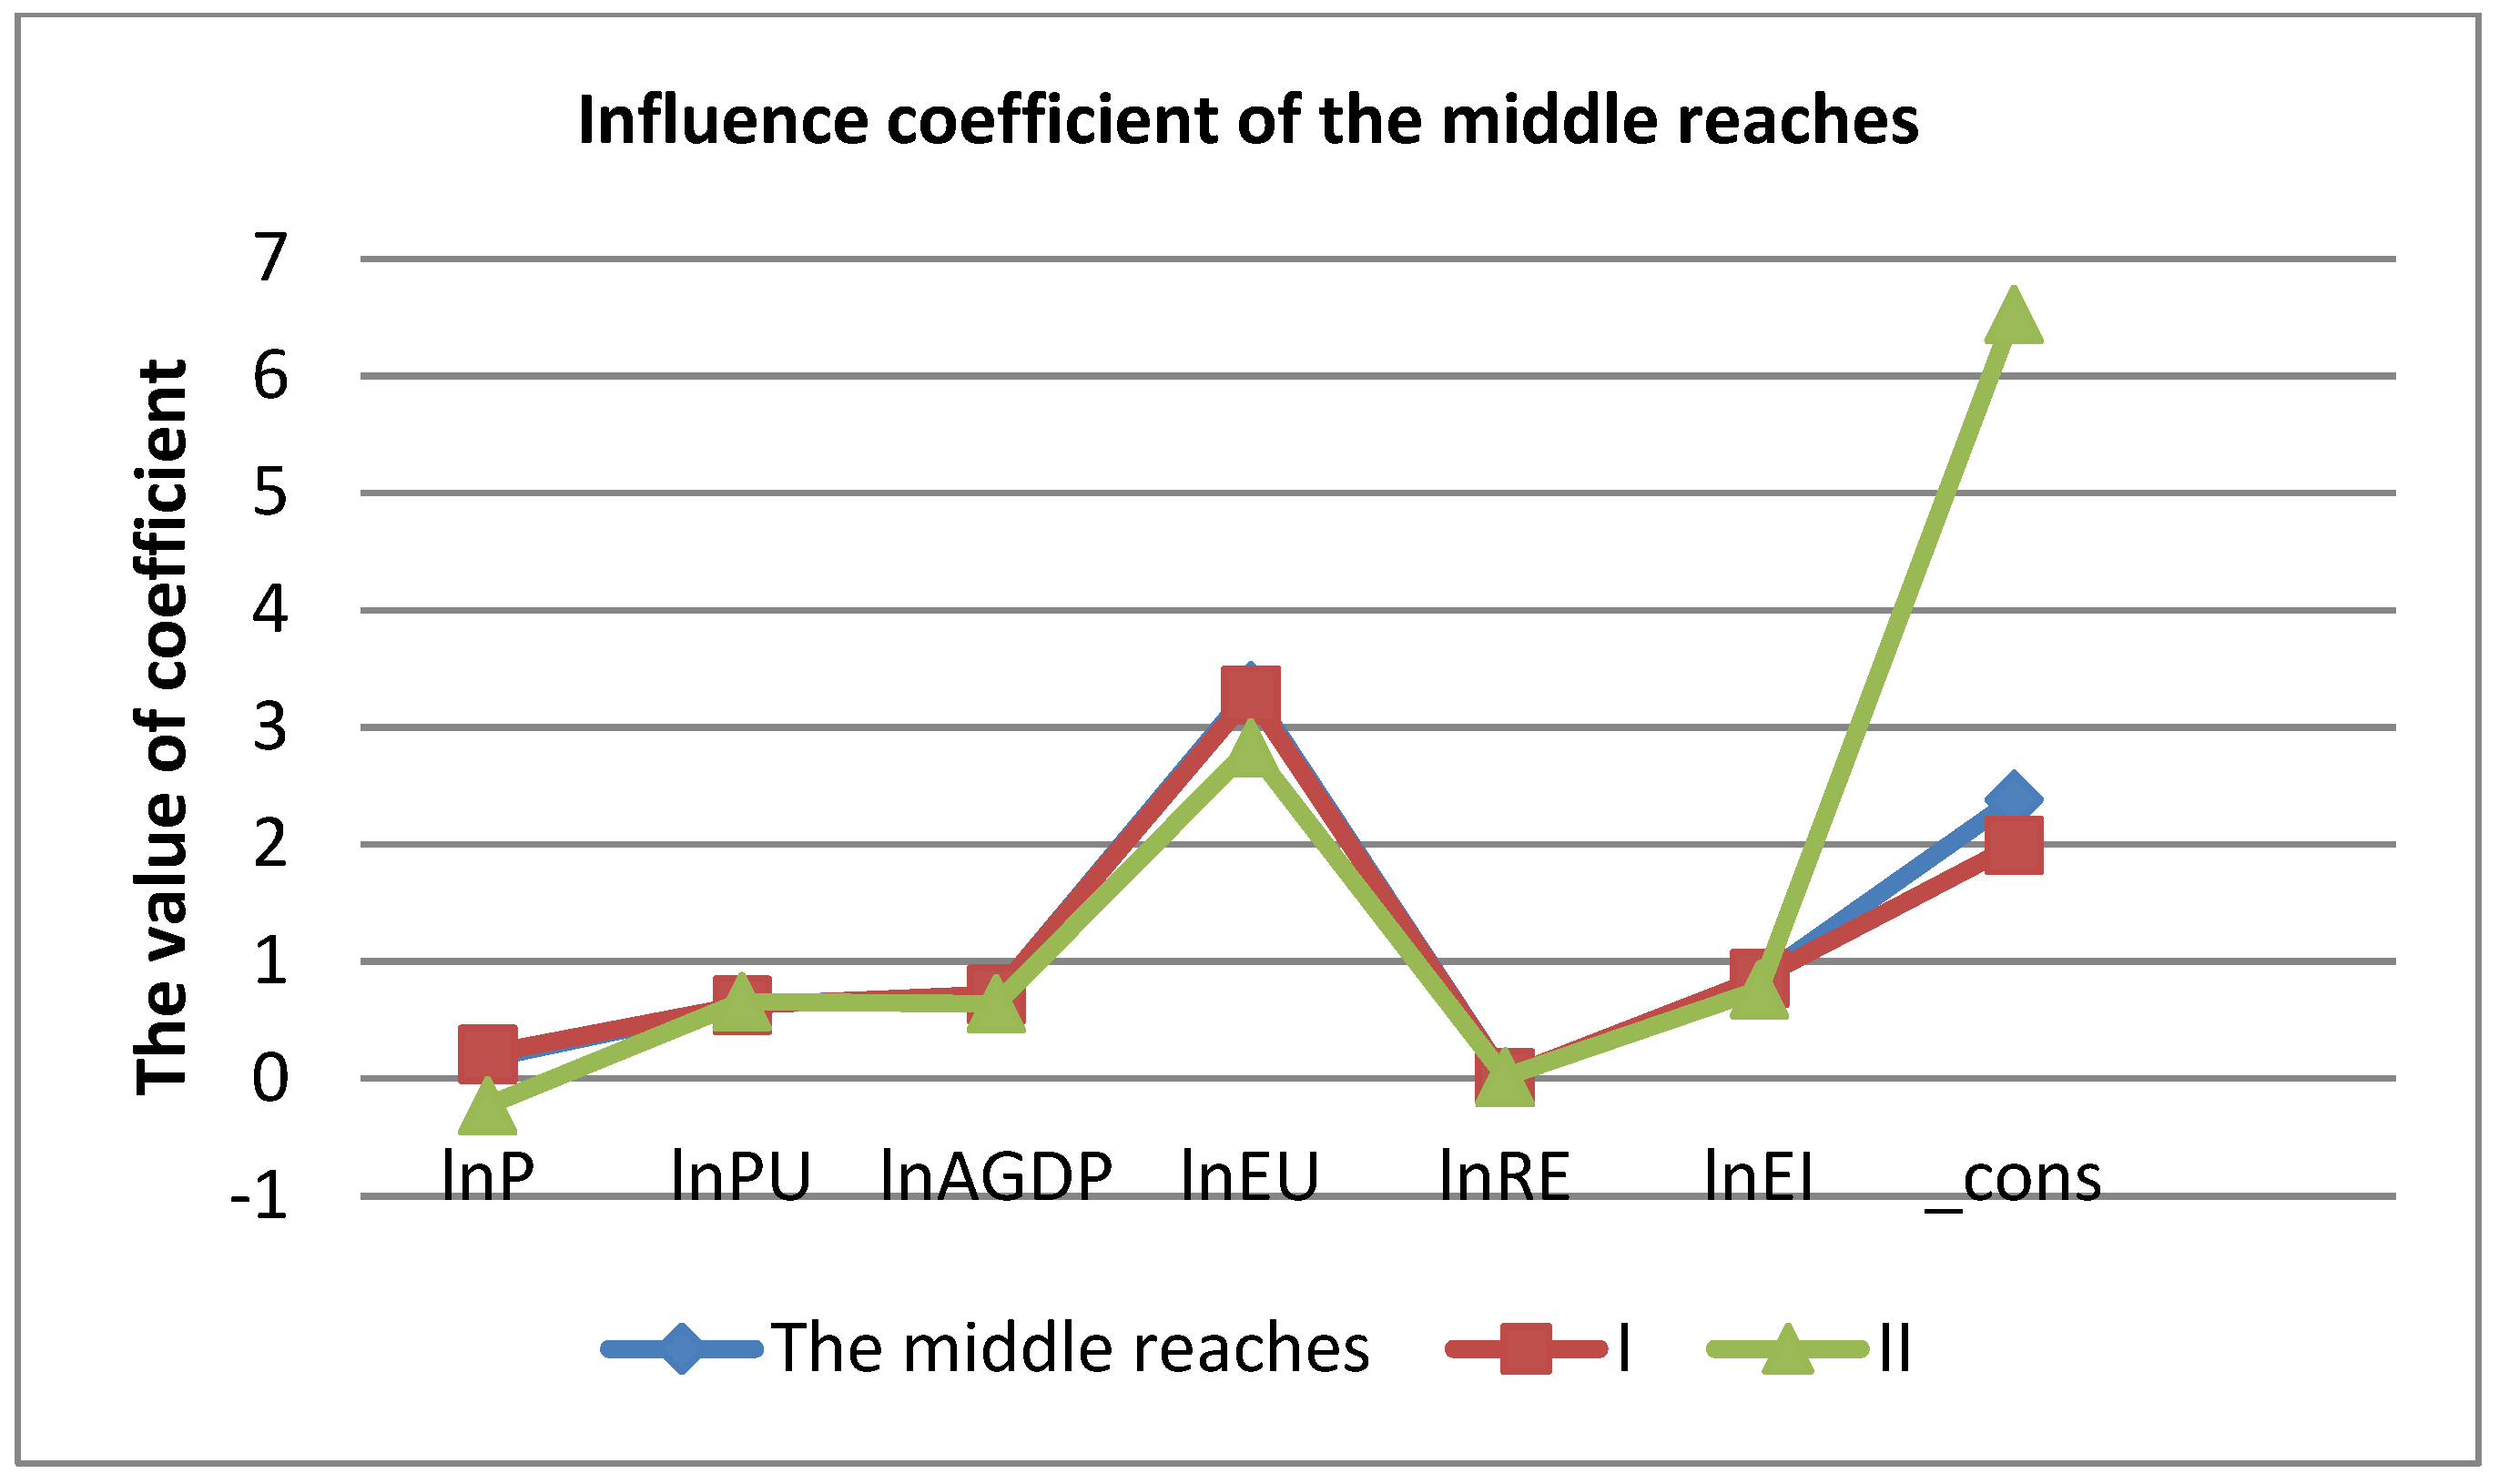
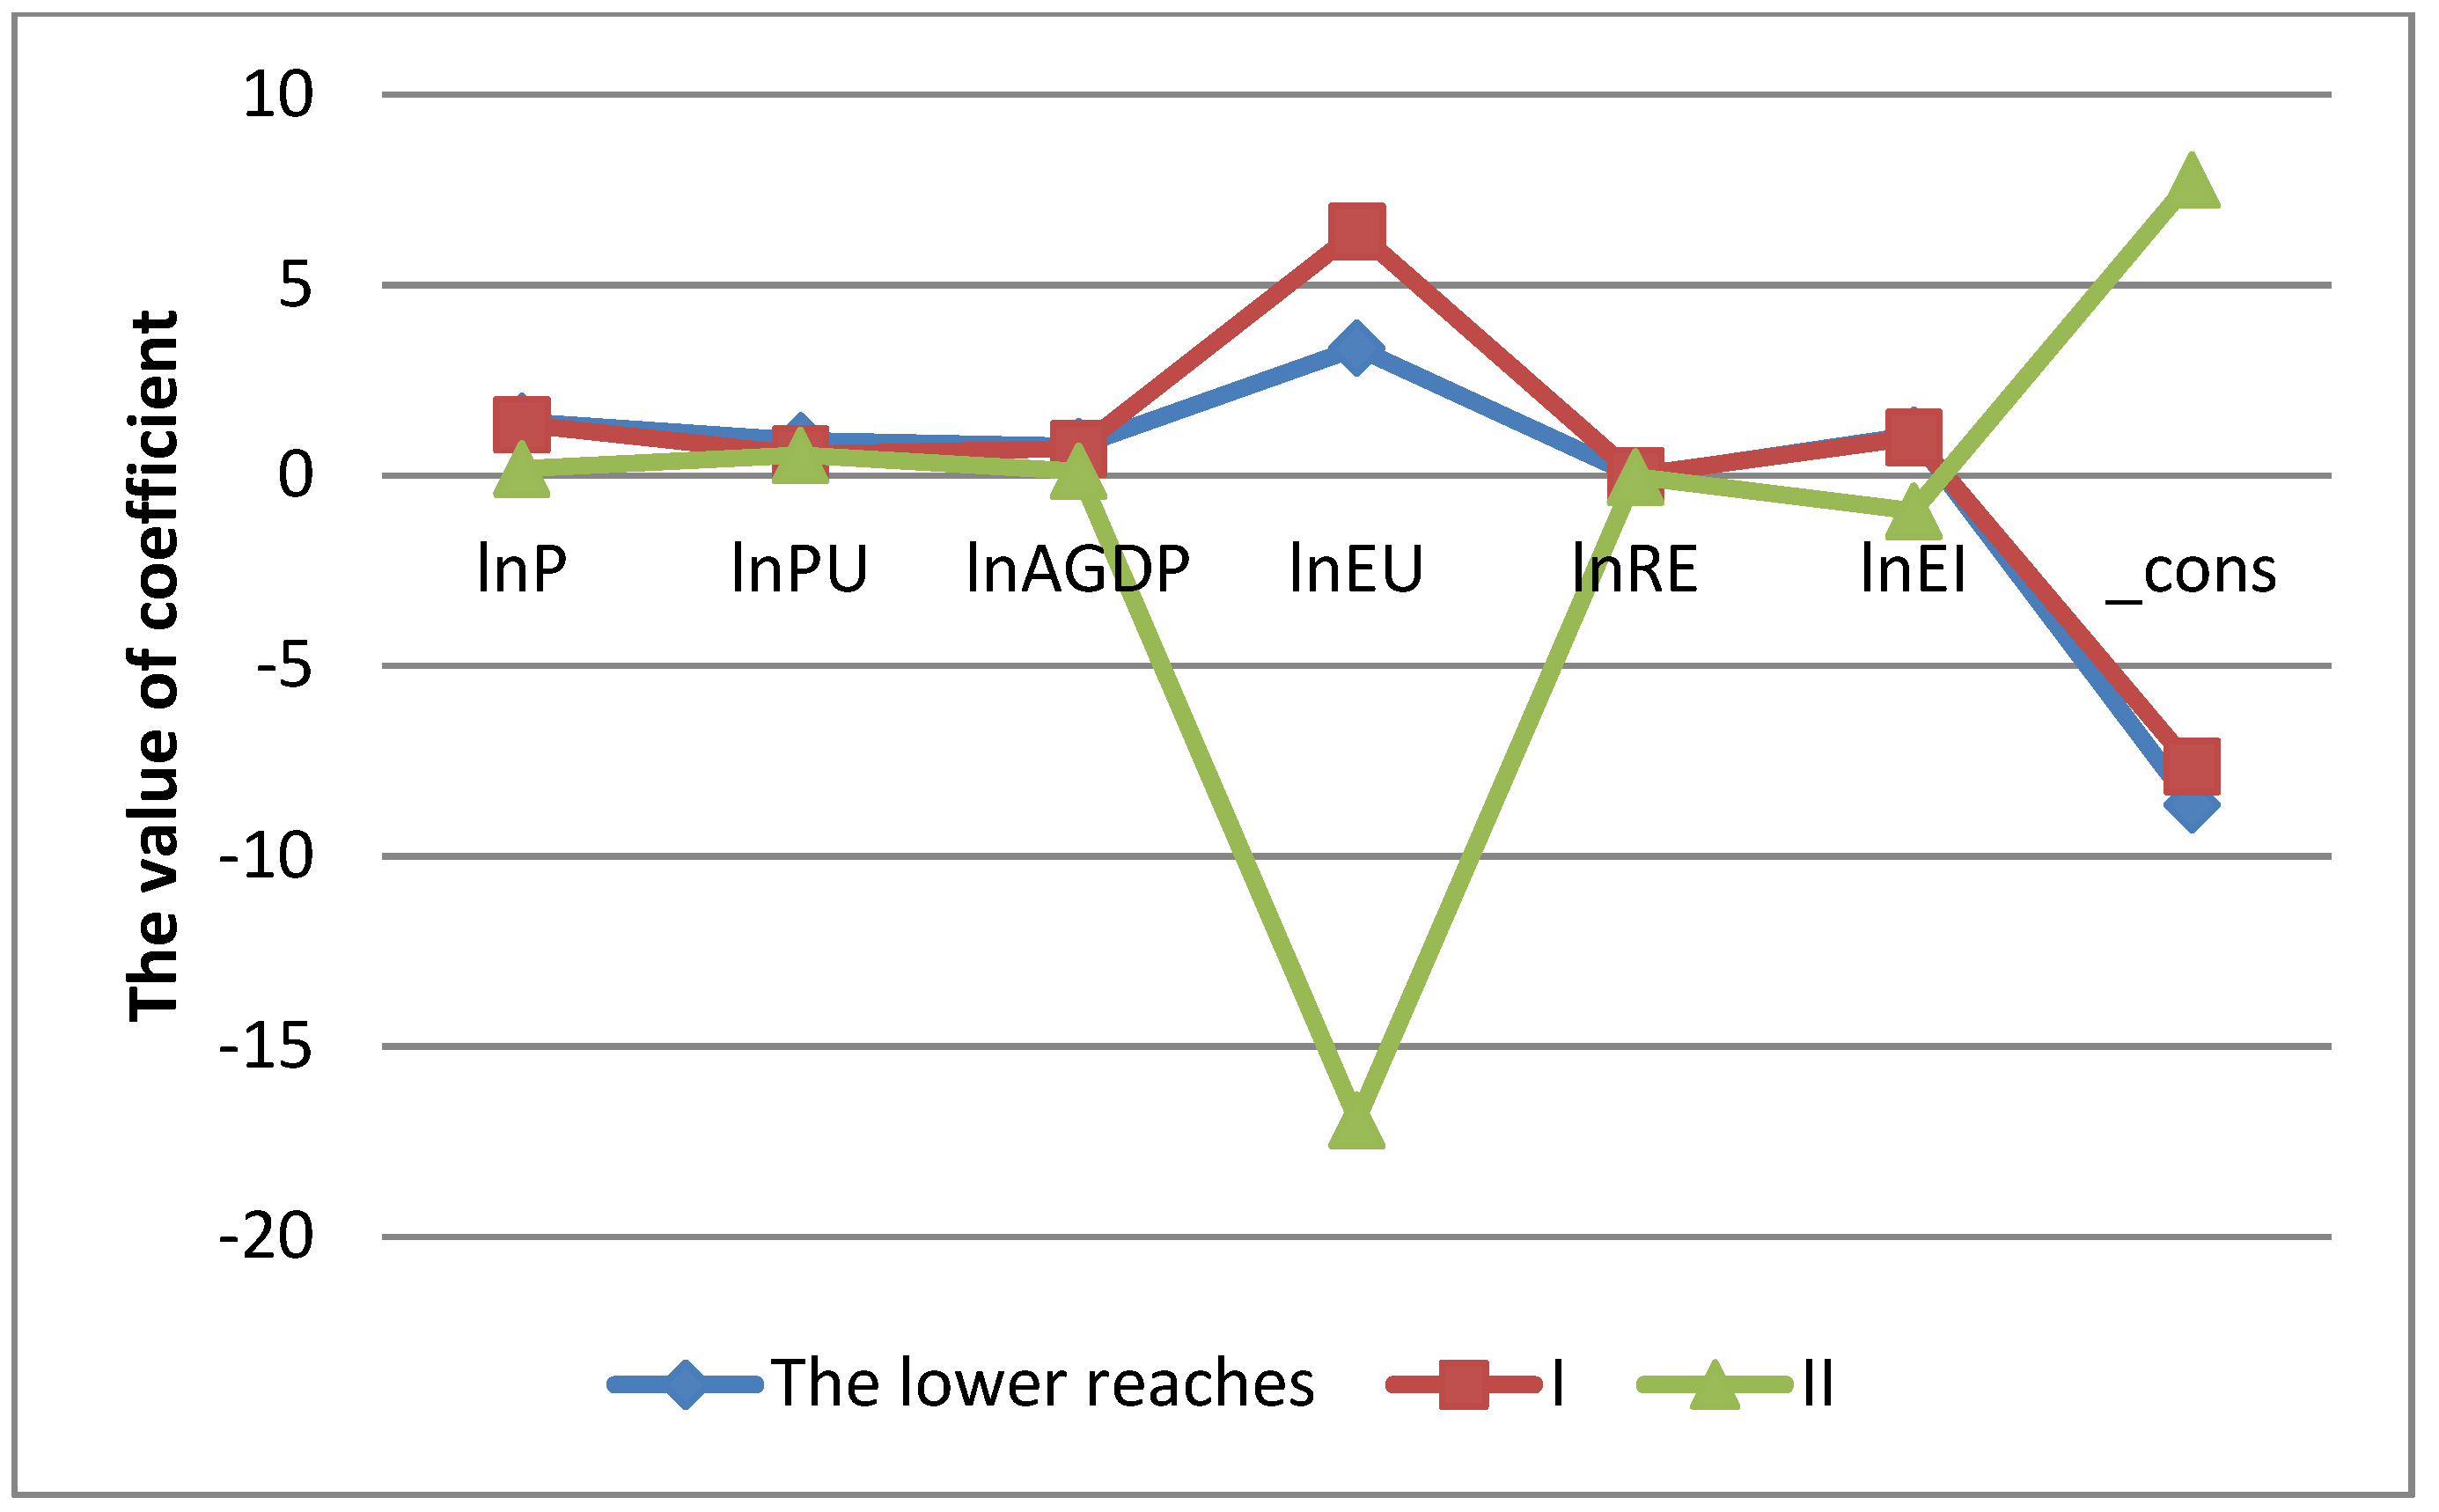
Figure 2, Figure 3 and Figure 4 compare the coefficients of different factors between the upper, middle and lower reaches and Stage I and Stage II of the upper, middle and lower reaches of the Yangtze River, respectively. It can be seen that the changes in different influencing factors in YREB are mainly found in the lower reaches. The first significant change is when carbon dioxide emissions are in a stage of stable change, per capita GDP has no significant impact on emissions in the lower reaches, which has a higher income level. That is, economic development has little impact on emissions. According to the Environmental Kuznets Curve (EKC) [24], there is an inverted U-shaped curve between environmental quality and income. That is, in the initial stage, economic development will raise CO2 emissions, but when the economic development level reaches the turning point, economic development will reduce them. Although the result does not show a negative effect between per capita GDP and CO2 emissions, the non-significant impact can also be explained by the fact that economic development can be friendly to environment when the level of economic growth reaches a certain level. The influence of economic growth on CO2 emissions will become weaker. The second significant change is that there is a negative correlation between energy intensity and carbon emissions; that is, the decrease in energy intensity will raise CO2 emissions. This means that technological growth will have a rebound effect on CO2 emissions. This discovery echoes the views of Zhang et al. [20].
The population urbanization variable reduces CO2 emissions in the upper reaches but raises CO2 emission in the middle reaches, while it is not significant in the lower reaches at either stage. The economic urbanization variable is the main cause of CO2 emission reduction in the upper reaches; it is non-significant in the middle reaches at both stages, and it presents a diametrically opposed effect at both stages in the lower reaches. This may be because, when the urbanization growth is at a lower level, with the optimization of the energy consumption structure, the industrial structure and resource allocation, the congregate effect is significant in terms of urbanization growth, and CO2 emissions then reduce. However, in the process of urbanization growth, the activities of citizens play a positive role in CO2 emissions, and the reduction effect may rebound. However, when the urbanization level reaches a higher level, for example, when the average economic urbanization of the lower reaches from 2011 to 2017 was 96.9%, technology plays an important role in the national economic system. Science and technology are used to optimize the structure of energy consumption and improve the living environment, and the awareness of environmental protection continues to improve [29], so urbanization development is the main reduction factor on CO2 emissions.

5. Conclusions and Policy Implications

This study identified the changes in influencing factors with regard to carbon dioxide emissions in different periods, including the entire sample period (2000–2017), the period of the rapid growth of emissions (2000–2011), and the period of stable change in emissions (2011–2017) by using the extended STIRPAT panel model. The empirical results evidence the impact of various factors on emissions in different stages. (1) In the entire sample period, the main cause of CO2 emission increases in YREB and the upper reaches is per capita GDP, followed by total population, and the main cause of CO2 emission reduction is economic urbanization, followed by energy efficiency and population urbanization. As for the middle reaches of the Yangtze River, the main cause of CO2 emissions growth is per capita GDP, followed by population urbanization; energy efficiency is the main cause of CO2 emission reduction, and it shows an inverted U-shaped relationship with CO2 emissions. In the lower reaches of the Yangtze River, the main cause of CO2 emission growth is total population, followed by population urbanization and per capita GDP; the main cause of CO2 emission reduction is energy efficiency. (2) In the period of the rapid growth of CO2 emissions, the influence factors on CO2 emissions were more or less the same as in the entire sample period, except in the lower reaches. The main cause of CO2 emissions growth in YREB is per capita GDP, followed by total population; the main cause of CO2 emissions reduction is economic urbanization, followed by energy efficiency. The result in the upper reaches is the same as that of the entire sample period. In the middle reaches, the main cause of CO2 emission growth is GDP per capita, followed by population urbanization; the main reduction factor is energy efficiency, which presents an inverted U-shaped curve relationship with CO2 emissions. In the lower reaches, economic urbanization is the main increasing factor of CO2 emissions and the coefficient is 6.4199, which is much greater than that of the other factors, followed by total population and per capita GDP; energy efficiency is still the main reduction factor. (3) In the stable change period, the results in the middle and upper reaches are roughly the same as those of the rapid growth period. On the contrary, the estimate results in YREB are not significant. The main cause of CO2 emission increases in the lower reaches is energy efficiency, and the main reduction factor is economic urbanization, with a coefficient of 16.9359, which implies a far greater influence compared with energy efficiency (a coefficient of −0.9310). In particular, R&D efficiency has little influence in each period and in each region.
Based on the above findings, we propose the following policy implications. Firstly, to strengthen the positive influence of economic urbanization, the government of the middle and upper reaches of the Yangtze River need a new type of urbanization and must make full use of the agglomeration effect. In the development process for a new type of urbanization, we need to vigorously improve the proportion of the tertiary industry, mainly the service industry, in the national economic system, and need to constantly optimize the industrial structure, as a high-ratio service industry is well recognized as a low-carbon industry [64]. Based on the geographical advantages, the upper reaches should rigorously develop a low-carbon tourist economy to achieve a high-quality model of economic development. With the integration strategy of the Yangtze River Delta, the lower reaches can intensify regional collaboration and can bring the radiance and leadership of Shanghai into full play, which should strongly develop its high-tech industry and its digital economy with low energy consumption and a high added value. Secondly, for reducing the adverse impact of population size, population urbanization and economic development on CO2 emissions, it is crucial to strengthen policy guidance and raise society’s awareness of energy-saving and emission-reduction initiatives, e.g., by increasing new-energy public transport, promoting low-carbon publicity and education and implementing waste classification. CO2 emissions caused by the increase in urban population in the process of population concentration from rural to urban areas can be effectively reduced by changing people’s modes of travel and lifestyles and enhancing the utilization of resources for lifestyle change can have an earlier effect on transport carbon and air quality emissions than a technology development with no lifestyle change [65]. Thirdly, governments should positively develop new and clean energy, optimize the energy consumption structure and reduce the energy intensity. However, when CO2 emissions slowly change, more attention should be paid to prevent the rebound effect of that intensity, such as the CO2 emissions caused by infrastructure construction in the process of new energy development. Finally, it is necessary to increase investment in research and development (R&D) and promote the integrated development of industry, education and research. To enhance the positive effect of R&D on CO2 emissions reduction as quickly as possible, scientific institutions and enterprises need to improve the conversion of new, practical model patents and support high-quality and sustainable economic development. In addition, governments need to innovate the carbon financial instruments, such as CO2 emission trading instruments and carbon financing tools, to address the capital needs of enterprises for energy saving and emission reduction. In the meantime, the horizontal exchange between various provinces and municipalities in YREB should be expanded, and an economic and ecological system with comprehensive emission reductions should be established in order to reach the peak of CO2 emissions as quickly as possible and promote the sustainable development of YREB.

Author Contributions

Conceptualization, Y.L.; Data curation, Y.H.; Formal analysis, Y.H.; Funding acquisition, Y.H.; Investigation, Y.H.; Methodology, Yuling Han; Project administration, Y.L.; Supervision, Y.L.; Validation, Y.H.; Writing–original draft, Y.H.; Writing–review & editing, Y.L. Both authors have read and agreed to the published version of the manuscript.

Funding

This research was funded by National Science Fund for Distinguished Young Scholars, grant number 71904059; Natural Science Research of Jiangsu Higher Education Institutions of China, General Program, grant number 19KJB580007.

Data Availability Statement

No new data were created or analyzed in this study. Data sharing is not applicable to this article.

Acknowledgments

Funding from the Humanities & Social Science Research of Nanjing University of Posts and Telecommunications, General Program, grant No. NYS217021.

Conflicts of Interest

The authors declare no conflict of interest.

References

  1. Economic Growth Report of 11 Provinces and Municipalities in the Yangtze River Economic Belt in 2018. Available online: https://cyrdebr.sass.org.cn/2020/1120/c5532a99273/page.htm (accessed on 14 December 2020).
  2. National Bureau of Statistics of China Annual Data Home Page. Available online: http://www.stats.gov.cn/english/Statisticaldata/AnnualData/ (accessed on 14 December 2020).
  3. Ali, R.; Bakhsh, K.; Yasin, M.A. Impact of urbanization on CO2 emissions in emerging economy: Evidence from Pakistan. Sustain. Cities Soc. 2019, 48, 101553:1–101553:6. [Google Scholar] [CrossRef]
  4. Abbasi, M.A.; Parveen, S.; Khan, S.; Kamal, M.A. Urbanization and energy consumption effects on carbon dioxide emissions: Evidence from Asian 8 countries using panel data analysis. Environ. Sci. Pollut. Res. 2020, 27, 18029–18043. [Google Scholar] [CrossRef] [PubMed]
  5. Kang, M.M.; Zhao, W.W.; Jia, L.Z.; Liu, Y.X. Balancing carbon emission reductions and social economic development for sustainable development: Experience from 24 countries. Chin. Geogr. Sci. 2020, 30, 379–396. [Google Scholar] [CrossRef] [Green Version]
  6. Wang, Q.; Su, M. The effects of urbanization and industrialization on decoupling economic growth from carbon emission—A case study of China. Sustain. Cities Soc. 2019, 51, 101758:1–101758:8. [Google Scholar] [CrossRef]
  7. Li, B.; Liu, X.J.; Li, Z.H. Using the STIRPAT model to explore the factors driving regional CO2 emissions: A case of Tianjin, China. Nat. Hazards 2015, 76, 1667–1685. [Google Scholar] [CrossRef]
  8. Nosheen, M.; Abbasi, M.A.; Iqbal, J. Analyzing extended STIRPAT model of urbanization and CO2 emissions in Asian countries. Environ. Sci. Pollut. Res. 2020, 10276:1–10276:14. [Google Scholar] [CrossRef]
  9. Lin, B.Q.; Omoju, O.E.; Nwakeze, N.M.; Okonkwo, J.U.; Megbowon, E.T. Is the environmental Kuznets curve hypothesis a sound basis for environmental policy in Africa? J. Clean. Prod. 2016, 133, 712–724. [Google Scholar] [CrossRef]
  10. Yu, X.; Wu, Z.Y.; Zheng, H.R.; Li, M.; Tan, T. How urban aglomeration improve the emission efficiency? A spatial econometric analysis of the Yangtze River Delta urban agglomeration in China. J. Environ. Manag. 2020, 260, 110061:1–110061:8. [Google Scholar] [CrossRef]
  11. Wang, F.; Qin, Y.H.; Liu, J.; Wu, C.X. A study on the influencing factors of carbon dioxide emissions from the perspective of multi-dimensional urbanization. China Popul. Resour. Environ. 2017, 27, 151–161. [Google Scholar]
  12. Fan, J.S.; Zhou, L. Impact of urbanization and real estate investment on carbon dioxide emissions: Evidence from China’s provincial regions. J. Clean. Prod. 2019, 209, 309–323. [Google Scholar] [CrossRef]
  13. Hu, J.H.; Jiang, X. A study on the impact of urbanization on carbon dioxide emissions from the perspective of Urban Agglomeration. J. Chin. Univ. Geosci. (Soc. Sci. Ed.) 2015, 15, 11–21. [Google Scholar] [CrossRef]
  14. Yang, L.S.; Zhu, J.P.; Jia, Z.J. Influencing factors and current challenges of CO2 emission reduction in China: A perspective based on technological progress. Econ. Res. J. 2019, 54, 118–132. [Google Scholar]
  15. Hu, Z.Y. Technical progress, technical efficiency and agricultural carbon dioxide emissions in China. East Chin. Econ. Manag. 2018, 32, 100–105. [Google Scholar]
  16. Hashmi, R.; Alam, K. Dynamic relationship among environmental regulation, innovation, CO2 emissions, population, and economic growth in OECD countries: A panel investigation. J. Clean. Prod. 2019, 231, 1100–1109. [Google Scholar] [CrossRef]
  17. Wang, C.J.; Wang, F.; Zhang, X.L.; Yang, Y.; Su, Y.X.; Ye, Y.Y.; Zhang, H.O. Examining the driving factors of energy related carbon dioxide emissions using the extended STIRPAT model based on IPAT identity in Xinjiang. Renew. Sustain. Energy Rev. 2017, 67, 51–61. [Google Scholar] [CrossRef]
  18. Shuai, C.Y.; Shen, L.Y.; Jiao, L.D.; Wu, Y.; Tan, Y.T. Identifying key impact factors on carbon emission: Evidences from panel and time-series data of 125 countries from 1990 to 2011. Appl. Energy 2017, 187, 310–325. [Google Scholar] [CrossRef]
  19. Charfeddine, L.; Kahia, M. Impact of renewable energy consumption and financial development on CO2 emissions and economic growth in the MENA region: A panel vector autoregressive (PVAR) analysis. Renew. Energy 2019, 139, 198–213. [Google Scholar] [CrossRef]
  20. Zhang, F.; Deng, X.Z.; Phillips, F.; Fang, C.L.; Wang, C. Impacts of industrial structure and technical progress on carbon emission intensity: Evidence from 281 cities in China. Technol. Forecast. Soc. 2020, 154, 119949:1–119949:10. [Google Scholar] [CrossRef]
  21. Cheng, Z.H.; Li, L.S.; Liu, J. Industrial structure, technical progress and carbon intensity in China’s provinces. Renew. Sustain. Energy Rev. 2018, 81, 2935–2946. [Google Scholar] [CrossRef]
  22. Jin, X.T.; Li, Y.; Sun, D.Q.; Zhang, J.Z.; Zheng, J. Factors controlling urban and rural indirect carbon dioxide emissions in household consumption: A case study in Beijing. Sustainability 2019, 11, 6563. [Google Scholar] [CrossRef] [Green Version]
  23. Arshed, N.; Munir, M.; Iqbal, M. Sustainability assessment using STIRPAT approach to environmental quality: An extended panel data analysis. Environ. Sci. Pollut. Res. 2021, 28, 18163–18175. [Google Scholar] [CrossRef]
  24. Grossman, G.M.; Krueger, A.B. Economic growth and the environment. Q. J. Econ. 1995, 110, 353–377. [Google Scholar] [CrossRef] [Green Version]
  25. Ahmad, N.; Du, L.S.; Lu, J.Y.; Wang, J.; Li, H.-Z.; Hashmi, M.Z. Modelling the CO2 emissions and economic growth in Croatia: Is there any environmental Kuznets curve? Energy 2017, 123, 164–172. [Google Scholar] [CrossRef]
  26. Dogan, E.; Inglesi-Lotz, R. The impact of economic structure to the environmental Kuznets curve (EKC) hypothesis: Evidence from European countries. Environ. Sci. Pollut. Res. 2020, 1–8. [Google Scholar] [CrossRef]
  27. Ameyaw, B.; Li, Y.; Annan, A.; Agyeman, J.K. West Africa’s CO2 emissions: Investigating the economic indicators, forecasting, and proposing pathways to reduce carbon emission levels. Environmental Science and Pollution Research. Environ. Sci. Pollut. Res. 2020, 07849:1–07849:25. [Google Scholar] [CrossRef]
  28. Balsalobre-Lorente, D.; Shahbaz, M.; Roubaud, D.; Farhani, S. How economic growth, renewable electricity and natural resources contribute to CO2 emissions. Energy Policy 2018, 113, 356–367. [Google Scholar] [CrossRef] [Green Version]
  29. Fan, Y.; Liu, L.C.; Wu, G.; Wei, Y.M. Analyzing impact factors of CO2 emissions using the STIRPAT model. Environ. Impact Assess Rev. 2006, 26, 377–395. [Google Scholar] [CrossRef]
  30. Saidi, K.; Hammami, S. The impact of CO2 emissions and economic growth on energy consumption in 58 countries. Energy Rep. 2015, 1, 62–70. [Google Scholar] [CrossRef] [Green Version]
  31. Wang, Q.; Zhang, F. Does increasing investment in research and development promote economic growth decoupling from carbon emission growth? An empirical analysis of BRICS countries. J. Clean. Prod. 2019, 252, 119853:1–119853:16. [Google Scholar] [CrossRef]
  32. Qian, J.; Li, J.Y. Does technological progress effectively promote the energy saving and CO2 emission reduction. Stud. Sci. Sci. 2018, 36, 49–59. [Google Scholar]
  33. Ahmad, M.; Zhao, Z.Y.; Li, H. Revealing stylized empirical interactions among construction sector, urbanization, energy consumption, economic growth and CO2 emissions in China. Sci. Total. Environ. 2019, 657, 1085–1098. [Google Scholar] [CrossRef] [PubMed]
  34. Zhou, Y.; Chen, M.X.; Tang, Z.P.; Mei, Z.A. Urbanization, land use change, and carbon emissions: Quantitative assessments for city-level carbon emissions in Beijing-Tianjin-Hebei region. Sustain. Cities Soc. 2021, 66, 102701. [Google Scholar] [CrossRef]
  35. Huang, J.B.; Wu, J.; Tang, Y.; Hao, Y. The influences of openness on China’s industrial CO2 intensity. Environ. Sci. Pollut. Res. 2020, 27, 15743–15757. [Google Scholar] [CrossRef]
  36. Luan, B.J.; Huang, J.B.; Zou, H. Domestic R&D, technology acquisition, technology assimilation and China’s industrial carbon intensity: Evidence from a dynamic panel threshold model. Sci. Total Environ. 2019, 693, 133436:1–133436:11. [Google Scholar] [CrossRef]
  37. Polloni-Silva, E.; Ferraz, D.; Camioto, F.d.C.; Rebelatto, D. Environmental Kuznets Curve and the Pollution-Halo/Haven Hypotheses: An Investigation in Brazilian Municipalities. Sustainability 2021, 13, 4114. [Google Scholar] [CrossRef]
  38. Chen, H.M. Evaluation on the Development of International Carbon Accounting Systems. China Popul. Res. Environ. 2011, 21, 111–116. [Google Scholar]
  39. The Intergovernmental Panel on Climate Change (IPCC). 2006 IPCC Guidelines for National Greenhouse Gas Inventories; Institute for Global Environmental Strategies (IGES): Kanagawa, Japan, 2006. [Google Scholar]
  40. National Bureau of Statistics. China Energy Statistical Yearbook; Chinese Statistics Press: Beijing, China, 2001–2018. [Google Scholar]
  41. Ehrlich, P.R.; Holdren, J.P. The people problem. Sat. Rev. 1970, 4, 42–43. [Google Scholar]
  42. Richard, Y.; Eugene, A.R.; Thomas, D. STIRPAT, IPAT and ImPACT: Analytic tools for unpacking the driving forces of environmental impacts. Ecol. Econ. 2003, 46, 351–365. [Google Scholar] [CrossRef]
  43. Dietz, T.; Rosa, E.A. Rethinking the environmental impacts of population, affluence and technology. Hum. Ecol. Rev. 1994, 1, 277–300. [Google Scholar]
  44. Li, X.G.; Sun, Y. The Dynamic Effect of Population, Land, Economic Urbanization. Econ. Prob. 2018, 3, 106–111. [Google Scholar]
  45. Xu, S.C.; He, Z.X.; Long, R.Y.; Shen, W.X.; Ji, S.B.; Chen, Q.B. Impacts of economic growth and urbanization on CO2 emissions: Regional differences in China based on panel estimation. Reg. Environ. Chang. 2016, 16, 777–787. [Google Scholar] [CrossRef]
  46. He, Z.X.; Xu, S.C.; Shen, W.X.; Long, R.Y.; Chen, H. Impact of urbanization on energy related CO2 emission at different development levels: Regional difference in China based on panel estimation. J. Clean. Prod. 2017, 140, 1719–1730. [Google Scholar] [CrossRef]
  47. Im, K.S.; Pesaran, M.H.; Shin, Y. Testing for unit roots in heterogeneous panels. J. Econ. 2003, 115, 53–74. [Google Scholar] [CrossRef]
  48. Kao, C. Spurious regression and residual-based tests for cointegration in panel data. J. Econ. 1999, 90, 1–44. [Google Scholar] [CrossRef]
  49. National Bureau of Statistics. China Statistical Yearbook; China Statistics Press: Beijing, China, 2001–2018. [Google Scholar]
  50. Xue, Y.J. “Twelfth five year plan” analysis and thirteenth five year plan of the Yangtze River economic zone. Sci. Dev. 2016, 86, 78–86. [Google Scholar]
  51. Liu, X.H. An empirical study on the dynamic relationship among energy consumption, economic growth and carbon dioxide emissions in the process of urbanization. J. Njxz Univ. 2019, 35, 97–103. [Google Scholar]
  52. Churkina, G.; Organschi, A.; Reyer, C.P.O.; Ruff, A.; Vinke, K.; Liu, Z.; Reck, B.K.; Graedel, T.E.; Schellnhuber, H.J. Buildings as a global carbon sink. Nat. Sustain. 2020, 3, 269–276. [Google Scholar] [CrossRef]
  53. Chang, C.T.; Yang, C.H.; Lin, T.P. Carbon dioxide emissions evaluations and mitigations in the building and traffic sectors in Taichung metropolitan area, Taiwan. J. Clean. Prod. 2019, 230, 1241–1255. [Google Scholar] [CrossRef]
  54. Feng, D.; Li, J. Impacts of Urbanization on Carbon Dioxide Emissions in the Three Urban Agglomerations of China. Resour. Environ. Yangtze Basin 2018, 27, 2194–2200. [Google Scholar]
  55. Li, X.Z. In the Past 20 Years, There Have Been Four GDP Growth Champions, Is It Time for Yunnan to Take the Lead. Available online: https://www.yicai.com/news/100286390.html (accessed on 24 April 2021).
  56. Luo, F.M. The influence of urbanization development on farmers’ income from household business: An empirical analysis based on the spatial econometric model. J. Xi’an Univ. Finan. Econ. 2019, 32, 34–40. [Google Scholar]
  57. Statistical Bulletin of National Economic and Social Development of Guizhou Province in 2017. Available online: http://202.98.195.171:81/channels/c7/c7_1.html (accessed on 24 April 2021).
  58. Davis, S.J.; Lewis, N.S.; Shaner, M.; Aggarwal, S.; Arent, D.; Azevedo, I.L.; Benson, S.M.; Bradley, T.; Brouwer, J.; Chiang, Y.M.; et al. Net-zero emissions energy systems. Science 2018, 360, eaas9793:1–eaas9793:9. [Google Scholar] [CrossRef] [PubMed] [Green Version]
  59. Yin, H.; Wang, W.D.; Wang, L.; Jiang, H.L. How does low carbon technology progress restrain carbon emission? An empirical evidence from China. Modern. Manag. 2020, 5, 90–94. [Google Scholar]
  60. Wang, S.J.; Fang, C.L.; Wang, Y. Spatiotemporal variations of energy-related CO2 emissions in China and its influencing factors: An empirical analysis based on provincial panel data. Renew. Sustain. Energ. Rev. 2016, 55, 505–515. [Google Scholar] [CrossRef]
  61. Yu, Y.; Jiang, T.Y.; Li, S.Q.; Li, X.L.; Gao, D.C. Energy-related CO2 emissions and structural emissions’ reduction in China’s agriculture: An input-output perspective. J. Clean. Prod. 2020, 276, 124169:1–124169:14. [Google Scholar] [CrossRef]
  62. Zhang, J.Q.; Yu, H.C.; Zhang, K.K.; Zhao, L.; Fan, F. Can Innovation Agglomeration Reduce Carbon Emissions? Evidence from China. Int. J. Environ. Res. Public Health 2021, 18, 382. [Google Scholar] [CrossRef]
  63. Wang, M.; Feng, C. Decomposition of energy-related CO2 emissions in China: An empirical analysis based on provincial panel data of three sectors. Appl. Energy 2017, 190, 772–787. [Google Scholar] [CrossRef]
  64. Shimada, K.; Tanaka, Y.; Gomi, K.; Matsuoka, Y. Developing a long-term local society design methodology towards a low-carbon economy: An application to Shiga Prefecture in Japan. Energy Policy 2007, 35, 4688–4703. [Google Scholar] [CrossRef]
  65. Brand, C.; Anable, J.; Morton, C. Lifestyle, efficiency and limits: Modelling transport energy and emissions using a sociotechnical approach. Energy Effic. 2019, 12, 187–207. [Google Scholar] [CrossRef] [Green Version]
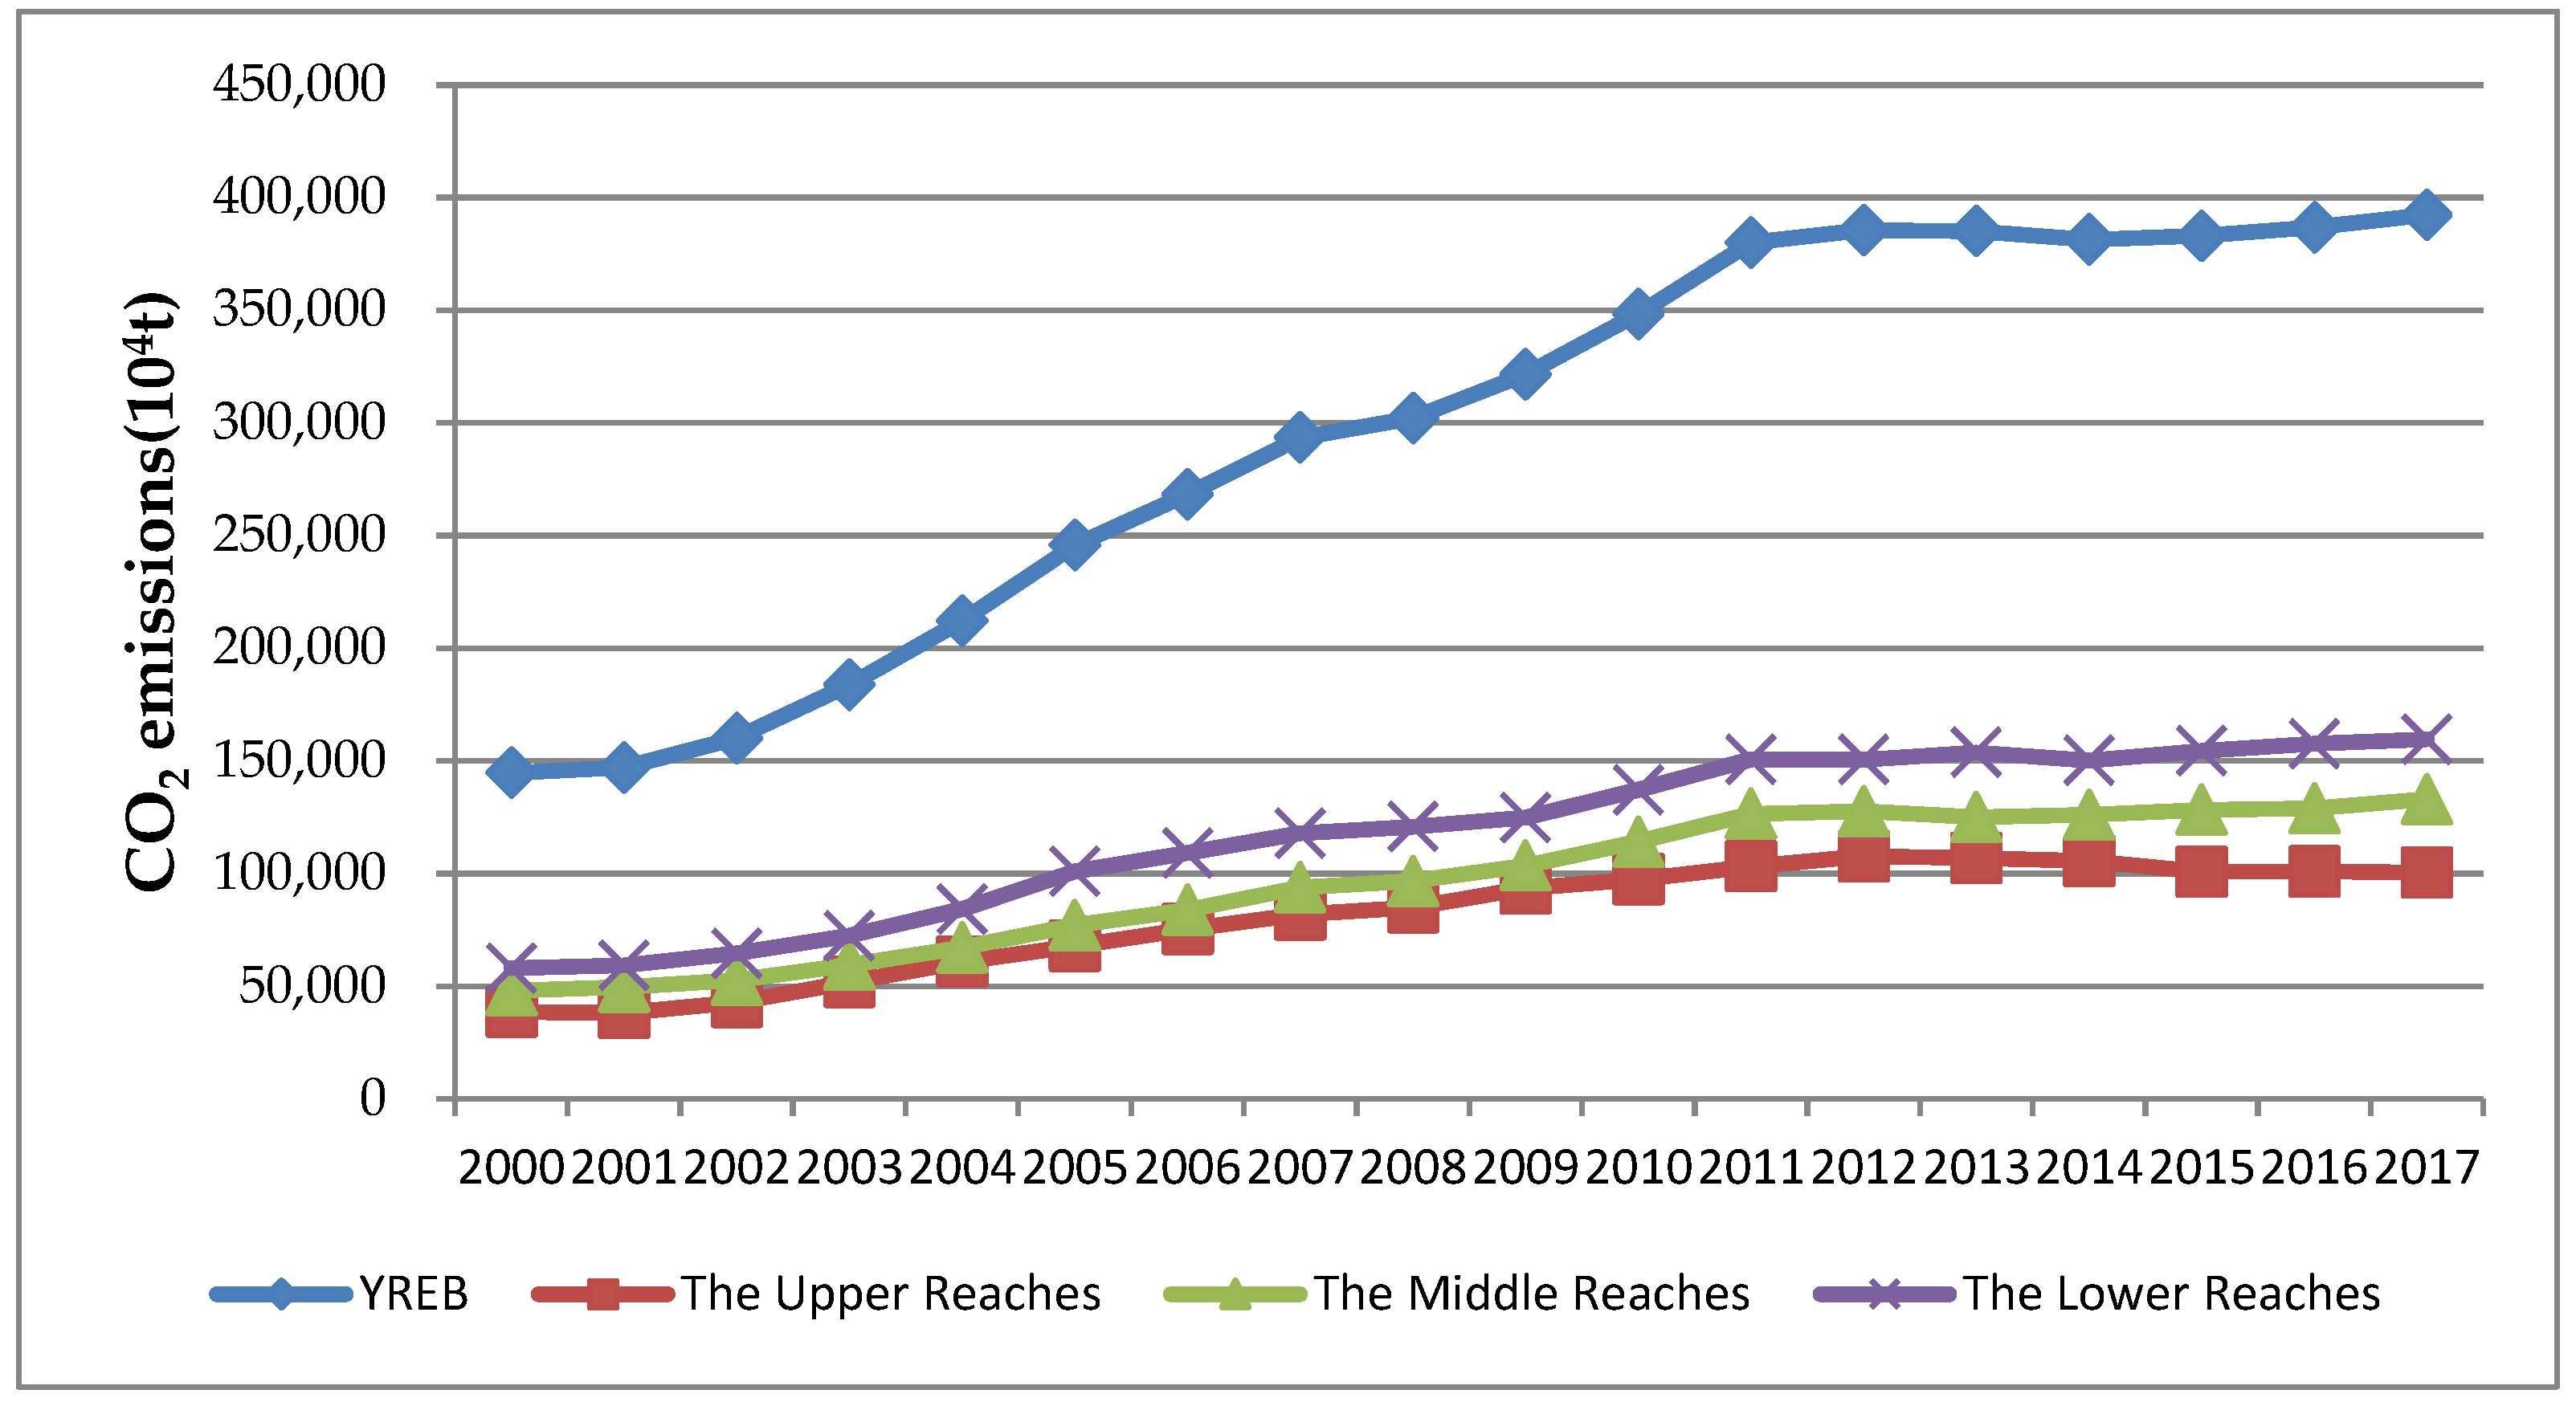
Figure 1. Changes in CO2 emissions.
Sustainability 13 07022 g001
Figure 2. Influence coefficient of the upper reaches.
Sustainability 13 07022 g002
Figure 3. Influence coefficient of the middle reaches.
Sustainability 13 07022 g003
Figure 4. Influence coefficient of the lower reaches.
Sustainability 13 07022 g004
Table 1. Carbon dioxide emission factors of energy types.
Energy TypeCO2 Emission Factor (kgCO2/kg)Energy TypeCO2 Emission Factor (kgCO2/kg)
Coal1.900 3Coke2.860 4
Crude oil3.020 2Gasoline2.925 1
Kerosene3.017 9Diesel3.095 9
Fuel oil Natural gas2.162 2(kgCO2/m3)
Table 2. Definitions of variables in Equation (6).
VariableDefinitionUnit
CTotal energy-related CO2 emissions104 tons
PTotal population at the end of the year104 people
PUProportion of urban household registered population in total population%
AGDPPer capita gross regional productyuan
EUThe proportion of the output of secondary and tertiary industries in gross regional product%
REThe number of domestic patent licensesnumber
EIGross regional product divided by gross energy consumption ton standard coal /104 yuan
Table 3. The results of the unit root test.
LLC p-ValueIPS p-Value
lnC−2.187 70.014 3−1.229 50.109 4
lnP−7.618 20.000 0−2.683 30.003 6
lnPU1.213 90.887 61.270 10.898 0
lnAGDP−3.177 10.000 7−1.226 60.110 0
lnEU−2.359 60.009 10.233 30.592 3
lnEU^2−3.504 60.000 2−1.176 00.119 8
lnRE−4.134 40.000 0−1.642 70.050 2
lnEI0.412 20.659 9−0.093 80.462 7
lnEI^2−5.618 60.000 0−1.743 00.040 7
D.lnI−5.827 00.000 0−5.421 40.000 0
D.lnP−3.555 50.000 2−5.469 10.000 0
D.lnPU−3.517 50.000 2−5.105 70.000 0
D.lnAGDP−3.314 10.000 5−2.707 70.003 4
D.lnEU−5.620 20.000 0−3.969 10.000 0
D.lnEU^2−4.455 20.000 0−4.133 40.000 0
D.lnRE−4.378 60.000 0−3.510 30.000 2
D.lnEI−8.270 50.000 0−6.869 80.000 0
D.lnEI^2−4.933 80.000 0−3.670 90.000 1
Note: ln- represents the natural logarithm of the corresponding variables; D.ln- represents the first difference of the corresponding variables.
Table 4. The results of the KAO co-integration test.
Ho: No cointegrationNumber of panels=11
Ha: All panels are cointegratedNumber of riods=16
Cointegrating vector: Same
Panel means:IncludedKernel:Bartlett
Time trend:Not includedLags:1.55 (Newey-West)
AR parameter:SameAugmented lags:1
Statistic p-value
Modified Dickey-Fuller t−3.552 80.000 2
Dickey-Fuller t−3.080 50.001 0
Augmented Dickey-Fuller t −4.140 2 0.000 0
Unadjusted modified Dickey-Fuller t−3.848 70.000 1
Unadjusted Dickey-Fuller t −3.180 30.000 7
Table 5. Regression results of panel data of the Yangtze River Economic Belt.
VariablesYREBThe Upper ReachesThe Middle ReachesThe Lower Reaches
lnP0.838 ***0.694 ***0.1731.420 ***
lnPU−0.350 **−0.543 **0.632 **0.918 ***
lnAGDP0.968 ***1.284 ***0.717 ***0.765 ***
lnEU−1.841 *−6.172 ***3.3143.355
lnEU^2−7.334 ***−16.207 ***7.11216.098
lnRE0.038 *-0.0310.015−0.015
lnEI1.042 ***1.333 ***0.856 ***1.060 ***
lnEI^20.0110.004−0.214 ***0.084
_cons−7.318 ***−9.382 ***2.386−8.645 ***
R20.9610.9600.9870.981
F63.17 ***3.05 **165.18 ***3.42 **
Hausman1.319.5742.75 ***6.87
Notes: * p < 0.1, ** p < 0.05, and *** p < 0.01; F represents the F test; Hausman represents the Hausman test.
Table 6. Regression results of the panel data of changes in CO2 emissions stages.
VariablesYREBThe Upper ReachesThe Middle ReachesThe Lower Reaches
IIIIIIIIIIII
lnP0.9039 ***−0.84100.8597 ***0.7533 ***0.2110−0.22711.3464 ***0.1786
lnPU0.1773−0.0880−0.4695 ***−0.5716 ***0.6287 **0.6604 **0.56260.5344
lnAGDP0.9178 ***0.9318 ***1.2634 ***1.2663 ***0.7219 ***0.6412 ***0.7094 ***0.1127
lnEU−2.3489 *4.9550−3.9591 **−5.5715 ***3.27682.82796.4199 *−16.9359 ***
lnEU^2−5.6939 **17.5749−13.3168 ***−16.3703 ***7.07684.056123.8644 *−175.6827 ***
lnRE−0.0017−0.0519−0.0944 *−0.05580.01350.01830.0003-0.0304
lnEI0.8665 ***0.8668 ***1.2948 ***1.2657 ***0.8593 ***0.7620 ***1.0024 ***−0.9310 ***
lnEI^2−0.0271−0.05550.0500−0.0526−0.2163 **−0.2455 **0.0491−0.6599 ***
_cons−6.6871 ***8.7655−9.6828 ***−9.3965 ***1.99316.5274−7.6437 ***7.7671 **
R20.96110.39480.97240.95000.98520.98550.98230.9847
F26.88 ***70.98 ***1.093.69 **119.69 ***27.19 ***2.9820.87 ***
Hausman5.5863.59 ***-12.3012.92158.11 ***-45.84 ***
Notes: * p < 0.1, ** p < 0.05, and *** p < 0.01; F represents the F test; Hausman represents Hausman test.
Publisher’s Note: MDPI stays neutral with regard to jurisdictional claims in published maps and institutional affiliations.