Abstract
Food processing can generate large amounts of carbohydrate-rich waste that inevitably has environmental and social impacts. Meanwhile, certain heterotrophic marine microorganisms, including algae and thraustochytrids, have the potential to convert carbohydrate-rich substrates into oil-rich biomass over relatively short time frames. To assess the merits of this apparent synergy, an initial conceptual process was developed based on the use of raw potato processing waste as feed in an algal bioreactor to produce bio-oil for further use within the food industry. A practical flowsheet was established with a conventional 200 kL bioreactor whereby the unit processes were identified, the mass balance developed, and estimates made of the various material and energy demands. These inputs were used to develop a baseline life cycle assessment (LCA) model and to identify opportunities for reducing environmental impacts. With the functional unit (FU) being 1 tonne cooking oil, the baseline configuration had a greenhouse gas (GHG) footprint of 2.4 t CO2-e/FU, which is comparable to conventional process routes. More detailed LCA revealed that electricity for stirring the bioreactor contributed approximately 78% of the total GHG footprint. By adjusting the operating conditions, the most promising scenario produced 0.85 t CO2-e/FU—approximately four times less than the conventional process—and shows the potential advantages of applying LCA as a tool to develop and design a new production process.
1. Introduction
Waste residue generated from food manufacturing is significant both in Australia and internationally [1,2,3]. As an example, for a leading Australian food manufacturer that processes over 300,000 tonnes of fresh potatoes each year [4], around 50% of the intake material can be viewed as waste due to loss in the fresh potato supply chain, including field loss (1–2%), grading loss (3–13%), storage loss (3–5%), packing loss (20–25%), and retail waste (1.5–3%) [5,6]. Processing this waste economically and with minimal environmental impact is a significant challenge for industry and the community.
The cultivation of algae has been proposed to convert sugar-based food waste residues into useable products [7]. Laboratory-scale evaluation of heterotrophic production systems has indicated that fast-growing marine algae and thraustochytrids (for simplicity hereafter referred to collectively as algae) may enable rapid feedstock conversion with high product yields [8]. Thus, complex organic compounds such as sugars can be converted to a wide variety of products including edible oils, biofuel, pigments, bioactive molecules, and a range of different specialty oils. Use of low value biomass residuals and/or waste streams as a feedstock avoids the controversy surrounding the use of food crops for fuel, while potentially mitigating other social and environmental concerns.
An alternative approach is herein proposed for recovery of value from low-value biomass residues of this type, with a distinguishing feature being that the system was designed under the guidance of life cycle assessment (LCA) from the outset. LCA is a widely recognized method for measuring and comparing the environmental impacts of products, processes, and services on a scientifically equivalent basis. It also enables the identification of hotspots—process features which, if altered, have the greatest potential to reduce environmental impacts. The LCA approach taken here ensures that process operating parameters remain within bounds that satisfy clearly defined production and environmental criteria.
The application of LCA as a tool to develop and design new production processes, as distinct from its use in assessing and/or optimizing the sustainability of existing food waste management strategies and technologies [9,10], has potential advantages [11]. A previous attempt to develop a framework and show how sustainability can be effectively incorporated in research and development in the context of product development was reported by Chapas et al. [12]. However, in the context of process design, the application of LCA was relatively limited. The present study demonstrates how LCA can be utilized to guide new process design in the case of potato processing waste and its subsequent conversion to useful products. With this case application in mind, we describe the development of a conceptual flowsheet, evaluate a provisional flowsheet using LCA, and use empirical results for subsequent improvement using LCA.
2. Materials and Methods
2.1. Goal and Scope
The conceptual process used was the conversion of potato processing residue to useful oils. Typically, processing raw potatoes to make value-added products (such as frying chips) results in circa 50% loss of the starting potato mass, which requires costly disposal to landfill. To address the disposal issue and add value to an underutilized material, a biochemical process was developed for the conversion of the potato residue into useful oils using a combined enzyme- and algae-mediated process.
Potential greenhouse gas (GHG) impacts of the conceptual flowsheet were examined so that the process input variables could be chosen and optimized based on LCA. LCA calculations were made using the SimaPro software application (Pré Sustainability, Amersfoort, The Netherlands; version 7.3.3 [13]), conducted in accordance with international standards [14] and Australian best practice guidelines [15]. Various operating scenarios were then examined for their GHG impacts and used for further refinement, with four main potential products from this processing route being identified: edible cooking oil, biodiesel, omega-3 oil, and jet fuel. GHG impact was deemed to be a more relevant LCA indicator for the present process than alternatives such as toxicity. Furthermore, the general applicability of GHG impact serves to illustrate that our proposed approach could be applied to other process design situations.
2.2. Functional Unit
The functional unit (FU) is one tonne of cooking oil. The co-products are omega-3 oil and the residual biomass, with jet fuel being excluded due to insufficient data regarding feedstock-to-product conversion. Omega-3 oil is a valuable nutraceutical, while the residual biomass (after oil extraction) can be used either as animal feed (agri-feed or aqua-feed) or as an energy and/or nutrient source for the current process. After its primary use, cooking oil can be converted to biodiesel, further reducing the GHG footprint of cooking oil production. While this latter conversion was not considered in the current analysis, it may be included in future sensitivity analyses.
2.3. Allocation
The simplified flowsheet and system boundary of the LCA are shown in Figure 1. A mass-based allocation of GHG impact was used in preference to an economic-based allocation, as per the LCA standard. While difficulties were found due to multiple product streams and the allocation of the GHG footprint to the main product and the co-products, similar difficulties were found in estimating the price of intended products in a tried and tested market. Despite this, an indicative economic-based allocation was used for comparison purposes, along with a preliminary techno-economic assessment for key processing scenarios using indicative pricing data from the authors’ database and from the literature. The LCA standard also advocates for system expansion, which has not been considered at this stage since these multiple products are produced from the same feedstock and route at the same time [14].
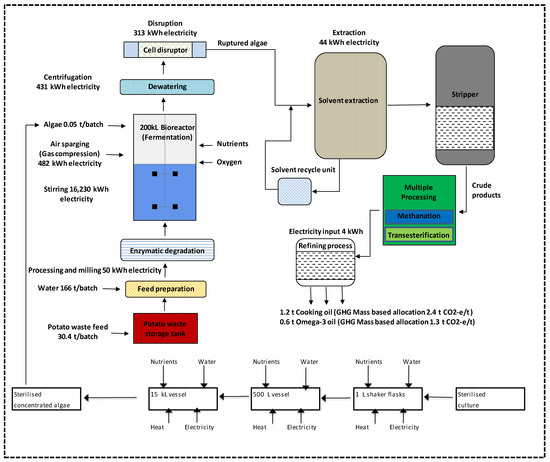
Figure 1.
Simplified conceptual flowsheet of the proposed process with system boundary for LCA, showing selected baseline LCA data (prior to LCA-guided optimization).
A work scheme (see Appendix A, Figure A1) was used in the estimation of the flowsheet mass balance (see Table A1). In this scheme, the input from a seed train process is fed into a conventional bioreactor (Figure 1 and reference [16]), where the algae grow over a specified period: 3 days for growth plus half a day each for loading and unloading/cleaning. The final algal mass, harvested biomass (dry mass), waste moisture content, and feed ratio of the potato processing waste were estimated for each batch in the bioreactor based on a combination of literature values and laboratory data (Table 1). The final oil content of the harvested biomass was based on measured yields in the laboratory. The product streams of cooking oil [16,17] and omega-3 oils were determined based on the conversion yield of products from the oil fraction of the harvested biomass.

Table 1.
List of feedstock and bioreactor-related assumptions for developing the conceptual flowsheet.
2.4. Process Modelling and Mass Balance
In developing the conceptual flowsheet, several assumptions were made (Table 1) and the mass balance of inputs and outputs identified (Table 2). Total mass is approximate due to some minor components not being included, while concentrated input algae and associated water from the seed train was 8.5 t/batch. Feed of raw potato waste including embodied water was 188 t/batch, with pretreatment by milling and ultrasound included to release a form of carbon that can be easily utilized by the algae [17]. While the present approach can be readily generalized, the specific data used herein were based primarily on algae strain TC 020, due to favorable growth and oil productivity traits [8,20,21]. TC 020 has been previously described as a species of Aurantiochytrium isolated from a mangrove habitat in far north Queensland, Australia [20].
Table 2.
Baseline case inputs and outputs per batch in a 200 kL bioreactor (working volume).
Estimates of specific energy and nutrient chemical requirements ([22]; Table A1, Table A2 and Table A3) were used as inputs and treated as life cycle inventory data tables. Energy estimates comprised mainly electrical power for stirring, sparging of air, and other unit processes. The overriding bioreactor criterion was to maintain the oxygen transfer rate (OTR) into the bioreactor broth at industrial scale. Selecting oxygen transfer rate (OTR) as the limiting factor is reasonable under the condition of excess nutrient provision. The Bioreactor Design software application (version 4.0, Pieter T. E. van Santen, The Netherlands) was used to estimate the OTR for each bioreactor configuration. The computation of stirring energy was validated by independent estimation and calibration according to the literature [23,24,25,26,27,28]. Traditionally the direct estimation of OTR has sometimes been avoided by using a simpler heuristic. One alternative convention for scaling up bioreactors and other stirred vessels is to maintain a constant ratio of input stirrer power to vessel charge volume (as in a 7/9 power scaling rule) [29,30], but preliminary calculations indicated this would provide a greater OTR than the estimated minimum requirement. Similarly, maintaining constant equivalent vessel-volumes of gas delivered per minute (“vvm”) upon scaling up [31] resulted in greater OTR than required (even larger than with the 7/9 power scaling rule). Therefore, the minimum feasible OTR was set as a target. Once the gas flowrate and pressure were set, the required compressor duty was estimated, assuming isentropic operation [32,33].
Material and energy input data were modelled with data from a plant in Ireland [13] supplemented with Australian sources where available, thus the GHG factors for materials and energy were adjusted for Australian conditions (i.e., natural gas from pipelines in Australia and electricity from the grids of Australian states). Oxygen gas was also used as an input in the base case, whereby oxygen gas (1 tonne) production requires an equivalent of 500 kWh of electricity. Minor and trace nutrients are important inputs for this process and need to be supplied at certain doses, in addition to the main waste substrate, to ensure robust algae growth. The main organic nutrient is glucose, which was supplied in the form of embodied sugar in potato waste. Other important nutrients from an LCA perspective are yeast extract [34], peptone, glutamic acid, phosphoric acid, ammonia, various salts (Mg, K, Fe and Zn), enzymes and vitamins (see Table A2 for details).
The electricity factor for GHG emission was assumed to be the average for the national grid of Australia (i.e., 1.04 kg CO2-e/kWh).
3. Results
3.1. Base Case GHG Footprint
From an initial calculation of base case energy consumption per batch of biomass product from a 200 kL reactor (Table A3), the base case GHG footprint was calculated as 2.4 t CO2-e/FU (Figure 2). This value can be compared with rapeseed oil at 3.42 t CO2-e/FU (SimaPro Ecoinvent database [13]) as a representative cooking oil with a relatively low environmental impact [3]. Electricity used by the stirring unit contributed to over 78% of the total GHG footprint. While stirring is conventionally essential for the optimal growth of algae in a process such as this, a decrease in stirring intensity can be balanced by an increase in oxygen injection, as growth is strongly associated with levels of dissolved oxygen (DO) in the bioreactor broth [35]. This balance between stirring level and oxygen injection was continually reviewed during the application of LCA to the process design.
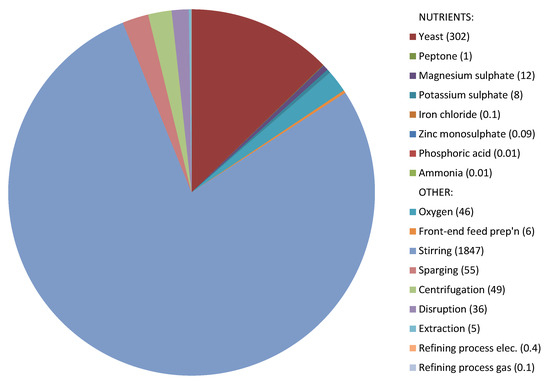
Figure 2.
GHG footprint of 1 t cooking oil according to the conceptual flowsheet (2.4 t CO2-e/t of cooking oil), in the base case of operation. Amounts in parentheses denote individual contributions to GHG impact (kg CO2-e/t of cooking oil).
The use of input nutrients and other unit processes contributed the remaining 22% of GHG emissions. When considering only the non-stirring components of GHG emissions, the production of yeast contributed over 58%, followed by sparging (11%), centrifugation (9.4%), and oxygen (8.9%) (see also Figure A2). Yeast is generally produced from the fermentation of whey, which requires materials, energy, infrastructure, and has additional emissions. Yet whey fermentation also delivers co-products, namely ethanol, yeast paste, and protein concentrate.
When using an economic-based allocation, initial estimates showed that the GHG footprint would become 1.1 t CO2-e/FU, which is about half of the base case result using our mass-based allocation. The omega-3 oil product stream would have a major effect on this estimate of the GHG footprint because the price of omega-3 oil is much higher compared with cooking oil or biodiesel product, however this aspect requires further assessment. Base case electricity consumption due to stirring was again significantly higher than all other components, with potential trade-offs between electricity used for stirring and sparging of oxygen. As an optimal balance in these factors was yet to be determined for the base case—balancing highest algal biomass production with lowest GHG emission footprints of biomass products—further investigation was needed in the form of alternative scenario simulations.
3.2. Simulated Alternative Scenarios
Simulation of bioreactor energy consumption was undertaken for several alternative cases, with prior work by Lee Chang et al. [8] being used as a control scenario whereby the objective was to maintain dissolved oxygen (DO) at or above 30% of saturation by controlling the agitation rate, with the gas flowrate and composition being held constant (Table 3). A variable stirrer speed was employed in the small-scale experiments, starting at the minimum rate, rising to the maximum rate during the first two days, and then decreasing again during the last day. The experiment was run in fed-batch mode using glucose and a nutrient broth (Table A2). From these benchtop experimental parameters, a suitable oxygen transfer rate (OTR) was calculated to be approximately 0.042 mol·m3·s−1 (see Table A4). This empirical OTR value was then used as the basis for scaling up in our modelling of a range of industrial bioreactor operating scenarios.
Table 3.
Key control scenario operating parameters.
Various alternative scenarios to the baseline case were tested, with the alternative scenarios being arranged into groups of similar conditions (Table A4). To summarize, these were: adjustment of the DO target; adjustment of the gas flowrate; operation with pure oxygen; operation with air only; elevated pressure; operation with air only at elevated pressure in the bioreactor headspace; operation with pure oxygen at elevated pressure in the bioreactor headspace; operation at 50 °C; and several combinations that included adjustment of the gas flowrate or the DO target. Based on LCA evaluations of these various scenarios, the following interpretations were made.
- A pure oxygen feed was highly effective if volumetric gas flowrate was reduced.
- Conversely, increases in the volumetric gas flowrate were advantageous in the baseline scenario especially when switching to sparging air only.
- Operation of the bioreactor at elevated pressures was advantageous [35], especially when combined with the pure oxygen feed (at low flowrate).
- Operation with a reduced DO target decreased the stirrer power.
- A reduction in oxygen solubility (due to elevated temperature or a change in broth composition) may result in significant increases to required power.
Additional alternative conceptual scenarios for operating the batch reactor were then developed and simulated, with each scenario being implemented uniformly across the entire duration of the batch. Importantly, the gas flowrates were constant at the new respective values and did not change over the course of the test, which is consistent with the control strategy adopted in the preliminary experiment, though not necessarily optimal. Further experimental investigation of alternative control sequences is required, both to provide more data for LCA and to check practicality in terms of basic issues such as biomass survival.
Two promising large-scale simulated scenarios based upon parameters obtained by small-scale experiments, termed Scenarios U and Z, respectively, were selected for closer inspection (Table 4). Both operated at elevated pressure and reduced stirrer speed. For Scenario U, no additional oxygen was added to the gas stream and only air was sparged, while for Scenario Z only pure oxygen was injected (Table A4).
Table 4.
Summary of energy demand for key process items in the baseline case and two selected alternative scenarios at industrial scale (200 kL). All other operating conditions were equivalent for the three scenarios. For pure oxygen supply, the electrical energy values shown are indicative of that which would result in “equivalent” CO2 output.
When comparing the equivalent GHG impact of the base case with Scenarios U and Z (1.23 and 0.85 t CO2-e/FU, respectively; Figure 3), the alternative scenarios each resulted in low energy demand from impeller movement, a previously identified GHG-generating hotspot. However, increased energy was required for sparging and embedded in the provision of a large amount of pure oxygen. Power inputs via stirrer usage, compressor usage, and equivalent oxygen supply were estimated for scenarios U and Z for the duration of the batch run and converted to energy values. For each scenario, the power requirements were spread evenly across these three power categories, in contrast to the baseline case, which was dominated by stirrer power. Any further reductions in stirrer power in the alternative scenarios were likely to be offset by increases in the other two forms of power. The power equivalence used for pure oxygen supply is indicative only—it is based on equating GHG impact of energy generation and oxygen production from the SimaPro database for Australia—with a final assessment to be made through conventional LCA coupled with further experimental validation of the alternative scenarios at benchtop and/or pilot scale.
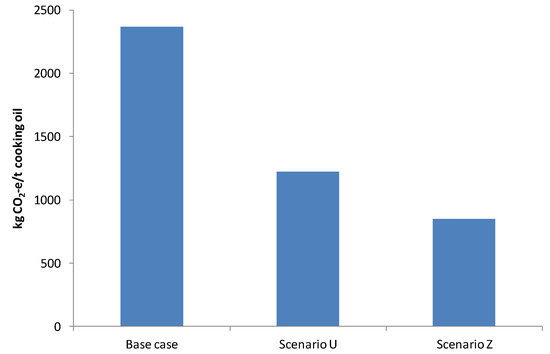
Figure 3.
GHG footprint of cooking oil produced by algae for the base case and two alternative scenarios.
Scenario Z had the lowest total energy use of all scenarios, yet had a higher contribution from pure oxygen, as it was supplied over all three days of the batch. In this scenario, the benefits due to reduced stirrer power would mostly be accrued on the second day of the batch only. Scenario U had the second-lowest total energy use, with no contribution from pure oxygen supply, but with a larger contribution from compressor power. Based on these results, scenario Z would be preferred over scenario U.
Low rotation rates in the industrial scale bioreactor may at first seem inadequate (as low as 8 rpm for scenario Z at the start of the batch), however this rate would be hydrodynamically equivalent to a rotation rate of 100 rpm at the 2 L benchtop scale. As a result, the numerical integration of energy consumption over time was conducted without modification. The feasibility of such an operational mode requires follow-up experimental validation, though a sensitivity analysis on the LCA can express some of these uncertainties.
3.3. Technoeconomic Evaluation
A preliminary technoeconomic evaluation of the conceptual process was undertaken following the procedure described in Hosseini et al. [36], using data derived from the baseline case, scaled up to simulate a major facility producing a total of 20,000 t/year cooking oil. Hence, the economic evaluation relies in part on the assumptions embedded in the LCA study. The estimated capital cost required for such a plant was AUD 100 million, depreciated over 20 years. It was assumed that 20 full time equivalent (FTE) personnel were required to operate this plant, although this number could be reduced if the production were an extension to an existing facility. The evaluation suggested that the operating cost of producing cooking oil using algae may be three times higher than the current market price of conventional cooking oil, at around AUD 3/kg. Oxygen, other raw materials (predominantly yeast), and electricity together contributed to over 90% of the operating cost, with close to equal contribution from each.
The operating cost can be significantly impacted by changes in the operational configuration. An improvement in the operating cost was calculated for scenario U, where the cost of supplementing the gas stream with pure oxygen is avoided, attaining an estimate of around AUD 2/kg. Conversely, for scenario Z, the exclusive use of pure oxygen for sparging raised the estimated operating cost to around AUD 5/kg. Such substantial changes show the opportunities for further optimization that would be achievable by iteratively refining the process while accounting for both LCA and financial considerations together during development of the process design.
4. Discussion
4.1. Iterative Refinement of Process Design Using Life Cycle Assessment
With a conceptual process having embedded recycling/rescue elements, as defined in the EPA food recovery hierarchy [37], a generic process flowsheet was developed as a key starting point, and several key elements were identified as requiring critical examination by LCA for a base case of operation. Indeed, the use of LCA to guide process design may require subsequent iterative refinement if specific products change or process expansion is required. In the process considered here, after iterative refinement of simulated alternatives, two scenarios were examined more closely in terms of critical energy demand —an aspect that is often lacking in life cycle impact assessment [38]—and found to have a GHG footprint between one-third and one-half of a base case (conventional) scenario. Stirring versus oxygen addition and the balance between these two process features was found to be a critical consideration in overall process design. Further to this, different elements of these two scenarios were shown to be strengths from an LCA versus a techno-economic perspective, respectively. Industrial implementation of the process will ultimately need to consider each of these forms of evaluation.
4.2. Modifications and Optimization
While estimates for the proposed processes are based on the experimental and literature data at hand, these estimates are very conservative and could almost be taken as a worst case. No credits have been given for processing waste material (e.g., carbon credits) or for production of multiple products, which would reduce the operating cost. Inclusion of the value of co-products is expected to greatly improve the process economics [39]: omega-3 oils may comprise 25% of the algal lipids, with a value per unit mass more than 100 times greater than that of cooking oil [40] and a large existing global market [41]. In addition, average Australian costs for inputs were used, though significant savings on the averages may be attainable.
Several avenues for further optimization of this assessment may remain, including testing additional process variables, more detailed assessment of unit processes that have lower initial contributions to GHG impact, and inclusion of other factors that were outside the present scope e.g., the spatial specificity and transport of raw materials and products. As an example, subsequent conversion of the cooking oil into biodiesel was not included, yet this could hold potential additional benefits. The objective function may also be modified to simultaneously assess the weighted importance of GHG impact, financial cost, and critical logistics. Finally, a strategy to decrease sensitivity of the process to feedstock variation is also important.
5. Conclusions
Significant progress was made toward using LCA to guide process design and set or constrain key operating parameters, while suggesting an industrially relevant process for converting residual biomass into valuable product(s). Electricity used for bioreactor stirring was the major contributor to the total GHG footprint of the proposed process, while testing of alternative scenarios found that balancing the contribution from stirring versus oxygen addition was a critical consideration in overall process design. Further experiments should be carried out to validate the suggested processing configuration and confirm its industrial viability. Bench-top bioreactor experiments informed by the up-front LCA, with subsequent scenario-testing, would provide further insight into the sensitivity of the system to deviations from the target parameter values. A new process as outlined here has the potential to add significant value to current commercial operations and resolve a waste disposal issue. The potato residue conversion process could be used to produce oils for a wide variety of applications including frying oil, nutraceuticals (e.g., omega-3 fatty acids), lubricants and biofuels from renewable resources.
Author Contributions
Conceptualization, G.J.D., N.H., D.I.V. and D.M.F.F.; process design, G.J.D., N.H., D.I.V. and D.M.F.F.; algal experimentation and analysis, D.M.F.F., G.J.D. and K.J.L.-C.; engineering and LCA analysis, D.I.V. and N.H., writing—draft preparation, D.M.F.F., N.H., D.I.V., G.J.D. and K.J.L.-C.; project administration, G.J.D.; funding acquisition, G.J.D., D.I.V. and K.J.L.-C. All authors have read and agreed to the published version of the manuscript.
Funding
This research received no external funding.
Institutional Review Board Statement
Not applicable.
Informed Consent Statement
Not applicable.
Data Availability Statement
The data presented in this study are available on request from the corresponding author.
Acknowledgments
The authors wish to thank Graeme Dunstan, Henry Sabarez and Linda Howell for their valuable contributions to the paper, and Lucas Rye and Sarah King for providing useful literature inputs and insights. Carol Nichols and Sue Blackburn are acknowledged for thorough review and for providing constructive suggestions. Thank you also to two anonymous reviewers for their useful comments.
Conflicts of Interest
The authors declare no conflict of interest.
Appendix A
Table A1.
Material and energy inputs and outputs of the unit processes within the system boundary in the base case of operation.
Table A1.
Material and energy inputs and outputs of the unit processes within the system boundary in the base case of operation.
| Resources | Value | Unit | GHG Footprint (kg CO2-e/FU) |
|---|---|---|---|
| Materials/fuels: | |||
| Yeast paste, from whey, at fermentation | 2064 | kg | 302 |
| Protein concentrate, from whey, at fermentation | 165 | kg | 1 |
| Magnesium sulfate, at plant | 203 | kg | 12 |
| Potassium sulfate, at regional storehouse | 83 | kg | 7.6 |
| Iron (III) chloride, 40% in H2O, at plant | 1.2 | kg | 0.1 |
| Zinc monosulfate, ZnSO4·H2O, at plant | 0.54 | kg | 0.09 |
| Phosphoric acid, industrial grade, 85% in H2O, at plant | 0.06 | kg | 0.01 |
| Ammonia, steam reforming, liquid, at plant | 0.06 | kg | 0.01 |
| Oxygen, liquid, at plant | 3000 | kg | 246.6 |
| Electricity (low voltage)/heat (Australian): | |||
| Feed preparation-milling (kWh) | 50 | kWh | 5.68 |
| Stirring, low voltage (MWh) | 17 | MWh | 1931 |
| Sparging, low voltage (kWh) | 482 | kWh | 22.72 |
| Centrifugation (kWh) | 431 | kWh | 48.96 |
| Disruption (kWh) | 313.25 | kWh | 35.58 |
| Extraction (kWh) | 43.68 | kWh | 4.96 |
| Refining process from electricity (kWh) | 3.65 | kWh | 0.41 |
| Refining process, (from natural gas, MJ) | 16.96 | MJ | 0.11 |
Data derived from references [8,13,22].
Table A2.
List of nutrients as input in bioreactor for algal growth 1.
Table A2.
List of nutrients as input in bioreactor for algal growth 1.
| Components | Value (kg/kg algae) |
|---|---|
| Yeast extract | 0.46 |
| Peptone | 0.04 |
| Monosodium glutamic acid | 0.18 |
| Corn steep liquor (CSL) | 0.02 |
| MgSO4·7H2O | 0.04 |
| KH2PO4 | 0.02 |
| NaHCO3 | 0.01 |
| MnCl2·4H2O | 7.8 × 10⁻⁴ |
| FeCl3·6H2O | 2.7 × 10⁻⁴ |
| ZnSO4·7H2O | 1.2 × 10⁻⁴ |
| CoCl2·6H2O | 2.7 × 10⁻⁵ |
| CuSO4·5H2O | 1.8 × 10⁻⁵ |
| Pyridoxine hydrochloride | 1.8 × 10⁻⁵ |
| Thiamine (vitamin B1) | 9.1 × 10⁻⁶ |
| Calcium pantothenate (vitamin B5) | 9.1 × 10⁻⁶ |
| Aminobenzoic acid | 9.1 × 10⁻⁶ |
| Riboflavin (vitamin B2) | 9.1 × 10⁻⁶ |
| Nicotinamide | 9.1 × 10⁻⁶ |
| Biotin (vitamin B7) | 3.6 × 10⁻⁶ |
| Folic acid (vitamin B9) | 3.6 × 10⁻⁶ |
| Vitamin B12 | 1.8 × 10⁻⁷ |
| Phosphoric acid 10% | 1.4 × 10⁻⁵ |
| Ammonia 10% | 1.3 × 10⁻⁴ |
1 Data calculated from reference [8].
Table A3.
Specific energy consumption per batch in base case.
Table A3.
Specific energy consumption per batch in base case.
| Unit Process | Values | Unit (Per Batch) | Energy Type |
|---|---|---|---|
| Front-end processing and milling | 50 | kWh | Electricity |
| Stirring | 16,230 | kWh | Electricity |
| Air sparging (gas compression) | 482 | kWh | Electricity |
| Centrifugation | 431 | kWh | Electricity |
| Disruption | 313 | kWh | Electricity |
| Extraction | 44 | kWh | Electricity |
| Refining process | 4 | kWh | Electricity |
| Refining process | 5 | kWh | Natural gas |
Estimated from prior experience and reference [22].

Figure A1.
Work scheme for developing reactor mass balance.
Table A4.
Full listing of alternative operating scenarios. The descriptions mark deviations from the base case. The maximum stirring rate is shown for each scenario, occurring about 48 h into a batch.
Table A4.
Full listing of alternative operating scenarios. The descriptions mark deviations from the base case. The maximum stirring rate is shown for each scenario, occurring about 48 h into a batch.
| SCENARIO | INPUTS | POWER | |||||||||||
|---|---|---|---|---|---|---|---|---|---|---|---|---|---|
| Description | Mixing Rate [rpm] | Gas (pstirrer1) [L/min] | Gas (at 1 atm) [L/min] | O2 in gas [%] | DO [% sat’n] | pheadspace [atm] | T [°C] | OTR [mol/m3/s] | Mixing [kW] | Aeration [kW] | Oxygen [kW-e] | SUM [kW-e] | |
| BENCHTOP | 1020 | 0.32 | 0.324 | 24.71 | 29.8 | 1 | 20 | 0.0419 | 0.0218 | ||||
| BASELINE CASE | 61 | 2219 | 3552 | 24.71 | 30 | 1 | 20 | 0.0426 | 448 | 8 | 13 | 469 | |
| A | Low DO | 54 | 2219 | 3552 | 24.71 | 10 | 1 | 20 | 0.0424 | 311 | 8 | 13 | 332 |
| B | Extreme high flow | 36 | 500,000 | 800,138 | 24.71 | 30 | 1 | 20 | 0.0416 | 31 | 1842 | 3038 | 4910 |
| C | Extreme high flow + low DO | 32 | 500,000 | 800,138 | 24.71 | 10 | 1 | 20 | 0.0417 | 22 | 1831 | 3038 | 4890 |
| D | V. high flow | 45 | 50,000 | 80,014 | 24.71 | 30 | 1 | 20 | 0.0419 | 103 | 177 | 304 | 584 |
| E | V. high flow + low DO | 40 | 50,000 | 80,014 | 24.71 | 10 | 1 | 20 | 0.0421 | 73 | 177 | 304 | 554 |
| F | High flow | 49 | 20,000 | 32,006 | 24.71 | 30 | 1 | 20 | 0.0417 | 165 | 70 | 122 | 357 |
| G | High flow + low DO | 44 | 20,000 | 32,006 | 24.71 | 10 | 1 | 20 | 0.0428 | 121 | 70 | 122 | 313 |
| H | Moderately high flow | 53 | 10,000 | 16,003 | 24.71 | 30 | 1 | 20 | 0.0428 | 245 | 35 | 61 | 341 |
| I | Moderately high flow + low DO | 47 | 10,000 | 16,003 | 24.71 | 10 | 1 | 20 | 0.0428 | 174 | 35 | 61 | 270 |
| J | Pure O2 | 31 | 2219 | 3552 | 100 | 30 | 1 | 20 | 0.0416 | 59 | 8 | 283 | 350 |
| K | Pure O2 + lower DO | 28 | 2219 | 3552 | 100 | 10 | 1 | 20 | 0.0432 | 43 | 8 | 283 | 335 |
| L | Pure O2 + lower flow | 34 | 1000 | 1600 | 100 | 30 | 1 | 20 | 0.043 | 78 | 3 | 128 | 209 |
| M | Pure O2 + v. low flow | 36 | 500 | 800 | 100 | 30 | 1 | 20 | 0.0422 | 92 | 2 | 64 | 158 |
| N | Air only | 66 | 2219 | 3552 | 20.95 | 30 | 1 | 20 | 0.0426 | 567 | 8 | 0 | 575 |
| O | Air only + v. high flow | 49 | 50,000 | 80,014 | 20.95 | 30 | 1 | 20 | 0.0425 | 131 | 177 | 0 | 308 |
| P | Air only + high flow | 53 | 20,000 | 32,006 | 20.95 | 30 | 1 | 20 | 0.0417 | 206 | 70 | 0 | 276 |
| Q | Air only + moderately high flow | 57 | 10,000 | 16,003 | 20.95 | 30 | 1 | 20 | 0.0423 | 301 | 35 | 0 | 336 |
| R | High p | 47 | 2219 | 5771 | 24.71 | 30 | 2 | 20 | 0.0416 | 205 | 17 | 22 | 243 |
| S | Air, slightly higher p a | 60 | 2219 | 4136 | 20.95 | 30 | 1.263 | 20 | 0.0412 | 426 | 10 | 0 | 436 |
| T | Air, high p | 51 | 2219 | 5771 | 20.95 | 30 | 2 | 20 | 0.0414 | 262 | 17 | 0 | 278 |
| U | Air, v. high p b | 33 | 2219 | 13,818 | 20.95 | 30 | 5.625 | 20 | 0.0409 | 71 | 64 | 0 | 135 |
| V | Pure O2, high p c | 23 | 2219 | 6370 | 100 | 30 | 2.270 | 20 | 0.0412 | 24 | 19 | 508 | 552 |
| W | Pure O2, v. high p | 17 | 2219 | 12,429 | 100 | 30 | 5 | 20 | 0.0435 | 10 | 55 | 992 | 1056 |
| X | Pure O2 + lowish flow, high p c | 25 | 1000 | 2870 | 100 | 30 | 2.270 | 20 | 0.0418 | 31 | 9 | 229 | 269 |
| Y | Pure O2 + lower flow, high p c | 27 | 500 | 1435 | 100 | 30 | 2.270 | 20 | 0.0428 | 39 | 4 | 115 | 158 |
| Z | Pure O2 + v. low flow, high p c | 28 | 280 | 804 | 100 | 30 | 2.270 | 20 | 0.0412 | 43 | 2 | 64 | 110 |
| α | T = 50 °C water | 73 | 2219 | 3538 | 24.71 | 30 | 1 | 50 | 0.0414 | 760 | 8 | 13 | 781 |
a p(O2)~p (oxygen from air enriched to 0.2471% O2 at tank pressure); b p(O2)~p (pure O2 at tank pressure); c p(O2)~2 p (pure O2 at tank pressure). Abbreviations: DO = dissolved oxygen; OTR = oxygen transfer rate; p = pressure; v. = very.

Figure A2.
GHG footprint of 1 tonne of cooking oil according to the conceptual flowsheet excluding stirring (520 kg CO2-e/t of cooking oil), in the base case of operation.
References
- Notarnicola, B.; Tassielli, G.; Renzulli, P.A.; Castellani, V.; Sala, S. Environmental impacts of food consumption in Europe. J. Clean. Prod. 2017, 140, 753–765. [Google Scholar] [CrossRef]
- Willersinn, C.; Möbius, S.; Mouron, P.; Lansche, J.; Mack, G. Environmental impacts of food losses along the entire Swiss potato supply chain—Current situation and reduction potentials. J. Clean. Prod. 2017, 140, 860–870. [Google Scholar] [CrossRef]
- Mouron, P.; Willersinn, C.; Möbius, S.; Lansche, J. Environmental profile of the Swiss supply chain for French fries: Effects of food loss reduction, loss treatments and process modifications. Sustainability 2016, 8, 1214. [Google Scholar] [CrossRef]
- Australia, S. $12 Million Grant Secures a Bright Future for Simplot’s Ulverstone Potato Plant. Available online: https://www.simplot.com.au/news/news-articles/12-million-grant-secures-a-bright-future-for-simplot-s-ulverstone-potato-plant/ (accessed on 22 March 2021).
- Jagtap, S.; Bhatt, C.; Thik, J.; Rahimifard, S. Monitoring potato waste in food manufacturing using image processing and internet of things approach. Sustainability 2019, 11, 3173. [Google Scholar] [CrossRef]
- Terry, L.A.; Mena, C.; Williams, A.; Jenney, N.; Whitehead, P. Fruit and Vegetable Resource Maps: Mapping Fruit and Vegetable Waste through the Wholesale Supply Chain, RSC008; WRAP: Oxon, UK, 2011. [Google Scholar]
- Rye, L.; Batten, D. Alternative Aviation Fuel Feedstock: The Microalgae Solution. Available online: http://icas.org/ICAS_ARCHIVE/ICAS2012/PAPERS/222.PDF (accessed on 3 April 2021).
- Lee Chang, K.; Dumsday, G.; Nichols, P.; Dunstan, G.; Blackburn, S.; Koutoulis, A. High cell density cultivation of a novel Aurantiochytrium sp. strain TC 20 in a fed-batch system using glycerol to produce feedstock for biodiesel and omega-3 oils. Appl. Microbiol. Biotechnol. 2013, 97, 6907–6918. [Google Scholar] [CrossRef]
- Khoo, H.H.; Lim, T.Z.; Tan, R.B. Food waste conversion options in Singapore: Environmental impacts based on an LCA perspective. Sci. Total. Environ. 2010, 408, 1367–1373. [Google Scholar] [CrossRef]
- Lundie, S.; Peters, G.M. Life cycle assessment of food waste management options. J. Clean. Prod. 2005, 13, 275–286. [Google Scholar] [CrossRef]
- Patel, A.D.; Meesters, K.; den Uil, H.; de Jong, E.; Blok, K.; Patel, M.K. Sustainability assessment of novel chemical processes at early stage: Application to biobased processes. Energy Environ. Sci. 2012, 5, 8430–8444. [Google Scholar] [CrossRef]
- Chapas, R.; Brandt, V.; Kulis, L.; Crawford, K. Sustainability in R&D. Res. Technol. Manag. 2010, 53, 60. [Google Scholar]
- PRé. Life Cycle Consultancy and Software Solutions; Pré Sustainability: Amersfoort, The Netherlands, 2013. [Google Scholar]
- International Organization for Standardization (ISO). Environmental Management: Life Cycle Assessment; Principles and Framework; ISO: Geneva, Switzerland, 2006. [Google Scholar]
- Renouf, M.; Grant, T.; Sevenster, M.; Logie, J.; Ridoutt, B.; Ximenes, F.; Bengtsson, J.; Cowie, A.; Lane, J. Best Practice Guide for Mid-Point Life Cycle Impact Assessment in Australia—Version 2; Australian Life Cycle Assessment Society: Brisbane, Australia, 2016. [Google Scholar]
- Soderberg, A.C. Fermentation Design. In Fermentation and Biochemical Engineering Handbook, 3rd ed.; Todaro, C.M., Vogel, H.C., Eds.; William Andrew: Norwich, CT, USA, 2014; pp. 77–118. [Google Scholar]
- Zuo, Y.Y.J.; Hébraud, P.; Hemar, Y.; Ashokkumar, M. Quantification of high-power ultrasound induced damage on potato starch granules using light microscopy. Ultrason. Sonochem. 2012, 19, 421–426. [Google Scholar] [CrossRef]
- FAO. Bioenergy, Food Security and Sustainability—Towards an International Framework. High-Level Conference on World Food Security: The Challenges of Climate Change and Bioenergy. 2008. Available online: http://www.fao.org/fileadmin/user_upload/foodclimate/HLCdocs/HLC08-inf-3-E.pdf (accessed on 3 April 2021).
- Devereux, S.; Shuttleworth, P.; Macquarrie, D.; Paradisi, F. Isolation and characterization of recovered starch from industrial wastewater. J. Polym. Environ. 2011, 19, 971–979. [Google Scholar] [CrossRef]
- Lee Chang, K.J.; Dunstan, G.A.; Abell, G.; Clementson, L.; Blackburn, S.; Nichols, P.D.; Koutoulis, A. Biodiscovery of new Australian thraustochytrids for production of biodiesel and long-chain omega-3 oils. Appl. Microbiol. Biotechnol. 2012, 93, 2215–2231. [Google Scholar] [CrossRef] [PubMed]
- Lee Chang, K.; Nichols, C.; Blackburn, S.; Dunstan, G.; Koutoulis, A.; Nichols, P. Comparison of Thraustochytrids Aurantiochytrium sp., Schizochytrium sp., Thraustochytrium sp., and Ulkenia sp. for production of biodiesel, long-chain omega-3 oils, and exopolysaccharide. Mar. Biotechnol. 2014, 16, 396–411. [Google Scholar] [CrossRef] [PubMed]
- Lee Chang, K.J.; Rye, L.; Dunstan, G.; Grant, T.; Koutoulis, A.; Nichols, P.; Blackburn, S. Life cycle assessment: Heterotrophic cultivation of thraustochytrids for biodiesel production. J. Appl. Phycol. 2014, 27, 639–647. [Google Scholar] [CrossRef]
- Bertrand, J.; Couderc, J.P.; Angelino, H. Power consumption, pumping capacity and turbulence intensity in baffled stirred tanks: Comparison between several turbines. Chem. Eng. Sci. 1980, 35, 2157–2163. [Google Scholar] [CrossRef]
- Camp, T.R.; Stein, P.C. Velocity gradients and internal work in fluid motion. J. Boston Soc. Civ. Eng. 1943, 30, 219–230. [Google Scholar]
- Holland, F.A.; Chapman, F.S. Liquid mixing and processing in stirred tanks; Reinhold Pub. Corp.: New York, NY, USA, 1966. [Google Scholar]
- Ives, K.J. Coagulation and flocculation: Part II—Orthokinetic flocculation. In Solid-Liquid Separation, 4th ed.; Svarovsky, L., Ed.; Butterworth-Heinemann: Oxford, UK, 2001; pp. 130–165. [Google Scholar]
- Qasim, S.R.; Motley, E.M.; Zhu, G. Water Works Engineering: Planning, Design, and Operation; Prentice Hall PTR: Upper Saddle River, NJ, USA, 2000. [Google Scholar]
- Gogate, P.R.; Beenackers, A.A.; Pandit, A.B. Multiple-impeller systems with a special emphasis on bioreactors: A critical review. Biochem. Eng. J. 2000, 6, 109–144. [Google Scholar] [CrossRef]
- Aiba, S.; Humphrey, A.E.; Millis, N.F. Biochemical Engineering; Academic Press: New York, NY, USA, 1965. [Google Scholar]
- Verrelli, D.I. Drinking Water Treatment Sludge Production and Dewaterability. Ph.D Thesis, The University of Melbourne, Melbourne, Australia, 2008. Available online: http://hdl.handle.net/11343/35087 (accessed on 3 April 2021).
- Nienow, A.W. Scale-up, stirred tank reactors. In Encyclopedia of Industrial Biotechnology: Bioprocess, Bioseparation, and Cell Technology; John Wiley & Sons: San Francisco, CA, USA, 2009; pp. 1–38. [Google Scholar]
- Moshfeghian, M. Compressor Calculations: Rigorous Using Equation of State vs. Shortcut Method. Available online: http://www.jmcampbell.com/tip-of-the-month/2011/11/compressor-calculations-rigorous-using-equation-of-state-vs-shortcut-method/ (accessed on 3 April 2021).
- Lewis, D.P.; Patterson, J.C.; Imberger, J.; Wright, R.P.; Schladow, S.G. Modelling and Design of Reservoir Aeration Destratification System; Urban Water Research Association of Australia/Melbourne and Metropolitan Board of Works: Melbourne, Victoria, Australia, 1991. [Google Scholar]
- Li, M.; Liao, X.; Zhang, D.; Du, G.; Chen, J. Yeast extract promotes cell growth and induces production of polyvinyl alcohol-degrading enzymes. Enzyme Res. 2011, 2011, 179819. [Google Scholar] [CrossRef] [PubMed]
- Onken, U.; Liefke, E. Effect of total and partial pressure (oxygen and carbon dioxide) on aerobic microbial processes. In Bioprocesses and Engineering; Fiechter, A., Ed.; Springer: Berlin/Heidelberg, Germany, 1989; Volume 40, pp. 137–169. [Google Scholar]
- Hosseini, T.; Haque, N.; Selomulya, C.; Zhang, L. Mineral carbonation of Victorian brown coal fly ash using regenerative ammonium chloride—Process simulation and techno-economic analysis. Appl. Energy 2016, 175, 54–68. [Google Scholar] [CrossRef]
- OLEM; United States Environmental Protection Agency. Food Recovery Hierarchy. Available online: https://www.epa.gov/sustainable-management-food/food-recovery-hierarchy (accessed on 19 April 2021).
- Omolayo, Y.; Feingold, B.J.; Neff, R.A.; Romeiko, X.X. Life cycle assessment of food loss and waste in the food supply chain. Resour. Conserv. Recycl. 2021, 164, 105119. [Google Scholar] [CrossRef]
- Zhu, L. Biorefinery as a promising approach to promote microalgae industry: An innovative framework. Renew. Sustain. Energy Rev. 2015, 41, 1376–1384. [Google Scholar] [CrossRef]
- Vigani, M.; Parisi, C.; Rodríguez-Cerezo, E.; Barbosa, M.J.; Sijtsma, L.; Ploeg, M.; Enzing, C. Food and feed products from micro-algae: Market opportunities and challenges for the EU. Trends Food Sci. Technol. 2015, 42, 81–92. [Google Scholar] [CrossRef]
- Ratledge, C. Omega-3 biotechnology: Errors and omissions. Biotechnol. Adv. 2012, 30, 1746–1747. [Google Scholar] [CrossRef] [PubMed]
Publisher’s Note: MDPI stays neutral with regard to jurisdictional claims in published maps and institutional affiliations. |
© 2021 by the authors. Licensee MDPI, Basel, Switzerland. This article is an open access article distributed under the terms and conditions of the Creative Commons Attribution (CC BY) license (https://creativecommons.org/licenses/by/4.0/).