Abstract
The study of urban morphology contributes to the evolution of cities and sustainable development. Urban morphological feature extraction and similarity analysis represents a practical framework in many studies to interpret and introduce the current built environment to aid in proposing novel designs. In conventional methods, morphological features are represented based on qualitative descriptions, symbolical interpretation, or manually selected indicators. However, these methods could cause subjective bias and limit the generalizability. This study proposes a hybrid data-driven approach to support quantitative morphological descriptions and multi-dimensional similarity analysis for urban design decision-making and to further morphology-related studies using information abundance via a deep-learning approach. We constructed a dataset of 3817 residential plots with geometrical and related infrastructure information. A deep convolutional neural network, GoogLeNet, was implemented with the plots’ figure–ground images, by quantifying the morphological features into 2048-dimensional feature vectors. We conducted a similarity analysis of the plots by calculating the Euclidean distance between the high-dimensional feature vectors. Then, a comparison study was performed by retrieving cases based on the plot shape and plots with buildings separately. The proposed method considers the overall characteristics of the urban morphology and social infrastructure situations for similarity analysis. This method is flexible and effective. The proposed framework indicates the feasibility and potential of integrating task-oriented information to introduce custom and adequate references via deep learning methods, which could support decision making and association studies on morphology with urban consequences. This work could serve as a basis for further typo-morphology studies and other morphology-related ecological, social, and economic studies for sustainable built environments.
1. Introduction
Urban morphology refers to the multidisciplinary study of urban forms regarding the physical environment, the cultural preservation process, and sustainable development [1,2]. The morphological approach provides the idea that morphology has the potential to be an animating force for urban design [3]. Many studies relate urban typo-morphology to studies of the citizens’ lives, the social economy, and the energy system efficiency [4,5,6]. Therefore, urban morphology provides a valuable basis for urban planners and managers. Urban morphology is related to complex urban system analysis, such as energy performance [7], citizen behavior, and economic benefits [8].
On the other hand, in the urban renewal process, communications with the as-built urban fabric need to be considered in urban design. In a study of urban neighborhoods [9], evolutionary patterns related to sustainable urban neighborhoods were extracted based on the morphological classification and clustering of footprint patterns over time.
In addition to simulation-based urban morphological analysis [10], researchers focusd on data-driven approaches for urban morphological studies recently by considering the methods for constructing relations between the as-built and the to-be-built environment, such as multi-dimensional (e.g., the geometric dimension and social dimension) of urban forms. Technologies, such as 3D scanning, depth detection, multi-directional scanning, and simultaneous localization and mapping (SLAM) are becoming increasingly sophisticated. The abundance of web-based map data, such as AutoNavi, Baidu, and OpenStreet Map (OSM), allows architects to grasp data efficiently. In the information abundance, machine learning approaches support design by providing designers with previous cases for new design solutions based on the case-based reasoning (CBR) [11].
In data-driven urban design, learning from reality (in this case, urban morphology) helps decision makers in making comprehensive design decisions and researchers in the study of spatial form-related functionality and performance. On one hand, the suggestions for urban morphology design in the decision-making process take social, environmental, and economic factors into consideration. The suggestions serve as a reference as well as guidance for decision-makers.
Urban morphology is the physical carrier of quality of life. In the urban design process, the lack of a concrete understanding of urban morphology by non-professional decision-makers limits the space for discussion by designers [12]. Both developers and designers could develop discussions and ideas from the cases in similar situations, introducing the information and knowledge. On the other hand, the associations of urban morphology with functionality and further consequences supports researchers in morphology-related studies. The suggestions for urban cases could be based not only on the spatial form but also on the morphology-related traffic networks, energy performance, economic conditions, and so on, thus, supporting further scientific utility.
Effective morphological quantification methods for cases is crucial in terms of the data representation for a case retrieval system. However, cities are developed in complicated historical, economic, and behavioral contexts. Every city is unique in urban form [13]. There is not a clear-cut answer of the critical factors or the factor weights for city development or collapse simulation [14]; therefore, deduction and verification methods are challenging to apply in a comprehensive urban morphology study for urban design. For example, in the MApUCE tools chain study, a processing chain was proposed to calculate 64 standardized urban morphological indicators to represent the buildings, blocks, and spatial units [15].
More indicators could be extracted for more precise representation. However, each indicator’s weight influences the calculation since it should be appropriate for reaching the global fitting of the instances, and there were still missing factors by selecting and calculating indicators. Moreover, the critical indicators varied from the cases from different cultural and historical contexts, which need to be studied and verified. Quantifying the morphology of a large number of cases with indicators would lead to a generalizability limitation. Therefore, a descriptive framework for urban support analysis is essential, and its effectiveness could be shown in the subsequent data analysis and visualization of urban case retrieval.
In developing an efficient approach for urban morphological quantification methods for similarity analysis, three facets of obstacles are observed: (1) the construction of multi-dimensional urban dataset that includes geometrical and social information, (2) the quantification of urban morphological features with concise but informative descriptions, and (3) similarity calculations of the extracted morphological features. According to the above discussion, an automatic data mining method would support the detailed information collection of the related infrastructures from various aspects. A fully automated feature extraction method may help to overcome the drawbacks of manually selecting indicators and balancing weights. A feature extraction method considering the statistical and overall characteristics of the instances could be introduced.
Machine learning approaches help to efficiently represent and retrieve cases from a considerable amount of data [16]. Deep learning is one of the branches of machine learning. Deep learning algorithms promote evolutionary methodologies for morphological analysis. This approach is robust with pictorial datasets because of the development in convolutional neural networks [17]. The convolutional methods support a fully automated feature extraction process among a large amount of data. This represents the samples’ characteristics with concise and comprehensive information in feature vectors. Methods, such as image-data-based (RGB), numerical labeling, and semantic segmentation, are dedicated to feeding samples into neural networks with continuous and informative features. Cluster analysis supports comparison and similarity studies by data-deduction and distance calculating techniques, taking the feature extraction data as a basis.
We clarified our study scope on case retrieval to support design decision-making and serve as a basis for further scientific utility via deep learning, as, regarding the information abundance and complexity of cities, we need a solution space implying urban knowledge rather than certain answers. For example, the efficient similarity analysis of urban associations (e.g., the morphology, traffic, energy, and economy) represents the task-oriented retrieved cases for decision makers in certain applications and researchers for further scientific analysis, based on texts, images, models, and other representation media carrying concrete urban information.
Therefore, the construction of the spectrum of cases based on situation similarity is a promising way to efficiently introduce references from the information abundance for a wider discussion space for design decision making and precise association of morphology with urban consequences for scientific studies. The reference’s effectiveness depends on the case quantification methods and the related social information (e.g., infrastructure, industrial distribution, and traffic conditions) of the cases. The method would also have potential for a general search engine in terms of urban morphology. Therefore, an effective morphological quantification approach and multi-dimension datasets, including related geometric and social information, would be needed for comprehensive urban design decision-making.
In this study, we propose a multi-dimensional similarity analysis approach for introducing cases in similar situations from the information abundance. The similarity analysis includes morphological similarity and social situation similarity. The proposed method combines data mining and cluster analysis via deep learning, taking the residential cases in Nanjing, China, for instance. In this study, a multi-dimension dataset, including geometrical information and infrastructure information, is constructed. The samples’ morphological features are extracted into high-dimensional feature vectors (HDFV) via a deep convolutional neural network. This study further completes the case retrieval based on the HDFV. The architects can retrieve cases according to the plot-shape-similarity or building-distribution-similarity, along with the infrastructure information. The significance of the study is as follows:
- This study is an interdisciplinary study that integrates urban design with computer science and applies the latest deep learning techniques to the study of urban morphological case retrieval.
- The proposed approach provides a feasible method for quantifying the overall morphological characteristics automatically and informatively by pictorial-feature-mapping high-dimensional data, excluding the manual indicator selection process.
- Multiple cases ranking in similarity with the input and social information were achieved simultaneously, reducing the difficulty in deciding the weights of indicators.
- The proposed method is independent of the cases’ morphological types by learning from the samples directly. Therefore, it has the flexibility to do clustering and retrieval for various urban morphologies, as long as the cases are feeding into the deep learning model.
- The framework could be flexible for integrating more environment-related datasets for image-based similarity analysis, introducing custom references to support the designer’ decision-making towards sustainable development.
- This work could serve as a basis for further typo-morphology studies and integrate morphology-related ecological, social, and economic studies for the built environment.
2. Literature Review
In addition to a qualitative and conceptual description of urban morphology, recent studies have been performed for the quantitative representation of urban morphology, such as data discretization methods [18]. Researchers utilized various quantification methods for morphology-to-data transmission by selecting and adjusting indicators. Deep learning models were used to automatically learn features and classifiers at once by error backpropagation, adjusting the layers’ importance depending on the problem. Then, similarity analysis techniques were used to construct an efficient case retrieval system based on the feeding samples [19].
2.1. Urban Morphological Quantification
Multiple quantitative approaches have been implemented for transmitting morphology to data. Researchers have used pre-proposed indicators (e.g., semantic indicators and geometrical indicators) to index buildings and urban relationships for the following studies [20]. For example, in the early stage application of case-based reasoning for design, ARCHIE is an intelligent case browsing system. The cases are represented as attribute-value pairs with 150 features, including the concept, text, actual number, and function [21]. In the study of urban typologies [22], block and street types were studied as a context-sensitive sample of types by describing the cases with semantic and geometric values, such as land use, length, area, and ground space index (GSI). Nahyun developed a model adopting case-based reasoning and a genetic algorithm to predict the maintenance costs for aging residential buildings [8].
On the other hand, hierarchical structures along with symbolic representations have been constructed to describe urban forms containing plots, buildings, and streets [23,24]. Based on the established hierarchical structure, measurements (e.g., distance and connectivity) were calculated for further analysis. For example, in the study of spatial design network analysis (sDNA), Crispin developed a tool for network analysis, which was implemented for the representation and calculation of the network nodes and link density [25].
Song proposed an access structure to symbolically describe and measure the relations between the fundamental elements: plots, buildings, and streets. They took eight cases for similarity analysis to validate the access structure [26]. Although discrete indicators and structural measurements help in morphology quantification, there are still features that are hard to describe numerically—especially the geometric information, such as the volume distribution, directions, shapes, and connections. This leads to a generalizability limitation.
2.2. Similarity Analysis of Urban Morphology
A further step based on the extracted features is to use regression models to cluster the samples and analyze their similarities. Researchers have used multiple methods, such as classification, clustering, or ranking the solution-instances to manage the database [27]. In recent decades, researchers emphasized typo-morphology-related, context-sensitive, and systematic urban form studies, such as socio-ecological spatial morphology [28]. Mathematical methods can also be used for similarity analysis. In the study of case-based design with 3D mesh architectural models [29], a TRAMMA (Topology Recognition and Aggregation of Mesh Models of Architecture) method was proposed for the clustering, retrieving, and reconstructing architectural elements for a new architectural model.
For the urban renewal process, the Roma urban renewal [30] study built a similarity searching system based on the block shapes to search for cases similar to the new block shape and adapt the urban fabric to the new site to preserve the historical context. The Roman study investigated the case retrieval method for finding a case with similar block shapes to the block to be designed. They adjusted the pre-defined indicators related to the cases’ geometric characteristics for input, until they obtained satisfactory retrieved results. The referred retrieval indicators in the Roman study included the block area, building density, the block-to-bounding-box ratio, the length-to-width ratio, and the function type. Then, they generated the flyover above the railway station for their design proposal [31]. The case similarity was detected based on the evaluation of these indicators. Then, one case that met the input conditions was retrieved from the dataset.
Since the regeneration study based on the retrieved cases required efforts from other aspects related to specific design tasks, it is important to make the interface for connecting the case retrieval and regeneration periods. For example, Hua regenerated new 3D mesh models by combing the parts of the cases based on the extracted floor elements and the corresponding walls. The extracted elements are the interface connecting the retrieved cases and the regenerated models [29].
In the Roman study, the retrieved case was arbitrarily applied to a new block automatically by simple geometrical operations (e.g., scaling and rotation), and architects can adjust the applied results manually based on a visual model software [31]. Therefore, the regeneration period could be realized by multiple techniques as long as the case retrieval process is highly automated. Therefore, in this study, we focused on the morphological quantification method’s efficiency, the ability to bring more cases, and the flexibility for implementing new datasets for case retrieval.
2.3. Deep Learning for Morphological Analysis
Compared with conventional methods, the advantages of the deep learning method is that it is an end-to-end (e.g., image to segmentation label) process, with the potential of connecting task-oriented things [32]. Today, convolutional neural networks (CNNs) are one of the most prominent deep learning approaches for image processing and computer vision. In a convolution neural network (CNN), the feature mapping of the images extracts the input’s underlying features by convolution kernels, promoting deep learning algorithms in recent decades [33]. Features of the input are continuously convolving into multi-dimensional vectors layer by layer. Neural networks have been implemented for solving problems in the field of architecture, such as the prediction of energy performance [34], pattern recognition of 2D images [35], as well as typological form-finding on 3D models [36].
New data analysis techniques have been proposed for the design process to address the abundance of variables. Neural network techniques, such as classification, prediction, and cluster analysis, provide technical support for regression models for data analysis. Cluster analysis is a powerful technique for urban morphological analysis, which extends the technical support of high efficiency and accuracy for classification and clustering analysis from a large amount of data.
In a study of typo-morphology in Lisbon [37], the block and street types were classified based on the prepared plans using the k-means clustering algorithm. The ETH team’s “City of indexes” project interpreted urban morphological patterns based on the massive data of city images combined with personal preferences [38].
Concise but informative feature vectors extracted via deep learning were used to quantitatively characterize morphological features [39]. With the introduction of deep learning, architects need to focus on formulating inputs related to architectural problems, understanding the meaning of each layer’s output, and finding the application sceneries. Since cluster analysis is an unsupervised technique, it excludes labeling data, which is time-consuming. It automatically features the images with high-dimensional data to support further analysis.
3. Materials and Methods
Figure 1 shows the general workflow of our study. First, we collected web map data, including geometrical information and Point of Interests (POI) in Nanjing, which were downloaded with the open source AutoNavi API. We filtered the collected data into a geometrical dataset and additional social information (distribution of related infrastructure) based on functionality with the ArcGIS software. We exported images for the case slices in terms of plots.
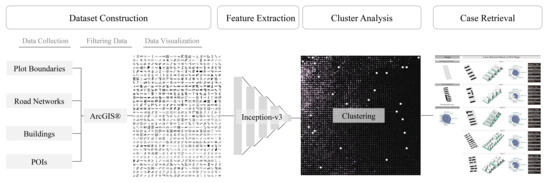
Figure 1.
The general workflow of quantitative urban morphological analysis for case-based design via deep learning.
Second, the morphological features were automatically extracted through a deep convolutional neural network with inception-v3 modules into high dimensional feature vectors (HDFV). Third, the cluster analysis was visualized based on the t-SNE algorithm in a two-dimensional plane. The Euclidean distance was applied to calculate the similarity between the cases. Finally, the performance of the HDFV on the similarity analysis was verified by a comparison case retrieval study.
3.1. Dataset Construction
We chose Nanjing for our case study. The study scope focused on applying deep learning methods to the quantitative study of the urban fabric. The plot morphology is highly related to the land use of the plot. In Chinese cities, the land use of the plots is determined according to “GB 50137-2011 Code for Classification of Urban Land Use and Planning Standards of Development Land” [40], which is an important standard in city and town planning in China. According to the land sale data in Nanjing, the sold R2 residential plots were 58.9% in 2017, 42.5% in 2018, and 54.5% in 2019 of all sold land.
This indicates that residential plots occupy a large proportion of the urban plots, which helps to ensure a sufficient sample size. In addition, the residential plots showed no significant difference, which can ensure the similarity distribution of the datasets; therefore, the performance of the quantification method can be tested by making distinctions from similar morphologies. Therefore, by taking residential plots as the case study, a high-quality dataset can be obtained. We chose urban plots rather than blocks as research objects because the plot connects the buildings and the city. The buildings in one plot are usually planned as a whole. The plots with the same functions have similar design indicators, which implies the significance of morphological identification.
The AutoNavi open platform provides a web mapping service API in China, where we downloaded geometric information, navigation, and infrastructure information of a particular area. As the downloaded data includes all the information visualized on the web map, we need to filter out the specific data for our study direction according to the locations or the labels. For example, the Area of Interest (AOI) data includes various function types of areas, including residence areas, water areas, tourism areas, commercial areas, and education areas.
The building boundaries and road networks we downloaded from the platform involve all buildings and roads in Nanjing city. In addition to map-related geometry data, infrastructure information can be revealed by Point of Interests (POIs). The POI contains information, such as the ID, name, category, address, etc., and a series of related information (e.g., streetscape and user comments) can be obtained by keyword search. Based on the POIs from Nanjing city, we filtered out the residential-related POIs.
After downloading the data as shapefiles, we filtered out the plot boundaries according to the “residence” label of AOIs. Then, we filtered out the buildings and roads according to the locations compared to the filtered areas. These operations were based on ArcGIS. This study selected the infrastructure categories closely related to residential areas: restaurants, shopping, physical facilities, public services, medical facilities, education services, and public traffic. Figure 2 shows the distribution of the different types of POIs, taking one of the districts of Nanjing: Qinhuai District as an instance. The POIs information was visualized based on the tableau software.
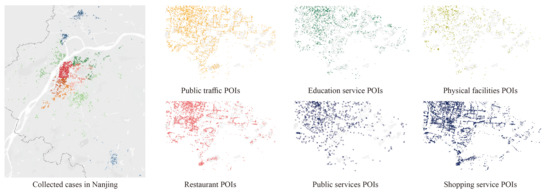
Figure 2.
The distribution of the related infrastructure information around the residential cases (in Qinhuai District).
Finally, 4172 residential plots were filtered out from Nanjing. Some residential areas were still under construction or had no building information. Therefore, the dataset contained 3817 residential areas with valid data. For each residential case, there was infrastructure information, exported plot images, and geometric models, as well as semantic information attached as attribute values, including the name, address, map-ID, location, and site area.
Figure 3 shows the information included in the dataset after we processed the shapefiles and POIs downloaded from the AutoNavi platform. All the plots were exported to images as training data for the deep convolutional network model. The amount of infrastructure covered per residential area was calculated based on the service radius of the POI points and visualized by radar charts. We wrote the codes for drawing radar charts with JAVA language.
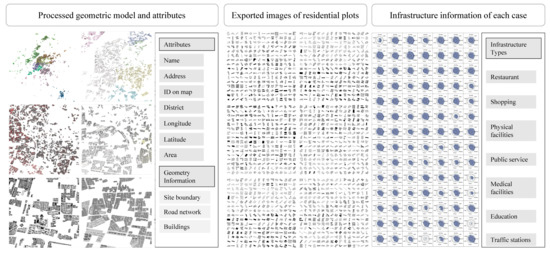
Figure 3.
Part of the collected Nanjing residential cases with the attribute information shown on the ArcGIS platform.
3.2. Feature Extraction
The convolutional layers extract the overall features by sweeping the image pixels in a certain step sequence through the convolutional kernel, which is the feature mapping process (Figure 4). Each kernel is an n*n matrix containing weight values. The high dimensional feature vector output after multi-layer convolutional operations could represent the overall features of the input image because spatially adjacent pixels in an image have considerable correlations [41].
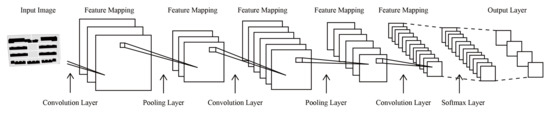
Figure 4.
Schematic of a convolutional kernel sweeping over an image for feature mapping.
To quantify the urban morphological features, we used the deep convolutional neural network GoogLeNet, which includes the Inception-v3 module. This architecture of the Inception-v3 module contributes to the high performance of the deep convolutional neural networks on image classification because it is susceptible to the context of input images [42]. A pre-trained GoogLeNet could be implemented for various feature extraction tasks. The weights of the kernels were optimized by training the model with the ImageNet dataset [43]. In this way, the deep convolutional neural networks map the image features into high dimensional feature vectors by feature mapping. Figure 5 briefly illustrates the structure of the GoogLeNet.
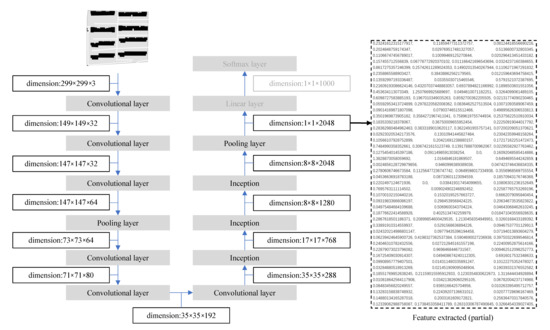
Figure 5.
The structure of the GoogLeNet and the 2048-dimensional feature vector output of the bottleneck layer is taken out as high dimensional feature vectors (HDFV).
The process of passing an image through a trained convolutional neural network up to the bottleneck layer can be viewed as a feature extraction process for the image [44]. Typically, the final layer’s output in a convolutional neural network is a number between 0 and 1 to represent the prediction of the categories. Before the linear layer is the so-called bottleneck layer, the output size of which is 1 × 1 × 2048. The bottleneck layer’s output can be considered a more concise and representative feature vector of the image. This layer can represent the features learned by the neural network. Therefore, we take the penultimate layer’s output, where the dimension of the input image increases to 1 × 1 × 2048. The output data were collected as HDFV for further comparison. We carried out a comparative study regarding the case retrieval performance on the plot shape and building distribution, focusing on the plot shape and plots with distributed buildings as independent inputs.
3.3. Cluster Analysis and Visualization
Using image data of the residence plots as the input for clustering is often impractical due to the gigantic size of the data matrix converted from the images. Therefore, a process of dimension reduction is often required. Currently, there are three mainstream techniques for data reduction: Principal Component Analysis, the t-SNE algorithm, and an Auto-Encoder. In this experiment, we used the t-SNE algorithm to map high-dimensional feature points to a two-dimensional plane without losing the information of the feature vectors. The samples with similar features were placed as neighbors in the cluster cloud (Figure 6). Figure 6 shows the spectrum of all the cases based on morphological similarity. The left picture represents the clustering results in terms of the cases’ plot shapes, while the right picture shows the cases’ plots with buildings. The more similar the cases are, the closer they are on the clustering map.
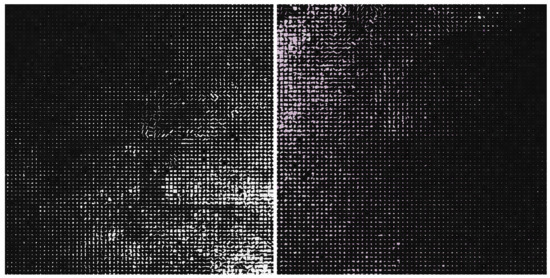
Figure 6.
Atlas of the clustering analysis of 3817 residential plots in Nanjing, China.
To show the clustering map more clearly, we zoomed in to some parts and present them in Figure 7. The samples are shown on the same scale. Clusters of squaring, narrow, or irregular shapes can be intuitively seen in Figure 7a. The result is different in Figure 7b, where the distribution of buildings influences the clustering result. Different residential types could be observed, such as plots with few rows of buildings, closely spaced residential buildings, and loosely arranged villas, etc. We can intuitively see that the plots belonging to the same cluster have morphological features in common. The cluster analysis performed better in near-square plot shapes rather than irregular plot shapes, as more cases had square plots.
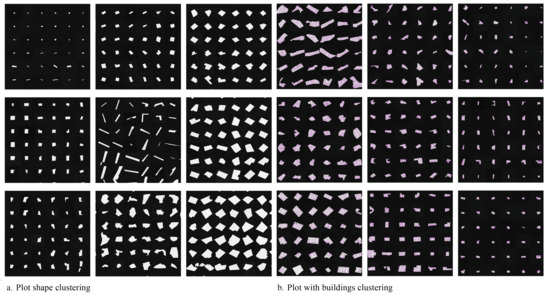
Figure 7.
The visualization of the clustering based on plot shape and plots with buildings.
3.4. Similarity Analysis and Case Retrieval
The data of HDFV have the same contribution weights for the similarity analysis, as they reflect the overall morphological characteristics of each sample rather than the independent indicators. Therefore, the Euclidean distance was used to calculate the difference between the input images. The closer the distance was, the more similar the two cases were. The case retrieval system can rank one or more cases for the target based on the distance. We constructed a case retrieval system that realized case pairs according to the plot shape or plots with buildings. When integrated with other sample attributes, architects can choose the proper ones among the recommended cases according to the specific task.
4. Results and Discussion
After the feature extraction by the deep CNN, each image was assigned with HDFV and its corresponding attributes (semantic information and infrastructure information). Four cases were selected to explain the HDFV performance in representing the morphological similarity of the images. The urban fabric images and the distances between each HDFV are listed in Figure 8. We conclude that plots b and c, and a and d are pairs of similar morphological types according to the HDFV distances. Plots a and d are distributed with intensively lined-up buildings. These are aged residential areas built in the 20th century. Plots b and c were built in recent decades, also with lined-up buildings but with more sparse textures.
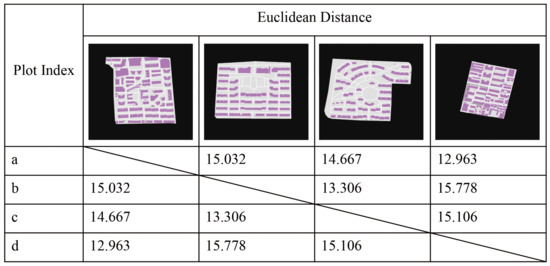
Figure 8.
The Euclidean distance between the samples.
4.1. Clustering Based on Euclidean Distance
To compare the HDFV performance featuring the figure–ground images, we selected five clusters with different characteristics and picked six samples from each. Figure 9 shows the nearest five cases to the targets according to the plot shape clustering and plot with building clustering. The five clusters show different characters. For example, cluster 1 has a square plot with lined buildings, while the buildings in cluster 3 are distributed intensively. The samples in cluster 2 are a relatively small plot with one or two buildings. The samples in cluster 4 and cluster 5 have linear plots and irregular plots. This result indicates that samples of different morphology types could be clustered automatically according to HDFV without the need to pre-define the morphology types.
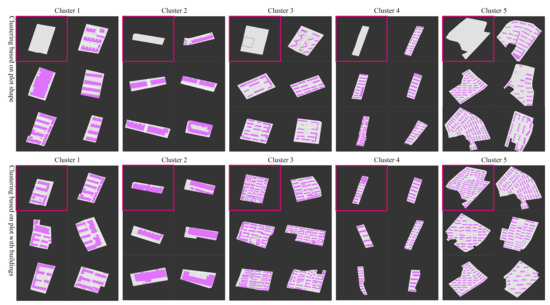
Figure 9.
The plot shape most similar five cases and plot with buildings most similar five cases retrieved based Euclidean distance between HDFVs.
The samples in a cluster reflect the similarity in plot shape when clustering based on plot shape and in building distribution texture when clustering based on the plot with buildings. For example, in cluster 3, the target is an aged residential area in Nanjing. According to an architect’s intuitive observation, cases retrieved based on the plot with buildings were similar to the target, with intensive building texture as the target, while some plot shapes included corners. On the contrary, for example, in cluster 2, cases retrieved based on the site shape varied in the building distribution but were similar in shape. We found potential indicating that the HDFV is sensitive to the urban fabric.
In the deep learning model, the HDFV was calculated by flattening the grayscale value matrix of the image, reflecting the distribution of n × n pixel matrix values over a 1 × n × n matrix. The HDFV reflects the morphology characteristic based on the distribution of pixels in an image. Moreover, the HDFV compressed the pixel distribution by increasing the impacts of effective pixels and decreasing the influence of ineffective pixels.
The clusters represent the similarity in the plot shape or the building texture. Different morphological characteristics, such as narrow plots with intensively distributed buildings and irregular plot shapes with multiple buildings, can be observed in terms of the clusters, consistent with an architect’s intuitive observation. Therefore, the HDFV is sensitive to the urban morphology indicated by the pixel distribution by carrying the overall and informative features of the samples.
4.2. Examples of Case Retrieval
We took the case retrieval test as an example (Figure 10). The target plot was close to a rectangle, with intensively lined up buildings as well as vertical buildings. The distributions of the relevant infrastructures are shown with the radar chart. The case retrieval process was completed in seconds.
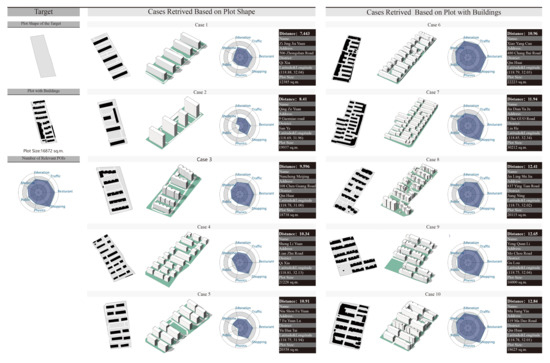
Figure 10.
Comparison study of the case retrieval process by recommending cases based on plot shape and plots with buildings.
The building distribution influenced the results when the cases were retrieved based on plots with buildings. They were more similar in building texture than in plot shape with the target. For example, case 6 in target one was retrieved based on the plot with buildings. It had lined-up buildings and vertical ones, and the buildings were distributed intensively. The building distribution texture was similar to the target, which is like the aged Nanjing residential plots. Case 1 was retrieved based on the plot shape; therefore, it showed more similarity in the plot shape, while the building distribution texture was different from the target.
The results demonstrate the effectiveness of the case retrieval with similar morphologies based on the morphological quantification method. With the multi-dimensional dataset, the related information of the case (e.g., name and address) and the distribution of the related infrastructure could help decision makers and researchers obtain new information through similar cases to support decision making and further studies.
4.3. Discussions on the Method
The advantages of the proposed method regarding similarity analysis can be discussed by comparing the study using conventional methods, including the Roma urban renewal project mentioned in Section 2.2.
First, the HDFV had higher efficiency on the urban fabric quantification and similarity analysis. In the study of Roman, the authors extracted several geometric indicators to evaluate the block shape similarity. This took time for the extraction and verification process of selecting the indicators and balancing each weight. The HDFV carries comprehensive morphology characteristics by matrix operation of the sample pixels based on the deep learning model. It saves effort in addressing a large number of images since the whole process from feature extraction to case retrieval is performed automatically.
Secondly, the HDFV has more generalizability in applying the method to various urban morphologies. The Roman study had a limitation when evaluating the building distribution texture similarity. It required another extraction and verification process of selecting indicators to describe the building distribution characteristics, which is a more complicated and diverse process compared with describing the block shape. With the HDFV, we could perform the similarity investigation of plot shape or building distribution under the same framework. The proposed method goes beyond the morphology types from different historical contexts because it learns from the samples directly and clusters them based on the feature vector distance.
Thirdly, the proposed method has more flexibility regarding similarity-based case retrieval. In the study of Roman, the system recommended another case that was similar to the input. However, we could find a series of cases that are similar to the input from sufficient samples. The result space would be broader if there were more samples in the dataset. In this way, more references and information could be brought to designers.
What is more, the proposed method could broaden the similarity analysis because it takes related social information (e.g., the infrastructure) into consideration by integrating a multi-dimensional dataset. In addition to the morphology and the POI information studied in this experiment, the framework could be implemented for quantification and similarity analysis with more information related to the urban sustainability. For instance, the cultural background, the energy performance, the traffic conditions, etc. could be added to the dataset, depending on the design task. The image-based similarity analysis can be done via the deep learning model. This would provide precise references in similar situations to better support the designers’ decision-making towards sustainable cities.
The limitations of this study involve that the highly automated process increases the difficulty of emphasizing the specialties from a particular aspect. There are three main limitations. First, the insufficient number of samples with similar plot sizes leads to some noise in the case retrieval results. The results would be more robust if there were around 1000 cases with similar plot sizes. This limitation could be overcome by simply adding more cases collected from cities around Nanjing based on AutoNavi.
Second, all 3D information (e.g., building height and building shape) is lost since the samples are represented as 2D images for learning. This drawback could be overcome by adding one more color channel to represent the building height or by using voxels instead of pixels to describe the plot in three dimensions. Third, the target needs to be trained together with the cases in the dataset. In other words, once a new target is introduced, the entire neural network has to be retrained.
5. Conclusions
This morphological similarity analysis represents a helpful analysis framework for many fields, such as typo-morphological, historical evolution, pre-design contextualization, and building energy performance. Finding cases in similar situations to the target could support designers in obtaining new information and knowledge resulting in better decision making and furthering scientific studies. Quantitative descriptions of urban morphology provide a baseline for in-depth urban fabric interpretation. This study aimed to develop a data-driven approach to quantitatively describe urban morphology and to develop a multi-dimensional case retrieval method for urban design decision-making in the early stage for association studies on morphology with specific social or economic aspects.
In this study, 3817 residential cases with geometrical and social service information from Nanjing, China, were filtered to construct the dataset. The data source was exported as figure–ground images for training the deep CNN GoogLeNet with the inception-v3 module, encoding the images into 2048-dimensional feature vectors based on grayscale values. The similarity analysis of the cases was verified by calculating the Euclidean distance between HDFV. A comparison study was conducted in the case retrieval process to integrate the morphological and infrastructural similarity.
This study demonstrated the feasibility and power of the deep learning network in urban morphological similarity analysis and multi-dimensional decision making. The deep learning algorithms provided a method to automatically extract/learn the intrinsic features from a large amount of data. The morphological features were represented by HDFV, which contained comprehensive information for the morphological characteristics.
The multi-dimensional case retrieval method can support comprehensive decision-making and morphology-related scientific studies by providing customers with many references in similar situations with the target based on the comprehensive and precise similarity analysis. This method is integrated with easy access to related infrastructure and social and economic information. Other information that is related to the specific task (e.g., culture, traffic, energy performance, and economic consequences) could be easily implemented under the same framework to support decision-making and further scientific studies regarding associations of morphology and other urban aspects.
Future work will focus on technological improvements and more application scenarios. Adding more dimensions to the data source, such as additional color values to indicate building heights, would be an effective improvement of the model performance. Approaches to using geometric spatial data as direct inputs to the neural network rather than figure–ground images will be explored for better computational efficiency and more precise case retrieval. More typo-morphology-related attributes could be added to the data sources according to specific scenes.
For example, energy performance, user testimonials, traffic conditions, industrial distributions, the natural environment, and so on could be introduced for more comprehensive similarity analysis to better support design decision making. In addition, the HDFV could serve as the interface for connecting retrieved cases and regeneration. For example, new design proposals could be generated derived from retrieved cases by implementing energy evaluation and optimization or rule-based generative design.
Author Contributions
Conceptualization, C.C.; Methodology, C.C., Z.G. and B.Z.; Software, C.C. and Z.G.; Validation, C.C. and Z.G.; Formal Analysis, C.C.; Resources, X.W.; Data Curation, X.W.; Writing—Original Draft Preparation, C.C.; Writing—Review and Editing, C.C., Z.G., P.T. and B.L.; Visualization, B.Z.; Supervision, B.L. and P.T.; Funding Acquisition, B.L., C.C. and Z.G. All authors have read and agreed to the published version of the manuscript.
Funding
This study was funded by the National Natural Science Foundation of China (NSFC) project (No. 51978139). This study was funded by China Scholarship Council (CSC) grant 201706090254 and 202006090151.
Conflicts of Interest
The authors declare no conflict of interest.
Abbreviations
The following abbreviations are used in this manuscript:
| HDFV | High Dimensional Feature Vector |
| CBR | Case-based Reasoning |
| CNN | Convolutional Neural Network |
| POI | Point of Interest |
| AOI | Area of Interest |
References
- Kropf, K. Aspects of urban form. Urban Morphol. 2009, 13, 105. [Google Scholar]
- Hemphill, L.; Berry, J.; McGreal, S. An indicator-based approach to measuring sustainable urban regeneration performance: Part 1, conceptual foundations and methodological framework. Urban Stud. 2004, 41, 725–755. [Google Scholar] [CrossRef]
- Rossi, A.; Eisenman, P.; Ghirardo, D.Y.; Ockman, J. The Architecture of the City; MIT Press: Cambridge, MA, USA, 1982. [Google Scholar]
- Chen, F. Urban Morphology and Citizens’ Life. In Encyclopedia of Quality of Life and Well-Being Research; Springer: Dordrecht, The Netherlands, 2014; pp. 6850–6855. [Google Scholar]
- Osman, T.; Divigalpitiya, P.; Osman, M.M.; Kenawy, E.; Salem, M.; Hamdy, O. Quantifying the relationship between the built environment attributes and urban sustainability potentials for housing areas. Buildings 2016, 6, 39. [Google Scholar] [CrossRef]
- Sarralde, J.J.; Quinn, D.J.; Wiesmann, D.; Steemers, K. Solar energy and urban morphology: Scenarios for increasing the renewable energy potential of neighbourhoods in London. Renew. Energy 2015, 73, 10–17. [Google Scholar] [CrossRef]
- Emmanuel, M.R. An Urban Approach to Climate-Sensitive Design: Strategies for the Tropics; Taylor & Francis: London, UK, 2005. [Google Scholar]
- Kwon, N.; Song, K.; Ahn, Y.; Park, M.; Jang, Y. Maintenance cost prediction for aging residential buildings based on case-based reasoning and genetic algorithm. J. Build. Eng. 2020, 28, 101006. [Google Scholar] [CrossRef]
- Ariga, T. Morphology, Sustainable Evolution of Inner-urban Neighborhoods in San Francisco. J. Asian Archit. Build. Eng. 2005, 4, 143–150. [Google Scholar] [CrossRef]
- Hua, H.; Li, B.; Yu, M.; Hao, Z.; Tang, H. Fourth-grade Workshops on Computational Design. In Proceedings of the 11th National Conference on Digital Technologies in Architectural Education; China Architecture & Building Press: Beijing, China, 2016. [Google Scholar]
- Watson, I.; Perera, S. Case-based design: A review and analysis of building design applications. AI EDAM 1997, 11, 59–87. [Google Scholar] [CrossRef]
- Han, D. The Main Practice Forms of Urban Design in China at the Present Stage and Chanllenges it Faced. Jiangsu Constr. 2018, 8–10. [Google Scholar]
- Zhang, L.; Ding, W. Changing urban form in a planned economy: The case of Nanjing. Urban Morphol. 2018, 22, 15–34. [Google Scholar]
- Bettencourt, L.M.; Lobo, J.; West, G.B. Why are large cities faster? Universal scaling and self-similarity in urban organization and dynamics. Eur. Phys. J. 2008, 63, 285–293. [Google Scholar] [CrossRef]
- Bocher, E.; Petit, G.; Bernard, J.; Palominos, S. A geoprocessing framework to compute urban indicators: The MApUCE tools chain. Urban Clim. 2018, 24, 153–174. [Google Scholar] [CrossRef]
- Hovestadt, L. Beyond the Grid: Architecture and Information Technology: Applications of a Digital Architectonic; Birkhauser: Basel, Switzerland, 2010. [Google Scholar]
- Lauzon, F.Q. An introduction to deep learning. In Proceedings of the 2012 11th International Conference on Information Science, Signal Processing and their Applications (ISSPA), Montreal, QC, Canada, 2–5 July 2012; pp. 1438–1439. [Google Scholar]
- Witten, I.H.; Frank, E. Data mining: Practical machine learning tools and techniques with Java implementations. ACM Sigmod Record 2002, 31, 76–77. [Google Scholar] [CrossRef]
- Sönmez, N.O. A review of the use of examples for automating architectural design tasks. Comput.-Aided Des. 2018, 96, 13–30. [Google Scholar] [CrossRef]
- Chen, H.C.; Han, Q.; de Vries, B. Urban morphology indicator analyzes for urban energy modeling. Sustain. Cities Soc. 2020, 52, 101863. [Google Scholar] [CrossRef]
- Goel, A.; Kolodner, J.; Pearce, M.; Billington, R.; Zimring, C. ARCHIE: A Case-Based Architectural Design System; Research Report; College of Computing, Georgia Institute of Technology Atlanta: Atlanta, GA, USA, 1991. [Google Scholar]
- Chen, F. Interpreting urban micromorphology in China: Case studies from Suzhou. Urban Morphol. 2012, 16, 133. [Google Scholar]
- Hillier, B.; Hanson, J. The Social Logic of Space; Cambridge University Press: Cambridge, MA, USA, 1989. [Google Scholar]
- Gil, J. Analyzing the configuration of multimodal urban networks. Geogr. Anal. 2014, 46, 368–391. [Google Scholar] [CrossRef]
- Cooper, C.; Chiaradia, A.J. sDNA: How and why we reinvented Spatial Network Analysis for health, economics and active modes of transport. In Proceedings of the GIS Research UK (GISRUK) 2015, Leeds, UK, 15–17 April 2015; pp. 122–127. [Google Scholar]
- Song, Y.; Zhang, Y.; Han, D. Access structure. Environ. Plan. Urban Anal. City Sci. 2021. [Google Scholar] [CrossRef]
- Liu, Y.; Stouffs, R.; Tablada, A. Rethinking the Urban Design Process from a Data Perspective. In Proceedings of the 35th International Conference on Education and Research in Computer Aided Architectural Design in Europe, Rome, Italy, 20–22 September 2017; Volume 1, pp. 449–460. [Google Scholar]
- Marcus, L.; Pont, M.B.; Barthel, S. Towards a socio-ecological spatial morphology: Integrating elements of urban morphology and landscape ecology. Urban Morphol. 2019, 23, 115–124. [Google Scholar]
- Hua, H. A case-based design with 3D mesh models of architecture. Comput.-Aided Des. 2014, 57, 54–60. [Google Scholar] [CrossRef]
- Tang, P.; Li, H.; Wang, X. Generative Design on Conservation and Inheritance of Traditional Architecture and Settlement Based on Machine Learning: A Case Study on the Urban Renewal Design of Roma Termini Railway Station. Architect 2019, 1, 100–105. [Google Scholar]
- Xu, J.; Li, B. Application of Case-Based Methods and Information Technology in Urban Design-The Renewal Design of the urban region around Roma Railway Station. In Proceedings of the 24th CAADRIA Conference, Wellington, New Zealand, 15–18 April 2019; pp. 625–634. [Google Scholar]
- Nogueira, K.; Penatti, O.A.; Dos Santos, J.A. Towards better exploiting convolutional neural networks for remote sensing scene classification. Pattern Recognit. 2017, 61, 539–556. [Google Scholar] [CrossRef]
- Krizhevsky, A.; Sutskever, I.; Hinton, G.E. Imagenet classification with deep convolutional neural networks. Commun. ACM 2017, 60, 84–90. [Google Scholar] [CrossRef]
- Mohammadiziazi, R.; Bilec, M.M. Application of machine learning for predicting building energy use at different temporal and spatial resolution under climate change in USA. Buildings 2020, 10, 139. [Google Scholar] [CrossRef]
- Ochoa, K.S.; Guo, Z. A framework for the management of agricultural resources with automated aerial imagery detection. Comput. Electron. Agric. 2019, 162, 53–69. [Google Scholar] [CrossRef]
- De Miguel, J.; Villafane, M.E.; Piskorec, L.; Sancho-Caparrini, F. Deep form finding-Using variational autoencoders for deep form finding of structural typologies. In Proceedings of the 37th Conference on Education and Research in Computer Aided Architectural Design in Europe (eCAADe) & 23rd Conference of the Iberoamerican Society Digital Graphics (SIGraDi), Porto, Portugal, 11–13 September 2019. [Google Scholar]
- Gil, J.; Beirão, J.N.; Montenegro, N.; Duarte, J.P. On the discovery of urban typologies: Data mining the many dimensions of urban form. Urban Morphol. 2012, 16, 27. [Google Scholar]
- Alvarez-Marin, D.; Ochoa, K.S. Indexical Cities: Articulating Personal Models of Urban Preference with Geotagged Data. arXiv 2020, arXiv:2001.10615. [Google Scholar]
- Dong, J.; Li, L.; Han, D. New Quantitative Approach for the Morphological Similarity Analysis of Urban Fabrics Based on a Convolutional Autoencoder. IEEE Access 2019, 7, 162–174. [Google Scholar] [CrossRef]
- Wang, K.; Zhang, J.; Xu, Z.; Xu, Y. Coordinative And Transition-oriented Technical Regulations For Land-use Planning: An Analysis On The Code For Classification of Urban Land Use And Planning Standards of Development Land. City Plan. Rev. 2012, 4, 42–48. [Google Scholar]
- Goodfellow, I.; Bengio, Y.; Courville, A.; Bengio, Y. Deep Learning; MIT Press Cambridge: Cambridge, MA, USA, 2016; Volume 1. [Google Scholar]
- Szegedy, C.; Vanhoucke, V.; Ioffe, S.; Shlens, J.; Wojna, Z. Rethinking the inception architecture for computer vision. In Proceedings of the IEEE Conference on Computer Vision and Pattern Recognition, Las Vegas, NV, USA, 27–30 June 2016; pp. 2818–2826. [Google Scholar]
- Szegedy, C.; Liu, W.; Jia, Y.; Sermanet, P.; Reed, S.; Anguelov, D.; Erhan, D.; Vanhoucke, V.; Rabinovich, A. Going deeper with convolutions. In Proceedings of the IEEE Conference on Computer Vision and Pattern Recognition, Boston, MA, USA, 7–12 June 2015; pp. 1–9. [Google Scholar]
- Tsang, S.H. Review: Inception-v3—1st Runner Up (Image Classification) in ILSVRC 2015. Available online: https://bit.ly/2MKWI5k (accessed on 10 September 2018).


Publisher’s Note: MDPI stays neutral with regard to jurisdictional claims in published maps and institutional affiliations. |
© 2021 by the authors. Licensee MDPI, Basel, Switzerland. This article is an open access article distributed under the terms and conditions of the Creative Commons Attribution (CC BY) license (https://creativecommons.org/licenses/by/4.0/).