Article

How Can SMEs Become More Sustainable? Modelling the M-Commerce Consumer Behaviour with Contingent Free Shipping and Customer Journey’s Touchpoints Optimisation

by
Eliza Nichifor
,
Radu Constantin Lixăndroiu
,
Silvia Sumedrea
*,
Ioana Bianca Chițu
and
Gabriel Brătucu
Faculty of Economic Sciences and Business Administration, Transilvania University of Braşov, Colina Universității Street, No. 1, Building A, 500068 Braşov, Romania
*
Author to whom correspondence should be addressed.
Sustainability 2021, 13(12), 6845; https://doi.org/10.3390/su13126845
Submission received: 7 May 2021 / Revised: 28 May 2021 / Accepted: 8 June 2021 / Published: 17 June 2021
(This article belongs to the Special Issue Digital Economy, E-commerce, and Sustainability)

Abstract

:
Digital technology is leading the transformation of business models into sustainable ones, expanding and changing the competitiveness scenario. This paper aims to promote a new sustainable retailer model shaped by contingent free shipping theory and the optimisation of the customer’s journey, enriching the scientific literature by proposing a consumer behavioural model that highlights the contribution of four selected touchpoints to the sustainable transformation of SMEs. The research was elaborated by deploying a framework that presents five analysis methods, namely, an additive function construction, a TOPSIS method, a Spearman rank correlation coefficient calculation, a content analysis and an analytic hierarchy process, which engender the new model. Discovering nine distinguished categories of e-tailers, the sustainable retailer profile was developed and the touchpoint with the greatest contribution to the transformation process was identified. The results of the study allowed the authors to propose the model as a solution to withstand the preponderant negative experience provided by analysed e-tailers to digital buyers, representing the opportunity for SMEs’ sustainable transformation and long-term growth in a competitive, ever-growing market.

1. Introduction

The expansion of the Internet has changed business models and retail practices [1], leading to an appreciable consumer behaviour metamorphosis [2,3]. The COVID-19 pandemic has further driven consumers to proceed toward online shopping [4,5], which has caused remarkable growth in e-commerce [6,7,8]. Businesses in the field of m-commerce are part of the larger e-commerce domain, which in turn is seen as a natural development of business in the field of wholesale and retail trade [9,10,11].
Digital technology is leading to the transformation of business models into sustainable ones by providing “a blended value proposition, integrative value creation, and multidimensional value capture” [12]. Regarding digital transformation, there are big differences between large enterprises and small and medium enterprises (SMEs); in terms of starting conditions, large enterprises have “higher driven forces” and smaller barriers then SMEs [13]. For SMEs, the constraints as well as the challenges are related to costs and knowledge [14].
Retailers are now adding new distribution channels to be competitive in the market and creating a sustainable shopping environment for buyers [15]. The new distribution channels provide consumers with a more varied assortment of goods to choose from, increase their comfort in shopping and reduce the perceived risk [15].
Nowadays, traditional business models are no longer competitive in the long term and need to innovate [16]; therefore, the retailers who will survive in the market are those who will provide real value for their consumer through an innovative business model created on a sustainable basis [17]. A retailer must build its business environment and create, supply and capture value based on the three dimensions of sustainability: environmental, economic and social [1,18,19]. The priority for SMEs to develop in this sense is supported by both the Sustainable Development Goals (SDGs) [20] and the necessary activity in a single digital market [21]. Romania is one of the European Union states that embrace the SDGs, finding sustainable and inclusive development solutions. Particularly, SDG 8, which promotes sustained, inclusive and sustainable economic growth and full and productive employment and decent work for all [22], can be achieved if SMEs can compete in a single digital market. With some examples [23], the great potential that this country presents can lead companies to new heights, becoming more sustainable in terms of competitiveness. By introducing the case of UiPath unicorn, the first Romanian listed company on the New York Stock Exchange [24], it is easier to understand the sustainable potential of SMEs from this country, which was the reason for selecting it for this study.
On the other hand, from a consumer perspective, sustainability involves a lifestyle based on meeting needs without harming future generations [25]. Since e-commerce is dominated by megalithic companies, durability over time and the national and international circumstances represent challenges for SMEs, threatening the sustainable retailer status quo. Therefore, we studied one of the two perspectives mentioned in the definition of sustainability: the capacity to maintain their activity at a certain pace or level [26].
The authors of [27] showed that online shopping can increase life satisfaction and commitment to sustainable consumer practices, especially in periods such as the one we are currently going through marked by the COVID-19 pandemic [4]. The benefits of online shopping favour sustainable consumer behaviour [4] and motivated the authors to study the sustainable retailer issue.
The study aimed to find a solution for SME e-tailers (companies that use the Internet to sell products [28,29]) to become sustainable with the contingent free shipping method and optimisation of customers’ journey touchpoints. A new consumer behaviour model is proposed considering the mobile experience optimisation level and free shipping policy visibility during content loading on smartphones.
The impact of the first touchpoint on customer journey and its contribution to sustainable retailer transformation is demonstrated in this paper. The non-optimised touchpoints are related to e-tailers that will not adapt to the digital environment requested by consumers, will not grow over time, and thus will not be at an advantage regarding the competitiveness perspective of sustainability. Prioritising this perspective of sustainability, the other—regarding the depletion of natural resources to maintain ecological balance—will be addressed in future research proposals.
The structure of this paper includes six sections. A literature review follows the introduction. It presents the key mobile commerce (m-commerce) business features, the free shipping threshold and the evolving landscape in Romania. After presenting the methodology of the research, the results are presented. The valuable scientific contribution of the study versus specialty literature is discussed in Section 5, while Section 6 presents the conclusions.

2. Literature Review

2.1. Key M-Commerce Business Features

According to Michael Rappa [30], merchant models vary from traditional wholesalers (B2B) and retailers of goods and services (B2C) to virtual merchants (or “e-tailers”) that are operating solely on the web. Between those two opposites, there are also catalogue merchants (that are operating based on a web-based catalogue, with customers placing their orders via mail, telephone or online), “click and mortar” merchants (that are traditional vendors that developed their webstore) and bitvendors (that are selling and distributing only digital products and services strictly online).
Currently, two major e-commerce business models are the most developed so far, according to Turban et al. [31]: internet malls (e-malls) and webstores (also known as storefronts).
The internet mall (e-mall) is offering multiple companies the possibility to sell their goods online, in a similar manner to a physical mall, but using software tools. The main difference between the e-mall and webstore business models are in the revenue streams (e-mall revenues come mainly from commission fees from online sellers, based on their sales volumes).
The webstore business model is heavily similar in some features with traditional retail model—a company that is selling goods to individuals [32] but has some particularities given by specific use of Information and Communication Technology (ICT) tools, i.e., the existence of a merchant software (that includes an electronic catalogue, a search engine, an electronic shopping cart and a link to an electronic payment system), plus an (possibly) automated customer relationship centre and certain shipment facilities. In addition, it is addressed to customers equipped with smart mobile devices and who know how to use applications developed especially for them.
Therefore, the development of an m-commerce business starts from the premises of the pre-existence of a relatively sophisticated infrastructure of networks, servers and mobile devices capable of interconnecting (e.g., the hardware architecture) databases, security applications, search engines, electronic catalogues, electronic shopping carts and applications for electronic payment processing (e.g., the software architecture). It also presupposes the existence of efficient shipping and Customer Relationship Management (CRM) systems, which are in some cases automated (see Figure 1), because “for online retailing operations, shipping costs are also an important determinant of a consumer’s purchase decision” [33].
For a better understanding of this type of business, we present a possible business model in the m-commerce field for webstores, developed by us based on the Canvas Business Model (Figure 2) [34].
We can see that the development of such new businesses depends on the degree of development of other industries such as mobile telecommunications and smartphone apps, but also on the degree of customer sophistication (or “customer readiness”), i.e., living and education standards, lifestyle, skills in using phones and mobile apps.
Ijaz and Rhee [35] concluded that the factors influencing online consumer behaviour are perceived value, perceived risk, social factors, ease of use of the site, perceived usefulness, purchase intention, previous online experience, current desire to purchase, entertainment gratification, website irritation, information design, visual design, and navigation design. Technological developments have led to changes in consumer behaviour concerning online purchases, from computers/laptops to mobile phones/tablets [36]. This influenced the emergence of more and more applications for smartphones; the ease and convenience of using them can make the difference between them from the consumer’s point of view [36].
Retailers in m-commerce are interested in providing visitors with a pleasant experience through applications with the most appropriate design, friendly and easy to use [37]. An SME related study from the European Union revealed that companies that have an optimised site have more visitors, more chances to receive orders (even if some of these orders are made from the computer), and as the number of mobile visitors increases, companies are tempted to invest more in optimising the site [38]. Optimising mobile applications can provide the opportunity to collect information about consumers to better manage the relationship with them [39].

2.2. Free Shipping Threshold

The competitiveness of m-commerce retailers also depends on the delivery policy (how the buyer receives the products) and any failure related to this is leading to the emergence of problems related to the long-term relationship with the consumer [40]. The most important issues related to the delivery policy are the delivery time, the delivery fees and the ease of changing and returning the products [41]. From the consumer’s point of view, the delivery fee has the greatest significance, followed by the delivery speed, the time interval, and the delivery date (day/evening) [42].
Free delivery (or at least free delivery for minimum order) is considered one of the success keys in m-commerce [43,44] and one of the most used methods implemented by online retailers to attract consumers’ attention [45] along with issuing cards that offer lower prices to consumers [46,47]. Providing free transportation of a value higher than the average value of orders placed can stimulate consumers to buy more [48].
Free or reduced shipping costs can be achieved in several ways by online retailers: free shipping despite the shopping cart’s value, contingent free shipping (CFS) for a certain value, and/or lower shipping charges as the shopping cart value increases [33].
A popular strategy among online retailers is the contingent free-shipping strategy (CFS), which provides free shipping for a certain value of the shopping cart, which determines buyers to add so-called “fillers” (products) to the cart to achieve the value [49]. The results of a study related to Free Shipping Policy show that the distance for home delivery does not significantly influence the costs of providing free shipping, and setting a reasonable minimum threshold for free shipping can increase the shopping cart’s value, increasing the long-term profitability of retailers [50]. However, some studies show that this method can lead to lower profits for online retailers and unsatisfactory quality of logistics services [45]. Researchers consider that in making decisions about the transport price, the fact that the consumer’s sensitivity to this price is different when buying expensive or cheap products must also be taken into consideration. Respectively, the action to offer free transport creates an advantage for the sellers of cheap products, while the transport fees are advantageous those who sell expensive products [51].

2.3. Evolution of the M-Commerce

  • Evolution of the m-commerce offer
Under the pressure of the development of information technology and the Internet, not only the companies’ business models have transformed [52,53], but also the markets in which these competitors operate. According to Laudon and Traver [54], price rivalry between existing competitors has now increased with the expansion of the market, due to the reduction in entry barriers in the field of online commerce. In addition, in some market segments, the bargaining power of some suppliers has decreased (especially in the field of automobiles with online procurement systems) and of some buyers has increased (especially of retail consumers). Companies are thus forced to increase their operational efficiency and apply more sophisticated differentiation strategies if they want to be successful in business in the m-commerce market.
According to Statista [55], in 2018, the percentage of consumers who made at least one purchase online in the previous 12 months grew to 93% of internet users in the U.S., 97% in the UK, and 92% in China. The market of developed countries is in its maturity phase, and the competition among e-commerce players is extremely high and cost-intensive. Marketplaces such as Amazon and AliExpress are flourishing, while many stand-alone retailers struggle to find their unique selling proposition as brand and store loyalty are decreasing and the cart bounce rate in the industry is currently at 75%. Increasing brand engagement can be achieved through community building (e.g., ASOS Marketplace), loyalty programs, and a seamless mobile and desktop user experience.
In 2020, the e-commerce retail sales saw a spectacular increase of over 27% worldwide, with countries in Latin America, North America and central and eastern Europe (Romania included) being among the most visible in this respect. A clear trend becomes more obvious: the e-commerce is moving beyond the Western world [56].
According to Statista [57], the retail e-commerce sales are forecasted to grow with a compounded annual growth rate (CAGR) of 6.29% worldwide. While developed markets (US, Australia, UK, France, Italy) will encounter a lower CAGR, the emerging markets (such as Turkey, Argentina, Indonesia and South Africa) will have a CAGR of over 10%. The information provided by datareportal.com for the year of 2019 [58] stated that for a population of 7.676 billion, the internet penetration rate was at 54%, while the mobile subscription rate was over 115%. In 2021 “6 in 10 people around the world is using the internet” [59]. Out of all internet users, 91.5% are smartphone internet users, and 46.4% are using them for researching products and brands.
Therefore, m-commerce is a market with huge world business opportunities, and for a better understanding of its dynamics and characteristics, a series of ranking indices have been developed based on criteria related to the availability of high-speed mobile internet networks (infrastructure), mobile internet services’ ease of access and smartphone price accessibility (affordability), the degree of sophistication of consumers regarding their ability to understand and use applications on mobile phones (consumer readiness), the degree of availability, security, and accessibility of the relevant online content for the local population (content and services). According to Global System for Mobile Communications Association (GSMA) [60], the most used indices worldwide are: the ICT Development Index (International Telecommunication Union); Mobile Connectivity Index (GSMA); Affordability Index (Alliance for Affordable Internet); Digital Economy and Society Index (European Union); Global Connectivity Index (Huawei); Inclusive Internet Index (The Economist Intelligent Unit). The main characteristics of the mobile e-commerce market in Romania are presented in Table 1 [61,62,63,64,65,66].
Based on its yearly index (calculated for 100 economies of the world), The Intelligent Economist Unit [67] states that “Romania merits its place in the top quintile of index countries (20 out of 100) on the back of comparatively high scores in Availability (particularly fixed broadband quality) and Affordability (costs of fixed broadband as well as smartphones). Readiness, meanwhile, leaves much room for improvement, particularly in the area of policy”. The Huawei Global Connectivity Index ranks the economies based on four technologies enablers (broadband, cloud, AI, IoT) and four pillars (supply, demand, experience and potential), offering 40 indicators for a broad comparison among countries. Romania’s rank reflects its strengths and also its business opportunities: increased connectivity due to high smartphone penetration rates and mobile broadband subscription and an incipient e-commerce market, with ICT having a growing role in influencing new business models [66]. According to ecommercedb.com [68], “Romania is the 50th largest market for e-Commerce with revenue of US $2 billion in 2020, placing it ahead of Bangladesh and behind Singapore”. The GPeC Report (2020) [69] estimates that the e-commerce sector was EUR 5.6 bil. in 2020 compared to only EUR 4.3 bil. in 2019 (a 30% increase). The Romanian market is fragmented between several large traders and many small traders, some of which are in the first attempt of doing businesses of this type, and others belonging to mature companies that either initiated this type of sales in Romania or diversified their selling processes, setting up their own online sales site. The eMAG.ro platform is among the pioneers of the online commerce market in Romania, currently being the largest player in the Romanian e-commerce market, with a revenue of USD 653 mill. in 2020 and in the process of a full transformation into an e-mall. “It is followed by fashiondays.ro with USD 103 million revenue, altex.ro and dedeman.ro with USD 94 million each.” The profile of e-commerce websites can be a general one, such as e-mag.ro and fashiondays.ro platforms, or specialised in a certain field (construction materials, interior design, fashion, food, personal care, sports and outdoor, events, furniture and appliances, DIY, Garden and Pets, etc.). “Five categories are considered by ecommercedb.com [68]. Fashion is the largest segment in Romania and accounts for 40% of the e-commerce revenue in Romania. This is followed by electronics and media with 26%, food and personal care with 14%, Toys, hobby and DIY with 11% and furniture and appliances with the remaining 9%.” Some of these companies are part of large international groups, which operate in multiple markets (such as Prosum NV—ultimate parent of Dante International SA, which operates e-mag.ro and fashiondays.ro—and which in turn is owned by the Southern African company Naspers), while others are focused almost exclusively nationally, both as a market and as a shareholder. The e-commerce platforms with the fastest growth rate in 2020 on the Romanian market were those that belong to the large retail chains operated by Ahold Delhaize (mega-image.ro) and Auchan (auchan.ro), but also a company that sells consumables, disinfectants and medical instruments (mkd-medicale.ro). According to Statista [70], the CAGR for 2020–2024 for Romania was estimated at 13%, while for 2021–2025, it was at 9.5%, one of the fastest in the Eastern European Region (after Ukraine), due to the main drivers of the market expansion presented above (see Table 1).
  • M-commerce demand
A 2018 report provided by Nielsen Co. (New York, NY, USA) [71] emphasised that the online customers were buying mostly fashion items (61%), travel related items (59%), books and music (49%), but also IT and mobile (47%), and event tickets (45%). Women were more interested than men in this activity (72% versus 68%); female online shoppers were buying clothes, while male shoppers were more interested in acquiring computers and travel related items (tickets and accommodation) [72].
Their online shopping behaviour is displayed more and more on mobile phones rather than on desktops, according to bigcommerce.com, with mobile commerce becoming dominant in online sales in 2021 [73]. This trend is also influenced by the COVID-19 pandemic, as a 2021 United Nations Conference on Trade and Development (UNCTAD) online purchasing behaviour study revealed. Among the people that were questioned, 52% agreed that since the outbreak of COVID-19 they shopped online more often than before, with women, highly educated consumers and the 25–45-year-olds being the most prominent online shoppers worldwide [74].
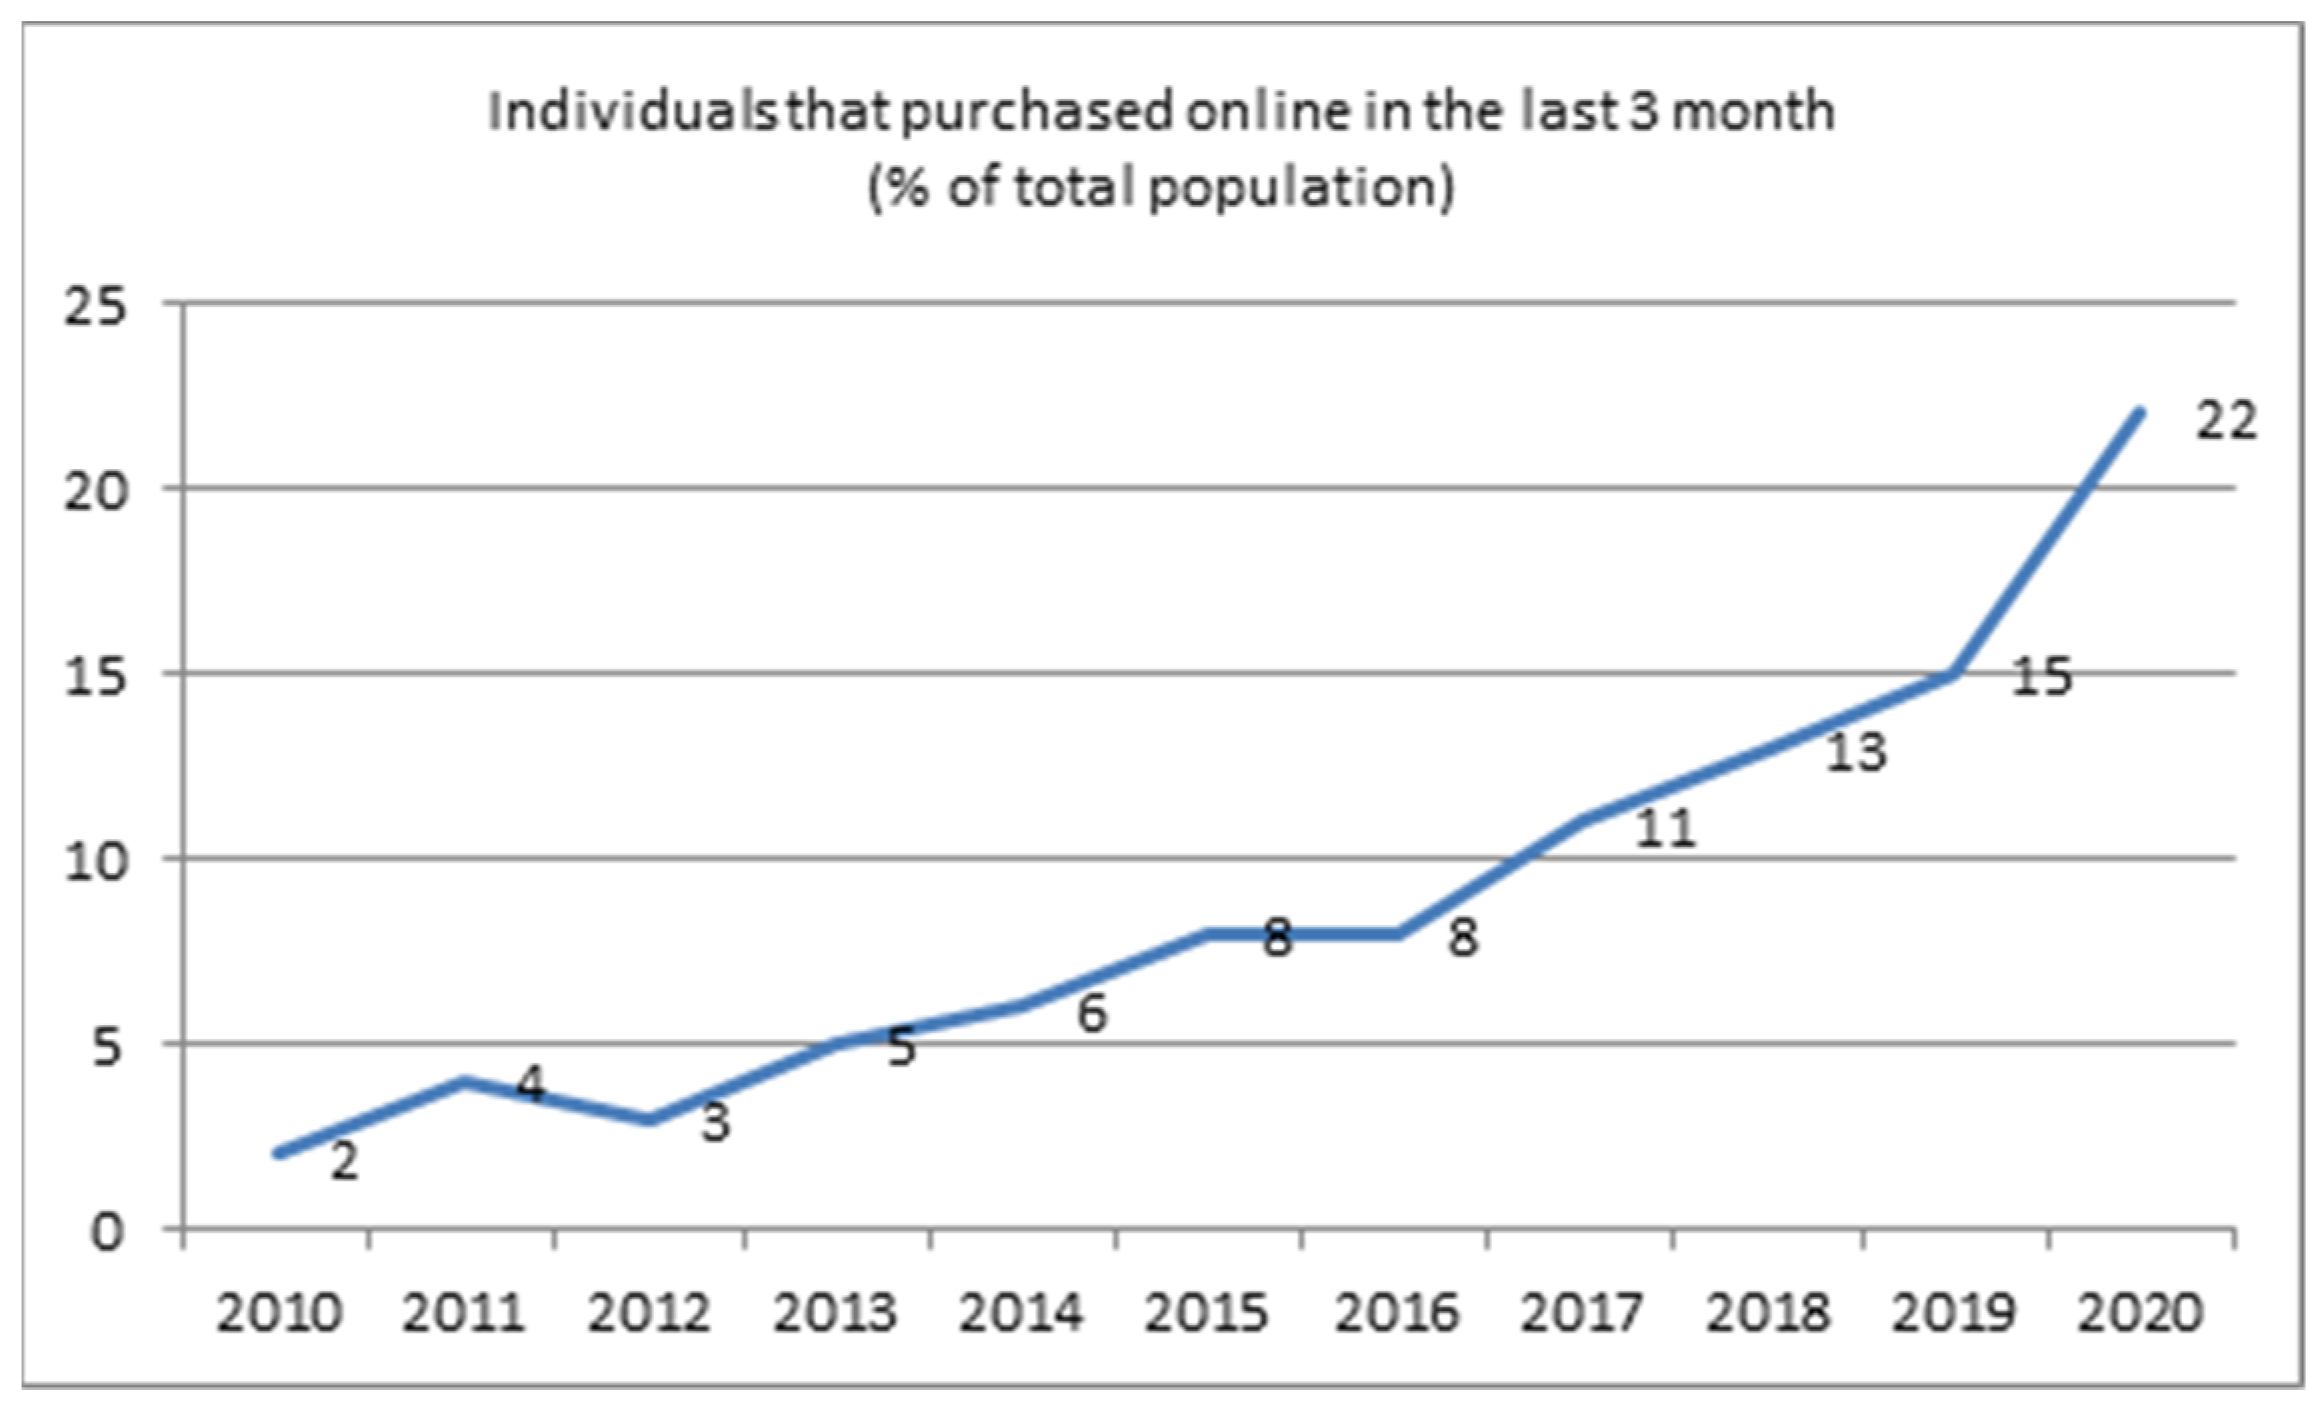
According to Eurostat [75], the profile of the Romanian customer who uses online shopping has also evolved rapidly in the last 10 years, from a modest 2% of the total population who made such purchases at least once every 3 months in 2010, to 22% in 2020 (see Figure 3); in 2021, the profile will already be much changed after a whole year of pandemic and lockdown periods.
Not only have the devices used changed radically in the last 5 years (from laptops to smartphones), but the frequency of purchases has also changed, as has the structure of the shopping cart. Thus, according to Kemp [61], the profile of the Romanian customer owning mobile devices is the following: not only have the devices used changed radically in the last 5 years (from laptop to smartphones), but the frequency of purchases has also changed, as well as the structure of the shopping cart. Moreover, according to datareportal.com, the profile of the Romanian customer who owns mobile devices at the beginning of 2021 is the following: is part of a group of 55.5% of internet users who use shopping apps on mobile devices every month and who has made at least one purchase online via mobile phones in the last month (41.7% of the total population), most of them being between 35 and 44 years old and being female (19.6% women compared to 18.8% men) and whose pandemic has radically changed their online shopping habits (see Table 2).
Given the recent history (sprinkled with many payment incidents, especially in 1990–2000), the Romanian consumer is rather cautious and conservative, attached to his favourite brands and sites [61,76] and not very willing to use online card payments, even if in 2020 there were several cards in circulation almost equal to that of the country’s population (Table 3) [77,78].
“Romanians preferred online card payments especially when they paid for services and less when they paid for e-tail” [79]. According to Romania Journal.ro [80], “e-commerce will continue its evolution and will register an increase of at least 15% in 2021”, with two of the major trends being “increased card payments and mobile shopping” and “better online experience due to digitisation”. In 2021, customers will perceive card payments as increasingly secure, due to Romania’s implementation of the European PSD2 directive. In addition, in the medium term, the clients will tend to use the shopping cart in one online place, preferably a marketplace, with the main domains being home and decoration, pharm and fashion [81].

3. Materials and Methods

The objectives of the study shape a framework for stimulating the behaviour of digital buyers by retailers. Therefore, it was addressed how SMEs operate in the field of e-commerce in terms of stimulating purchasing behaviour with the minimum value of the shopping cart for free shipping.

3.1. Research Objectives and Hypotheses

Previous studies [2,11,37,39,43] show the importance of technological performance to stimulate consumer behaviour. While other studies [33,45,82,83] show the significance of shipping services, the authors explain the selection of the hypothesis based on the combination of the two perspectives in order to enrich the academic world with a new perspective of the sustainable retailer. In order to achieve the purpose for which this study was designed, the objectives cover the authors’ motivations to (1) identify online stores optimised on the mobile device, (2) discover e-tailers that display the minimum value of the shopping cart for free shipping at the first interaction with the content loaded on the mobile device, (3) identify the place where retailers derive their on-site delivery policies from and (4) proposing recommendations for e-tailers to adapt their strategies to a new optimised customer journey in order to become more sustainable. The hypotheses of the study were formulated in synchrony with the previously mentioned objectives, being represented by the following statements:
  • The online stores are optimised on mobile devices;
  • Retailers are displaying the minimum amount of the shopping cart for free shipping quite soon after the mobile page is loaded;
  • Retailers are linking the delivery policy with the home page.

3.2. Methodology

The study aims to find a solution to increase SMEs’ specific competitive advantages in terms of sustainability. Using the contingent free shipping [82,83] and the customer journey’s touchpoints, the authors try to build a new consumer behaviour model that e-tailers can deploy to enhance their global competitiveness and productivity regardless of its size or the field in which they activate. Considering the CFS theory, which mentions that consumers are influenced when retailers provide free shipping on a purchase worth a certain amount, their consumer behaviour changes as well [49], and the study extends it as a solution for the SMEs’ sustainable transformation. Using five types of research methods, namely, an additive function (AF) construction [84,85,86,87], a Technique for Order of Preference by Similarity to Ideal Solution (TOPSIS) [88], a Spearman rank correlation coefficient calculation [89], a content analysis [90] and an analytic hierarchy process analysis (AHP) [91,92,93,94,95], a new digital buyers’ behaviour model is proposed for future research. In order to discover how SMEs can become more competitive in a growing market and with a record growth rate of the e-commerce domain, the study was conducted considering the technological performance of SMEs’ online stores and how they display useful content for users. In order to carry out the research, the online stores which presented a Certificate of Trust mark [96] at the date of the study were chosen. Therefore, 205 online stores were analysed by indirect research methods, as explained in the following methodology.
Based on the objectives of this work, three elements of the new model were introduced in the performed content analysis (Table 4). The study included retailers selling products via the Internet and having at least one payment method integrated on a website. The authors analysed how they communicate the delivery policy to discover the online stores that display on the home page information about free shipping. The research framework consisted of six steps and it is pictured in Figure 4.

3.2.1. Touchpoint Selection

Understanding the free delivery policy impact on e-commerce, the free shipping conditions and the significant user interaction moments were taken into account [40,49,50].
At the heart of the analysis were the requirements of users accessing the online stores, the authors expecting that a customer’s experience on the mobile device will generate the desire to add new products to the cart and place the order. Therefore, a non-touchpoint was selected as the first point of interaction [97], that is, the moment of accessing the online store (home page) with the smartphone. At this point, site optimisation on the mobile device is crucial for the continuation of the customer journey [36,37,38]. This moment (touchpoint) was tested and introduced as a defining element in the proposed model. The technological performance of the related sites is expected to provide fast access to content, with as few clicks away as possible and being adapted to the mobile device from which consumers would commonly access the links. The Mobile-Friendly Test platform [98] was used to test the interface of the online stores. In order to be able to analyse whether a retailer displays the conditions for free shipping when accessing the online store using a smartphone, its website must be optimised on this type of device. The online store home page link of each retailer included in the study was inserted on the aforementioned platform and a comparative set of image information was generated, one for illustrating the page in desktop format (1) and one for illustrating the page in the format specific to the mobile device (2). Figure 5 showcases an example.
The second touchpoint pictures the moment when the user discovers the CFS element and acknowledges the existence of free shipping conditions (touchpoint 2) as well as the minimum amount that the user must interact with to obtain the benefit (touchpoint 3). These were analysed through a home page performance technical testing step, initiated to see how it adapts to the specific format of the mobile device. An inspection of the visible area of the mobile home page (b) was performed to identify if there exists any information regarding free shipping in a certain geographical area or when purchasing products of a certain value. The fourth touchpoint is represented by displaying the link to the policy page in the mobile-optimised site’s area, its selection representing the solution for the moment when users are searching for detailed information about the whole delivery policy.
All four chosen touchpoints are considered defining elements for shaping the sustainable retailer concept, the main purpose for which this study was conducted. Trying to validate the concept, the authors performed a ranking of e-tailers’ sites and a content analysis that allowed the analytic hierarchy process to be performed.

3.2.2. E-Tailers’ Site Rankings

This step was followed to evaluate the online stores from a category, taking into account the four criteria below. This evaluation allows ranking of the e-tailers’ sites to discover which one performs the best regarding the selected touchpoints. Constructing the additive function and applying the TOPSIS method, the new behaviour model’s elements are validated.
For site evaluation, four analysis criteria were considered:
  • the existence of optimisation for the mobile phone;
  • the existence of the delivery policy;
  • the existence on the first page of the information related to free shipping (without transport costs);
  • transport cost.
The evaluation of the sites leads to the solving of a multiattribute decision model that achieves the ordering of all the variants (in our case, of the sites) concerning the considered criteria. The studied sites were partitioned into nine categories (according to Trusted.ro [96]), for which data existed as shown in Table 5.
In order to establish a ranking within each category, an additive aggregate function (AF) was built, to evaluate the sites based on the four analysis criteria considered. To validate the proposed function, the data were tested by the TOPSIS method [88] and the results of the orders obtained were analysed by calculating Spearman’s coefficient of correlation of ranks [89].
For the additive function construction, we considered four variables resulting from the established criteria:
  • Is the site optimised for mobile devices?
For the answers Yes/No were associated with the Boolean variable, V 1 { 0 , 1 } .
2.
Is there a delivery policy?
We associated the responses with the variable:
V 2 = { 0 ,   there   is   no   delivery   policy   q ,   there   is   a   delivery   policy   and   V 1 = 0 1 ,   there   is   delivery   policy   and   V 1 = 1
where q ( 0 , 1 ) is a penalty coefficient in the situation where V 1 = 0 .
3.
Does information appear on the first mobile page about free delivery? (Yes/No)
We associated the responses with the variable:
V 3 = { 0 ,   there   is   no   delivery   policy   q ,   there   is   a   delivery   policy   and   V 1 = 0 1 ,   there   is   delivery   policy   and   V 1 = 1
where q ( 0 , 1 ) is a penalty coefficient in the situation where V 1 = 0 .
4.
If the transport is free, then the question is: what is the minimum amount of the shipping cart?
The variable is the amount from which the shipping is free and we note it with S,
S 0 ,   S m a x
Defining the variable:
v 4 = { 1 S S m a x ,   i f   v 3 0 0 ,   i f   v 3 = 0
An additive evaluation function is defined as follows:
f : { 0 , 1 } × [ 0 , 1 ] × [ 0 , 1 ] × [ 0 , 1 ] [ 0 , 4 ]
F A ( v 1 , v 2 , v 3 , v 4 ) = v 1 + v 2 + v 3 + v 4
and is calculated for each site in the analysed category.
The site ranking is achieved by decreasing values of the function AF.
Annotation: The impossibility of aggregating indicators [84] presents the minimum and logical conditions that must be met by an aggregate indicator “good”. It must be: sensitive, anti-catastrophic and non-compensatory. The process of defining the variables V 1 ,   V 2 ,   V 3 ,   V 4 ensures that the constructed additive evaluation function is sensitive and anti-catastrophic. The defined V 2 and V 3 depend on V 1 , and V 4 depends on V 3 , which decreases the compensatory character of the aggregate indicator given by the additive evaluation function (AF) [85,86,87].

TOPSIS Method (Technique for Order Preference by Similarity to Ideal Solution)

The principle of variants for different criteria values builds positive ideal solution and negative ideal solution [88]. The variants are ranked according to the distances to the two solutions. In order to make the comparisons, a distance relative to the positive solution is calculated accordingly, taking into account the two distances. As a geometric interpretation, each variant represents a point in the n-dimensional space, where n represents the number of criteria. In this space, two more points are defined (the ideal positive solution and the negative ideal solution), from which the relative distances of the variants are determined. The ideal positive and ideal negative solutions may belong to the class of analysed variants.
It is observed now that the matrix of consequences R = ( r i j ) ,   i = 1 , 2 ,   m ,   j = 1 , 2 , 3 , 4 , defined by variables’ values V 1 ,   V 2 ,   V 3 ,   V 4 , is normalised, ( r i j [ 0 , 1 ] ) . In the analysed situation, m represents the number of sites in a specific category. It is considered that all four characteristics have the same weight.
We determined the ideal positive solution, V i d , and the ideal negative solution, V n e , as being:
V i d = ( v 1 i d , v 2 i d , v 3 i d , v 4 i d )   V n e = ( v 1 n e , v 2 n e , v 3 n e , v 4 n e )
where v j i d = V 1 i m m a x i j and v j n e = V 1 i m m i n i j .
Then, we calculated the distances between the variants and the positive ideal solution, respectively, between the variants and the negative ideal solution:
d i i d = j = 1 4 ( r i j v j i d ) 2    d i n e = j = 1 4 ( r i j v j n e ) 2
The relative juxtaposition to the ideal solution is obtained by calculating:
e i i d = 1 d i i d d i i d + d i n e = d i n e d i i d + d i n e

3.2.3. Content Analysis

The content analysis [99] was necessary for the decision-making process, because, with its help, the categories of retailers were identified, and then they were considered as being the alternatives in the AHP analysis performed at the next step. The vertical and horizontal analysis allowed us to choose the eligible retailers and to identify the sets of retailers (categories, listed from A to I), depending on the approach of the selected touchpoints. Subsequently, for each category, the purchase journey was drawn from the point of view of the positive or negative experience encountered, and the most frequently encountered situations were underlined.

3.2.4. Analytic Hierarchy Process

The AHP research method was introduced in this paper to support the decision-making process regarding the most sustainable SME category. The model was possible to create due to the results of the e-tailers’ site evaluations and the content analysis performed and it continues the validation process of the proposed sustainable retailer model. The AHP method has been chosen because it represents a multicriteria decision-making approach in which factors are arranged in a hierarchic structure that allows finding the focused judgment separately on each alternative [91,92] for finding the one decision that best suits the goal [95]. Given the longevity of this method in the literature, the authors aimed to revive it, especially due to the recent published studies that mention it [93,94,95]. The AHP supposes to organise a decision problem by arranging the factors that are important for the decision process in a hierarchic structure descending from an overall goal to criteria, subcriteria and alternatives in successive levels. The first step is to structure the problem as a hierarchy that consists of three different elements (goal, criteria, and alternatives). The first level (or top-level) is the overall goal, the sustainable retailer. In the second level there are the selected touchpoints (criteria) that contribute to achieving the sustainable retailer goal, and the third (bottom level) representing the alternatives evaluated in terms of the criteria from the second level. In the second step, one derives the relative weights for all the decision criteria through a series of comparisons of two decision criteria at a time. A fundamental scale was used in making the comparison, consisting of judgments ranking from equal to extreme (Table 6).
The methodology then implies the arrangement of the elements from the second level into a matrix to lead to the third step when the decision alternatives are prioritised to achieve the goal. This is achieved by combining the average criterion weight with the average priority weight for different decision alternatives for the different criteria [91,92]. Using the alternatives resulting from the content analysis, the hierarchy was built (Figure 6). The goal of the sustainable retailer was achieved through selected criteria and by a specific e-tailers category presented in the results section.
The compounded methodology described above, using results that edified the authors concerning the sustainable retailer-specific features, favoured the creation of a new consumer behavioural model, as well.

4. Results

4.1. Additive Function and TOPSIS Method

The evaluation of the AF for the Health and Beauty category containing 28 sites (the category with the largest number of online stores), with the penalty coefficient q = 0.8, was used for the values presented in Table 7. The penalty coefficient q was established iteratively to minimise the compensatory nature of the aggregate indicators that are part of the aggregate AF [100,101,102].
The classification of the sites into a category was performed by decreasing the values of the ideal solution ( e i i d ), calculated according to Relation (7), presented in Table 8.
From running the analysis, it was observed that the defined evaluation function AF (having a penalty coefficient of 0.8) returned the same ranking values for all nine analysed categories, with those obtained by the TOPSIS method. This was also validated by calculating the Spearman’s rank correlation coefficient. Noting ( R A i ,   i = 1 , 2 , , m ) the ranks of the sites resulting from the classification obtained by the calculation of the FA and ( R T i ,   i = 1 , 2 , , m ) , the ranks obtained by applying the TOPSIS method, the Spearman’s coefficient is given by the following equation:
S = 1 6 · i = 1 m ( R A i R T i ) 2 m · ( m 2 1 )
For all nine categories of the analysed sites, S = 1 was obtained, which shows a perfect correlation of the ranks resulting from the classification of sites by the two methods.
The proposed method for the determination of the additive functions for deciding the rank of a website in the category is thus validated by analysis. The advantage of the chosen method consists of the direct calculation of the value of the additive function and rank determination without involving the calculation of the other elements (sites) from the respective category [87,103,104]. In the case of the TOPSIS method, the introduction of a new element (site) presupposes a new determination of the ideal positive solution, V i d and of the ideal negative solution V n e and resuming the calculation to determine the relative juxtaposition to the ideal solution.

4.2. Content Analysis and AHP Analysis

Running the content analysis, the authors generated the following nine e-tailer categories (from A to I), presented in Table 9. These types of e-tailers play an alternative role due to the analysed selected touchpoints’ specifications. As can be seen in the “Touchpoints” column, each category is unique and presents the e-tailers approach. The “customer journey” column draws the flow and underlines the positive (green dots) or the negative (red dots) experiences that the users have when they are going through to purchase journey regarding the studied online stores. As the table shows, the A category presents all four optimised touchpoints, so it draws a linear customer journey, with every touchpoint ensuring a constant flow to check-out moment. This cannot be said about all the others retailers’ categories, because each presents a lack of optimisation for a specific moment in the journey. For example, D category ensures a good experience only for T2, T3, and T4, with the most important touchpoint presenting a non-optimised page, damaging the user experience and determining a bounce of pre-checkout process.
Unfortunately, the most common situation showcases a negative experience, where the users meet up with non-optimised touchpoints (Figure 7).
The application of the AHP approach assumes the decision criteria comparison to derive relative weights. Table 10 presents a matrix for the e-tailer category, respecting Touchpoint 1 decision criteria.
The next step was to calculate the average criteria weight and the AHP software was used to generate the values (results column in Table 11).
The relatives’ weight obtained showcase that category A is the best alternative when sustainable retailer status is desired as a goal (Figure 8).
Based on criteria importance results (Appendix A), Figure 9 shows that Touchpoint 1 has the greatest contribution to the transformation process.
The rankings of the alternatives with the touchpoints structure are pictured in Figure 10 and present the overall contribution for each alternative based on chosen criteria.
The results highlight the circumstances of the optimisation of the customer’s journey, which is the premise for the discussion section.

5. Discussion

To solve the problem of long-term competitiveness and innovation [16], the authors propose providing an added-value consumer experience through an innovative business model created on a sustainable basis, as the literature demands [17]. The sustainable retailer model’s specific features that the authors validated suggests the need for surveillance of SMEs in the single digital market, providing competitive advantages. They support the process of creation of a needed sustainable shopping environment for digital buyers [15], which leads to the necessary transformation of business models into sustainable ones through a blended value proposition and improved customer relationship by introducing the touchpoint optimisation as a component of business value proposition in the business canvas model [12].
The sustainable retailer profile that this paper presents manages online consumer behaviour, providing visitors with a pleasant experience during the customer journey, which is an important goal for online retailers and we find it is also supported in other studies [105,106,107]. Optimising the moments of interaction with users, the sustainable e-tailers can stimulate the purchasing behaviour by improving the perceived value and ease of use of the online store’s touchpoints and increasing the number of their customers by making their sites more user-friendly. Therefore, the users will continue to add new products to their virtual shopping cart and to place the order to reach the minimum threshold for receiving the benefit. By changing the consumer behaviour, the average value of the shopping cart will increase, and the SMEs will receive more valuable orders and will become more sustainable over time [50], being able to survive in a competitive, ever-growing market. Thus, they will no longer represent the SME category that, by its nature, appear sonly locally, operating at a small scale, and being connected only to local markets. They can expand their coverage, sell more at lower costs, become the so-called “gazelles”, represented by entities that create competitive advantages, introduce new technologies, reduce costs and improve processes, therefore achieving a rapid growth rate.
The consumer behaviour metamorphosis is necessary for long-term growth [2,3] and SME technological performance enhancements. The non-touchpoint (mobile device home page optimisation) is the launching key of retailers’ that sell online success. It contributes the most to the SMEs transformation process and ensures the continuation of the customer journey. Becoming a sustainable retailer implies the optimisation of all four touchpoints, namely, a mobile device-optimised site, visible shipping information on the first mobile device page that contains the value or the geographical conditions, and linked delivery policy, not only of one of them. The results of the study revealed that the A category of retailers performs the best as a sustainable retailer (Figure 11), with other alternatives mitigating the chances to achieve this goal (Figure 8).
The results of other studies demonstrate the need to rethink the business models based on innovation and the requirements of Industry 4.0. [108,109,110]. In this context, this business proposal for SMEs’ transformation encourages the e-tailers to become more sustainable and therefore more valuable when they optimise the customer shopping experience, without consuming non-renewable resources, but mainly by (re)organising the generated information through an innovation process.

6. Conclusions and Proposals

The scientific contribution of our paper is represented by the proposed sustainable retailer model that underlines the importance of the touchpoint’s optimisation during the customer journey. Considering contingent free shipping theory, the authors linked it to significant customer journey touchpoints regarding delivery policy, showing the manner by which this combination of concepts can represent a solution for SMEs to become more sustainable. The study confirms the importance of site optimisation and reveals its contribution to SME metamorphosis when stimulating consumer behaviour. In addition, the authors present a different perspective of sustainability, introducing the selected touchpoints as elements within a behavioural model.
The theoretical and managerial implications highlight the proposals for specialists, universities, and learning advisors that can encourage and sustain the promotion of the customer journey optimisation through touchpoints aiming to enhance the SMEs’ growth strategies. Considering the academic and non-academic worlds with the proposed model, the authors can help the stakeholders to discover the challenges and the opportunities to develop their assets in order to provide added-value online services to digital buyers. For example, the specialists have the opportunity to operate with business canvas model’s customer segmentation to extend the segmentation criteria by income, rural/urban, etc. This paper suggests modifying the business model by better understanding the customer’s profile using digital marketing tools, increasing the number of viable SMEs by introducing sustainability among the company’s strategic objectives, elevating the welfare level of the society by increasing the tax base (more contributors), and involving universities in the education of small entrepreneurs regarding the alternative ways in which they can develop their businesses (within entrepreneurship education modules), for which the results of this study should be offered in a free access system.
The first limit of further research is the secondary character of the data source, which positioned retailers in specific categories created from a subjective perspective. A second limit is characterised by the number of studied retailers that cannot represent the analysed population. In addition, the technological performance testing with software replaced real people’s experiences, representing a limit that can be avoided with future research.
Quantitative research can validate the effectiveness of the proposed model, so it can be performed by aiming to formulate a quantitative hypothesis regarding the status of e-tailers concerning the sustainability perspective. In addition, qualitative research can generate new ideas to enhance the sustainable retailer profile, extending the list of selected touchpoints. Another research proposal is to elaborate a consumer-oriented study to define the perception of users regarding the significance of free shipping provided by e-tailers. In addition, researching the artificial intelligence promotion tool fees is necessary to underline the shift to a 5.0 society, adapting the business model accordingly.

Author Contributions

Conceptualisation, E.N., R.C.L., S.S., I.B.C. and G.B.; methodology, E.N., R.C.L. and G.B.; literature review, S.S. and I.B.C.; analysis and writing the results, E.N. and R.C.L.; discussion and conclusions, E.N., R.C.L., S.S., I.B.C. and G.B.; writing—original draft preparation, E.N., S.S. and I.B.C.; writing—review and editing, E.N., R.C.L., S.S., I.B.C. and G.B.; supervision, G.B. All authors have read and agreed to the published version of the manuscript.

Funding

This research was funded by the Transilvania University of Brașov.

Institutional Review Board Statement

Not applicable.

Informed Consent Statement

Not applicable.

Data Availability Statement

The data presented in this study are available online at https://bit.ly/33nP3PP (accessed on 6 May 2021) and in the Supplementary Materials.

Conflicts of Interest

The authors declare no conflict of interest.

Appendix A

Table A1. Criteria preference calculation.
Criteria PreferenceTouchpoint 1Touchpoint 2Touchpoint 3Touchpoint 4
A0.16950.17260.21570.1805
B0.16020.16380.19320.0703
C0.14170.16010.09240.1656
D0.03800.15130.18450.1649
E0.14770.14250.05480.0364
F0.14620.03360.03730.1608
G0.03070.12850.17740.0243
H0.14760.02710.02680.0166
I001840.02040.01800.1805
Source: AHP software.
Table A2. Criteria’s Importance.
Criteria’s ImportanceResults
Touchpoint 10.667
Touchpoint 20.2089
Touchpoint 30.0926
Touchpoint 40.0314
Source: AHP software.

References

  1. Oláh, J.; Kitukutha, N.; Haddad, H.; Pakurár, M.; Máté, D.; Popp, J. Achieving Sustainable E-Commerce in Environmental, Social and Economic Dimensions by Taking Possible Trade-Offs. Sustainability 2018, 11, 89. [Google Scholar] [CrossRef] [Green Version]
  2. Nisar, T.M.; Prabhakar, G. What factors determine e-satisfaction and consumer spending in e-commerce retailing? J. Retail. Consum. Serv. 2017, 39, 135–144. [Google Scholar] [CrossRef]
  3. Rahman, M.A.; Islam, A.; Esha, B.H.; Sultana, N.; Chakravorty, S. Consumer buying behavior towards online shopping: An empirical study on Dhaka city, Bangladesh. Cogent Bus. Manag. 2018, 5, 1514940. [Google Scholar] [CrossRef]
  4. Tran, L.T.T. Managing the effectiveness of e-commerce platforms in a pandemic. J. Retail. Consum. Serv. 2021, 58, 102287. [Google Scholar] [CrossRef]
  5. Bhatti, A.; Akram, H.; Basit, H.M.; Khan, A.U.; Raza, S.M.; Naqvi, M.B. E-commerce trends during COVID-19 Pandemic. IJFGCN 2020, 13, 1449–1452. [Google Scholar]
  6. Vakulenko, Y.; Shams, P.; Hellström, D.; Hjort, K. Service innovation in e-commerce last mile delivery: Mapping the e-customer journey. J. Bus. Res. 2019, 101, 461–468. [Google Scholar] [CrossRef]
  7. Wang, Y.; Jia, F.; Schoenherr, T.; Gong, Y. Supply Chain-Based Business Model Innovation: The Case of a Cross-Border E-Commerce Company. Sustainability 2018, 10, 4362. [Google Scholar] [CrossRef] [Green Version]
  8. Usman, M.U.; Kumar, P. Factors Influencing Consumer Intention to Shop Online in Nigeria: A Conceptual Study. Vision J. Bus. Perspect. 2020. [Google Scholar] [CrossRef]
  9. Timmers, P. Business Models for Electronic Markets. Electron. Mark. 1998, 8, 3–8. [Google Scholar] [CrossRef]
  10. Swilley, E. Mobile Commerce: How It Contrasts, Challenges, and Enhances Electronic Commerce; Business Expert Press: New York, NY, USA, 2015. [Google Scholar]
  11. Thongpapanl, N.T.; Ashraf, A.R.; Lapa, L.; Venkatesh, V. Differential Effects of Customers’ Regulatory Fit on Trust, Perceived Value, and m-commerce Use among Developing and Developed Countries. J. Int. Mark. 2018, 26, 22–44. [Google Scholar] [CrossRef]
  12. Gregori, P.; Holzmann, P. Digital sustainable entrepreneurship: A business model perspective on embedding digital technologies for social and environmental value creation. J. Clean. Prod. 2020, 272, 122817. [Google Scholar] [CrossRef]
  13. Horváth, D.; Szabó, R.Z. Driving forces and barriers of Industry 4.0: Do multinational and small and medium-sized companies have equal opportunities? Technol. Forecast. Soc. Chang. 2019, 146, 119–132. [Google Scholar] [CrossRef]
  14. Masood, T.; Sonntag, P. Industry 4.0: Adoption challenges and benefits for SMEs. Comput. Ind. 2020, 121, 103261. [Google Scholar] [CrossRef]
  15. Zhu, J.; Goraya, M.A.S.; Cai, Y. Retailer–Consumer Sustainable Business Environment: How Consumers’ Perceived Benefits Are Translated by the Addition of New Retail Channels. Sustainability 2018, 10, 2959. [Google Scholar] [CrossRef] [Green Version]
  16. Laurischkat, K.; Viertelhausen, A. Business Model Gaming: A Game-Based Methodology for E-Mobility Business Model Innovation. Procedia CIRP 2017, 64, 115–120. [Google Scholar] [CrossRef]
  17. Bilińska-Reformat, K.; Kucharska, B.; Twardzik, M.; Dolega, L. Sustainable development concept and creation of innovative business models by retail chains. Int. J. Retail. Distrib. Manag. 2019, 47, 2–18. [Google Scholar] [CrossRef]
  18. Lüdeke-Freund, F.; Carroux, S.; Joyce, A.; Massa, L.; Breuer, H. The sustainable business model pattern taxonomy—45 patterns to support sustainability-oriented business model innovation. Sustain. Prod. Consum. 2018, 15, 145–162. [Google Scholar] [CrossRef]
  19. Nosratabadi, S.; Mosavi, A.; Shamshirband, S.; Zavadskas, E.K.; Rakotonirainy, A.; Chau, K.W. Sustainable Business Models: A Review. Sustainability 2019, 11, 1663. [Google Scholar] [CrossRef] [Green Version]
  20. European Commission. Sustainable Development Goals. Available online: https://ec.europa.eu/international-partnerships/sustainable-development-goals_en (accessed on 28 January 2021).
  21. Comisia Europeană. UE și Piața Unică Digitală. 2017. Available online: https://publication.europa.eu/webpub/com/factsheets/digital/ro/ (accessed on 25 February 2021).
  22. United Nations. Department of Economic and Social Affairs. Sustainable Development Goals. 2015. Available online: https://sdgs.un.org/goals (accessed on 9 June 2021).
  23. Butcher, M. 8 Investors Tell Us the Story behind The Romanian Startup Boom. 2021. Available online: https://techcrunch.com (accessed on 9 June 2021).
  24. The Economist. The Robots Are Coming. UiPath Is Europe’s Most Successful Tech Export since Spotify. Available online: https://www.economist.com/business/2021/04/22/uipath-is-europes-most-successful-tech-export-since-spotify (accessed on 28 April 2021).
  25. Sharma, R.; Jha, M. Values influencing sustainable consumption behaviour: Exploring the contextual relationship. J. Bus. Res. 2017, 76, 77–88. [Google Scholar] [CrossRef]
  26. European Commission. Sustainable Development. Available online: https://ec.europa.eu/regional_policy/en/policy/what/glossary/s/sustainable-development (accessed on 25 February 2021).
  27. Guillen-Royo, M. Sustainable consumption and wellbeing: Does on-line shopping matter? J. Clean. Prod. 2019, 229, 1112–1124. [Google Scholar] [CrossRef]
  28. Collins. Available online: https://www.collinsdictionary.com/dictionary/english/e-tailer (accessed on 24 May 2021).
  29. Cambridge Dictionary. Available online: https://dictionary.cambridge.org/dictionary/english/e-tailer (accessed on 24 May 2021).
  30. Rappa, M. Business Models on The Web. 2010. Available online: http://digitalenterprise.org/models/models.html (accessed on 15 March 2021).
  31. Turban, E.; Outland, J.; King, D.; Lee, J.K.; Liang, T.P.; Turban, D.C. Electronic Commerce 2018: A Managerial and Social Networks Perspective; Springer: Berlin/Heidelberg, Germany, 2017. [Google Scholar]
  32. Aithal, P.S. A Review on Various E-Business and M-Business Models & Research Opportunities. Int. J. Manag. IT Eng. 2016, 6, 275–298. [Google Scholar]
  33. Becerril-Arreola, R.; Leng, M.; Parlar, M. Online retailers’ promotional pricing, free-shipping threshold, and inventory decisions: A simulation-based analysis. Eur. J. Oper. Res. 2013, 230, 272–283. [Google Scholar] [CrossRef] [Green Version]
  34. Osterwalder, A.; Pigneur, Y. Business Model Generation; John Wiley & Sons: Hoboken, NJ, USA, 2010. [Google Scholar]
  35. Ijaz, M.F.; Rhee, J. Constituents and Consequences of Online-Shopping in Sustainable E-Business: An Experimental Study of Online-Shopping Malls. Sustainability 2018, 10, 3756. [Google Scholar] [CrossRef] [Green Version]
  36. Li, X.; Zhao, X.; Xu, W.A.; Pu, W. Measuring ease of use of mobile applications in e-commerce retailing from the perspective of consumer online shopping behaviour patterns. J. Retail. Consum. Serv. 2020, 55, 102093. [Google Scholar] [CrossRef]
  37. Ahmad, Z.; Ibrahim, R. Mobile Commerce (m-commerce) Interface Design: A Review of Literature. IOSR J. Comput. Eng. 2017, 19, 66–70. [Google Scholar] [CrossRef]
  38. Fernández Sanz, L.; Gómez Pérez, J.; Misra, S. Analysis of Mobile Commerce in the SMEs of the European Union. Tehnički Vjesnik 2020, 27, 2062–2071. [Google Scholar] [CrossRef]
  39. Tang, A.K. A systematic literature review and analysis on mobile apps in m-commerce: Implications for future research. Electron. Commer. Res. Appl. 2019, 37, 100885. [Google Scholar] [CrossRef]
  40. Gupta, P.; Singh, S.; Ranjan, R.; Kharayat, G.; Raman, S.; Balaji, V. Analysis of Delivery Issues that Customer Face upon E-Commerce Shopping. Int. J. Manag. Stud. 2019, VI, 14. [Google Scholar] [CrossRef]
  41. Sinha, S.N.; Tanty, G. E-Commerce Adaptability with Reference to Delivery of Products—Palarch’s. J. Archaeol. Egypt Egyptol. 2020, 17, 123–130. [Google Scholar]
  42. Nguyen, D.H.; De Leeuw, S.; Dullaert, W.; Foubert, B.P.J. What Is the Right Delivery Option for You? Consumer Preferences for Delivery Attributes in Online Retailing. J. Bus. Logist. 2019, 40, 299–321. [Google Scholar] [CrossRef] [Green Version]
  43. Zumstein, D. Success Factors of E-Commerce—Drivers of The Conversion Rate and Basket Value. In Proceedings of the 18th International Conference on E-Society, Sofia, Bulgaria, 2–4 April 2020; pp. 43–50. [Google Scholar]
  44. Huang, W.-H.; Shen, G.C.; Liang, C.-L. The effect of threshold free shipping policies on online shoppers’ willingness to pay for shipping. J. Retail. Consum. Serv. 2019, 48, 105–112. [Google Scholar] [CrossRef]
  45. Wang, L.; Bae, S. How to avoid the free shipping pitfall? Changing consumer attitudes from the perspective of information interaction. Electron. Commer. Res. Appl. 2020, 42, 100996. [Google Scholar] [CrossRef]
  46. Zhang, Q.; Zhang, D.; Segerstedt, A.; Luo, J. Optimal ordering and pricing decisions for a company issuing product-specific gift cards. Omega 2018, 74, 92–102. [Google Scholar] [CrossRef]
  47. Zhou, Y.; Zhang, Y. Optimal strategy for e-tailer issuing diamond card considering shipping policy. Comput. Ind. Eng. 2020, 150, 106877. [Google Scholar] [CrossRef]
  48. Huang, W.-H.; Cheng, Y.-C. Threshold free shipping policies for internet shoppers. Transp. Res. Part A: Policy Pr. 2015, 82, 193–203. [Google Scholar] [CrossRef]
  49. Lu, T.; Lu, X.; Dou, Y. The Little Bid More, The Merrier? Quantify the Effects of Filler-Item Recommendations in Contingent-Free Shipping. SSRN 2021. [Google Scholar] [CrossRef]
  50. Mao, M.; Wu, Z.; Li, L.; Li, Z. Home Delivery Distance and Free Shipping Policy for Fresh Food Considering the Loss. In ICTE 2019; American Society of Civil Engineers (ASCE): Reston, VA, USA, 2020; pp. 771–779. [Google Scholar]
  51. Chang, S.; Dong, Y.; Wang, X. Optimal shipping policy in retail competition and its effect on customers. Electron. Commer. Res. Appl. 2021, 45, 101020. [Google Scholar] [CrossRef]
  52. Wirtz, B.W.; Schilke, O.; Ullrich, S. Strategic Development of Business Models. Long Range Plan. 2010, 43, 272–290. [Google Scholar] [CrossRef]
  53. Mohapatra, S. E-Commerce Strategy; Springer: Berlin/Heidelberg, Germany, 2013; pp. 155–171. [Google Scholar]
  54. Laudon, K.C.; Traver, C.G. E-Commerce: Business, Technology, Society, 12th ed.; Pearson Education: Harlow, UK, 2016. [Google Scholar]
  55. Statista Analyst Opinion 2020. Available online: https://www.statista.com/outlook/dmo/ecommerce/eastern-europe (accessed on 15 March 2021).
  56. Keenan, M. Global Ecommerce Explained: Stats and Trends to Watch in 2021. Available online: https://www.shopify.com/enterprise/global-ecommerce-statistics#3 (accessed on 24 May 2021).
  57. Statista. Digital Market Outlook: Retail E-Commerce Sales CAGR in Selected Markets 2021–2025. Available online: https://www.statista.com/forecasts/220177/b2c-e-commerce-sales-cagr-forecast-for-selected-countries (accessed on 24 May 2021).
  58. Kemp, S. Digital 2019. Global Digital Yearbook. Available online: https://datareportal.com/reports/digital-2019-global-digital-overview (accessed on 24 May 2021).
  59. Kemp, S. Digital 2021. Global Digital Yearbook. Available online: https://datareportal.com/reports/digital-2021-global-overview-report (accessed on 24 May 2021).
  60. GSMA. Connected Society. Mobile Connectivity Index Methodology 2020. Available online: https://www.gsma.com/r/wp-content/uploads/2020/09/GSMA-Mobile-Connectivity-Index-Methodology-2020.pdf (accessed on 25 March 2021).
  61. Kemp, S. Digital 2021: Romania. Available online: https://datareportal.com/reports/digital-2021-romania (accessed on 25 March 2021).
  62. GSMA. GSMA Mobile Connectivity Index. Available online: https://www.mobileconnectivityindex.com/ (accessed on 25 March 2021).
  63. International Telecommunication Union. Measuring Digital Development: Facts and Figures 2020. Available online: https://www.itu.int/en/ITU-D/Statistics/Pages/stat/default.aspx (accessed on 28 March 2021).
  64. Eurostat. Internet Use: Finding Information about Goods and Services 2020. Available online: https://ec.europa.eu/eurostat/databrowser/view/ISOC_CI_AC_I__custom_753486/default/table?lang=en (accessed on 29 March 2021).
  65. European Commission. DESI—Compare Countries Progress 2020. Available online: https://digital-agenda-data.eu/charts/desi-see-the-evolution-of-two-indicators-and-compare-countries#chart={%22indicator%22:%22desi_1c_mbb%22,%22breakdown%22:%22desi_1c2_mbbtu%22,%22unit-measure%22:%22egov_score%22,%22ref-area%22:[%22RO%22]} (accessed on 26 March 2021).
  66. Huawei. Global Connectivity Index 2020. Romania. Available online: https://www.huawei.com/minisite/gci/en/country-profile-ro.html (accessed on 27 March 2021).
  67. The Intelligent Economist Unit. The Inclusive Internet Index 2020. Available online: https://theinclusiveinternet.eiu.com/explore/countries/RO/ (accessed on 29 March 2021).
  68. EcommerceDB. E-Commerce Market Analysis. The E-Commerce Market in Romania. Available online: https://ecommercedb.com/en/markets/ro/all (accessed on 27 March 2021).
  69. GPeC. Romanian E-Commerce 2020 Report. Available online: https://www.gpec.ro/blog/en/gpec-romanian-e-commerce-2020-report-5-6-billion-euro-worth-of-online-shopping-a-30-yoy-growth (accessed on 26 March 2021).
  70. Statista. E-Commerce Romania. Statista Market Forecast 2020. Available online: https://www.statista.com/outlook/dmo/ecommerce/romania?currency=EUR (accessed on 28 March 2021).
  71. The Nielsen Company—Connected Commerce. 2018. Available online: https://www.nielsen.com/wp-content/uploads/sites/3/2019/04/connected-commerce-report-1.pdf (accessed on 24 May 2021).
  72. Optinmonster. Conversion Rate Optimization Blog. Available online: https://optinmonster.com/online-shopping-statistics/ (accessed on 24 May 2021).
  73. Mali, N. Your M-Commerce Deep Dive: Data, Trends and What’s Next in the Mobile Retail Revenue World. Available online: https://www.bigcommerce.com/blog/mobile-commerce/#understanding-mobile-payment-options (accessed on 24 May 2021).
  74. UNCTAD. Covid-19 and E-Commerce. Findings from a Survey of Online Consumers in 9 Countries. Available online: https://unctad.org/system/files/official-document/dtlstictinf2020d1_en.pdf (accessed on 24 May 2021).
  75. Eurostat. Internet Purchases by Individuals. 2020. Available online: https://ec.europa.eu/eurostat/databrowser/view/isoc_ec_ibuy/default/table?lang=en (accessed on 27 March 2021).
  76. Lup, P.S.; Negrea, R.; Proștean, G. Testing the trust dimensions of Romanian consumers in e-commerce for electronic and household appliances. Acta Tech. Napoc. Ser. Appl. Math. Mech. Eng. 2021, 64, 265–274. [Google Scholar]
  77. European Central Bank. ECB Payments Statistics, April 2020. Available online: https://sdw.ecb.europa.eu/reports.do?node=1000001387 (accessed on 26 March 2021).
  78. National Bank of Romania. Interactive Database. Payment Statistics 2021. Available online: https://www.bnr.ro/Interactive-database-1107.aspx (accessed on 25 March 2021).
  79. Platon, O.E. The Evolution of E-Commerce in Romania. Chall. Knowl. Soc. 2017, pp. 775–779. Available online: https://www.proquest.com/docview/1973330847?pq-origsite=gscholar&fromopenview=true (accessed on 26 March 2021).
  80. Romania Journal.ro. E-Commerce Trends in Romania 2021. Available online: https://www.romaniajournal.ro/business/e-commerce-trends-in-romania-in-2021/ (accessed on 28 March 2021).
  81. Start-Up.ro. Studiu VTEX România: Tendințe în Comerțul Online Românesc în 2021. Available online: https://start-up.ro/studiu-vtex-romania-tendinte-in-comertul-online-romanesc-in-2021/ (accessed on 28 March 2021).
  82. Lewis, M.; Singh, V.; Fay, S. An Empirical Study of the Impact of Nonlinear Shipping and Handling Fees onPurchase Incidence and Expenditure Decisions. Mark. Sci. 2006, 25, 51–64. [Google Scholar] [CrossRef] [Green Version]
  83. Lewis, M. The effect of shipping fees on customer acquisition, customer retention, and purchase quantities. J. Retail. 2006, 82, 13–23. [Google Scholar] [CrossRef]
  84. Păun Ghe. An Impossibility Theorem for Indicators Aggregation. Fuzzy Sets Syst. 1983, 9, 205–210. [Google Scholar] [CrossRef]
  85. Yu, S.M.; Du, Z.J.; Wang, J.Q.; Luo, H.Y.; Lin, X.D. Trust and behavior analysis-based fusion method for heterogeneous multiple attribute group decision-making. Comput. Ind. Eng. 2021, 152, 106992. [Google Scholar] [CrossRef]
  86. Siqi, W.; Meng, W.; Yucheng, D.; Haiming, L.; Sihai, Z. The 2-rank additive model with axiomatic design in multiple attribute decision making. Eur. J. Oper. Res. 2020, 287, 536–545. [Google Scholar] [CrossRef]
  87. Bingzhen, S.; Weimin, M.; Xiangtang, C. Variable precision multigranulation rough fuzzy set approach to multiple attribute group decision-making based on λ-similarity relation. Comput. Ind. Eng. 2019, 127, 326–343. [Google Scholar] [CrossRef]
  88. Hwang, C.L.; Yoon, K. Multiple Attribute Decision Making: Methods and Applications; Springer: New York, NY, USA, 1981. [Google Scholar] [CrossRef]
  89. Mihoc, G.; Craiu, V. Tratat de Statistică Matematică, Vol. IV, Corelație și Regresie Liniară; Editura Academiei Române: Bucharest, Romania, 1981; pp. 89–93. [Google Scholar]
  90. Duan, J.; Zhang, C.; Gong, Y.; Brown, S.; Li, Z. A Content-Analysis Based Literature Review in Blockchain Adoption within Food Supply Chain. Int. J. Environ. Res. Public Health 2020, 17, 1784. [Google Scholar] [CrossRef] [PubMed] [Green Version]
  91. Saaty, T.L. How to make a decision: The analytic hierarchy process. Eur. J. Oper. Res. 1990, 48, 9–26. [Google Scholar] [CrossRef]
  92. Saaty, T.L. Analytic Heirarchy Process; Wiley: New York, NY, USA, 2014. [Google Scholar]
  93. Leccese, F.; Salvadori, G.; Rocca, M.; Buratti, C.; Belloni, E. A method to assess lighting quality in educational rooms using analytic hierarchy process. Build Environ. 2020, 168, 106501. [Google Scholar] [CrossRef]
  94. Gündoğdu, F.K.; Duleba, S.; Moslem, S.; Aydın, S. Evaluating public transport service quality using picture fuzzy analytic hierarchy process and linear assignment model. Appl. Soft. Comput. 2021, 100, 106920. [Google Scholar] [CrossRef]
  95. Abrahamsen, E.B.; Milazzo, M.F.; Selvik, J.T.; Asche, F.; Abrahamsen, H.B. Prioritising investments in safety measures in the chemical industry by using the Analytic Hierarchy Process. Reliab. Eng. Syst. Safe 2020, 198, 106811. [Google Scholar] [CrossRef]
  96. Trusted.ro. Programul National pentru Certificarea Magazinelor Online (National Program for the Certification of Online Stores). Available online: https://trusted.ro/magazine-atestate/ (accessed on 28 January 2021).
  97. Chatzopoulos, C.G.; Weber, C. Challenges of Total Customer Experience (TCX): Measurement beyond Touchpoints. IJIEM 2018, 9, 187–196. [Google Scholar] [CrossRef]
  98. Mobile-Friendly Test—Google Search Console. Available online: https://search.google.com/test/mobile-friendly (accessed on 28 January 2021).
  99. Content Analysis. Available online: https://bit.ly/3vogWnw (accessed on 9 June 2021).
  100. Wood, S.N. Generalized Additive Models. An Introduction with R. Texts in Statistical Science, 2nd ed.; CRC Press: Boca Raton, FL, USA, 2017. [Google Scholar]
  101. Wood, N.; Pya, N.; Säfken, B. Smoothing Parameter and Model Selection for General Smooth Models. J. Am. Stat. Assoc. 2016, 111, 1548–1563. [Google Scholar] [CrossRef]
  102. Chen, X.; Wang, Q. Variable selection in the additive rate model for recurrent event data. Comput. Stat. Data Anal. 2013, 57, 491–503. [Google Scholar] [CrossRef]
  103. Jie, W.; Gui-wu, W.; Cun, W.; Jiang, W. Maximizing deviation method for multiple attribute decision making under q-rung orthopair fuzzy environment. Def. Technol. 2020, 16, 1073–1087. [Google Scholar] [CrossRef]
  104. Huchang, L.; Cheng, Z.; Li, L. A multiple attribute group decision making method based on two novel intuitionistic multiplicative distance measures. Inf. Sci. 2018, 467, 766–783. [Google Scholar] [CrossRef]
  105. Bank, L.; Skalare, L.; Widerberg, M. Creating Memorable Customer Experience: The Case for Vintage E-Tailers of Apparel and Fashion Pieces. 2020. Available online: https://www.diva-portal.org/smash/record.jsf?pid=diva2%3A1449412&dswid=-1149 (accessed on 24 May 2021).
  106. Barta, S.; Flavian, C.; Gurrea, R. Managing consumer experience and online flow: Differences in handheld devices vs PCs. Technol. Soc. 2021, 64, 101525. [Google Scholar] [CrossRef]
  107. Kemppainen, T.; Makkonen, M.; Frank, L. Customer Experience Formation in Online Shopping: Investigating the Causes of Positive and Negative Emotions During a Visit to an Online Store. In Digital Transformation and Human Behavior; Springer: Berlin/Heidelberg, Germany, 2021; Volume 37, pp. 173–190. [Google Scholar] [CrossRef]
  108. Pizzi, S.; Corbo, L.; Caputo, A. Fintech and SMEs sustainable business models: Reflections and considerations for a circular economy. J. Clean. Prod. 2021, 281, 125217. [Google Scholar] [CrossRef]
  109. Bouwman, H.; Nikou, S.; de Reuver, M. Digitalization, business models, and SMEs: How do business model innovation practices improve performance of digitalizing SMEs? Telecommun Policy 2019, 43, 101828. [Google Scholar] [CrossRef]
  110. Paiola, M. Digitalization and servitization: Opportunities and challenges for Italian SMES. Sinergie Ital. J. Manag. 2018, 36, 11–22. [Google Scholar]
Figure 1. M-commerce transactions. Source: Authors’ conceptualisation.
Sustainability 13 06845 g001
Figure 2. M-commerce webstore Business Model Canvas. Source: Authors’ adaptation after [34].
Sustainability 13 06845 g002
Figure 3. Individuals who purchased online in the last 3 months. Source: Eurostat [75].
Sustainability 13 06845 g003
Figure 4. The research framework.
Sustainability 13 06845 g004
Figure 5. The comparative analysis generated after Mobile-Friendly Test: (a) desktop site and (b) mobile site.
Sustainability 13 06845 g005
Figure 6. The sustainable retailer—AHP.
Sustainability 13 06845 g006
Figure 7. The customer journey.
Sustainability 13 06845 g007
Figure 8. The decision.
Sustainability 13 06845 g008
Figure 9. The criteria importance.
Sustainability 13 06845 g009
Figure 10. Alternatives ranking with touchpoints structure.
Sustainability 13 06845 g010
Figure 11. The sustainable retailer model.
Sustainability 13 06845 g011
Table 1. Mobile market characteristics in Romania (2017–2021).
20172018201920202021
Percentage of adult population using smartphones (%) [61]5360608097
Mobile cell subscription per 100 inhabitants [63]113.97116.04117.07--
Percentage of population using the Internet for finding information about goods and services (%) [64]31413346-
Average internet speed connection via mobile connections (MB/sec) [61]10.9528.6532.1337.8945.93
GSMA overall country mobile connectivity index (out of 100) [62]70.3270.2972.4573.8172.45
DESI Index Mobile broadband take-up [65]6.638.208.658.74-
Huawei Global Connectivity Index (out of 120) [66]45474950-
Table 2. E-commerce spending by category in Romania (mil. USD).
Travel, Mobility and AccommodationFashion and BeautyElectronics and Physical MediaFood and Personal CareFurniture and AppliancesToys, DIY, HobbiesDigital MusicVideo Games
January 20191360.0538.0788.0206.0414.0567.020.054.0
January 20211587.0942.6606.9333.1206.5270.824.2167.5
Growth rate16.69%75.20%−22.98%61.70%−50.12%−52.24%21.15%210.19%
Source: [61].
Table 3. Card payment dynamic.
201520162017201820192020
Total card payments (mil. EUR; total for the period)RO276.6350.11460.9634.8842.2-
EU55.704.462.193.869.013.777.689.086.691.0-
Number of cards (with a payment function) issued by resident PSPs (thousands; end of period)RO14,872.915,899.816,394.517.409.918.198.418,806.6
EU783.662.0797.188.8-829.873.5863.086.9-
Table 4. The elements of the behavioural model.
No.Description
1.Home page optimisation on the mobile device
2.Display the minimum amount for free shipping in the visible area of the mobile home page.
3.Identify the area where the link to the delivery policy page is placed
Table 5. The variants categories.
CategoryNo. of Websites
Food and beverages13
Other13
Sporting goods, leisure and entertainment6
Cars, motorcycles and equipment17
Babies, children, toys14
Gifts, jewellery, flowers18
House and garden27
IT&C, electronics and home appliances16
Health and beauty28
Table 6. The fundamental scale.
DescriptionNumerical ValueExplanation
Equally liked1Two elements contribute equally to the goal
2
Moderately preferred3Experience and judgment moderately favour one element over another
4
Strongly preferred5Experience and judgment strongly favour one element over another
6
Very strongly preferred7One element is favoured very strongly over another, its dominance is demonstrated in practice
8
Extremely preferred9The evidence favouring one element over another is of the highest possible order affirmation
Table 7. The additive function for health and beauty category.
E-Tailer’s SiteMobile Optimisation
(Yes/No)
Delivery Policy Displaying
(Yes/No)
Free Shipping Information (First Mobile Page)
(Yes/No)
Shopping Cart Value for Free Shipping
(Yes/No)
V1V2V3V4AF
life-care.comYesYesYes1201110.523.52
putereaplantelor.roYesYesYes1491110.403.40
bioki.roYesYesYes1501110.403.40
paradisulverde.comYesYesYes1501110.403.40
lentiamo.roYesNoYes01011.003.00
aromateca.roYesNoYes1991010.202.20
importdirect.roYesNoYes2001010.202.20
brillbird.roYesNoYes2501010.002.00
farmacialapretmic.roYesYesNo-1100.002.00
gerocossen.roYesYesNo-1100.002.00
nailshop.roYesYesNo-1100.002.00
pfarma.roYesYesNo-1100.002.00
pilulka.roYesYesNo-1100.002.00
remediumfarm.roYesYesNo-1100.002.00
sabiocosmetics.roYesYesNo-1100.002.00
baff.roYesNoNo-1000.001.00
dezinfecteaza.comYesNoNo-1000.001.00
eubiotic.roYesNoNo-1000.001.00
faunusplant.roYesNoNo-1000.001.00
getnails.roYesNoNo-1000.001.00
inamedicalsport.roYesNoNo-1000.001.00
lensa.roYesNoNo-1000.001.00
secom.roYesNoNo-1000.001.00
sephora.roYesNoNo-1000.001.00
xpertbeauty.roYesNoNo-1000.001.00
cupio.roNo YesYes25000.800.000.80
mattca.roNoNoNo-0000.000.00
skinshop.roNoNoNo-0000.000.00
Table 8. TOPSIS ranking.
E-Tailer’s Site V 1 V 2 V 3 V 4 The Ideal Positive DistanceThe Ideal Negative DistanceRelative DistanceTOPSIS Ranking
life-care.com1110.520.481.810.791
putereaplantelor.ro1110.400.601.780.752
bioki.ro1110.400.601.780.753
paradisulverde.com1110.400.601.780.754
lentiamo.ro1011.001.001.730.635
aromateca.ro1010.201.281.430.536
importdirect.ro1010.201.281.430.537
brillbird.ro1010.001.411.410.508
farmacialapretmic.ro1100.001.411.410.509
gerocossen.ro1100.001.411.410.5010
nailshop.ro1100.001.411.410.5011
pfarma.ro1100.001.411.410.5012
pilulka.ro1100.001.411.410.5013
remediumfarm.ro1100.001.411.410.5014
sabiocosmetics.ro1100.001.411.410.5015
baff.ro1000.001.731.000.3716
dezinfecteaza.com1000.001.731.000.3717
eubiotic.ro1000.001.731.000.3718
faunusplant.ro1000.001.731.000.3719
getnails.ro1000.001.731.000.3720
inamedicalsport.ro1000.001.731.000.3721
lensa.ro1000.001.731.000.3722
secom.ro1000.001.731.000.3723
sephora.ro1000.001.731.000.3724
xpertbeauty.ro1000.001.731.000.3725
cupio.ro00.800.001.740.800.3126
mattca.ro0000.002.000.000.0027
skinshop.ro0000.002.000.000.0028
Table 9. The e-tailer categories.
E-Tailer CategoryTouchpointsCustomer JourneyDescriptionRetailers
AT1 + T2 + T3 + T4 Sustainability 13 06845 i001
Sustainability 13 06845 i010
Mobile device-optimised site
Sustainability 13 06845 i010
Delivery condition displayed in the home page’s visible area
Sustainability 13 06845 i010
Displays the minimum amount/geographical area
Sustainability 13 06845 i010
Displays a dedicated link to the delivery policy’s page
32
BT1 + T2 + T3 Sustainability 13 06845 i002
Sustainability 13 06845 i010
Mobile device-optimised site
Sustainability 13 06845 i010
Delivery condition displayed in the home page’s visible area
Sustainability 13 06845 i010
Displays the minimum amount/geographical area
28
CT1 + T2 + T4 Sustainability 13 06845 i003
Sustainability 13 06845 i010
Mobile-optimised site
Sustainability 13 06845 i010
Delivery condition displayed in the home page’s visible area
Sustainability 13 06845 i010
Displays a dedicated link to the delivery policy’s page
3
DT2 + T3 + T4 Sustainability 13 06845 i004
Sustainability 13 06845 i010
Delivery condition displayed in the home page’s visible area
Sustainability 13 06845 i010
Displays the minimum amount/geographical area
Sustainability 13 06845 i010
Displays a dedicated link to the delivery policy’s page
1
ET1 + T2 Sustainability 13 06845 i005
Sustainability 13 06845 i010
Mobile device-optimised site
Sustainability 13 06845 i010
Delivery condition displayed in the home page’s visible area
3
FT1 + T4 Sustainability 13 06845 i006
Sustainability 13 06845 i010
Mobile device-optimised site
Sustainability 13 06845 i010
Displays a dedicated link to the delivery policy’s page
53
GT2 + T3 Sustainability 13 06845 i007
Sustainability 13 06845 i010
Delivery condition displayed in the home page’s visible area
Sustainability 13 06845 i010
Displays the minimum amount/geographical area
2
HT1 Sustainability 13 06845 i008
Sustainability 13 06845 i010
Mobile device-optimised site
73
IT4 Sustainability 13 06845 i009
Sustainability 13 06845 i010
Displays a dedicated link to the delivery policy’s page
2
Table 10. The comparison matrix.
Touchpoint 1ABCDEFGHI
A111711819
B111611718
C111411516
D1/71/61/411/51/431/42
E111511517
F111411715
G1/81/71/51/31/51/711/55
H111411519
I1/91/81/61/21/71/51/51/91
Table 11. The comparison results.
Alternative Rankings with StructureTouchpoint 1Touchpoint 2Touchpoint 3Touchpoint 4Results
A0.11310.03610.02000.00570.1748
B0.10690.03420.01790.00220.1612
C0.09450.03340.00860.00520.1417
D0.02530.03160.01710.00520.0792
E0.09850.02980.00510.00110.1345
F0.09750.00700.00350.00500.1130
G0.02050.02680.01640.00080.0645
H0.09840.00570.00250.00050.1071
I0.01230.00430.00170.00570.0239
Publisher’s Note: MDPI stays neutral with regard to jurisdictional claims in published maps and institutional affiliations.

