Abstract
Since entering the industrialized era, China’s greenhouse gas emissions and air pollutant emissions have increased rapidly. China is the country with the most greenhouse gas emissions, and it is also facing serious local air pollution problems. China’s industrial sector is the largest contributor to CO2 and air pollutants. The resulting climate change and air pollution issues have caused China to face double pressures. This article uses the CO2 and comprehensive air pollutant emission data of China’s industrial sector as a starting point and uses econometric research methods to explore the synergy between China’s industrial carbon emission reduction and industrial comprehensive air pollutant emission reduction. The synergistic effect between industrial carbon emissions and industrial comprehensive air pollutant emissions has been quantified, and the transmission path of the synergistic effect has been explored. The empirical results show that there are benefits of synergistic governance between climate change and air pollution in China’s industrial sector. Every 1000 tons of carbon reduction in the industrial sector will result in 1 ton of comprehensive air pollutant reduction. The increase in R&D expenditure in the energy and power sector can significantly promote the reduction of air pollutants in the industrial sector. Increasing the intensity of environmental regulations is the main expansion path for synergy. However, in eastern, central, and western China, the synergy is not the same. Therefore, it is necessary to formulate regionally differentiated emission reduction policies. The research conclusions of this article can provide policy references for the coordinated governance of climate change and air pollution in China.
1. Introduction
Since entering the industrial era, global greenhouse gas emissions have increased rapidly, and China is the country with the most greenhouse gas emissions in the world [1]. Excessive emissions of greenhouse gases (mainly CO2) lead to climate change problems, and greenhouse gas emissions are one of the main problems in developing and emerging countries [2]. The distribution of China’s carbon emissions in 2014 is shown in Figure 1. To this end, countries signed the Paris Climate Agreement in 2016. In addition, at the Climate Ambition Summit in December 2020, Chinese President Xi Jinping pledged to strive for the peak carbon dioxide emissions by 2030 and strive to achieve carbon neutrality by 2060.
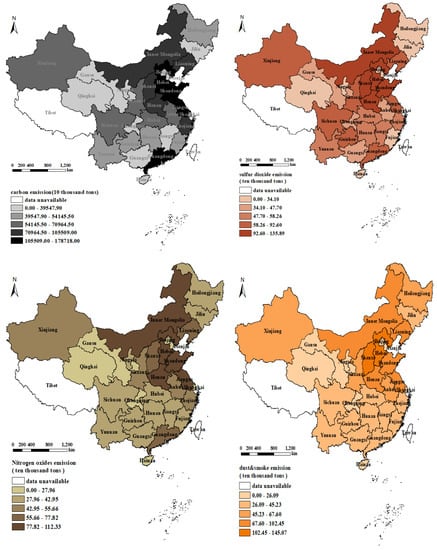
Figure 1.
China’s carbon dioxide, sulfur dioxide, nitrogen oxides, smoke and dust emissions distribution map in 2014.
At the same time, China is also facing serious local air pollution problems [3]. China has become the country with the largest SO2 emissions in the world [4]. China’s NOx and DS emissions are also very serious. The distribution of sulfur dioxide, nitrogen oxides, and smoke and dust emissions in China in 2014 is shown in Figure 1. SO2, NOx, and DS cause air pollution problems such as acid rain and smog, which have caused great troubles to China’s economic development.
The country with the most serious losses due to air pollution is China. In 2018, China’s losses were 6.6% of its GDP [5]. An important cause of air pollution in China is the burning of coal. China is currently the world’s largest coal consumer. Since 2011, China’s coal consumption has accounted for about 50% of the global total [6]. Coal still accounted for 59% of China’s energy structure until 2018 [7]. Considering that when fossil fuels (especially coal) are burned, regional air pollution and greenhouse gas emissions are always co-produced, so there must be potential common interests [8].
Climate change and air pollution issues, especially in developing countries, are two major challenges that have attracted global attention [3]. As the largest developing country, China is facing this huge challenge. The problem of climate change and air pollution come together, so the solution should also be coordinated governance. The emissions of SO2, NOx, and CO2 are inherent results of fossil fuel combustion, which provides a potential synergistic effect of controlling greenhouse gas and air pollutant emissions at the same time [9]. However, in actual operation, the complementarity of controlling air pollution and climate change are often overlooked. The response to climate change and environmental pollution control are managed separately by the National Development and Reform Commission (NDRC) and the Environmental Protection Department in China, and the control of both has been artificially separated.
Therefore, we need to use quantitative empirical methods to prove the existence of synergistic emission reduction effect and measure it. The benefits of coordinated emission reduction are divided into two aspects. On the one hand, the synergistic effect of air pollutant emission reduction brought about by greenhouse gas emission reduction, and the other is the greenhouse gas emission reduction effect brought about by air pollutant emission reduction. Since the reduction of air pollution brought about by greenhouse gas reduction has stronger practical significance, this article mainly focuses on the former.
On the one hand, China’s industrial sector is the main source of carbon dioxide emissions. In 2016, China’s industrial sector accounted for 68.44% of China’s carbon dioxide emissions [10]. On the other hand, China’s industrial sector is also the main source of air pollutants [11]. In 2015, industrial SO2, NOx and smoke (dust) emissions accounted for 83.73%, 63.80% and 80.14% of the national emissions respectively [12]. Therefore, the industrial sector is the source of climate change and air pollution in China. What kind of policy combination the industrial sector implements can most effectively realize the coordinated governance of climate change and air pollution in China is of vital importance to policy makers, and this is also the focus of this article. Therefore, this article takes China’s industry as a research case, from the perspective of collaborative control. Taking the coordinated emission reduction effect of comprehensive air pollutants caused by China’s industrial carbon emission reduction as the starting point, using China’s inter-provincial panel data over the years, empirical methods are used to quantify the industrial air pollutant emission reduction benefits brought about by industrial carbon emission reduction.
In addition, this article also demonstrates the possible transmission path of the synergistic control effect. The empirical results show that there is a synergistic treatment benefit between climate change and air pollution in China’s industrial sector. Every 1000 tons of carbon reduction in the industrial sector will result in 1 ton of air pollutant reduction. The increase in R&D expenditure in the energy and power sector can significantly promote the reduction of air pollutants in the industrial sector. Environmental regulations can promote synergistic emission reduction effects, while R&D expenditures in the energy and power sector and the increase in clean energy in the energy structure will weaken the synergy emission reduction effect. It will be better if R&D funds are directly invested in air pollutant reduction activities. However, in eastern, central, and western China, the synergy between industrial carbon emission reduction and air pollutant emission reduction is not the same. Therefore, it is necessary to formulate regionally differentiated emission reduction policies.
The main innovations of this paper are as follows: (1) This paper uses an econometric model to quantitatively calculate the emission reduction of air pollutants caused by China’s industrial carbon emission reduction, and uses empirical methods to measure the synergistic control effect of climate change and air pollution. (2) This article integrates the indicators for measuring comprehensive air pollution, and incorporates the three air pollutants SO2, NOx, and DS into a unified framework. In this way, an objective and comprehensive evaluation of the effects of air pollution reduction has been achieved. (3) This article explores several ways of coordinated control of climate change and air pollution and provides an important reference for policy making.
The structure of this paper is as follows: First, it explains the challenges China faces in the coordinated governance of climate change and air pollution. Secondly, it reviewed the relevant literature on the coordinated governance of climate change and air pollution. Thirdly, a modeling method and strategic plan are proposed. Fourth, results and discussion. Finally, in Section 5, conclusions and policy implications are drawn.
2. Literature Review
In recent decades, China has faced the dual pressures of increasingly severe climate change and air pollution. The large emissions of CO2 and air pollutants SO2 and NOx are the main causes of climate change and air pollution in China. The emissions of SO2, NOx and CO2 are inherent results of fossil fuel combustion, which provides a potential synergistic effect to simultaneously control greenhouse gas and air pollutant emissions [9]. One policy (such as climate policy) may have a positive or negative impact on another policy (such as air pollution control), and this interaction is called common interest in the literature [8]. Research on the common interests of reducing greenhouse gas (GHG) and air pollution emissions began mainly in the 1990s. In recent years, scholars have become increasingly interested in this field, and research on common interests has gradually increased. Research on common interests helps to accurately measure the net cost of a policy in policy evaluation, and thus helps decision makers achieve multiple policy goals in a combination of policies [13].
Research on common interests has shown that environmental policies to alleviate air pollution can also bring many benefits to the environment, health, and economy. Morgenstern et al. [14] found that the policy of phasing out small boilers in central Taiyuan, China, has brought significant carbon emission reduction benefits (about 50% to 95% reduction). Xu and Masui [15] found that introducing SO2 control policies in China can achieve supplementary carbon emission reduction benefits. Chae [16] found that switching to low-sulfur fuels can achieve air quality improvement and carbon dioxide emission reduction targets at the lowest cost. Agee et al. [17] found that there is a considerable combination of SO2, NOx and CO2, and disregarding this commonality will increase the cost of pollution control. Cao et al. [18] found that China’s SO2 control policy in the Tenth Five-Year Plan not only avoided huge damage to public health, but also brought considerable net benefits to GDP.
Policies to mitigate climate change will also bring additional environmental benefits. Schwanitz et al. [19] analyzed the common benefits of mitigating climate change and supporting non-climate goals. Burtraw et al. [20] also found that actions to slow down the accumulation of greenhouse gases in the atmosphere will also reduce traditional air pollutants, which often produce auxiliary benefits locally and in the short term. Nam et al. [21] assessed the potential synergy between pollution and climate control in China and the United States, and found that the control of SO2 and NOx emissions would lead to a corresponding reduction in carbon emissions, which was summarized as the cross-elasticity of emissions control. Nemet et al. found that the estimated value of the co-benefits of air quality brought about by climate change mitigation ranged from US$2 to US$196 per ton of carbon dioxide, with an average value of USD 49 per ton of carbon dioxide. The co-benefits of developing countries are the highest [22]. Cao et al. [18] found that a moderate carbon tax can not only significantly reduce carbon dioxide emissions, but also reduce local air pollution more than expected during the “Eleventh Five-Year Plan” period. The health benefits of a carbon tax alone are equivalent to 0.2% of GDP, which exceeds the reduction in GDP.
Existing studies have explored the environmental, economic, and health effects of climate change control policies and air pollution control policies, as well as the common benefits of the two, but still have the following shortcomings: (1) Although the CGE-based general equilibrium model can quantify the environmental and health effects of a policy, it still does not accurately calculate the size of the synergistic emission reduction effect of a policy. (2) Research on the synergistic effects of climate change control policies on air pollution often only focuses on the environmental benefits of a certain pollutant, but lacks a comprehensive measurement of SO2, NOx, DS and other pollutants. (3) There is a lack of empirical research on the path of coordinated control of air pollution reduction caused by climate change control policies.
3. Methodology
3.1. Theoretical Basis
The synergy effect first appeared in the third assessment report issued by the Intergovernmental Panel on Climate Change (IPCC) in 2001, and its meaning is the social and economic benefits of policies and actions to mitigate greenhouse gas emissions.
Kaya (1989) [23] put forward the identity equation for studying the influencing factors of carbon emissions and has been widely used. The initial form is as follows:
Among them, i is the type of energy, ICE is the total industrial CO2 emissions, E is the total primary energy consumption, Y is the gross domestic product, and P is the population factor.
However, as the possible influencing factors are continuously explored, the research perspective is constantly updated. Based on in-depth exploration, this article expands the classic Kaya identity and adds a variable—comprehensive air pollution. Because a single type of air pollutant cannot comprehensively measure the emissions of industrial air pollutants, the main indicators for measuring industrial air pollution in this article are SO2, NOx, dust and smoke. Considering the respective limitations of each pollutant, this article reduces the dimensions of these indicators to obtain a comprehensive pollutant emission indicator, to make an objective and comprehensive evaluation of air pollution as far as possible. This paper draws on the method of Liu et al. [24] and combines the principal component analysis to obtain the weight of each pollutant index, and finally calculates the comprehensive air pollution index. The calculation formula is as follows:
where, is the weight of each pollutant, is the pollutant component.
This article has been expanded on the basis of Kaya identities and added the synergistic effect of CO2 emissions on comprehensive air pollutants, as shown below:
In the above formula, j represents different types of energy, k represents different regions, ICAP represents industrial comprehensive air pollutant emissions, ICE represents industrial CO2 emissions, E is physical energy consumption, Y is regional GDP, P is the population size. stands for , which is the comprehensive air pollution caused by unit industrial CO2 emissions. This is also the subject of this study, the quantitative relationship between industrial carbon emissions and industrial comprehensive air pollution emissions. represents , which is the CO2 emission factor of various energy sources, and this part is a constant. stands for , which is the energy structure. Since hydropower, wind power and other power generation methods rarely produce carbon emissions, carbon emissions are mainly generated by thermal power generation. The proportion of coal and oil consumption in thermal power generation remains between 85% and 90% throughout the year, with little fluctuation, so the energy structure effect can be ignored. stands for , which is energy consumption per unit of GDP, which is used to measure energy efficiency. stands for , which is GDP per capita, which is used to measure economic development.
This article refers to Ang [25] to perform the full differential processing of Equation (3), as shown below:
Among them, δ is a constant, so it is zero after partial differentiation, and the second part on the right side of Equation (3) is zero. Referring to Hou and Shi [26] on the factor decomposition principle of CO2 emissions in the energy and power industry, this paper uses Equation (4) to calculate the definite integral within the time interval [T, T + t], and we can get:
The meaning of Equation (5) is to sum up the changes in air pollutant emissions caused by the synergy effect, energy structure effect, energy efficiency effect, economic development effect, and population effect to obtain the total change in air pollutant emissions. Using the logarithmic average weight addition decomposition method, we can get:
Equation (6) classifies the influencing factors of air pollutant emissions, corresponding to the five effects of Equation (5).
3.2. Model Setting
Based on the above factor decomposition process, industrial comprehensive air pollution reduction (ICAPR) and industrial carbon reduction (ICR) can be expressed as shown in Equations (7) and (8):
Considering the energy rebound effect: The U-shaped relationship between economic output and energy consumption, and the EKC curve: the relationship between environmental pollution and per capita income is an inverted U-shaped curve. Therefore, the benchmark regression model of this article is set as follows:
In Equation (9), k represents different regions, t represents time, and m is the number of control variables. and respectively represent the industrial comprehensive air pollution reduction (ICAPR) and industrial carbon emission reduction (ICR) in the k region during the t period. , and respectively represent regional GDP per capita, power industry energy efficiency and population density. are other control variables, and represent the fixed effects of time and individual respectively, is a random error term, is a constant term.
The analysis of the conduction path of the synergistic emission reduction effect mainly discusses the interaction of the related factors between air pollutant emissions and greenhouse gas emissions. Due to the interaction between the related factors, the synergistic effect is conducted. The envisaged transmission path is as follows: the greenhouse gas is the starting point of the path, and other economic, social, and technological factors are used as variables that exert influence. This paper uses an econometric model to quantify the impact of these variables on industrial comprehensive air pollutant emissions reduction through industrial CO2 emissions reductions, that is, the synergistic effect between carbon emissions reduction and comprehensive air pollutants. Based on model (9), by adding interaction terms between related explanatory variables and industrial CO2 emission reductions, to illustrate the conduction path of industrial CO2 emission reduction activities on air pollution emission reduction, the model design is as follows:
The relevant variables in the formula are energy structure (ES), R&D expenditure (RDE), and environmental regulation (ER).
3.3. Variables and Data
The explained variable in this article is the industrial comprehensive air pollution reduction (ICAPR). To comprehensively measure the impact of industrial air pollution emissions SO2, NOx, and DS, this article draws on the method of Liu et al. [24]. Firstly, the dimensionality reduction of the indicators is performed, and the weight of each relevant indicator is calculated through the factor score matrix and the variance contribution rate of the common factor, and finally these 3 indicators are integrated into an indicator—industrial comprehensive air pollution:
In Equation (11), k is the type of pollutant. w is the weight of the corresponding pollutant, and X is the corresponding air pollutant emission.
The explanatory variable of this article is industrial carbon reduction (ICR). This article adopts the mainstream IPCC accounting method. However, because it is difficult to obtain industrial carbon emissions data by region, this article uses the weighting method to measure the carbon emissions of each province. The specific calculation methods of industrial carbon emission reductions in various provinces are as follows:
where k represents nine different energy sources, including: coal, coke, crude oil, gasoline, kerosene, diesel, fuel oil, natural gas, and electricity. represents the national total consumption of k types of energy during the t period. represents the national industrial consumption of k types of energy during the t period. represents the total consumption of k types of energy in the region i in the period t. represents the carbon emission coefficient of k types of energy.
Based on previous studies, this article selects the following variables that affect air pollution and carbon emission:
RDE. R&D expenditures in the energy and power industry. The investment in research and development is still one of the most important ways to reduce carbon emissions [27]. China’s power industry plays an important role in reducing carbon dioxide (CO2) and air pollutant emissions [28]. Therefore, this paper selects the R&D expenditure in the power industry as one of the expansion paths of the synergistic emission reduction effect.
Energy structure (ES). Li et al. found that the proportion of clean energy consumption restrained the emission of air pollutants, and the proportion of fossil energy was positively correlated with the emission of air pollutants [29]. The development of clean energy has greatly reduced regional haze pollution [30]. Therefore, this paper selects the proportion of clean energy in industrial energy consumption as the energy structure variable.
Environmental Regulation (ER). There are many indicators for measuring the intensity of environmental regulations. This article refers to Zhu et al. [31], and chooses the number of environmental punishment cases as a substitute variable for the intensity of environmental regulation.
GDP per capita (PGDP). Environmental pollution will change with the growth of per capita GDP, and the increase of per capita GDP will reduce the environmental impact to a certain level [32].
Energy Efficiency (EE). The energy efficiency in this paper is defined as the industrial output value per ton of standard coal energy consumption.
The proportion of urban population (PUP) and population density (PD). The former is calculated by the proportion of urban population in the total population of the region, as a representative variable to measure the level of urbanization. The latter is calculated by the ratio of the total population of the region to the land area.
Temperature (TEM). Temperature is used as a natural factor index. The average temperature of each region is adopted in this paper. Since the annual average temperature of each province is difficult to obtain, this paper selects the average temperature of major cities in each province as the representative of the province.
The data selected in this article are panel data from 2008 to 2014 in 30 Chinese provinces except Hong Kong, Macau, Taiwan and Tibet Autonomous Region. See Table 1 for data sources and descriptions of related variables.

Table 1.
Description of variables in models.
4. Results and Discussion
4.1. Benchmark Regression Analysis
This article uses three regression analysis methods. They are ordinary least squares method (abbreviated as OLS), fixed effects model (abbreviated as FE), and generally feasible generalized least square method (abbreviated as general FGLS). The estimation results are shown in Table 2. Among them, the OLS and FE methods have better estimation robustness, so the estimation standard errors of methods (1) and (2) are lower than those of method (3). However, the general FGLS method can effectively solve the autocorrelation problem within the group and is more effective in estimation, so this paper selects the results of method (3) for analysis.
Table 2.
Benchmark Regression Results.
Aiming at the core content of this article---the synergistic control effect of industrial comprehensive air pollution reduction and industrial carbon reduction. The estimation result of method (3) in Table 2 shows that: industrial CO2 emission reduction activities will significantly affect industrial comprehensive air pollution emission reduction, and an increase of one thousand tons of industrial CO2 emission reduction will increase industrial comprehensive air pollution emission reduction by 1 ton. This confirms the rationality of the coordinated control of China’s industrial carbon emission reduction and comprehensive air pollution. This research result is consistent with the findings of Wei et al. [8]. In practice, inspired by the coordinated control of water pollution, this concept has been gradually introduced in the field of greenhouse gas emissions and air pollutant emissions. Especially in recent years, China’s economic transformation and upgrading, the economy has turned to high-quality development, and thus more and more attention has been paid to environmental protection. Among them, the transformation of China’s industry is the most critical. China’s industry will shift from extensive development to high-quality development. The measures taken include optimizing the energy structure, reducing fossil energy consumption, while continuing to invest in energy technology research and development, the development of renewable energy technology, and the implementation of ultra-low emission technologies in the power industry. This reduces the SO2, NOx, DS and other pollutants emitted during the production process of each unit of energy. These measures have accelerated the green development of China’s energy industry and promoted the coordinated reduction of greenhouse gases and air pollutants.
It can be seen from the results of Table 2, R&D expenditure in the power industry will significantly promote ICAPR, because the current development direction of China’s power industry R&D is to improve energy efficiency and cleanliness, which will promote the reduction of air pollutants. The regression coefficient of the proportion of secondary industries is significantly negative, because in the early stages of industrialization, the increase in industrial output value will trigger a significant increase in energy demand, thereby increasing the air pollutants generated in the process of energy consumption. The increase in the intensity of environmental regulations will also promote the reduction of comprehensive air pollutants, but it is not significant. It may be that the administrative order-based environmental regulations have poor control effects on pollutant emissions. The increase in the proportion of clean energy in the industrial energy consumption structure will also significantly promote the reduction of comprehensive air pollutants, because compared to traditional fossil energy, clean energy has a lower carbon emission coefficient and pollutant emission coefficient. Among other control variables, GDP per capita and ICAPR are positively correlated, but the relationship is not significant. The improvement of energy efficiency will also promote the reduction of air pollutants, but it is not significant. The increase in the degree of urbanization will also promote the ICAPR.
4.2. Analysis of Cooperative Control Mechanism
This chapter mainly discusses the interaction between RDE, environmental regulations, energy structure and industrial carbon emission reductions, to sort out the control mechanism of ICAP synergy. The results are shown in Table 3. Comparing the results of model (1) and model (2), it can be found that after controlling the interaction between RDE and ICR, the RDE coefficient in model (2) is still positive, and the significance has not changed. This shows that RDE will directly promote the reduction of industrial comprehensive air pollutants. The coefficient of the interaction term is negative, but only significant at the 10% level, which shows that RDE will slightly weaken the synergistic effect of industrial carbon emission reduction in air pollutant emission reduction. One possible reason is that R&D funds in the power industry will be focused on the research and development of clean energy power generation technologies, and many clean energy power stations require thermal power plant facilities to maintain operation, which may increase SO2 emissions [33].
Table 3.
Expansion mechanism analysis of collaborative control.
Comparing the results of model (1) and model (3), the interaction between energy structure and industrial carbon emission reduction did not change the coefficient of ICR in model (3). However, the coefficient of the interaction term between ES and ICR is negative, which shows that the increase in the proportion of clean energy can promote the reduction of industrial comprehensive air pollutants, but it will weaken the synergistic effect between ICR and ICAPR.
Comparing model (1) with model (4), it can be found that by adding the interaction term between environmental regulation and ICR, the coefficient of the interaction term between ER and ICR is significantly positive, and the coefficient of ICR increases, which means that the synergy effect is expanded. The above illustrates that environmental regulations can significantly promote ICAPR. The increase in the intensity of environmental regulations will cause industrial enterprises to face higher intensity of environmental law enforcement, which will increase the cost of pollution. Companies will adopt emission reduction measures including energy substitution and investment in energy and power equipment to reduce costs. The results of model (5) also reflect that after considering the three interactions, the synergy between ICR and ICAPR has a greater increase than the other models. This shows that through multiple paths, it helps to expand synergies. However, the interaction between RDE, energy structure adjustment and carbon emission reduction will still weaken the reduction of air pollutants.
According to the results of Table 3, the expansion degree of the synergy effect after considering the interaction can be quantified. The quantitative results are shown in Table 4. The main effect is the coefficient of industrial carbon emission reduction ICR in Table 3. The partial effect is the product of the mean value of the moderating variable and the coefficient of the interaction term. The total effect is the sum of the main effect and the partial effect. The main effect is the synergistic effect when the adjustment variable takes the zero value, and it needs to be combined with the partial effect produced by the adjustment variable to be more accurate. It can be seen from Table 4 that the partial effects of RDE and ES are both negative, indicating that the increase in R&D expenditure and the proportion of clean energy in the energy structure will weaken the synergistic effect. Combining the results of Table 1, it is better to invest R&D funds directly in air pollutant emission reduction activities. From the perspective of the expansion effect produced by the interaction on the synergy, environmental regulation has the greatest utility, followed by the adjustment of energy structure and the research and development expenditure.
Table 4.
Analysis of the interaction between carbon dioxide emission reduction and other variables.
4.3. Endogenous Problems
If one wants to verify that x causes y to change, x needs to have exogeneity, that is, x has nothing to do with the error term ε. If x is not exogenous, but covariates with the error term (such as x increases, ε increases), then x has an endogeneity problem [34]. The main reasons for the endogeneity of variables are missing variables, measurement errors, and mutual cause and effect. Missing variables refer to variables that should have been included in the explanatory variables but have been omitted for some reason. Although the panel data used in this paper can alleviate the problem of missing variables to a certain extent. But there may still be omissions. The homology of greenhouse gas emissions and air pollutants will lead to possible interactions between carbon emissions and air pollutants [35].
Therefore, this article first verifies the existence of endogenous explanatory variables. This paper uses the robust DWH endogeneity test method for heteroscedasticity. The test results are shown in Table 5. The results of both tests reject the null hypothesis that “all explanatory variables are exogenous” at the 10% significance level, so there is endogenous Explanatory variables. Comparing the results of models (1) and (2) in Table 5, it can be found that after controlling industrial carbon emission reduction, the coefficients of the explanatory variables have changed significantly. Moreover, the standard error has also decreased, so the carbon emission reduction may be related to other explanatory variables, so the industrial carbon emission reduction is selected as the endogenous explanatory variable.
Table 5.
Endogeneity test results.
Instrumental variables originated in the field of economics and are commonly used to solve endogenous problems [36], so the choice of instrumental variables becomes very important. In China’s industrial sector, the use of command and control measures in carbon emission reduction is very common, with the purpose of reaching or exceeding emission reduction targets. Then, under the established emission reduction target, the company will decide the emission reduction measures to be adopted in the future based on the historical emission reduction situation. When the current carbon emission reduction situation is optimistic, other cost-effective emission reduction measures will be adopted in the next period, such as the purchase of emission credits in the carbon trading market. When the current emission reduction amount is small, other measures with greater emission reduction intensity will be adopted, such as investing in energy equipment and adjusting the energy structure to adopt other cleaner energy sources. Therefore, the industrial carbon emission reduction can only affect the current industrial carbon emission reduction through the first-order lag term, thereby affecting the current air pollutant emission reduction. Therefore, this paper selects the first-order lag term of industrial carbon emission reduction as an instrumental variable.
The results are as shown in the inspection report on the right side of Table 5, which failed the Cragg-Donald test. Since this test needs to satisfy the premise that the perturbation term conforms to the spherical perturbation, we further refer to the Kleibergen-Paap test, which can be regarded as an extension of the Cragg-Donald test statistic when the perturbation term is a non-spherical perturbation. From the test results, the null hypothesis of weak instrumental variables can be rejected, which shows that instrumental variables have a good correlation with endogenous variables. In this paper, the number of instrumental variables is equal to the number of endogenous variables, so there is no problem of over-identification. As the robustness of the GMM estimation method is weaker than that of the OLS method, the standard error of the estimation of the variable is significantly increased, and the coefficient of the core variable ICR is increased, but the significance is weakened.
4.4. Robustness Test
The lack of robustness may be caused by the bias of some variable relations. The parameter design method must assume in advance that the overall probability distribution form is known. In contrast, semi-parametric estimation can alleviate the “curse of dimensionality” of non-parametric estimation and the setting bias of parameter estimation. It is assumed that the functional relationship between industrial carbon emission reduction and comprehensive air pollution emission reduction is unknown. Based on the semi-parametric estimation method, the stability of the model under three types of regional samples in the eastern, central and western regions is discussed. The estimated results of sub-regions are shown in Table 6.
Table 6.
Semi-parameter estimation results in different regions.
From the estimated results in Table 6, the synergistic effect between industrial carbon emission reduction and comprehensive air pollution emission reduction exists in the eastern, central and western regions. But in different regions, different laws are present. Among them, the synergy coefficient between industrial carbon emission reduction and industrial comprehensive pollution emission reduction in the western region is the largest, and it is also very significant. Part of the reason is that the western region of China is in the initial stage of urbanization, and the industrial development is relatively extensive, and there are many industrial enterprises with heavy pollution and high emissions. There is a strong correlation between carbon emissions and air pollutant emissions, which makes the synergy between ICR and ICAPR in the western region strong. The eastern part of China has a higher level of economic development and a greener industrial structure. Economic development and environmental pollution have been decoupled to a certain extent, so the correlation between carbon emissions and pollutant emissions is low.
The significance of the regression coefficient between R&D expenditure and ICAPR is the most significant in the fixed effects model under the full sample. In the semi-parametric estimation by region, the regression coefficient between R&D expenditures in the central and western regions and ICAPR is relatively large, and the R&D expenditures in the eastern region have the least promotion effect on ICAPR. Probably because the eastern region has relatively enough R&D, it has produced a diminishing marginal effect. Comparing the semi-parametric estimation model (4) with the fixed effects model (5) under the full sample, the coefficients of the core explanatory variable ICR are similar in size and significant, and the other control variables are also similar. The overall results are similar, which can further support the robustness of the model.
5. Conclusions and Policy Implications
This article aims to explore the joint governance mechanism of climate change and air pollution. Based on the historical carbon emissions and air pollutant emissions data of China’s industries, this paper uses econometric methods to measure in detail the synergistic effects between China’s industrial carbon emission reduction and comprehensive air pollutant emission reduction. The diversity of synergy effects was also discussed by region. The main effects, partial effects and total effects are calculated separately. The expansion mechanism of the synergy effect is analyzed through interaction, which provides a path for the coordinated control of carbon emissions and comprehensive air pollutants in the future. The main conclusions are:
- There is a significant synergistic effect between the carbon emission reduction of Chinese industry and the emission reduction of comprehensive air pollutants. For every 1000 tons of industrial carbon emission reduction in China, 1 ton of air pollutant emission reductions can be produced. The increase in the intensity of environmental regulation is the main expansion path of the collaborative governance effect. R&D expenditures and the increase in clean energy in the energy structure will weaken the synergistic effect. However, R&D expenditure in the energy and power industry can significantly promote the reduction of comprehensive air pollutants.
- However, in the eastern, central, and western regions of China, the synergy between industrial carbon emission reduction and air pollutant emission reduction is not the same. Different regions have different levels of economic maturity. The correlation coefficient of the synergy between industrial carbon emission reduction and industrial comprehensive air pollution emission reduction in the western region is the largest, and it is also very significant. The level of economic development in eastern China is relatively high, and economic development and environmental pollution have been decoupled to some extent, so the correlation between carbon emissions and pollutant emissions is low. Therefore, it is necessary to formulate regionally differentiated emission reduction policies. The impact of R&D expenditure on the synergy between carbon emission reduction and comprehensive air pollutant emission reduction in the central and western regions is greater than that in the eastern region.
Based on the above conclusions, the policy recommendations are as follows:
- China’s climate change and air pollution problems should be controlled through collaborative governance. Ignoring any aspect will lead to a reduction in policy benefits and an increase in policy costs.
- Appropriately increasing the intensity of environmental regulations can promote the expansion of the synergy between industrial carbon reduction and industrial comprehensive air pollutant reduction. Enhancing R&D expenditure in the energy and power industry can promote the reduction of industrial comprehensive air pollutants.
- Local governments should pay attention to regional differences when formulating emission reduction policies in the industrial sector. The central and western provinces should pay attention to the coordinated control of carbon emission reduction and air pollutant emission reduction and focus on increasing the R&D expenditure in the energy and power industry. The eastern region should focus on strengthening environmental regulations to control industrial carbon emissions and industrial air pollutant emissions separately.
Author Contributions
B.W.: Supervision, Funding acquisition, review & editing, Methodology, Project administration. Y.W.: writing—original draft, Methodology, Software. Y.Z., Investigation, Software, data curation. All authors have read and agreed to the published version of the manuscript.
Funding
This research is supported by “the Fundamental Research Funds for the Central Universities” (No. 2017WKYXZD002).
Institutional Review Board Statement
Not applicable.
Informed Consent Statement
Not applicable.
Data Availability Statement
Not applicable.
Acknowledgments
The authors thank the support from Huazhong University of Science and Technology.
Conflicts of Interest
The funders had no role in the design of the study; in the collection, analyses, or interpretation of data; in the writing of the manuscript; or in the decision to publish the results.
References
- IEA. CO2 Emissions from Fuel Combustion 2017-Highlights. Int. Energy Agency 2017, 1, 1–162. [Google Scholar]
- Abdollahi, H. Investigating Energy Use, Environment Pollution, and Economic Growth in Developing Countries. Environ. Clim. Technol. 2020, 24, 275–293. [Google Scholar] [CrossRef]
- Kinney, P.L. Interactions of Climate Change, Air Pollution, and Human Health. Curr. Environ. Health Rep. 2018, 5, 179–186. [Google Scholar] [CrossRef] [PubMed]
- Liu, Y.; Du, Y.; Wang, H.; Du, L.; Feng, W.-H. Porcine reproductive and respiratory syndrome virus (PRRSV) up-regulates IL-8 expression through TAK-1/JNK/AP-1 pathways. Virology 2017, 506, 64–72. [Google Scholar] [CrossRef]
- Myllyvirta & Analyst. Quantifying the Economic Costs of Air Pollution from Fossil Fuels; Centre for Research on Energy and Clean Air: Paris, France, 2020. [Google Scholar]
- Dudley, B. BP Statistical Review of World Energy; BP Statistical Review: London, UK, 2018. [Google Scholar]
- China Statistics Press. 2018 China Statistical Yearbook; China Statistics Press: Beijing, China, 2019. [Google Scholar]
- Wei, X.; Tong, Q.; Magill, I.; Vithayasrichareon, P.; Betz, R. Evaluation of potential co-benefits of air pollution control and climate mitigation policies for China’s electricity sector. Energy Econ. 2020, 92, 104917. [Google Scholar] [CrossRef]
- Nam, K.-M.; Waugh, C.J.; Paltsev, S.; Reilly, J.M.; Karplus, V.J. Carbon co-benefits of tighter SO2 and NOx regulations in China. Glob. Environ. Chang. 2013, 23, 1648–1661. [Google Scholar] [CrossRef]
- Liu, J.; Xu, J.; Chen, J.; Hong, X.; Zhou, M. Spatio-temporal Distribution Characteristics of Water Quality in Miju River and Erhai Lake. J. Coast. Res. 2019, 93, 31–38. [Google Scholar] [CrossRef]
- Jing, Z.; Xin, L.; Rowan Rui, D. Research on the Quantitative Relationship between Industrial Pollutants and Economic Development in Beijing-Tianjin-Shanghai Area. Environ. Pollut. Prev. 2010, 32, 107–110. [Google Scholar]
- Ministry of Ecology and Environment of the People’s Republic of China. 2015 Environmental Statistics Annual Report. Beijing, China. 2017. Available online: http://www.mee.gov.cn/hjzl/sthjzk/sthjtjnb/ (accessed on 14 June 2021).
- He, K.; Lei, Y.; Pan, X.; Zhang, Y.; Zhang, Q.; Chen, D. Co-benefits from energy policies in China. Energy 2010, 35, 4265–4272. [Google Scholar] [CrossRef]
- Morgenstern, R.; Krupnick, A.; Zhang, X. The Ancillary Carbon Benefits of SO2 Reductions from a Small-Boiler Policy in Taiyuan, PRC. J. Environ. Dev. 2004, 13, 140–155. [Google Scholar] [CrossRef]
- Xu, Y.; Masui, T. Local air pollutant emission reduction and ancillary carbon benefits of SO2 control policies: Application of AIM/CGE model to China. Eur. J. Oper. Res. 2009, 198, 315–325. [Google Scholar] [CrossRef]
- Chae, Y. Co-benefit analysis of an air quality management plan and greenhouse gas reduction strategies in the Seoul metropolitan area. Environ. Sci. Policy 2010, 13, 205–216. [Google Scholar] [CrossRef]
- Agee, M.D.; Atkinson, S.E.; Crocker, T.D.; Williams, J.W. Non-separable pollution control: Implications for a CO2 emissions cap and trade system. Resour. Energy Econ. 2014, 36, 64–82. [Google Scholar] [CrossRef]
- Cao, J.; Ho, M.S.; Jorgenson, D. An Integrated Assessment of the Economic Costs and Environmental Benefits of Pollution and Carbon Control. Chin. Econ. 2012, 231–256. [Google Scholar] [CrossRef]
- Schwanitz, V.J.; Longden, T.; Knopf, B.; Capros, P. The implications of initiating immediate climate change mitigation—A potential for co-benefits? Technol. Forecast. Soc. Chang. 2015, 90, 166–177. [Google Scholar] [CrossRef]
- Burtraw, D.; Krupnick, A.; Palmer, K.; Paul, A.; Toman, M.; Bloyd, C. Ancillary benefits of reduced air pollution in the US from moderate greenhouse gas mitigation policies in the electricity sector. J. Environ. Econ. Manag. 2003, 45, 650–673. [Google Scholar] [CrossRef]
- Nam, K.-M.; Waugh, C.J.; Paltsev, S.; Reilly, J.M.; Karplus, V.J. Synergy between pollution and carbon emissions control: Comparing China and the United States. Energy Econ. 2014, 46, 186–201. [Google Scholar] [CrossRef]
- Nemet, G.F.; Holloway, T.; Meier, P. Implications of incorporating air-quality co-benefits into climate change policymaking. Environ. Res. Lett. 2010, 5, 014007. [Google Scholar] [CrossRef]
- Kaya, Y. Impact of Carbon Dioxide Emission on GNP Growth: Interpretation of Proposed Scenarios; IPCC Response Strategies Working Group: Paris, France, 1989. [Google Scholar]
- Xin, L.; Shumin, L. An Empirical Analysis of Energy Efficiency in China’s Provinces Based on the Undesired Output SBM Model. Math. Pract. Knowl. 2015, 45, 35–43. [Google Scholar]
- Ang, B. Decomposition analysis for policymaking in energy: Which is the preferred method? Energy Policy 2004, 32, 1131–1139. [Google Scholar] [CrossRef]
- Jianchao, H.; Dan, S. Research on the Driving Factors of Carbon Emission Changes in China’s Power Industry. China Ind. Econ. 2014, 6, 44–56. [Google Scholar]
- Li, L.; McMurray, A.; Li, X.; Gao, Y.; Xued, J. The diminishing marginal effect of R&D input and carbon emission mitigation. J. Clean. Prod. 2021, 282, 124423. [Google Scholar] [CrossRef]
- Jiang, P.; Khishgee, S.; Alimujiang, A.; Dong, H. Cost-effective approaches for reducing carbon and air pollution emissions in the power industry in China. J. Environ. Manag. 2020, 264, 110452. [Google Scholar] [CrossRef]
- Li, L.; Hong, X.; Wang, J. Evaluating the impact of clean energy consumption and factor allocation on China’s air pollution: A spatial econometric approach. Energy 2020, 195, 116842. [Google Scholar] [CrossRef]
- Liu, X.; Wang, Z.; Sun, X.; Zhang, L.; Zhang, M. Clarifying the relationship among clean energy consumption, haze pollution and economic growth–based on the empirical analysis of China’s Yangtze River Delta Region. Ecol. Complex. 2020, 44, 100871. [Google Scholar] [CrossRef]
- Zhu, Y.; Wang, Z.; Yang, J.; Zhu, L. Does renewable energy technological innovation control China’s air pollution? A spatial analysis. J. Clean. Prod. 2020, 250, 119515. [Google Scholar] [CrossRef]
- Grossman, G.M.; Krueger, A.B. Economic Growth and the Environment. Q. J. Econ. 1995, 110, 353–377. [Google Scholar] [CrossRef]
- Ming, Z.; Nan, D.; Lingyun, L.; Kun, Z. Research on Synergy and Additionality of Clean Development Mechanism Based on Econometric Method. East. China Electr. Power 2013, 41, 286–289. [Google Scholar]
- Sajons, G.B. Estimating the causal effect of measured endogenous variables: A tutorial on experimentally randomized instrumental variables. Leadersh. Q. 2020, 31, 101348. [Google Scholar] [CrossRef]
- Guo, J.-X. Cleaner technology choice in the synergistic control process for greenhouse gases and air pollutions. J. Clean. Prod. 2019, 238, 117885. [Google Scholar] [CrossRef]
- Heckman, J.J. Sample Selection Bias as a Specification Error. J. Econom. Soc. 1979, 47, 153. [Google Scholar] [CrossRef]

Publisher’s Note: MDPI stays neutral with regard to jurisdictional claims in published maps and institutional affiliations. |
© 2021 by the authors. Licensee MDPI, Basel, Switzerland. This article is an open access article distributed under the terms and conditions of the Creative Commons Attribution (CC BY) license (https://creativecommons.org/licenses/by/4.0/).