Article

Modeling and Management Option Analysis for Saline Groundwater Drainage in a Deltaic Island

by
Renji Remesan
1,
Arjun Prabhakaran
1,
Macariush N. Sangma
1,
Sreekanth Janardhanan
2,*,†,
Mohammed Mainuddin
2,
Sukanta K. Sarangi
3,
Uttam Kumar Mandal
3,
Dhiman Burman
3,
Sukamal Sarkar
4 and
Kshirenda Kumar Mahanta
3
1
Indian Institute of Technology, School of Water Resources, Kharagpur 721302, India
2
Water Security Program, CSIRO Land and Water, Dutton Park, QLD 4102, Australia
3
Regional Research Station, ICAR-Central Soil Salinity Research Institute, Canning Town 743329, India
4
Bidhan Chandra Krishi Viswavidyalaya, Mohanpur, Nadia 741252, India
*
Author to whom correspondence should be addressed.
Address: GPO BOX 2583, Brisbane, QLD 4001, Australia.
Sustainability 2021, 13(12), 6784; https://doi.org/10.3390/su13126784
Submission received: 30 April 2021 / Revised: 8 June 2021 / Accepted: 10 June 2021 / Published: 15 June 2021
(This article belongs to the Special Issue Sustainable Groundwater Resource Development for Agriculture)

Abstract

:
Understanding the interactions between shallow saline groundwater and surface water is crucial for managing water logging in deltaic islands. Water logging conditions result in the accumulation of salt in the root zone of crops and detrimentally affect agriculture in the economically and socially backward deltaic region of West Bengal and Bangladesh. In this paper, we undertook a modeling study of surface water–groundwater interactions in the Gosaba Island of Sundarbans region of the Ganges delta using MODFLOW followed by comprehensive parameter sensitivity analysis. Further, scenario analyses (i.e., no-drain, single drain, three drains) were undertaken to evaluate the effectiveness of drainage infrastructure to reduce saline water logging conditions. The evaluation indicated that installation of three drains can remove water at a rate of up to −123.3 m3day−1 and lower the water table up to 0.4 m. The single drain management scenario could divert water at the rate of −77.9 m3day−1 during post monsoon season, lowering the shallow saline groundwater table up to 0.1 m. This preliminary modeling study shows encouraging results to consider drainage management as to solve the increasing challenge of water logging and salinity management in the deltaic region. The insights will be useful for farmers and policymakers in the region for planning various sustainable saline groundwater management. Building drainage infrastructure could potentially be part of initiatives like the national employment guarantee scheme in India. In the future, this model can be coupled with solute transport models for understanding the current status and future expansion of salinity in the study area. Further modeling and optimization analysis can help identify the optimal depth and spacing of drains.

1. Introduction

Deltaic and coastal islands are distinct hydro-environmental zones characterized with regional significance in food security, biodiversity conservation, and fisheries. It is estimated that globally 51% of the world population will live within 200 km from the coastline [1] by 2030s. Asian mega-deltas are the world’s important agricultural areas and are vital for food security. The adoption of water saving technologies and developing salt-tolerant crops are widely acknowledged as potential solutions for climate adaptation in such regions [2].
Ganges River delta is a region that is already witnessing considerable agricultural and human health issues and widespread occurrence of water quality issues like salinity and groundwater arsenic [3,4,5]. The deltaic region is also characterized by distinct issues and aspects like (i) water logging [3,6], (ii) shallow groundwater salinity [7,8,9], (iii) seawater intrusion and marine transgressions, and (iv) formation of shallow rainwater lenses [10], which control saline seepage and associated processes involved in these regions. Salination of irrigated lands is a common issue in coastal deltaic islands, which can be addressed with the help of proper implementation and management of a drainage infrastructure including sub-surface drainage [6,11]. Efficacy of drainage can be evaluated using field experiments [12] and modeling analysis [13]. Spatially distributed modeling can provide reliable information to tackle water logging and soil salinity problems [14]. Geospatially modeled information can provide valuable salinity management knowledge through salinity hazard assessment and planning of effective subsurface/surface drainage systems [15].
Salt water intrusion into shallow aquifers from adjacent tidal rivers is also a problem in the deltaic areas that is expected to worsen with climate change and sea level rise [16]. Over the years, different models and methods have been developed to study the dynamics of seawater intrusion and protecting groundwater resources from future contamination through (i) saltwater intrusion modeling [17], (ii) GIS techniques and deriving chemical indicators [18], (iii) multi isotope approaches [19], (iv) seawater/freshwater mixing modeling [20], (v) geoelectrical investigations [21], etc. Various models like MOCDENS3D [17], Visual MODFLOW [22], FEMWATER [23], MODHMS [24], SEAWAT [25], and MOCDENS3D [26] have been applied all around world to study saltwater intrusion dynamics. A study [27] has simulated groundwater directions, velocities, and discharge rates using a 3D model of the shallow aquifer system at the Fire Island National Seashore, USA. Another study [28] has applied a finite difference program to evaluate the processes and the mechanism of the groundwater salinization and seawater intrusion into the Nile Delta Aquifer. Shallow freshwater lenses in deltaic regions are the result of an increased freshwater recharge either by irrigation [29] or natural recharge [30]. The freshwater–saltwater distribution and groundwater chemistry in deltaic region islands are influenced largely by irrigation water and monsoon recharge [31].
This paper presents the result of a study whose focus was preliminary investigation of groundwater balance in an island in the Ganges River delta. Numerical model simulations were undertaken to quantify the water balance and explore scenarios for drainage management to address saline groundwater logging. The Sundarbans is one of the largest mangrove forests in the world (140,000 ha) and lies on the delta of the Ganges, Brahmaputra and Meghna rivers on the Sea of Bay of Bengal and is spread across Bangladesh and West Bengal, India [31]. Near this environmentally fragile region are numerous islands formed by the distributaries of the rivers that are inhabited by millions of people whose livelihood depends on subsistence farming and fishing [32,33,34]. These coastal islands of South and North 24 Parganas districts of West Bengal, India, are known as Indian Sundarbans. Approximately 2069 sq. km of this area is occupied by the tidal rivers, creeks, and estuaries, which finally joins the Bay of Bengal [35]. The Sundarbans areas are mostly dominated by mangrove forests over all islands. These regions receive average annual rainfall of 1800 mm, of which 80% occurs during Monsoon season [36]. Rivers are usually saline rivers which have a high concentration of salts similar to the concentration of salts in seawater (35,000 ppm). Livelihoods in Sundarbans are primarily dependent upon agriculture [32,33,34], which is mono-cropped, namely, Aman rice cultivated during Monsoon/Kharif season [37,38]. Most of the croplands remain fallow during the post-monsoon seasons due to the scarcity of fresh surface water for irrigation [39]. The after-effects of a severe cyclonic storm, Aila, occurred on 25 May 2009 and caused extensive saline ingression to the coastal regions and converted vast areas into fallow [40].
In this study, we specifically focused on the groundwater dynamics and water balance in the Gosaba Island and how drainage management would influence groundwater levels in the island. Although several studies have been undertaken to investigate groundwater flow condition and salinity of the Ganges-Brahmaputra-Meghna delta [41,42], understanding the groundwater flow dynamics at the island-scale is of practical value in devising management strategies at the farm and local scale which is lacking in the literature. Drainage management in these inhabited islands can contribute to the management of water logging and salinity to improve agriculture and livelihoods in these poor areas. In the current study, a 2D cross-section model for the Gosaba Island was constructed with the MODFLOW code [43] and subsequent transient calibration was performed using manual calibration.

2. Materials and Methods

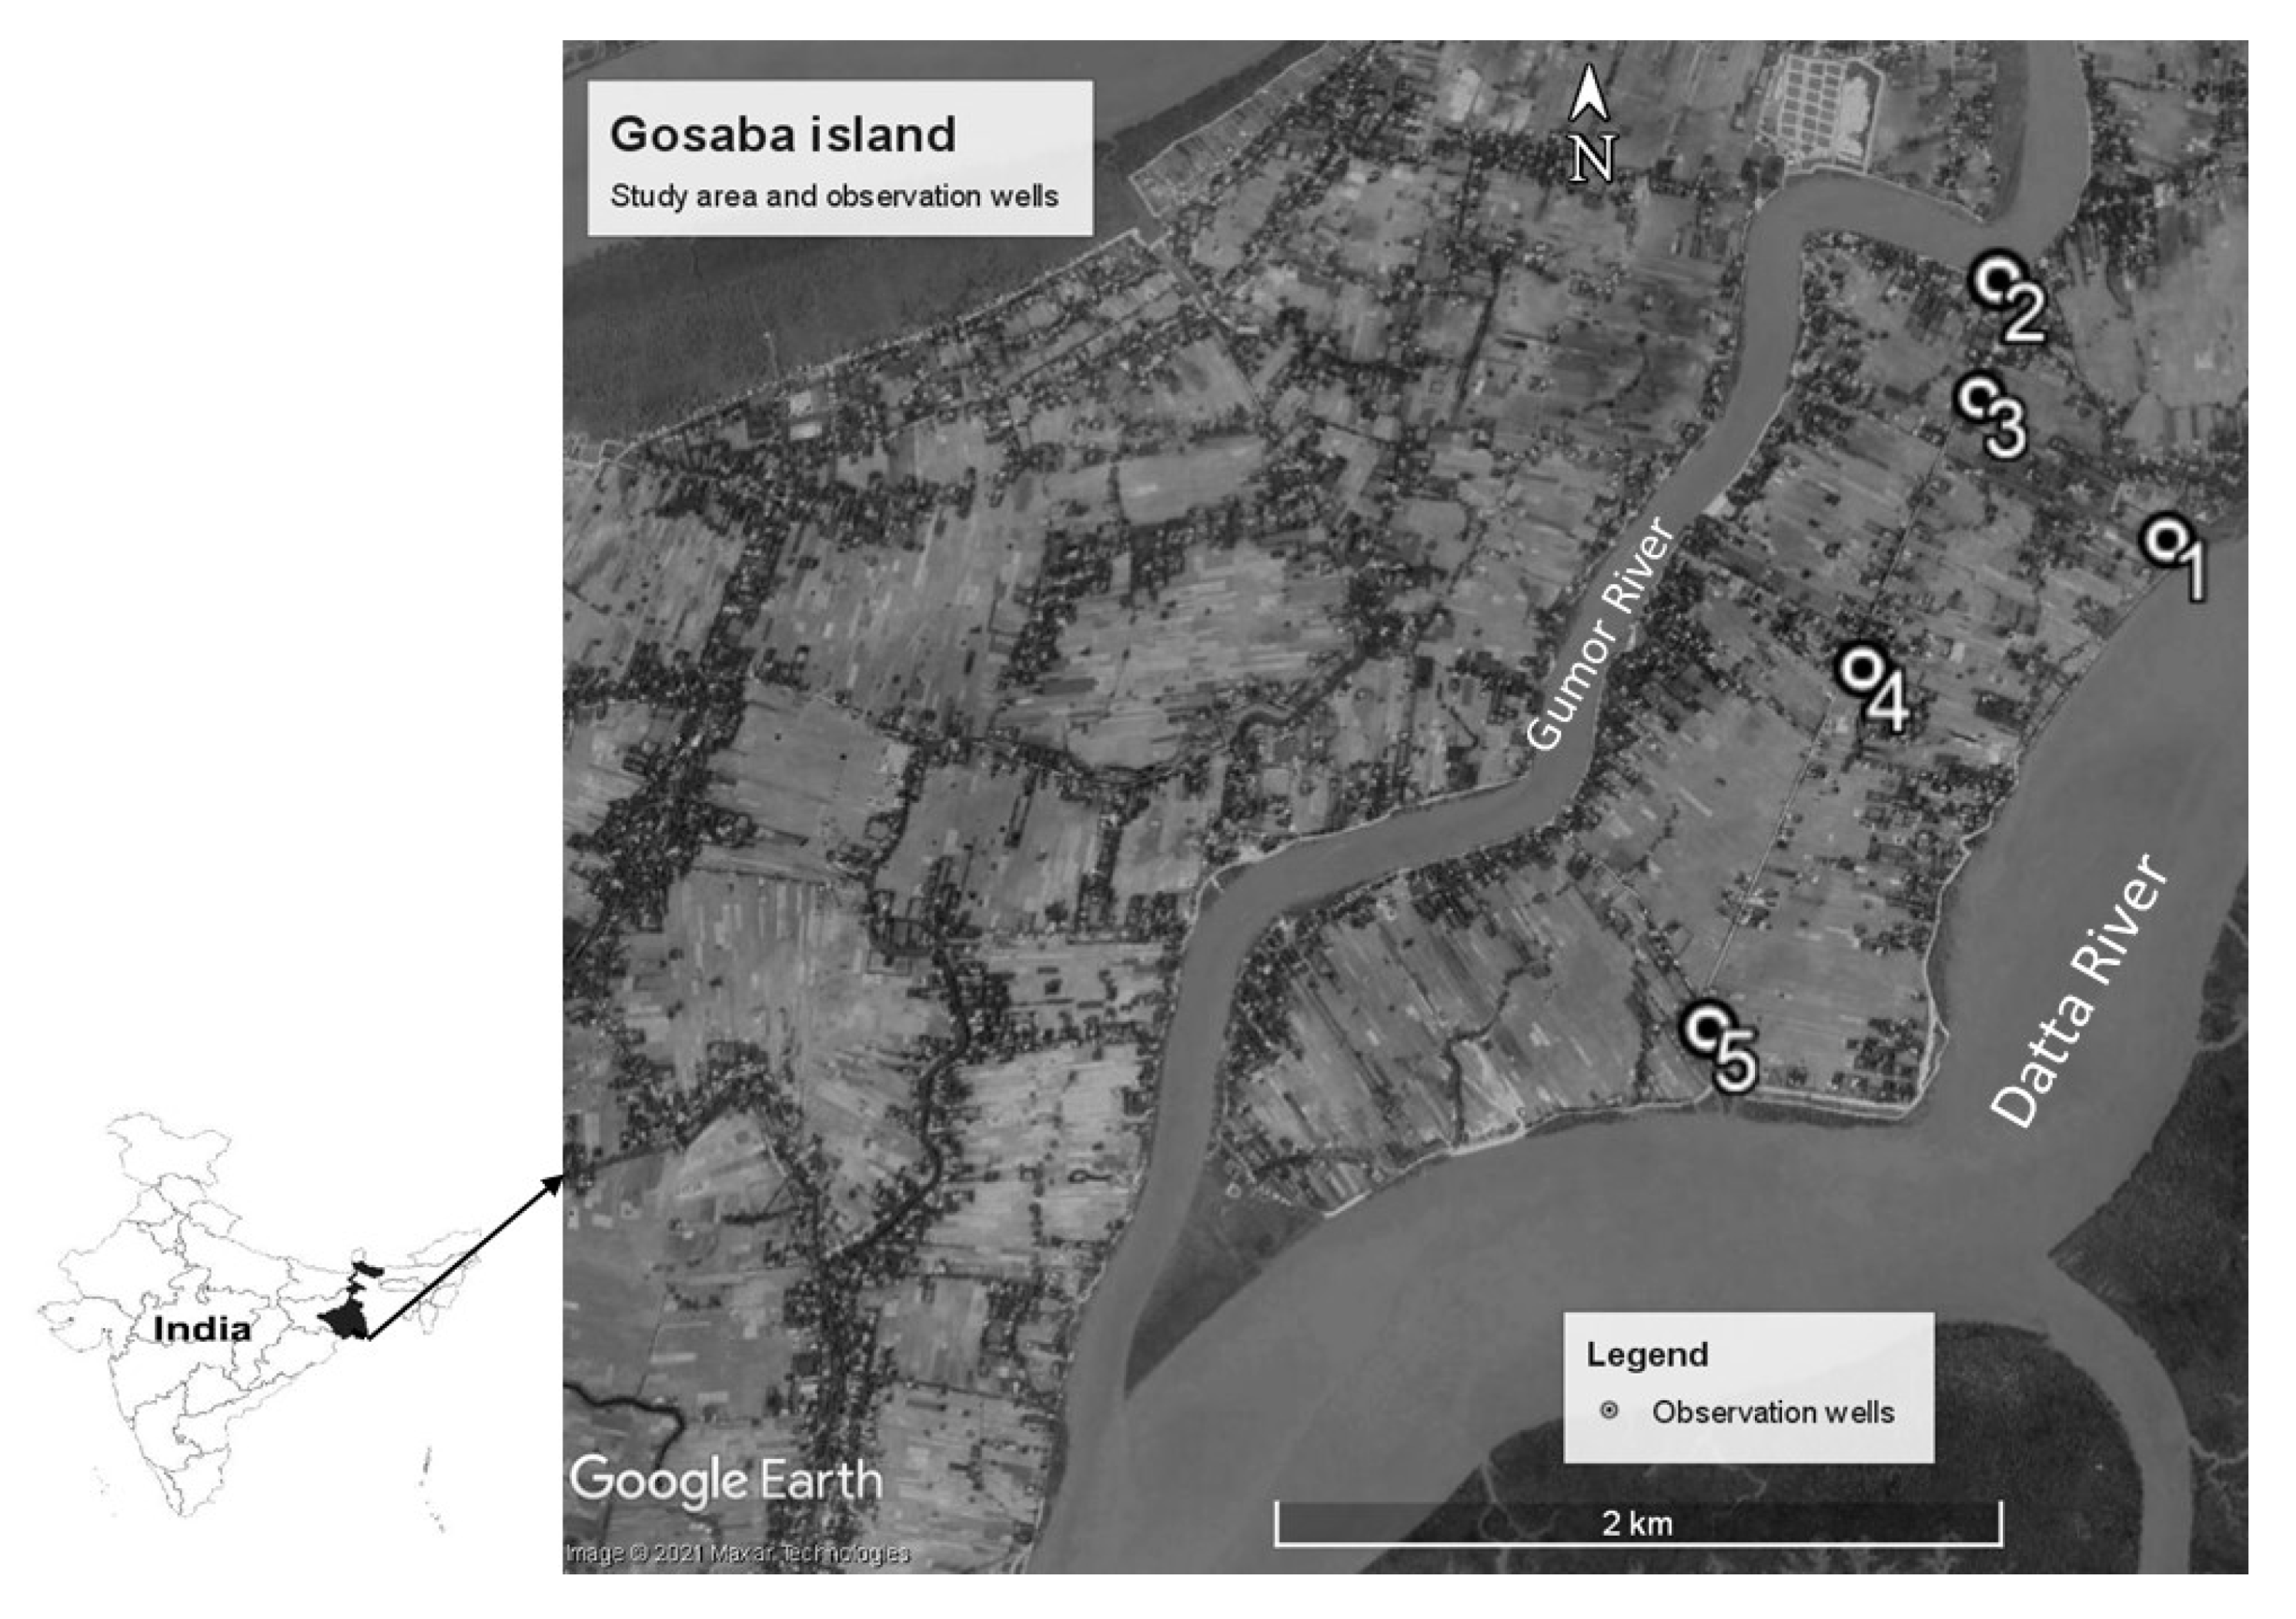
2.1. The Gosaba Island and Data Sets

The study area is located at Gosaba Island of Sundarbans Region in South 24 Parganas district, West Bengal, India, with the coordinates of 88°47′25″ E and 22°07′85″ N (Figure 1). This region is mostly dominated by mangrove trees (Heritierafomes) and the island is surrounded by rivers on all sides. Gumor River is in the northern region and Datta River is located in the southern part which eventually joins Bidyadhari River. Water in these rivers has a high concentration of salts throughout the year, and thus it is unsuitable for drinking or irrigation purposes [35].
There are 50 inhabited villages in the Gosaba CD block, as per the District Census Handbook, South Twenty-four Parganas, 2011 [44]. The region is mainly a mono-cropped area with cultivation of long-duration Kharif rice in the monsoon season. Cropping in the dry season is very low due to salinity in the soil and the lack of good quality irrigation water [3,30,45]. In the dry season, the groundwater level is very close to the surface [7,30]. Late harvest of Kharif rice delays the sowing of dry season crops which exposes the crop to soil salinity due to the capillary rise from the salty groundwater table. Sub-surface drainage can effectively reduce the saline groundwater table which will enable to grow crops in the dry season. Long-term rainfall and evapotranspiration (ET) data during 1966–2016 was collected from the ICAR-Central Soil Salinity Research Institute (CSSRI), Canning Town, West Bengal, India, for the purpose of this study. Rainfall measurements are obtained from the weather station of CSSRI, and evapotranspiration is estimated using the FAO Penman–Monteith method. This time series data is used for the initial groundwater model setup. Five piezometers are in the study area and head measurements are available from the study region from the year 2017, and that data has been used for this study.

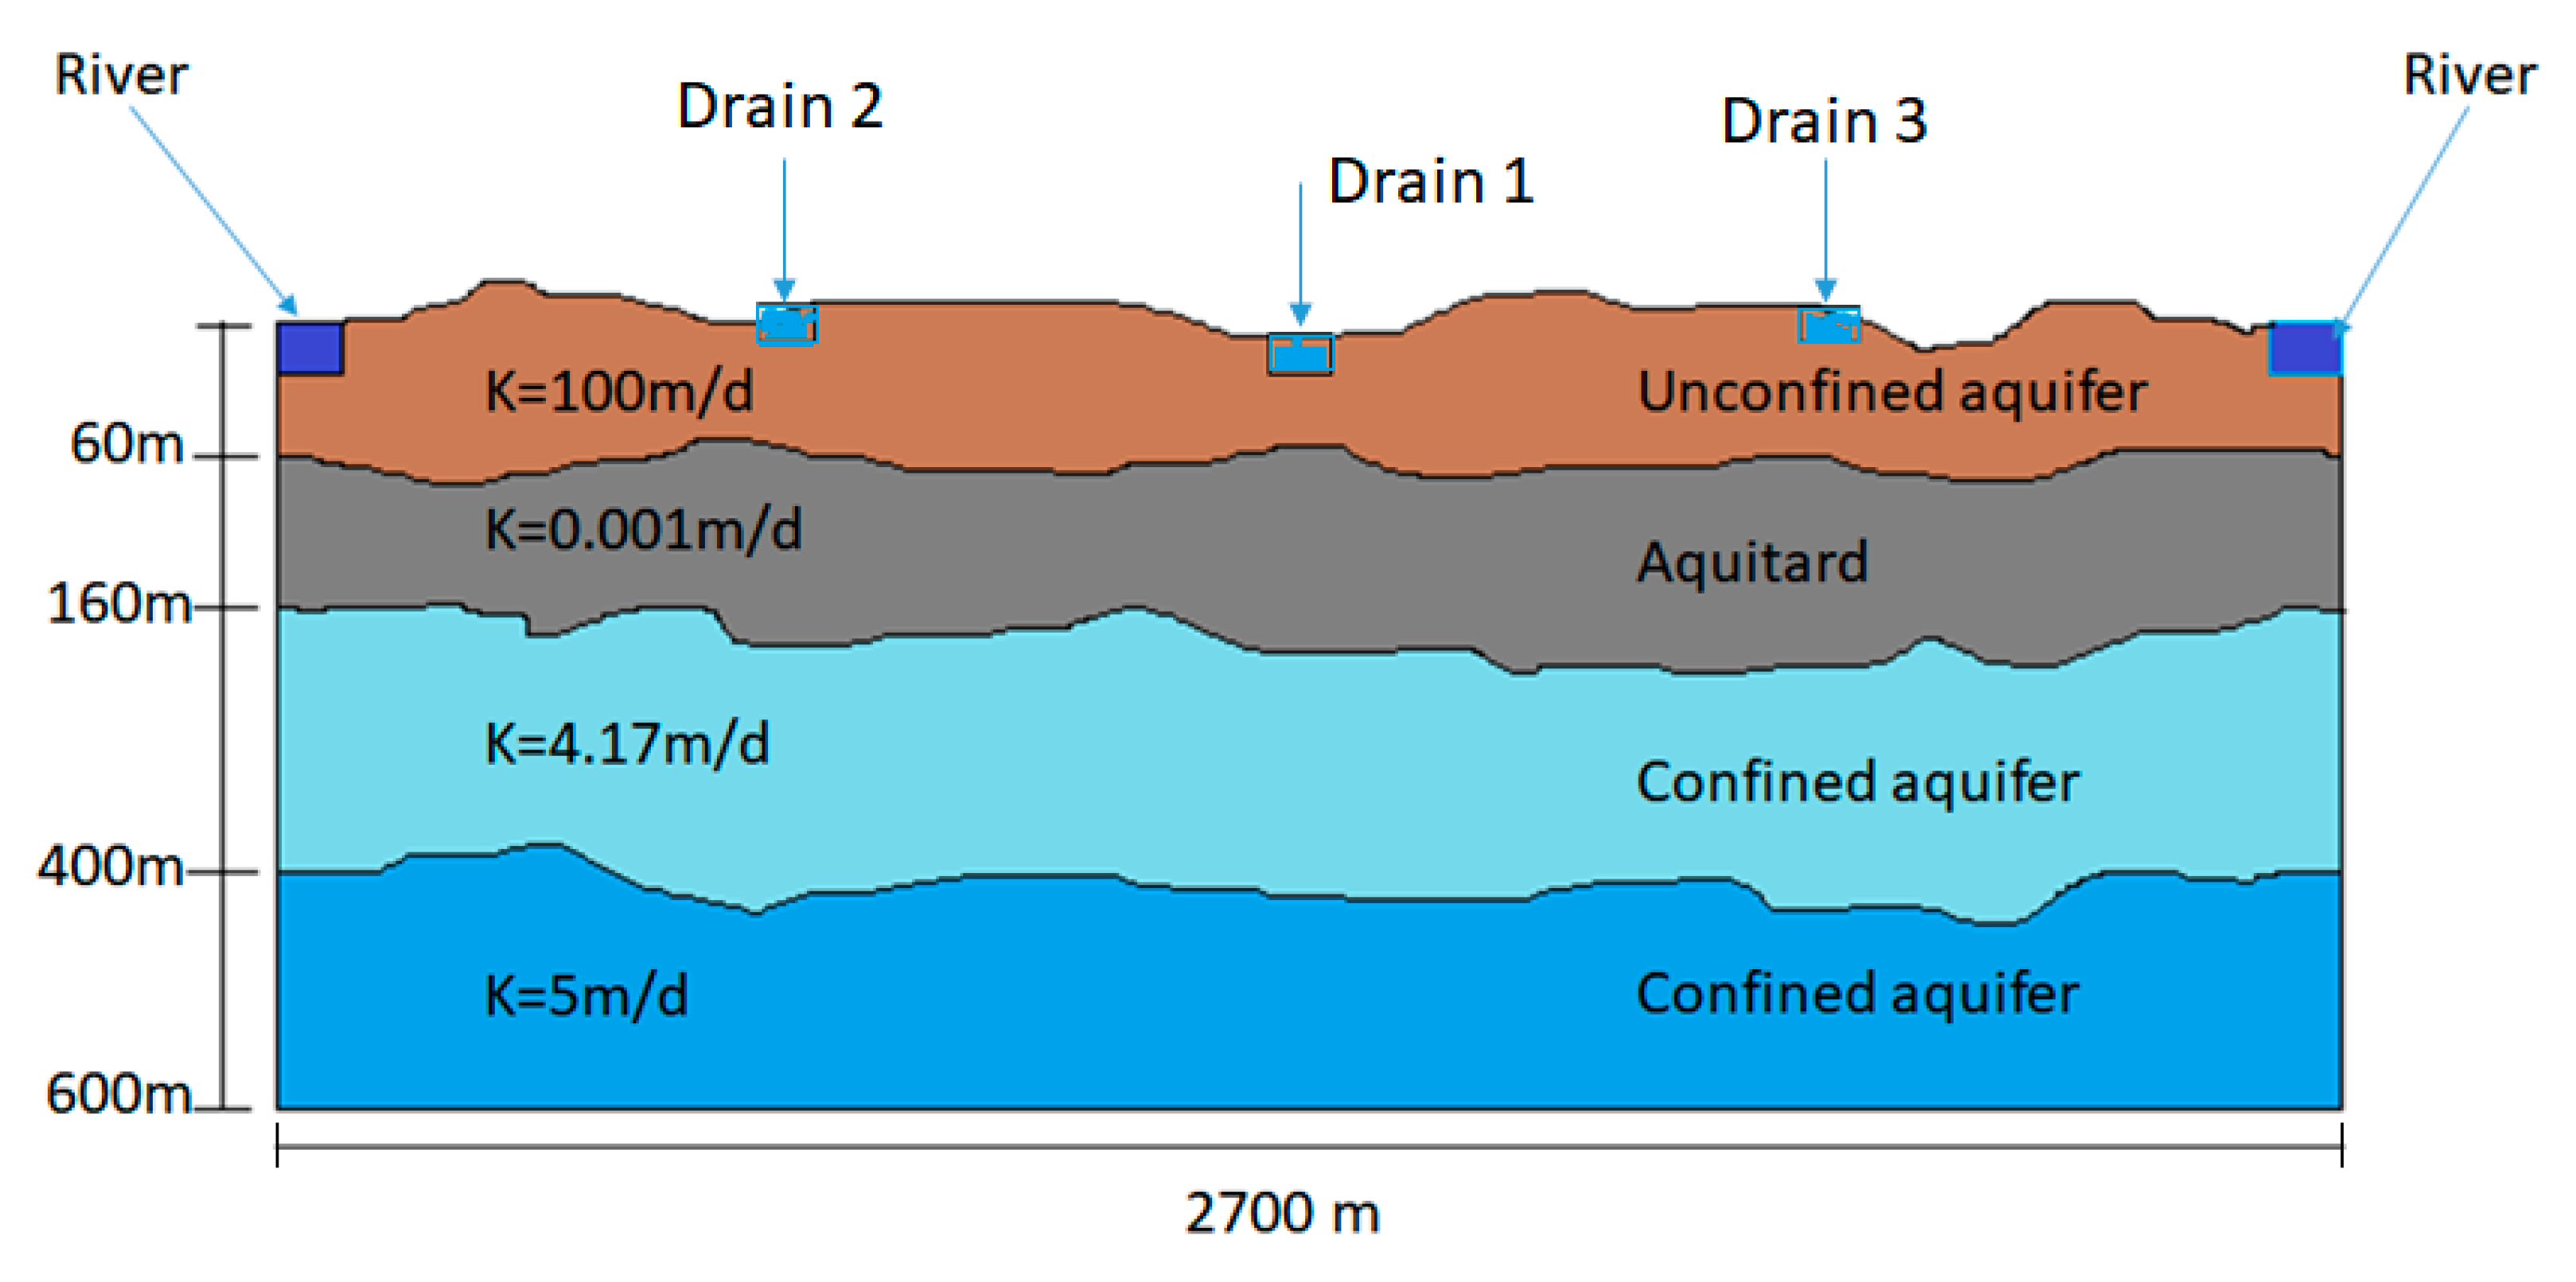
2.2. Model Description and Setup

MODFLOW-2005 [43] was used for groundwater flow simulation in this study. The MODFLOW model is a United States Geological Survey (USGS) modular finite-difference flow code which solves the groundwater flow equation [46] as shown below.
x [ K x x h x ] + y [ K y y h y ] + z [ K z z h z ] + W = Ss   h t ,
where K x x , K y y , K z z = Hydraulic conductivity along x, y, and z directions (L/T); h = Potentiometric head (L); W = Volumetric flux per unit volume representing sources and/or sinks of water (T−1); Ss = Specific storage of the porous material (L−1); and T = Time (T).
The study area is in the coastal regions of West Bengal where alluvium of recent to Pleistocene age and tertiary sediments form the principal aquifers [47]. The shallow aquifer within 50 m below ground level is mostly saline. They are formed by recent levee deposits and are not regionally continuous. The major focus of this study is on this shallow aquifer. This aquifer is separated from the deeper aquifers by a thick clay layer. The second and third aquifer together extends up to 360 m below ground level (bgl). These deeper aquifers are regionally existing and have complex hydro-stratigraphy often separated by different number of clay layers. However, simulation of flow in these deeper systems were of lesser importance in our study, and hence, these deeper layers were simplified in two model layers. The resulting model has four layers representing the unconfined aquifer, aquitard, confined aquifer 1, and confined aquifer 2.
Figure 2 shows a conceptual 2D cross-sectional view of the sub-surface layers in the study area, prepared based on available literature. The total stretch of the cross-section is 2700 m in length bounded by 2 rivers at the ends. A model with 54 columns and one row each of 50 m length is set up using the ModelMuse [48] graphical user interface. The hydrostratigraphy comprised four layers at average depths of 60 m, 160 m, 450 m, and 600 m below ground level based on report on the Status of Groundwater Quality in Coastal Aquifers of India, 2014 [47]. The bottom two layers were considered as confined aquifers, whereas the 1st layer was considered an unconfined aquifer. The simulation was set to output data at monthly intervals. The specific details of model conceptualization and initial parameterization are shown in Table 1. The following assumptions were used to simplify the conceptualization of the aquifer system:
  • It was assumed that all piezometers are inline along the selected cross-section. This assumption is reasonable considering the relatively flat topography and water table in the island;
  • Given the flat topography, layer depths throughout the cross-section are assumed to be the same;
  • Hydraulic properties were assumed to be homogenous within each layer;
  • Rainfall and evapotranspiration were assumed to be acting uniformly over the cross-section.
Temporally varying groundwater recharge was assumed to be a fraction of the rainfall on the island. Similarly, the groundwater discharge occurring due to the consumptive use of crops and other vegetation was assumed to be a fraction of the actual evapotranspiration. Aquifer interaction with the river along the boundaries of the island was represented by using the head-dependent flux boundary condition represented using the river package (RIV) of MODFLOW. The overall methodology used in this study is shown in Figure 3.
A steady-state model was set up initially to conceptualize the model system using long-term average values of evapotranspiration, recharge, and river stage as inputs. Recharge was initially assumed as potentially up to 30% of rainfall occurring over the area. Recharge in this context considers recharge from rainfall, leakage from ponds, and irrigation [50]. Subsequently, the time series data of rainfall and evapotranspiration were used to provide inputs for the transient model run for the period from 1966 to 2016. This long-term simulation was used to generate the head distribution in the shallow aquifer for the base case scenario.

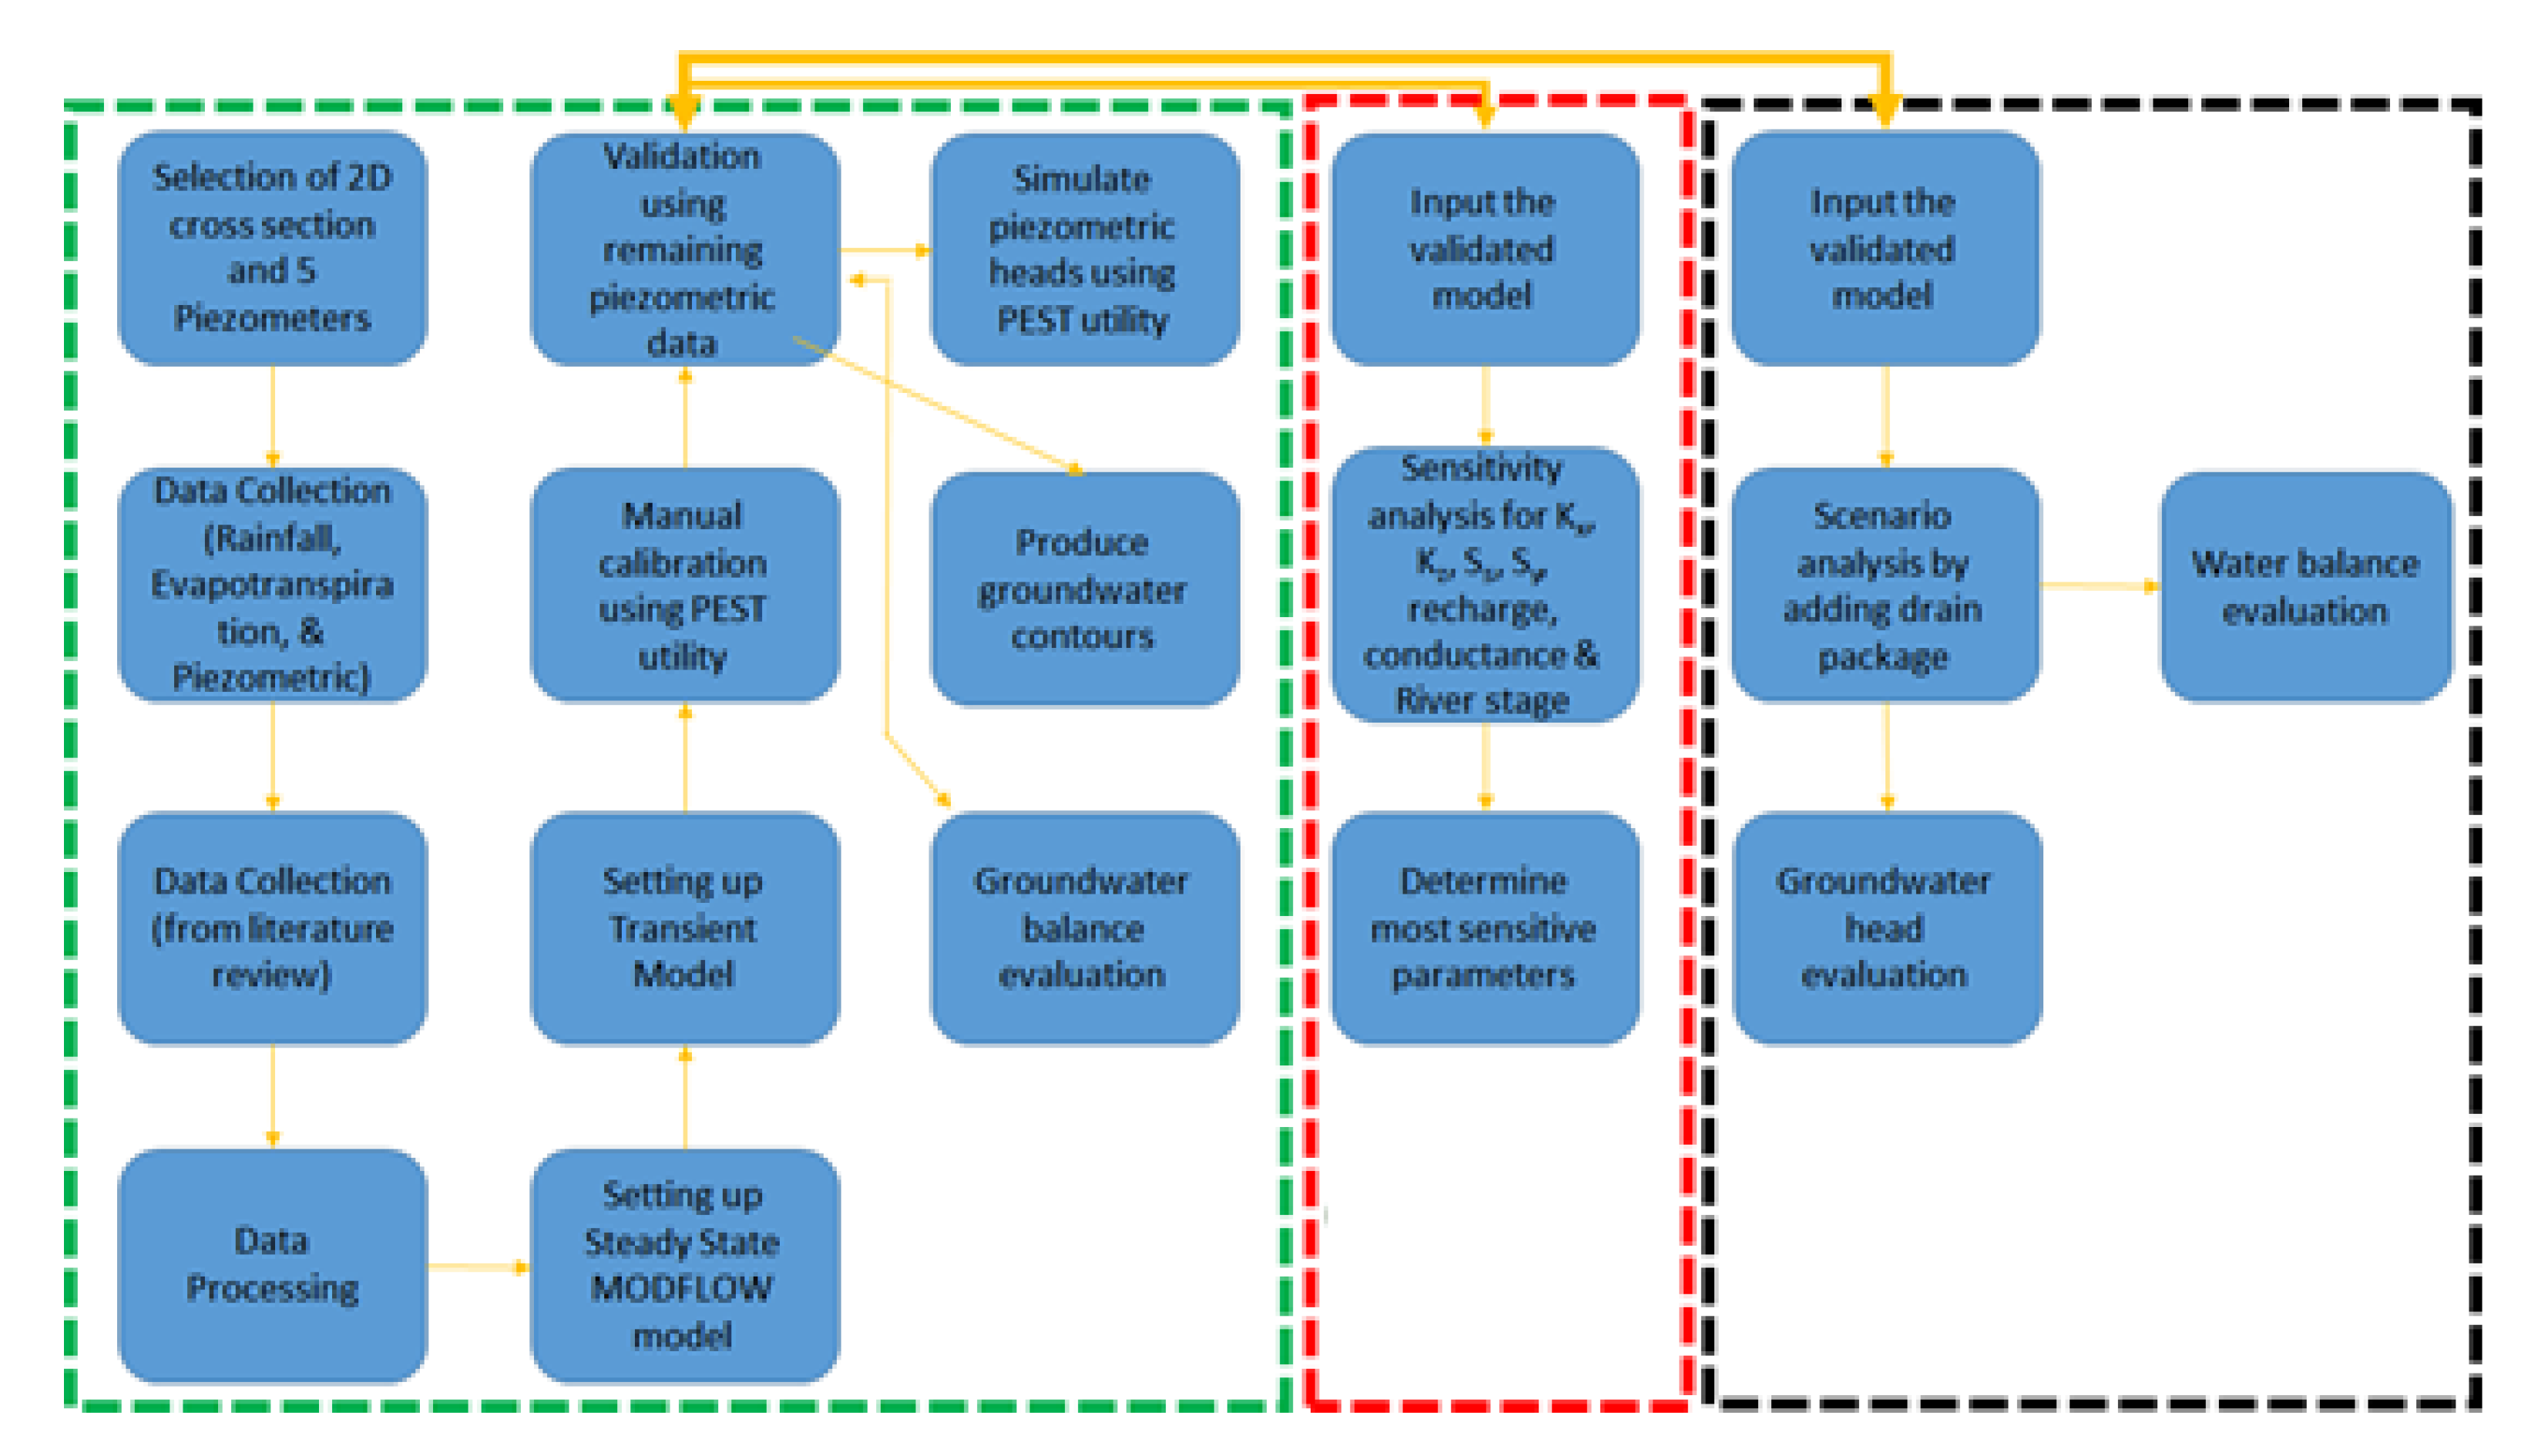
2.3. Model Calibration, Validation, and Sensitivity Analysis

A limited amount of observed groundwater level data was available from the shallow monitoring bores to calibrate the model. The calibration and validation of the model was done by comparing simulated heads with observed hydraulic head data (February 2017–January 2019) obtained from the Central Soil Salinity Research Institute (CSSRI), Canning Town, West Bengal, measured at specific piezometer locations in Gosaba Island (Figure 1). A total number of 47 readings were available during the 15 February 2017 to 29 January 2019 period, out of which 65% (31 values) was used for model calibration and the remaining 35% (16 values) is used for validation purpose. The calibration performance was evaluated based on statistical indices like root mean square error (RMSE), the Nash–Sutcliffe coefficient of efficiency (NSE), and coefficient of determination (R2). Parameter sensitivity analysis helps to find out which parameters have the most critical effect on the model prediction. Several approaches are available in literature to do sensitivity analysis ranging from simple manual sensitivity analysis to computationally intensive non-linear sensitivity analyses techniques which are computationally demanding [53]. In our study, sensitivity analysis was done for analyzing the influence of selected parameters relative to each other on the model calibration results. The one-at-a-time approach was used for undertaking the sensitivity analysis. In this commonly used approach, one parameter is varied and other parameters are all kept at the calibrated base value to investigate changes in the model output. Subsequently, this parameter is returned to its nominal value and other parameters are varied one-by-one until all parameters are evaluated in this manner.

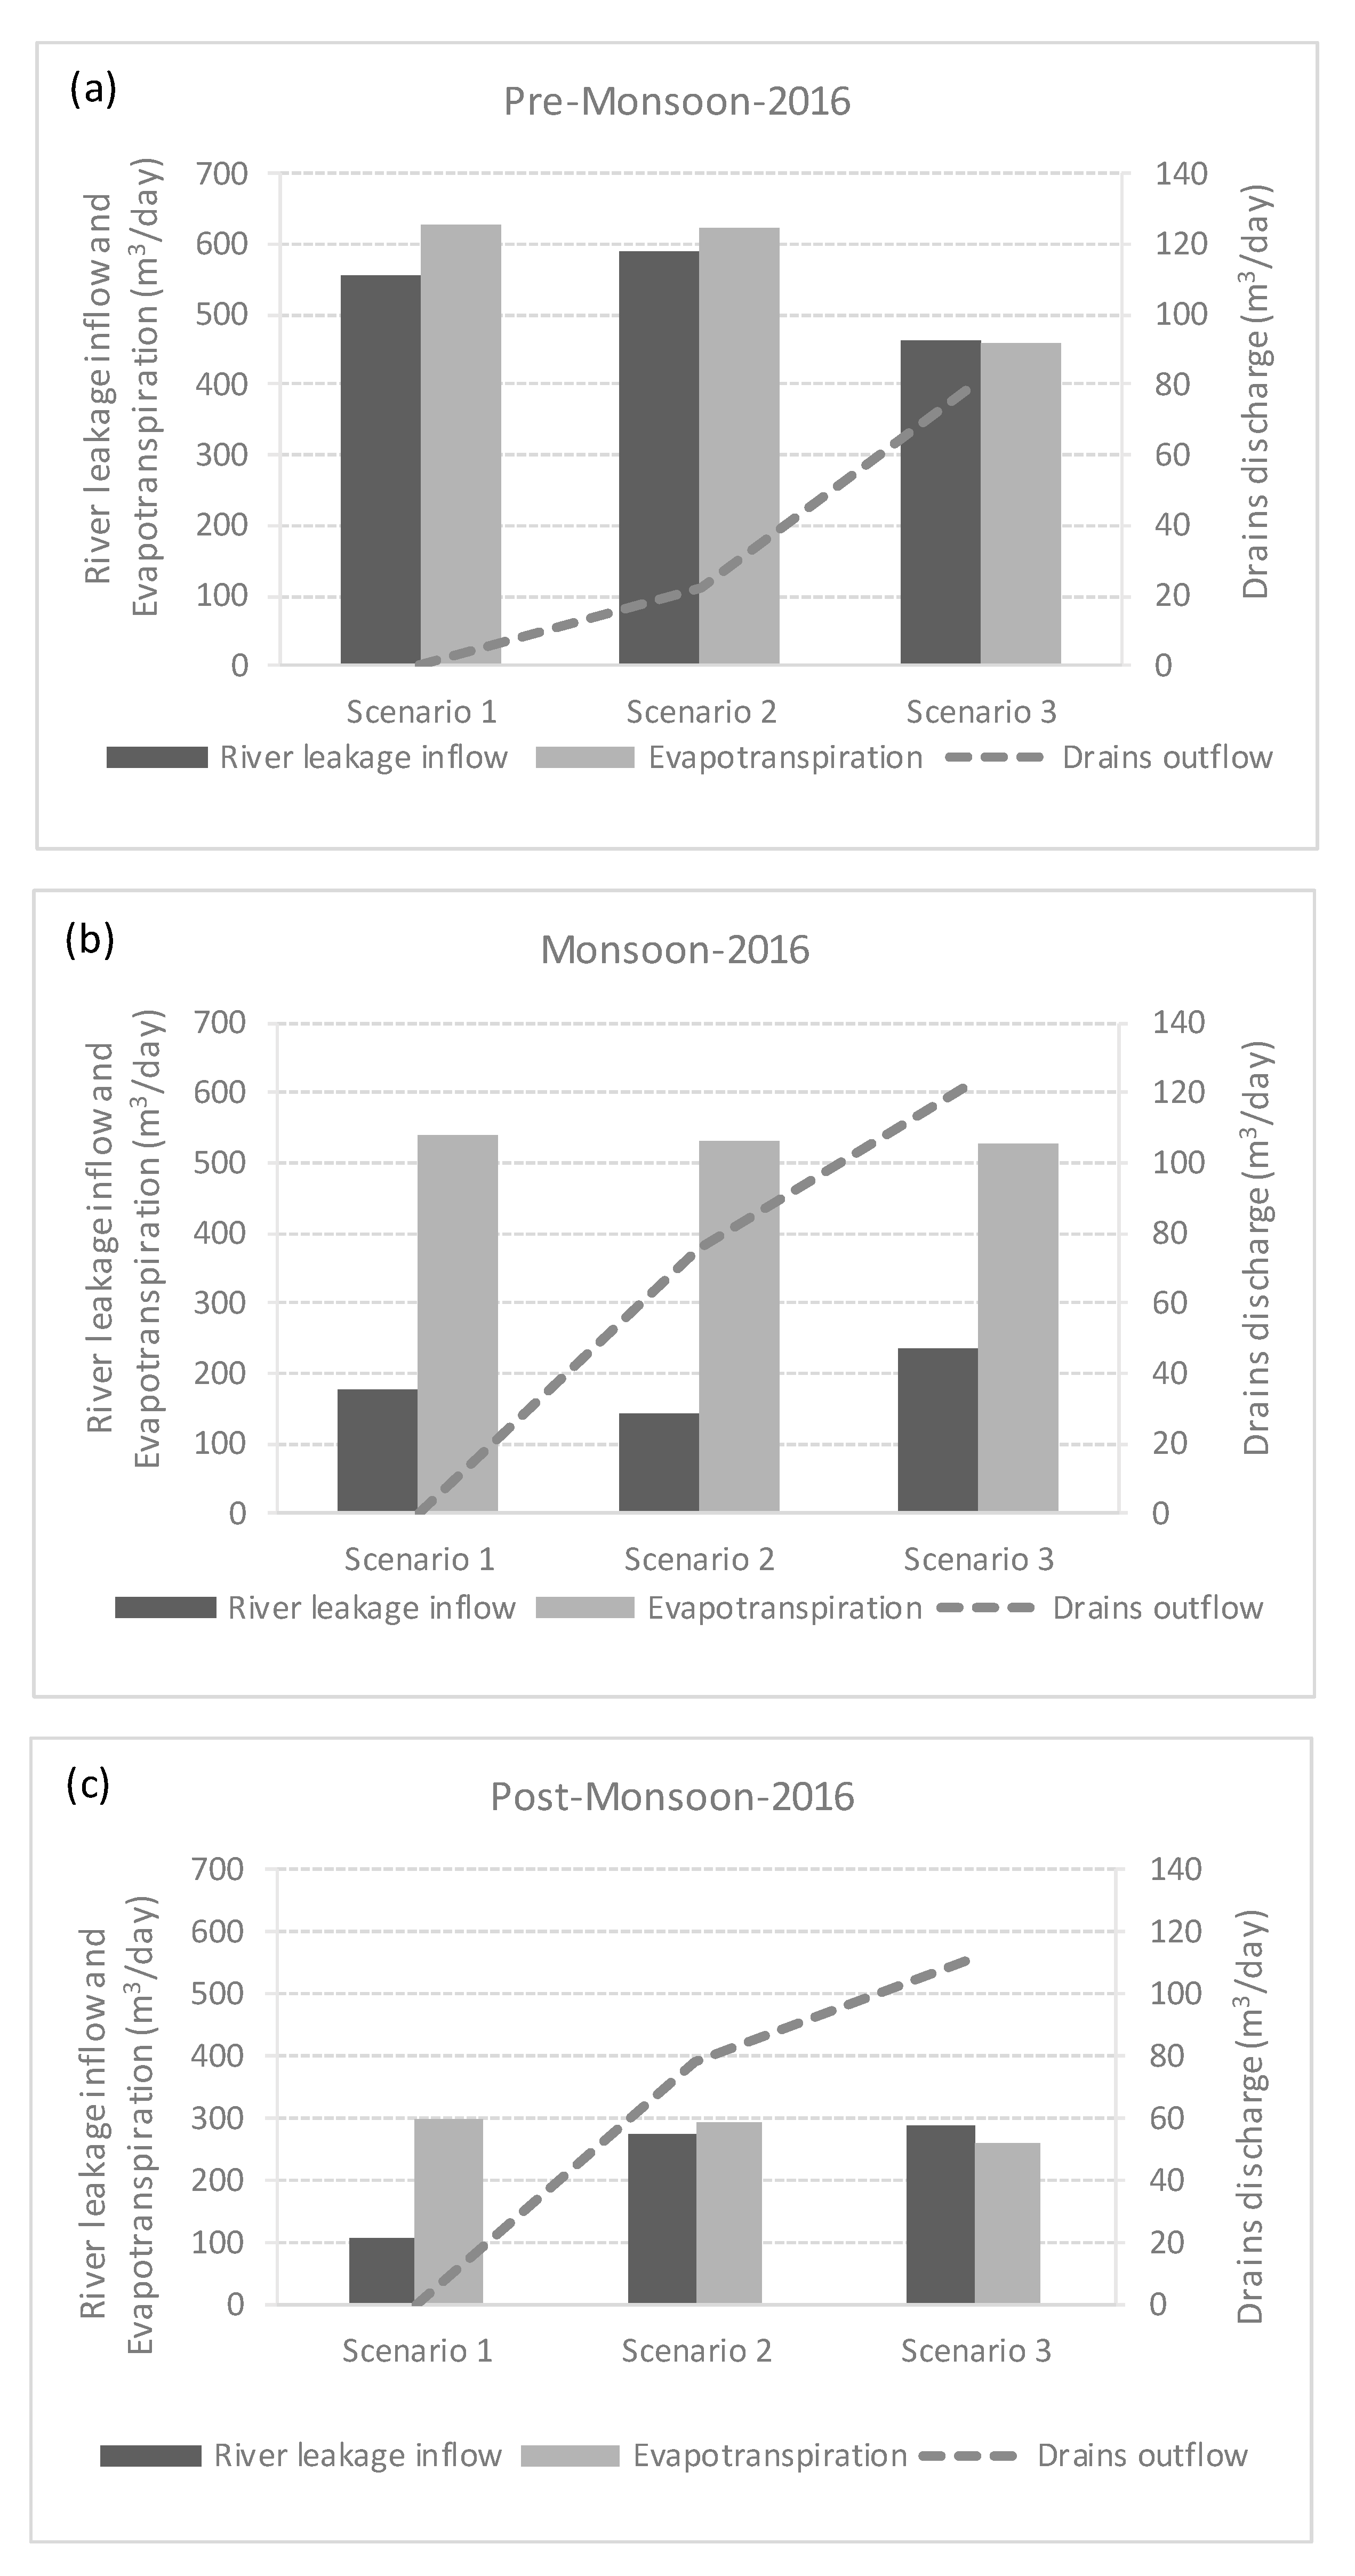
2.4. Scenario Analysis

In islands like Gosaba, where shallow groundwater table leads to water logging and salinity issues, surface drains can significantly influence the shallow groundwater balance and water table depth to reduce water logging conditions [54]. To study how surface drainage channels influence the shallow aquifer water balance, conceptual drain scenarios were evaluated using the calibrated and validated MODFLOW model. Three scenario analysis were considered.
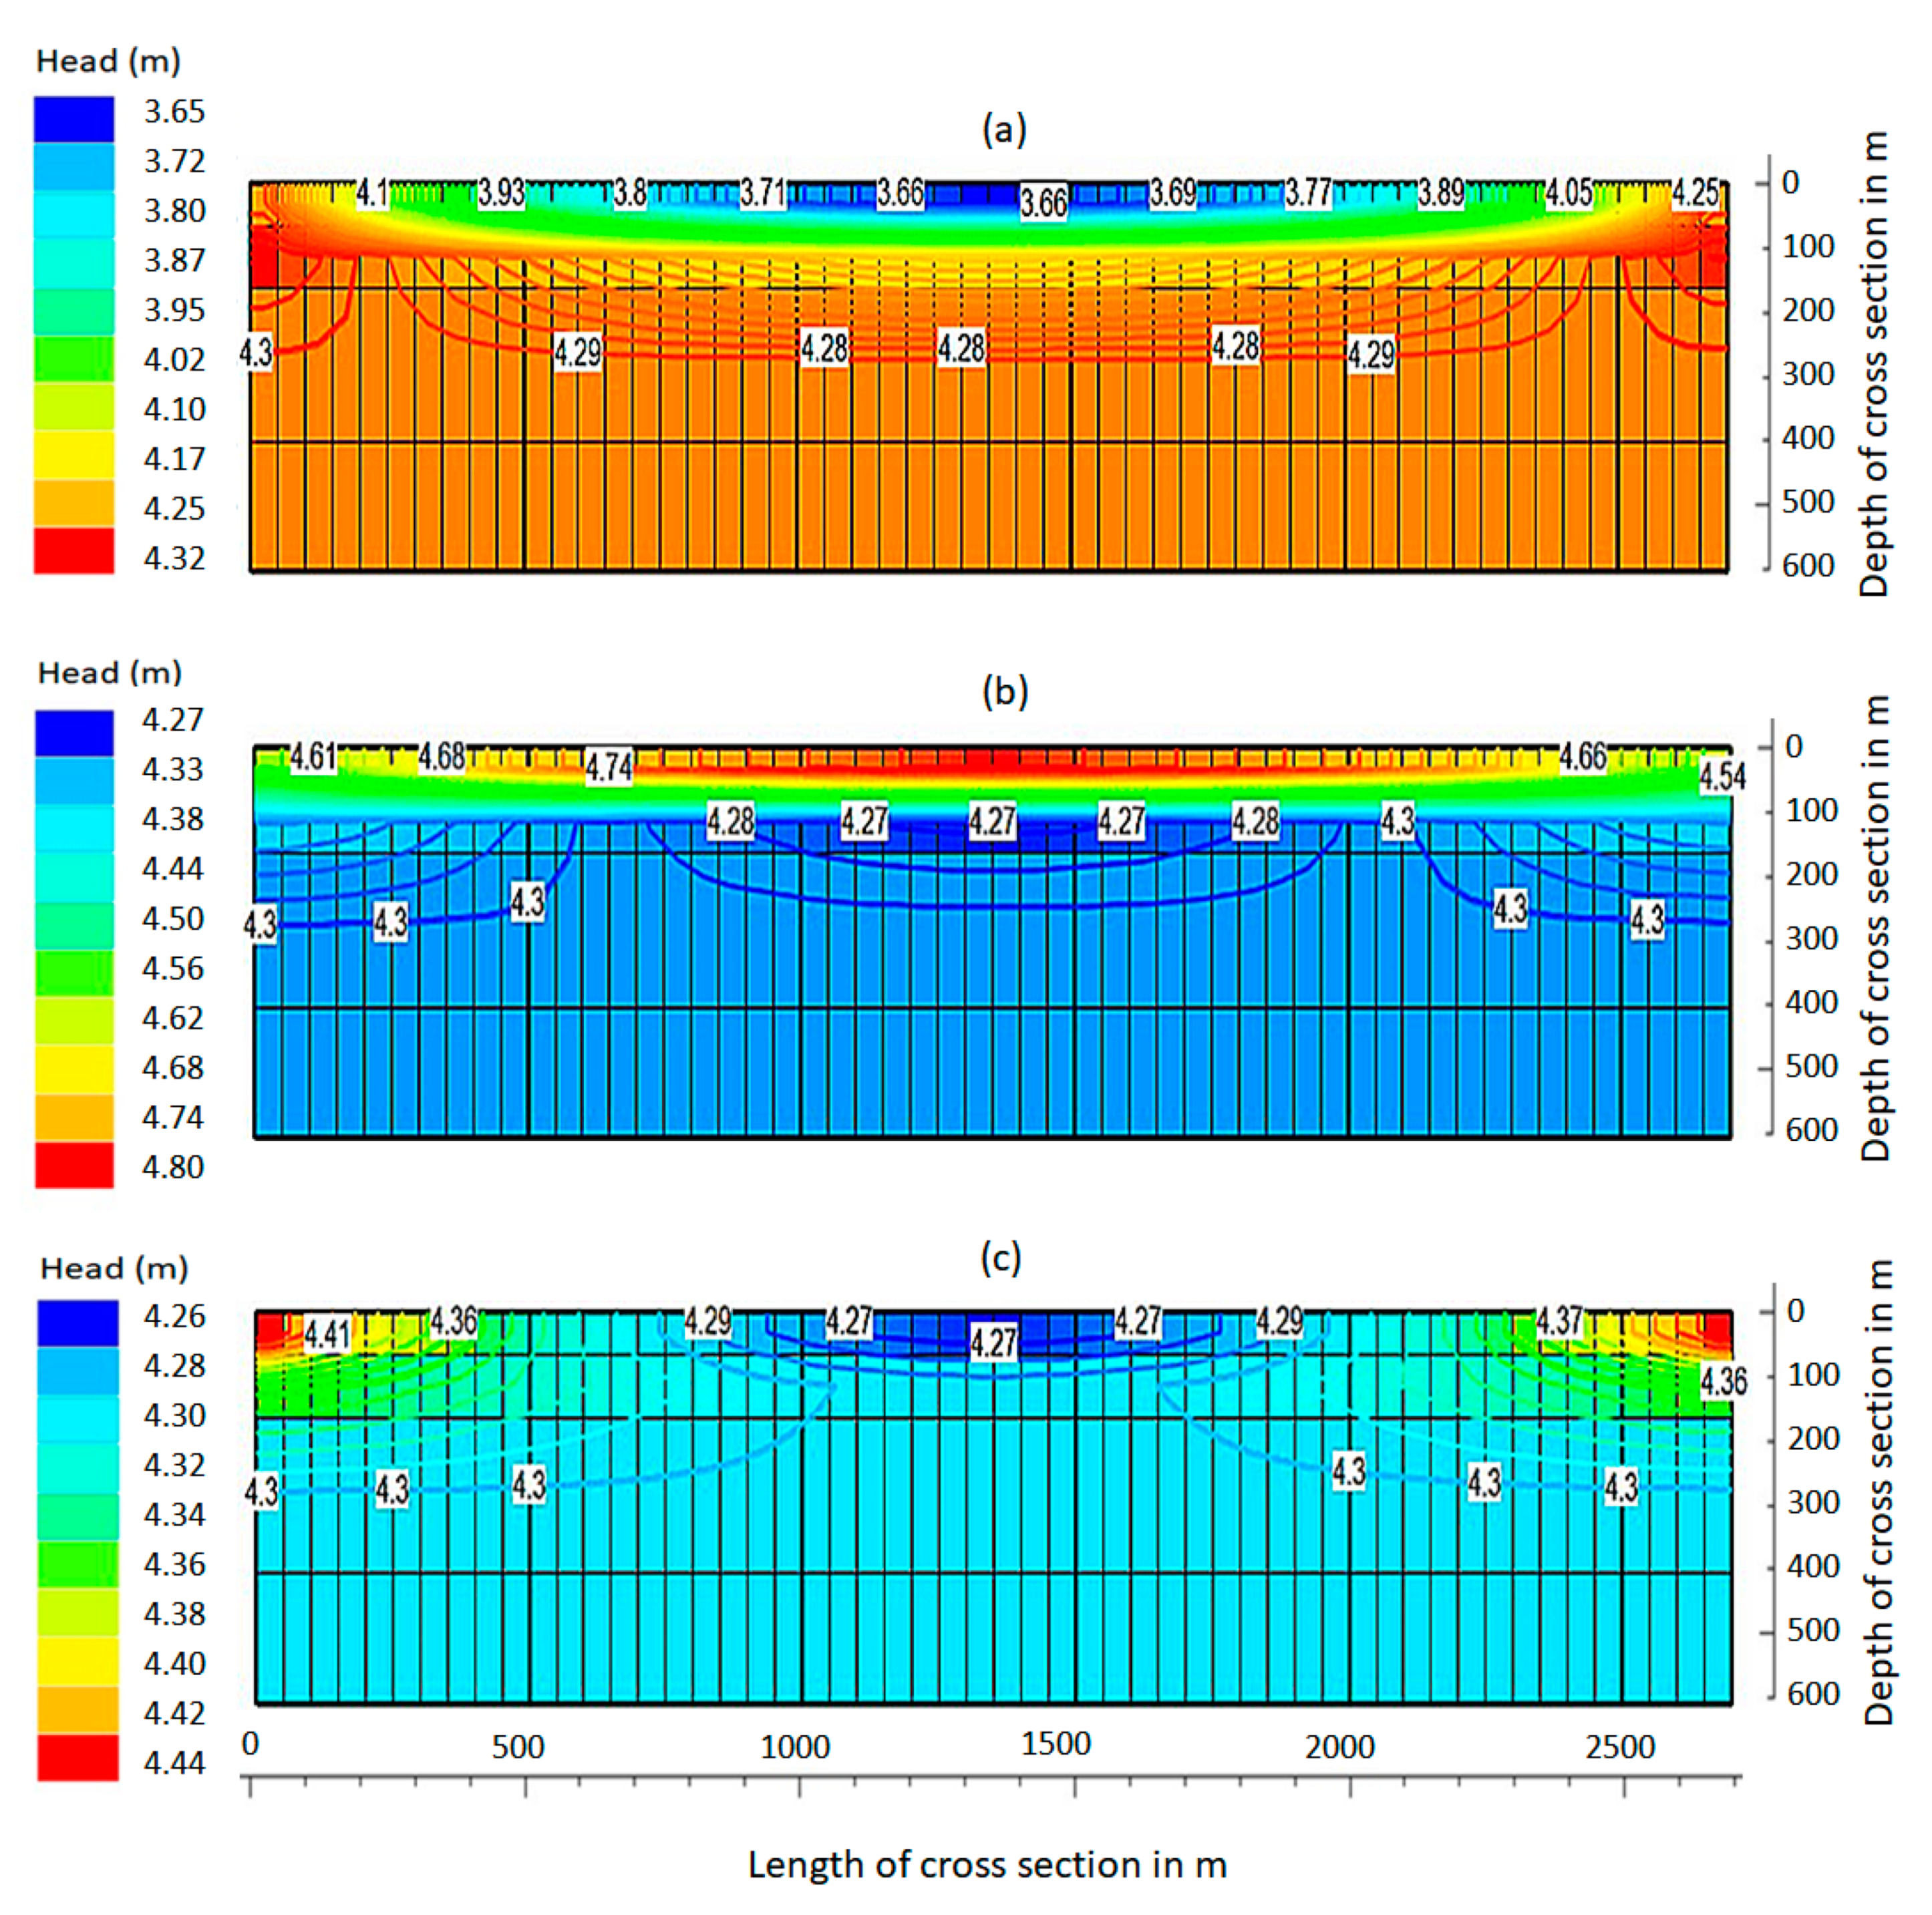
  • Scenario 1: Base case—without the drains. This reference calibrated and validated the model of the current condition. This was used for comparison, to see how the presence of surface drains help to lower the water table from the root zone in dry/wet seasons, and to provide an idea about the optimum number of drains required for this purpose;
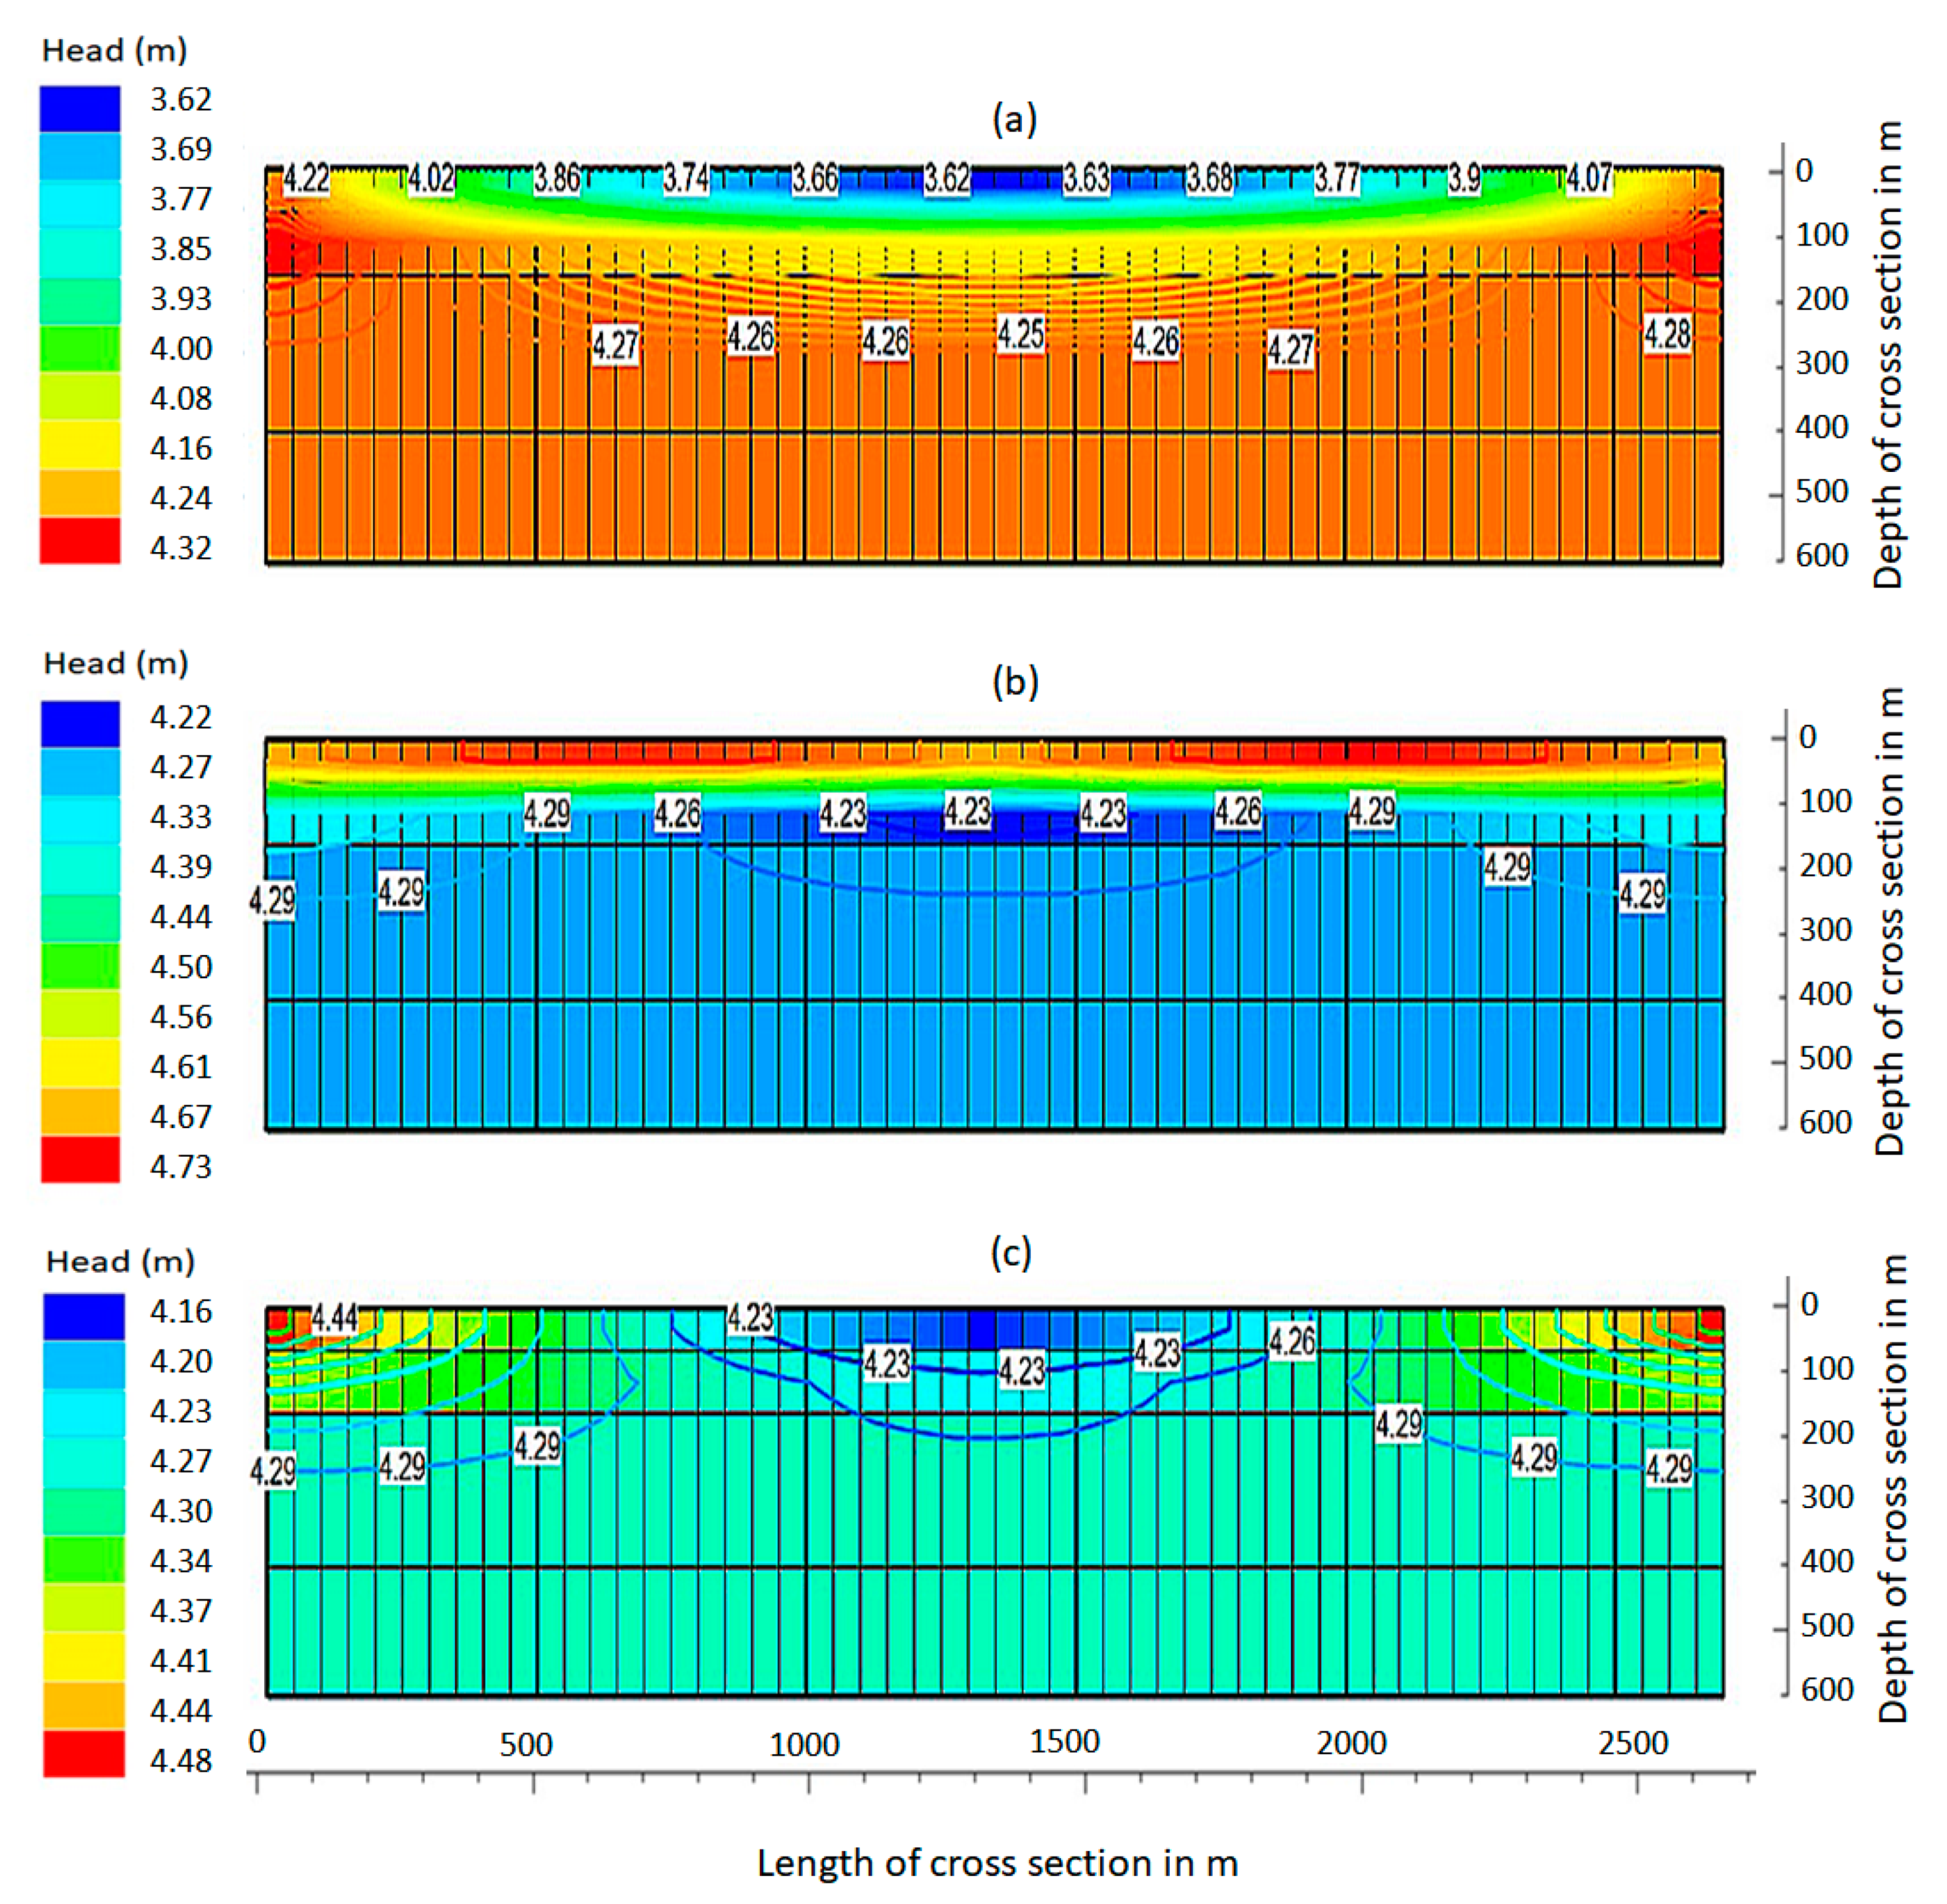
  • Scenario 2: Single drain in the middle of the modelled cross-section. The single drain was introduced at the middle of the cross-section of the model. The drain elevation was set at 1.5 m below ground level, width was specified as 3 m, and a conductance of 100 m2 day−1 was assigned;
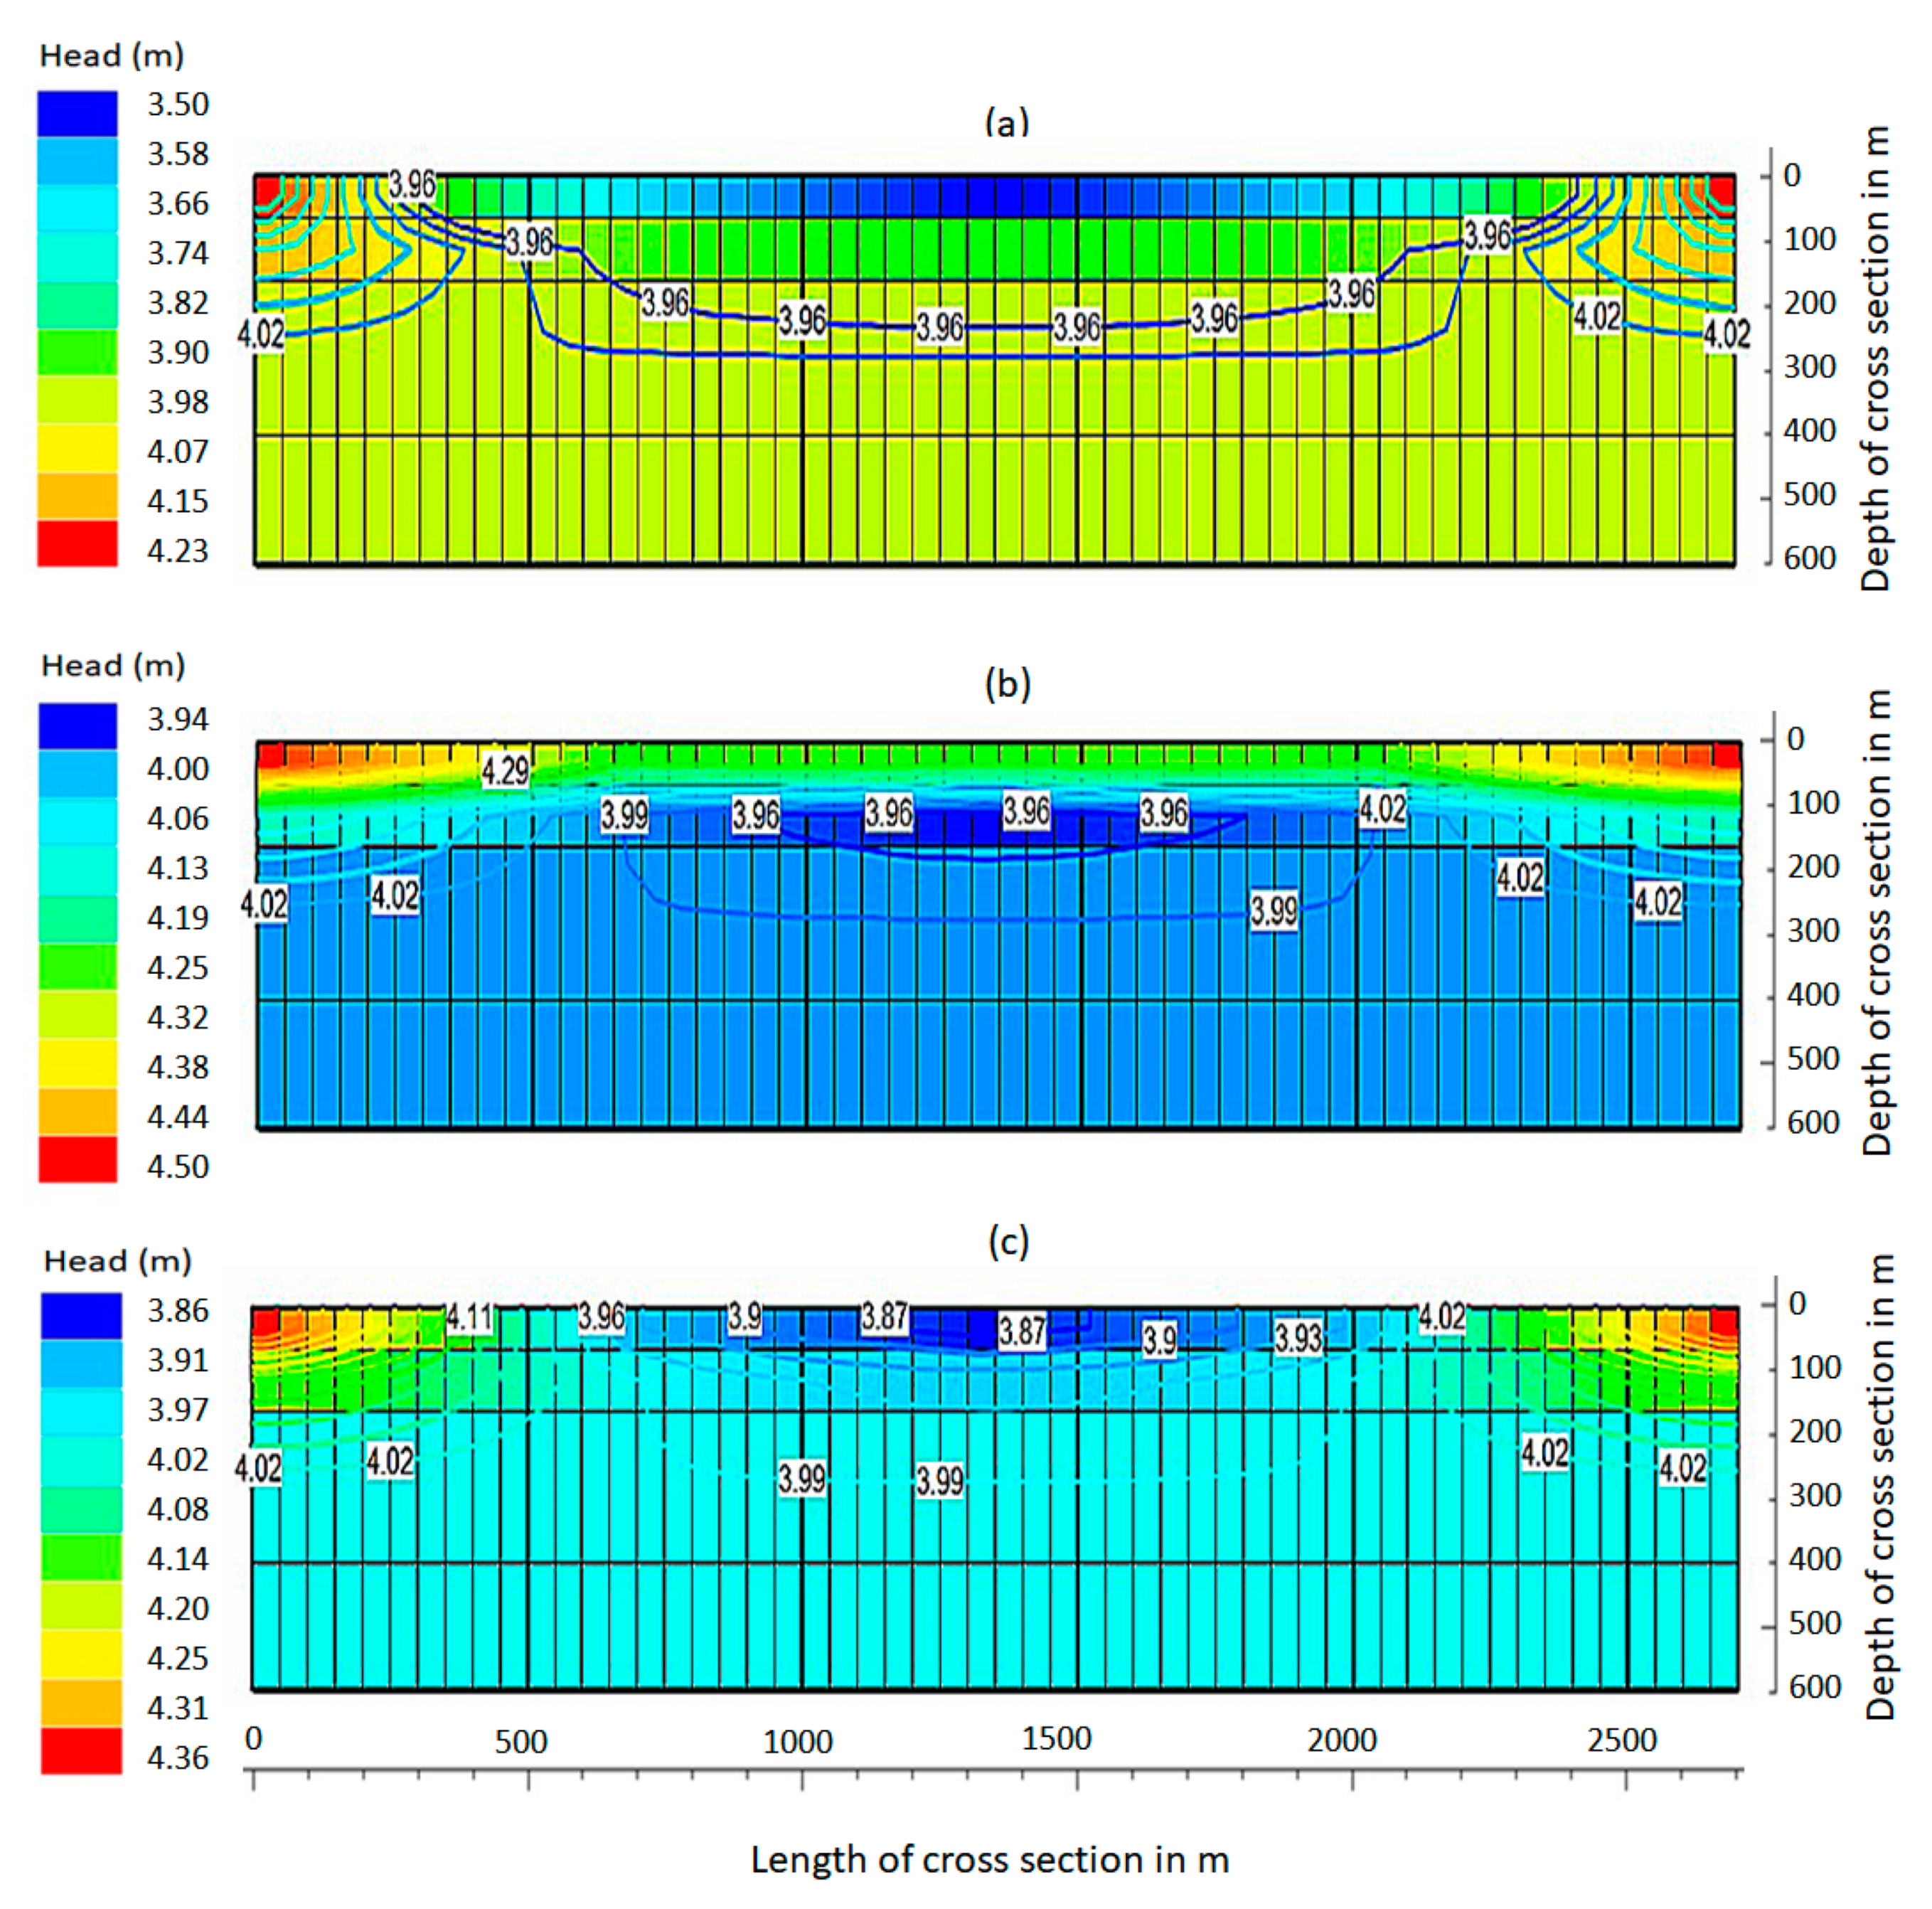
  • Scenario 3: Multiple drains. In multiple drains, three drains were introduced at a spacing of 675 m with the same width, depth, and conductance as above.

3. Results and Analysis

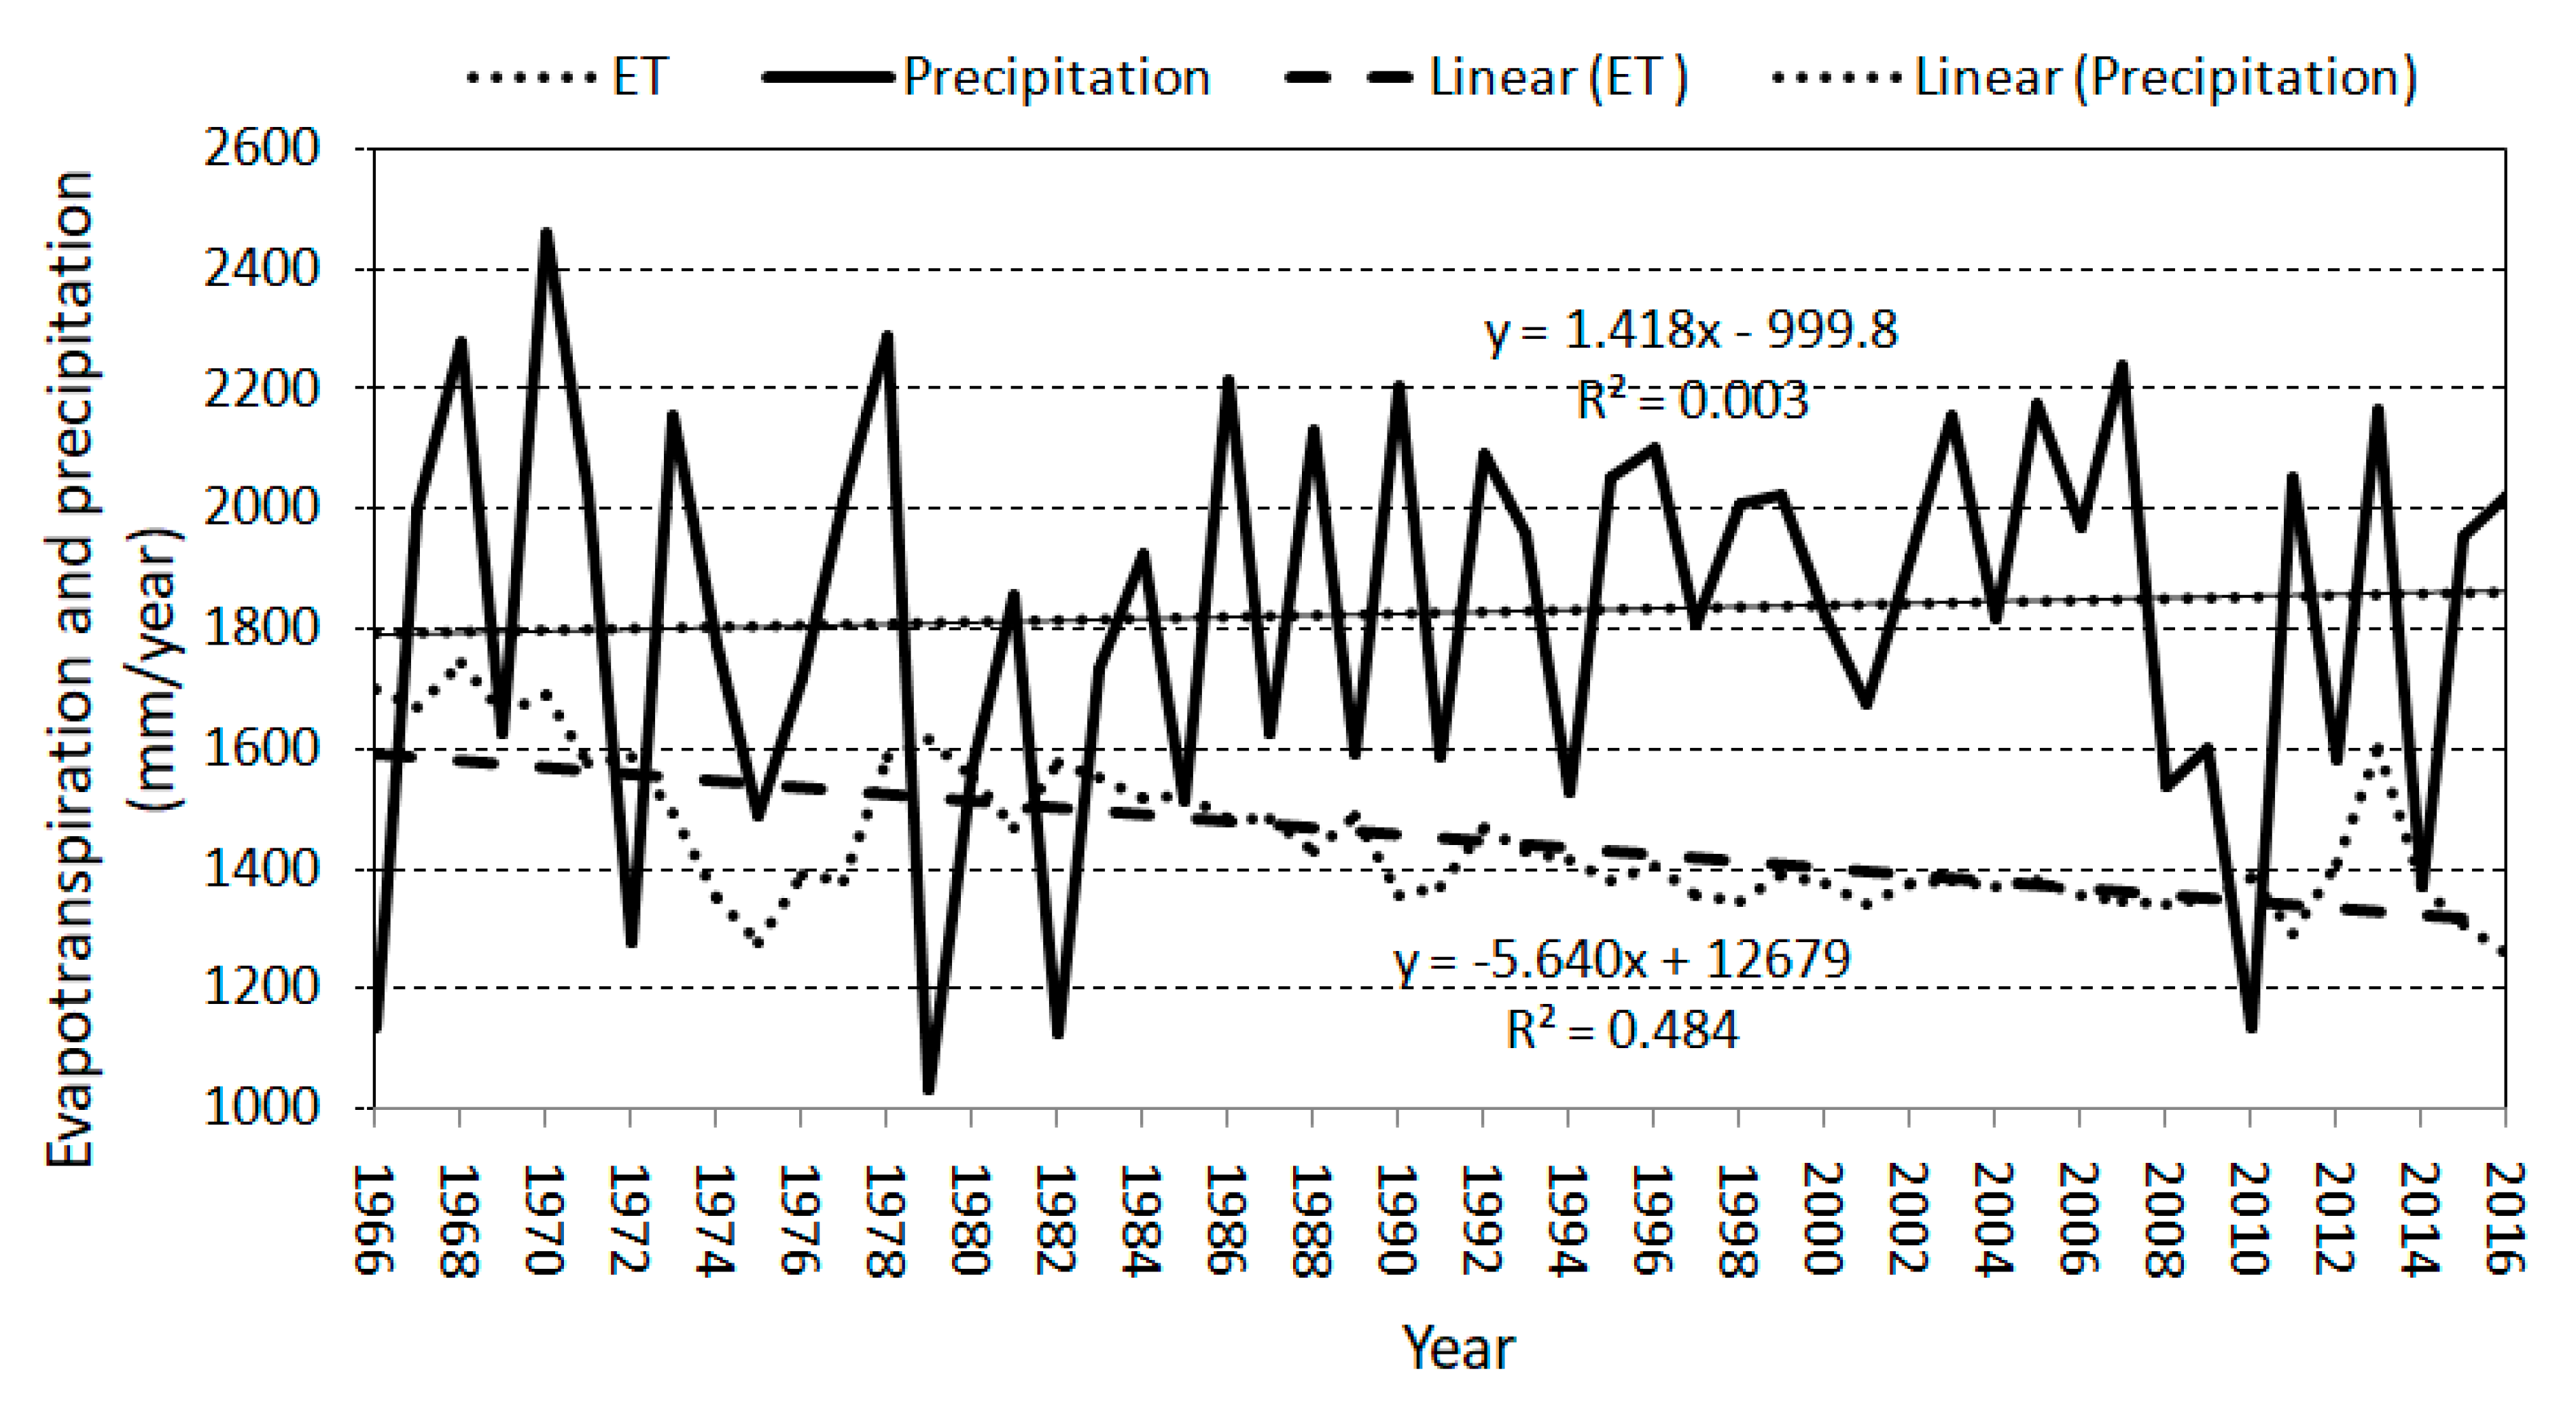
3.1. Time Series Analysis

Data analysis was performed to see the long-term variation of ET and precipitation in the study area. Figure 4 indicates that there is a slight positive trend for recharge as it is chosen as a function of precipitation, whereas the evapotranspiration shows a negative trend. The 1966–2016 period trend indicated that the annual average precipitation was increased by 21.2 mm and the annual average ET was reduced by 282 mm by the year 2016 (i.e., an increase of 0.424 mm/year in precipitation and decrease of 5.64 mm/year in ET). Increased rainfall and decreased ET may potentially impact the island by increasing the chances for sub-surface water logging during the dry seasons. Combined with this, sea level rise due to climate change can potentially reduce the natural drainage of the Gosaba Island [6,55]. Maintaining productive agriculture, in such circumstances, would demand for artificial drainage mechanisms and such an implementation would help to improve the salinity scenario in the region. A seasonal comparison indicated that the evapotranspiration rate in the pre-monsoon season is the highest compared to the monsoon season and post-monsoon season (Figure 4). The precipitation data from the Canning Town weather station (collected and maintained by CSSRI co-authors) has indicated that more than 80% of precipitation is occurring during the monsoon season and the recharge from rainfall would be lowest during the pre-monsoon season.

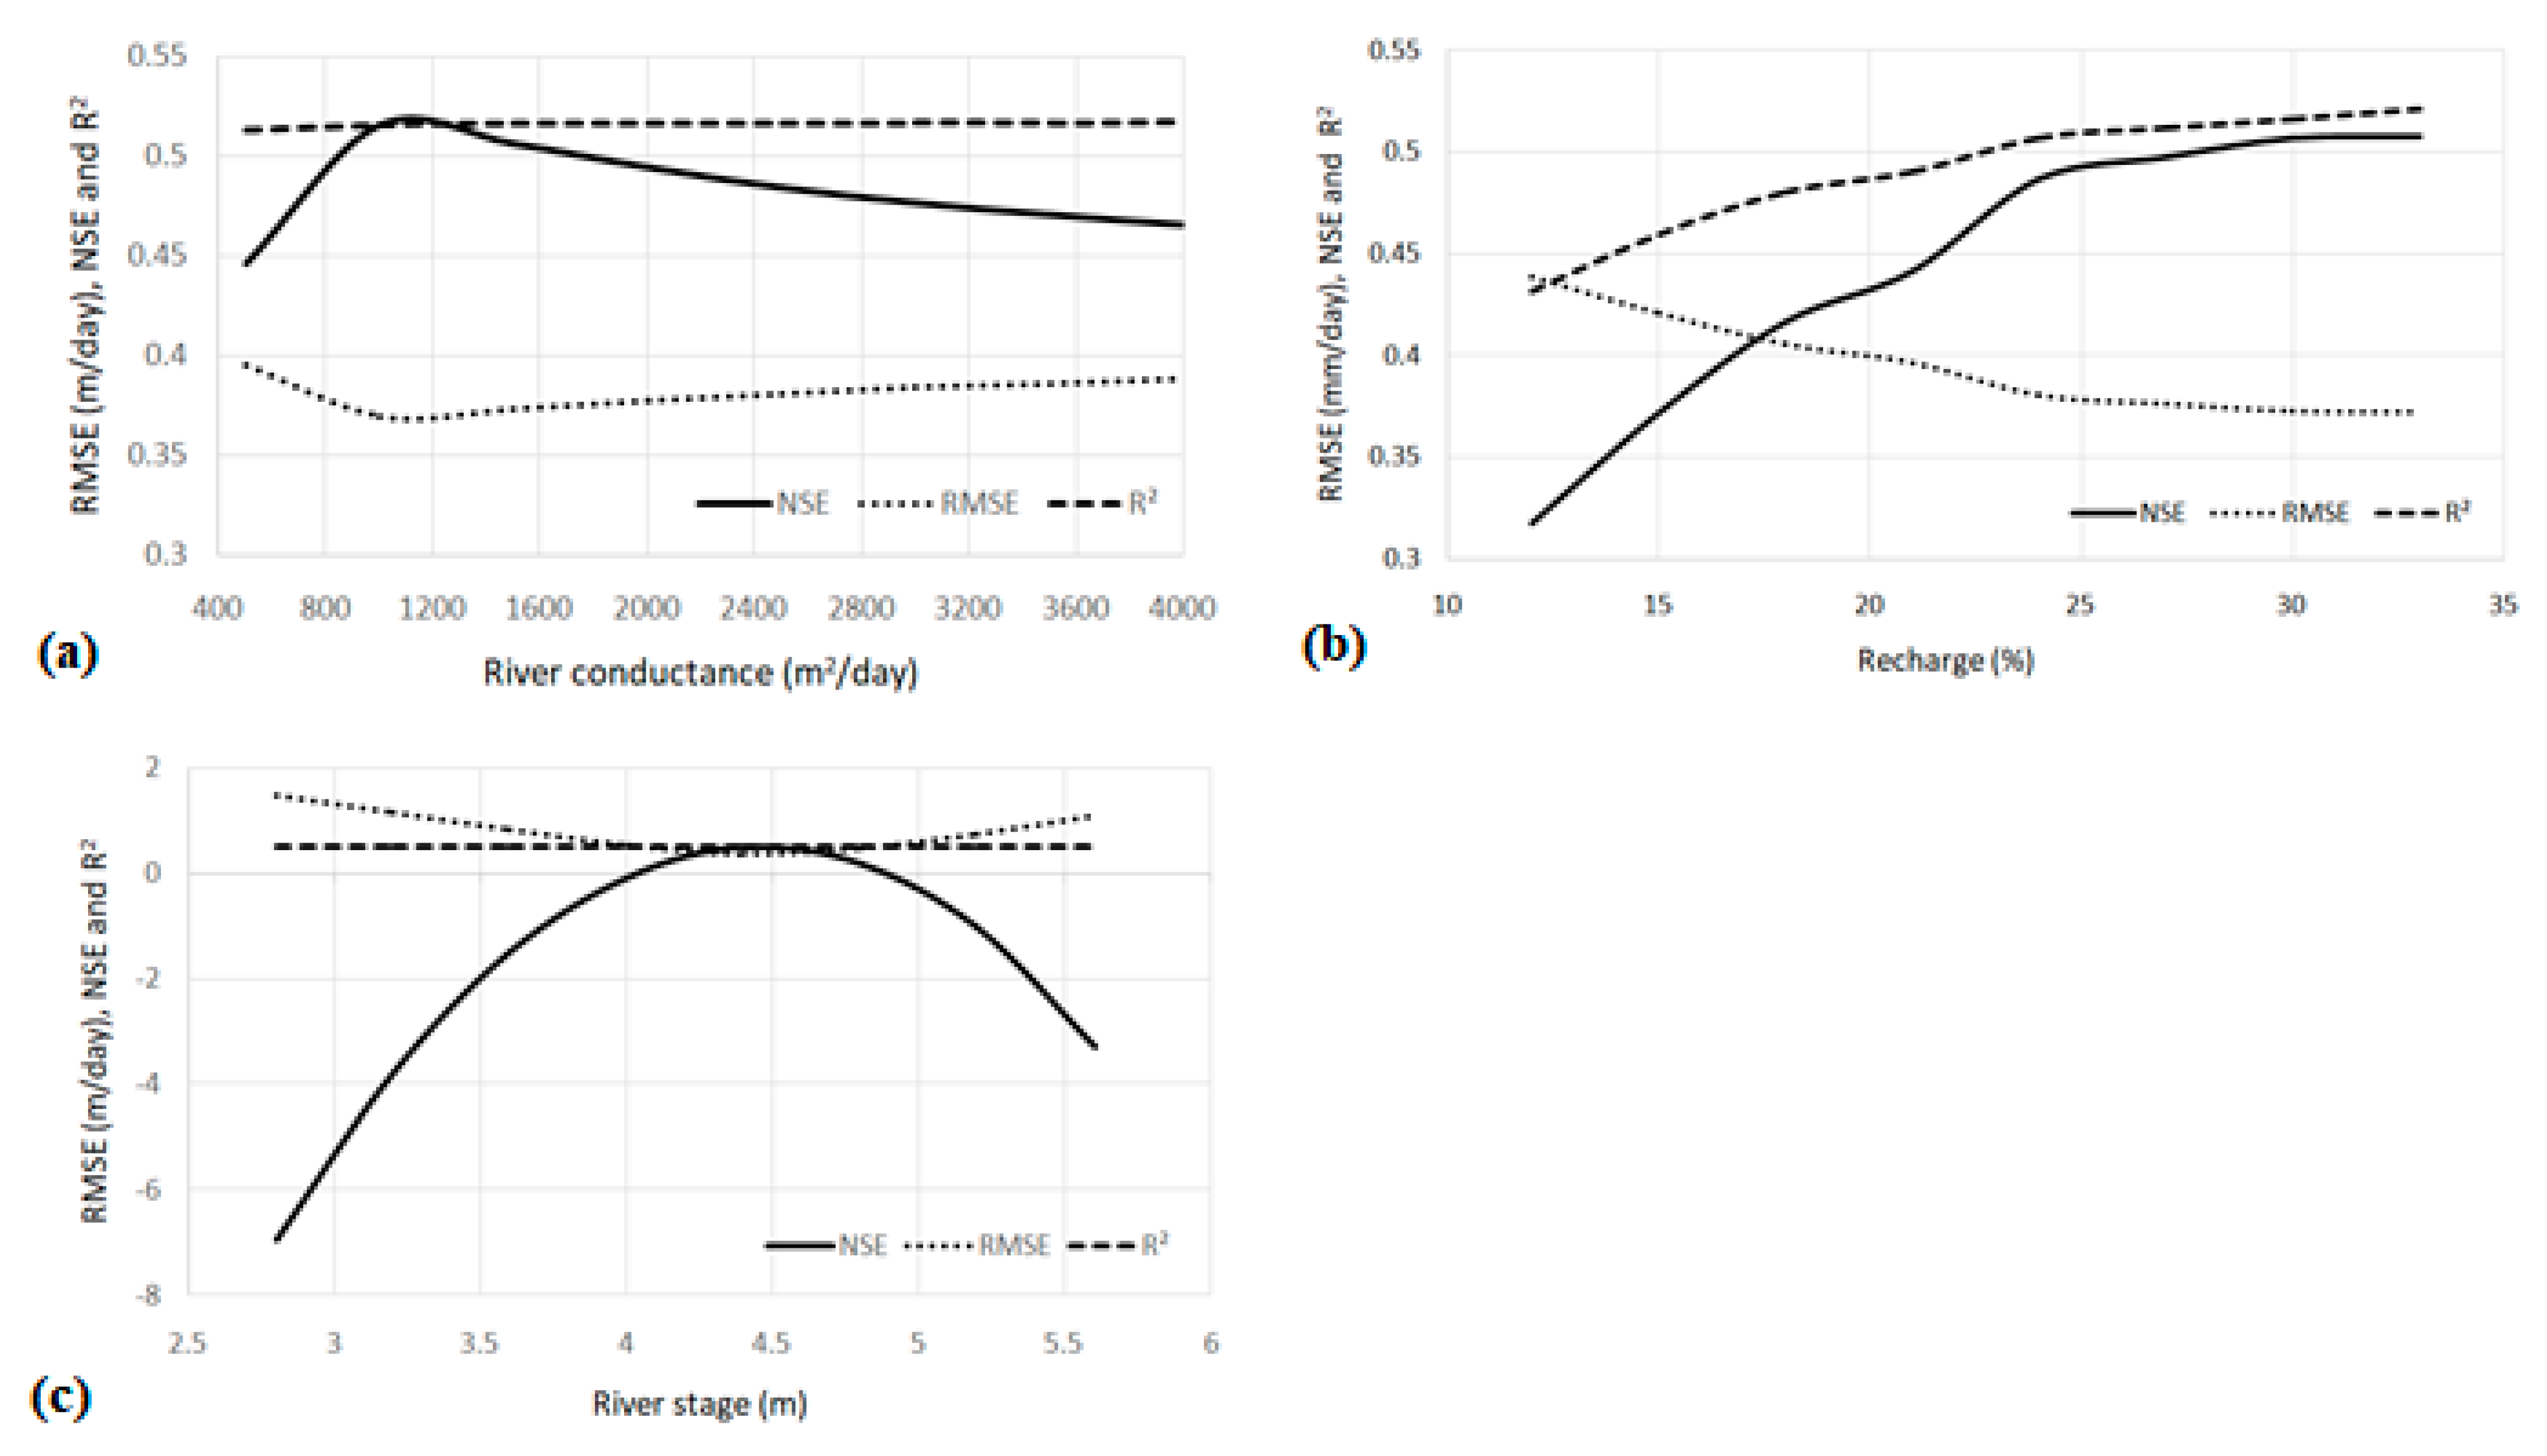
3.2. Parameter Sensitivity Analysis

Sensitivity analysis was undertaken to quantify the sensitivity of the model prediction to the parameters and to identify the most sensitive parameters influencing shallow groundwater in the Gosaba Island. To identify the parameter sensitivity across all bores, sensitivity was analyzed for the R2, NSE, and RMSE of water level simulations in all five observation bores. The calibrated best parameters and sensitivity analysis ranges used for this study are shown in Table 1. Sensitivity analysis was undertaken for parameter values within the calibration range. The parameter ranges used were (i) 70–140 m day−1 for Kx (Layer 1), (ii) 7–14 m day−1 for Kz (Layer 1), (iii) 0.00015–0.0005 specific storage (Ss), (iv) 0.04 to 0.25 for specific yield Sy (Layer 1), (v) 12–33% as recharge, (vi) 500–4000 m2 day−1 for river conductance (hydraulic conductivity of the river bed multiplied by the area), and (vii) 2.8–5.6 m for river stage. The sensitivity analysis results in terms of R2, NSE, and RMSE obtained from the evaluation for the most sensitivity parameter like river stage, river hydraulic conductance, and recharge are shown in Figure 5.
It was observed that, out of the all evaluated parameters tested for sensitivity, five parameters viz. river stage, conductance, recharge, horizontal hydraulic conductivity of layer 1, and specific yield of layer 1 were found to be the most sensitive parameters in the decreasing order. Groundwater head was found to be directly proportional to river stage. The parameters in layer 2 and lower layers were found to be less sensitive to shallow groundwater head simulation results in the first layer. The sensitivity of groundwater level to river stages and recharge indicates that the impacts of climate change in terms of rainfall variability and sea level rise can have potentially large impacts of this coastal island. Rise in tidal water levels in the rivers can potentially cause larger inflow into the island and more salinization.

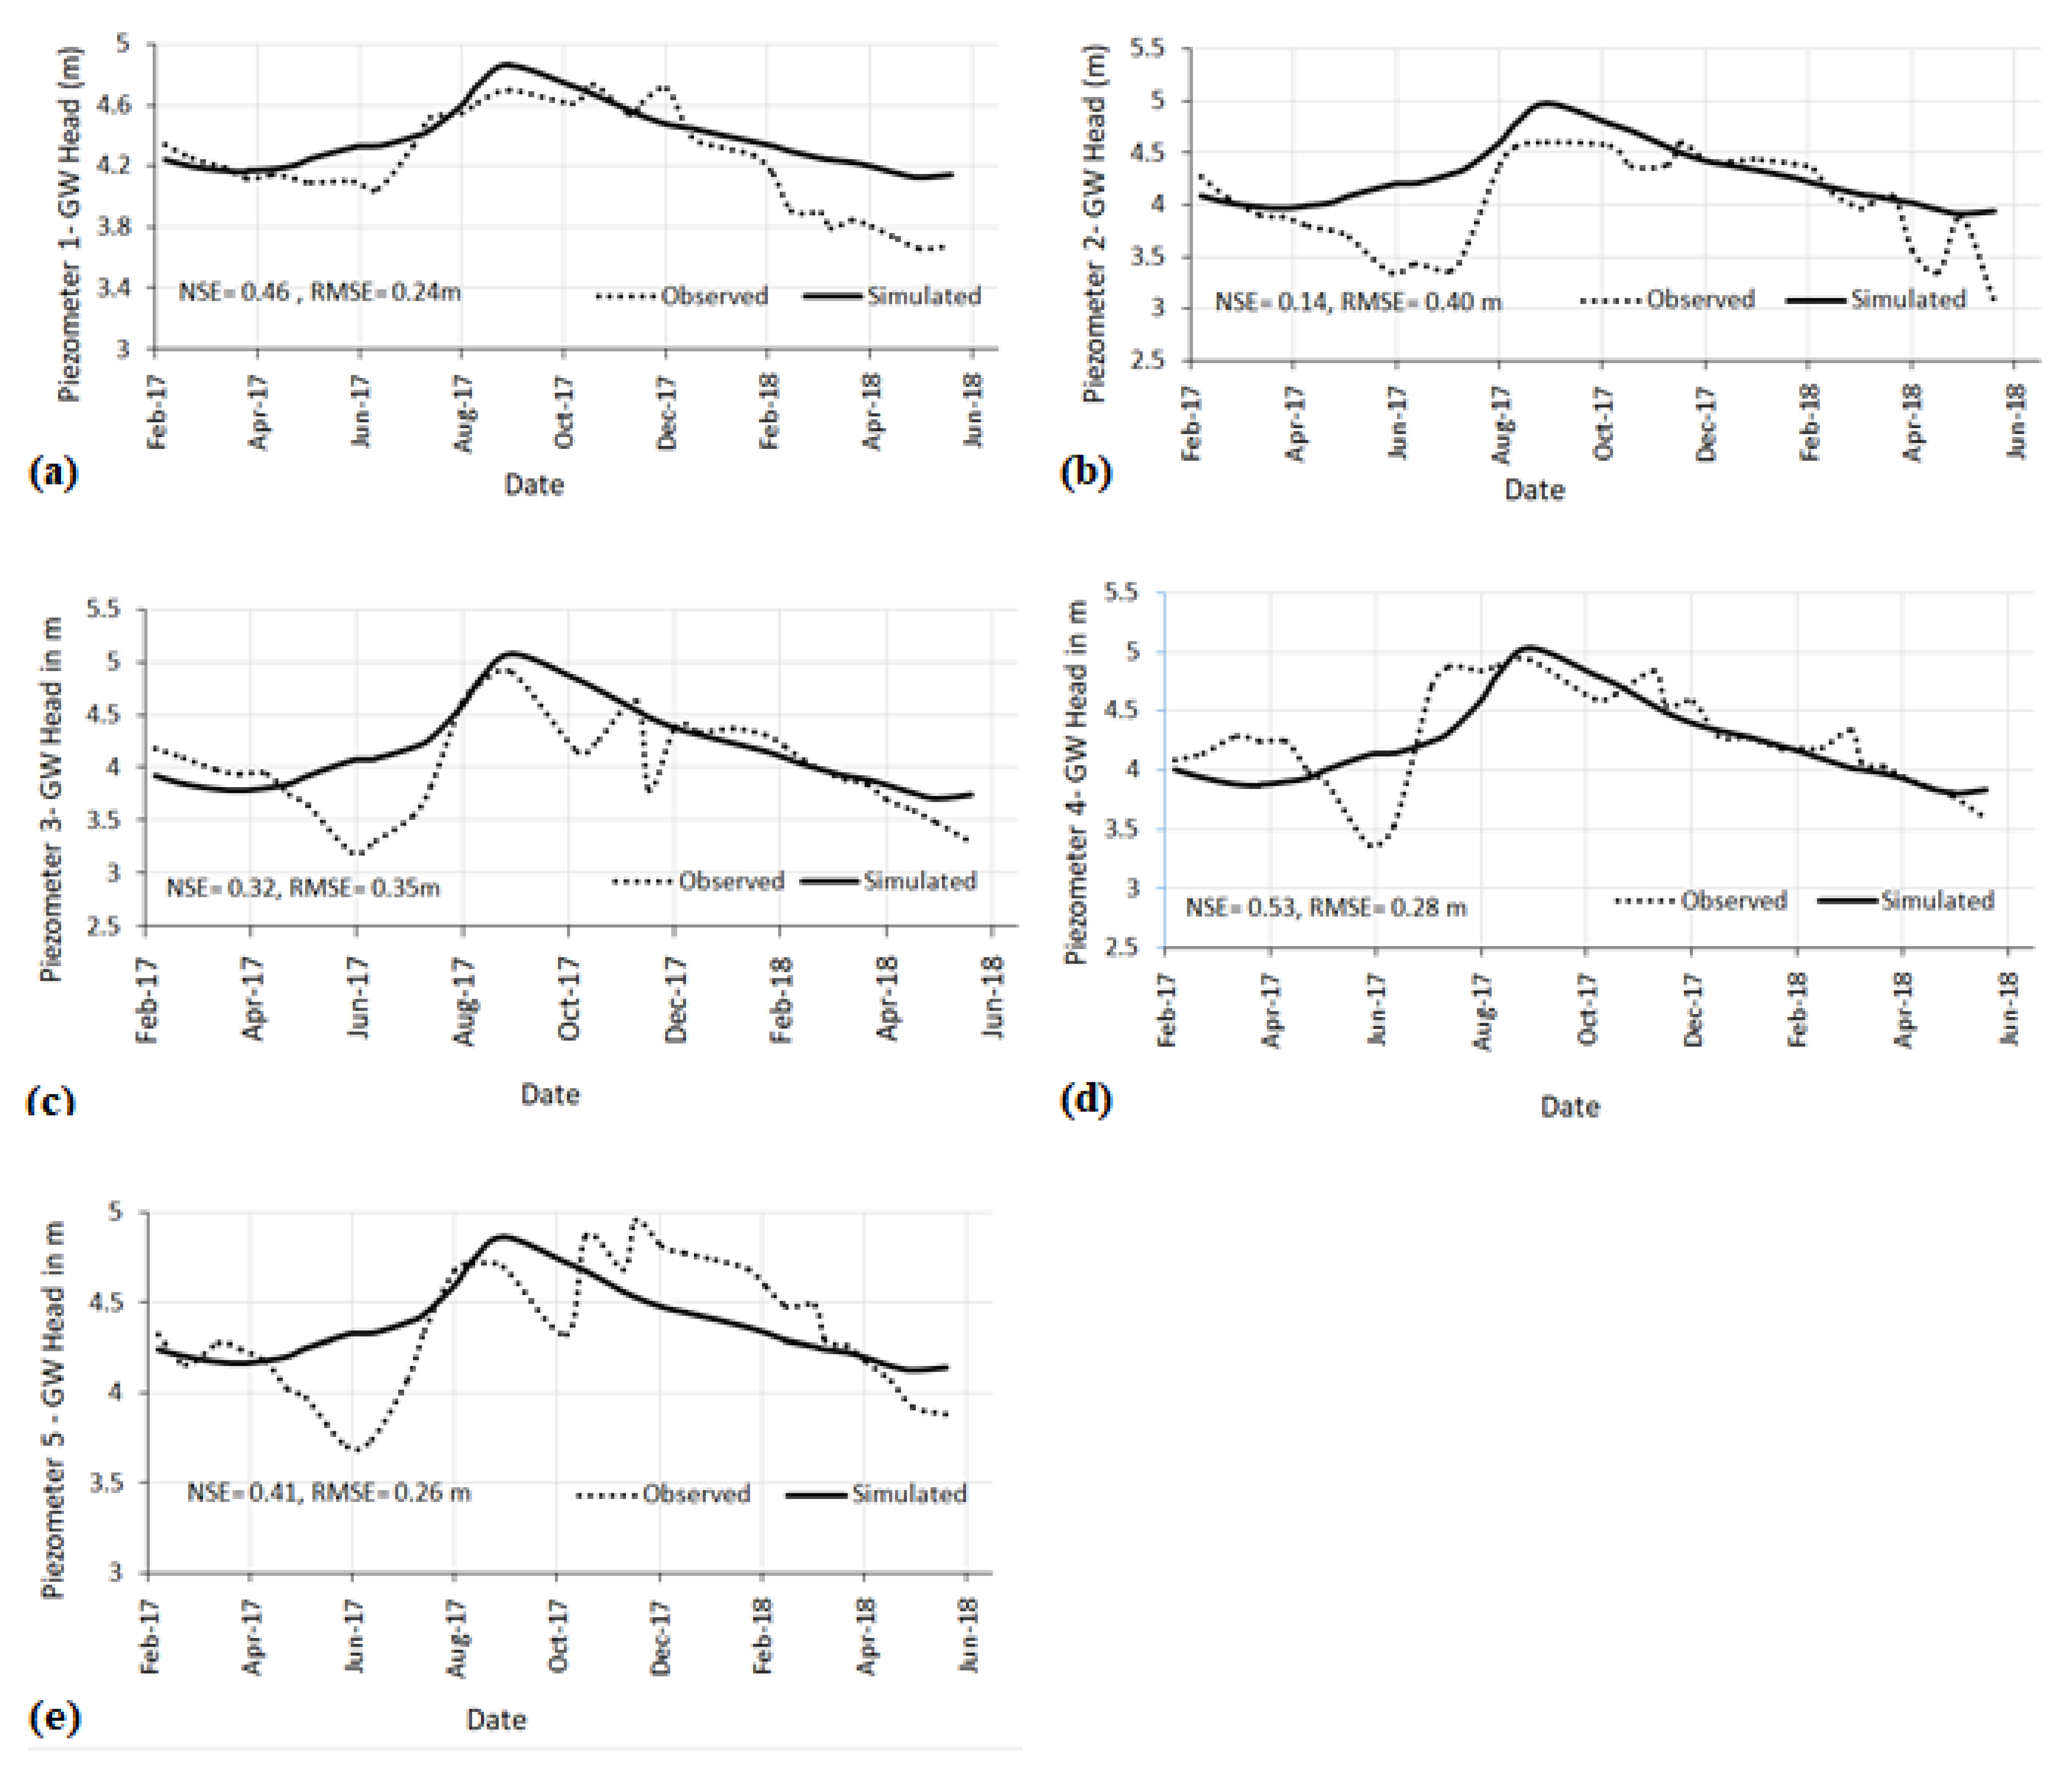
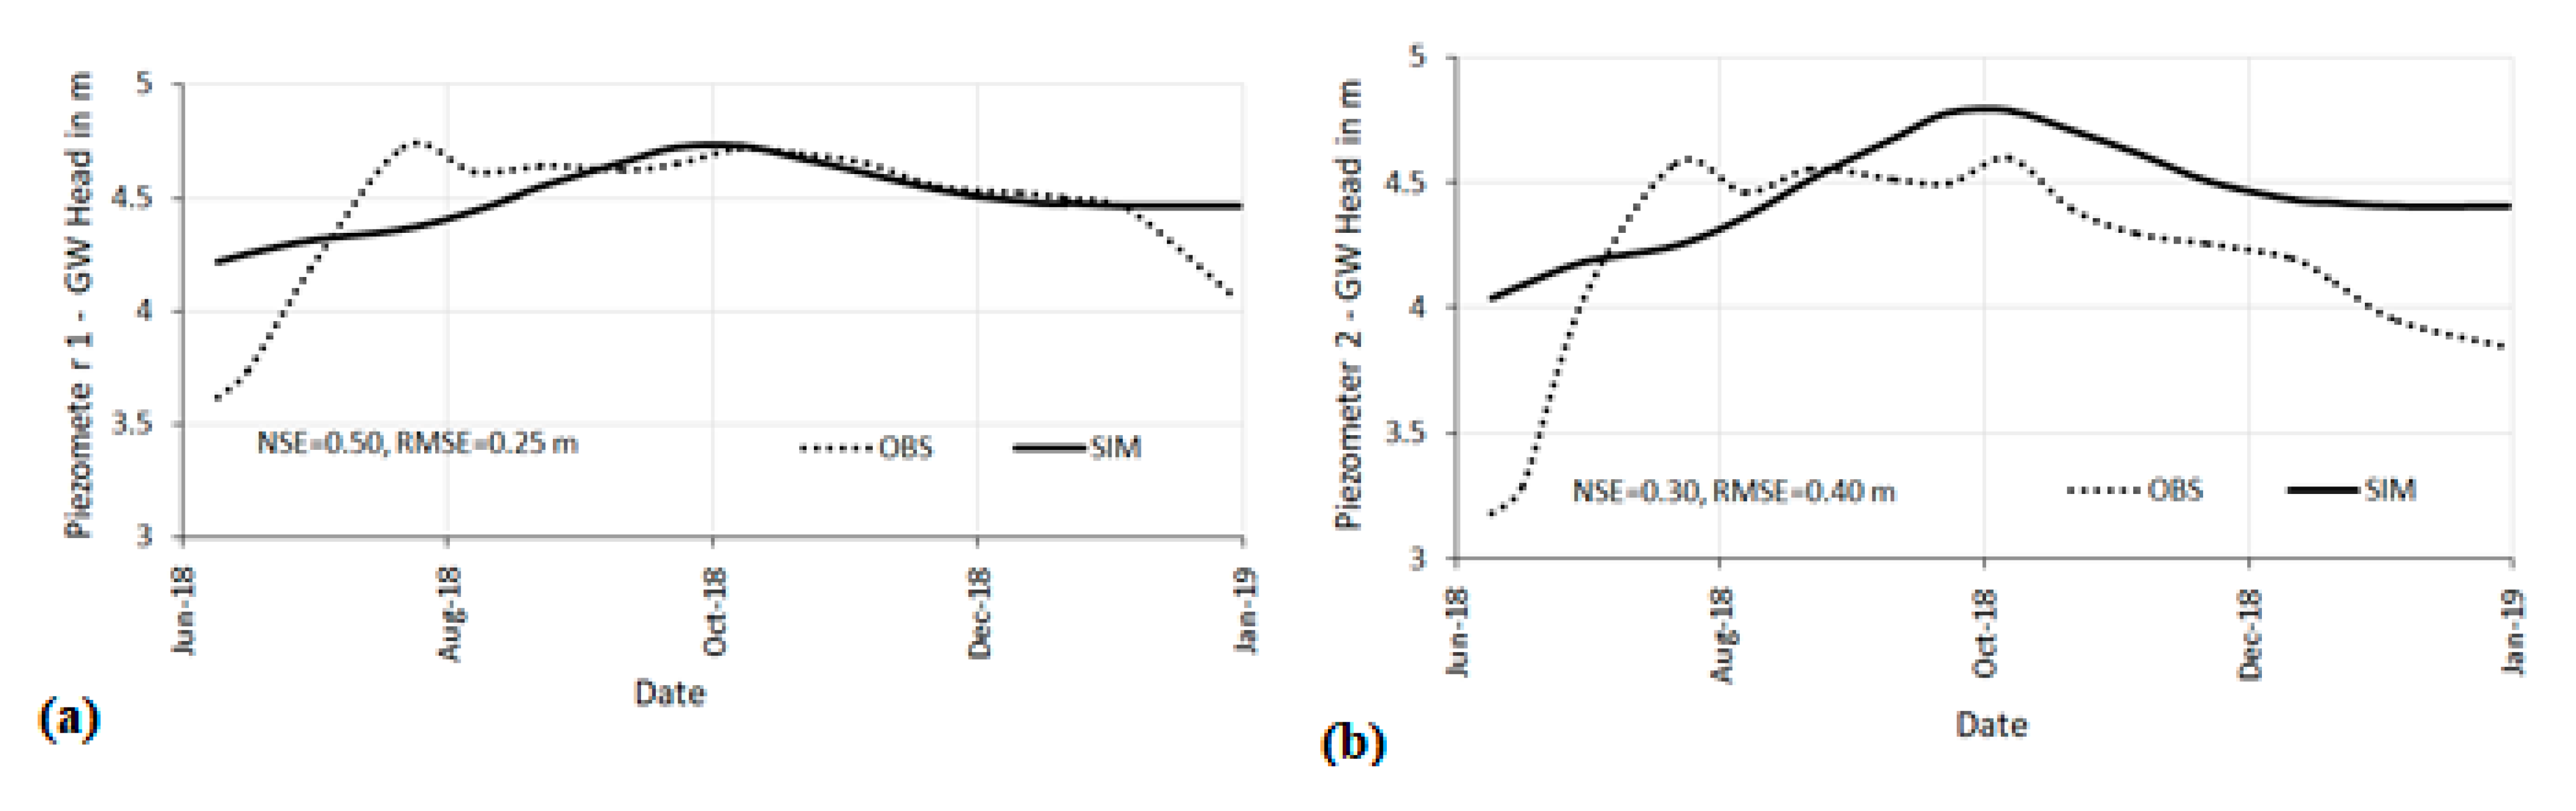
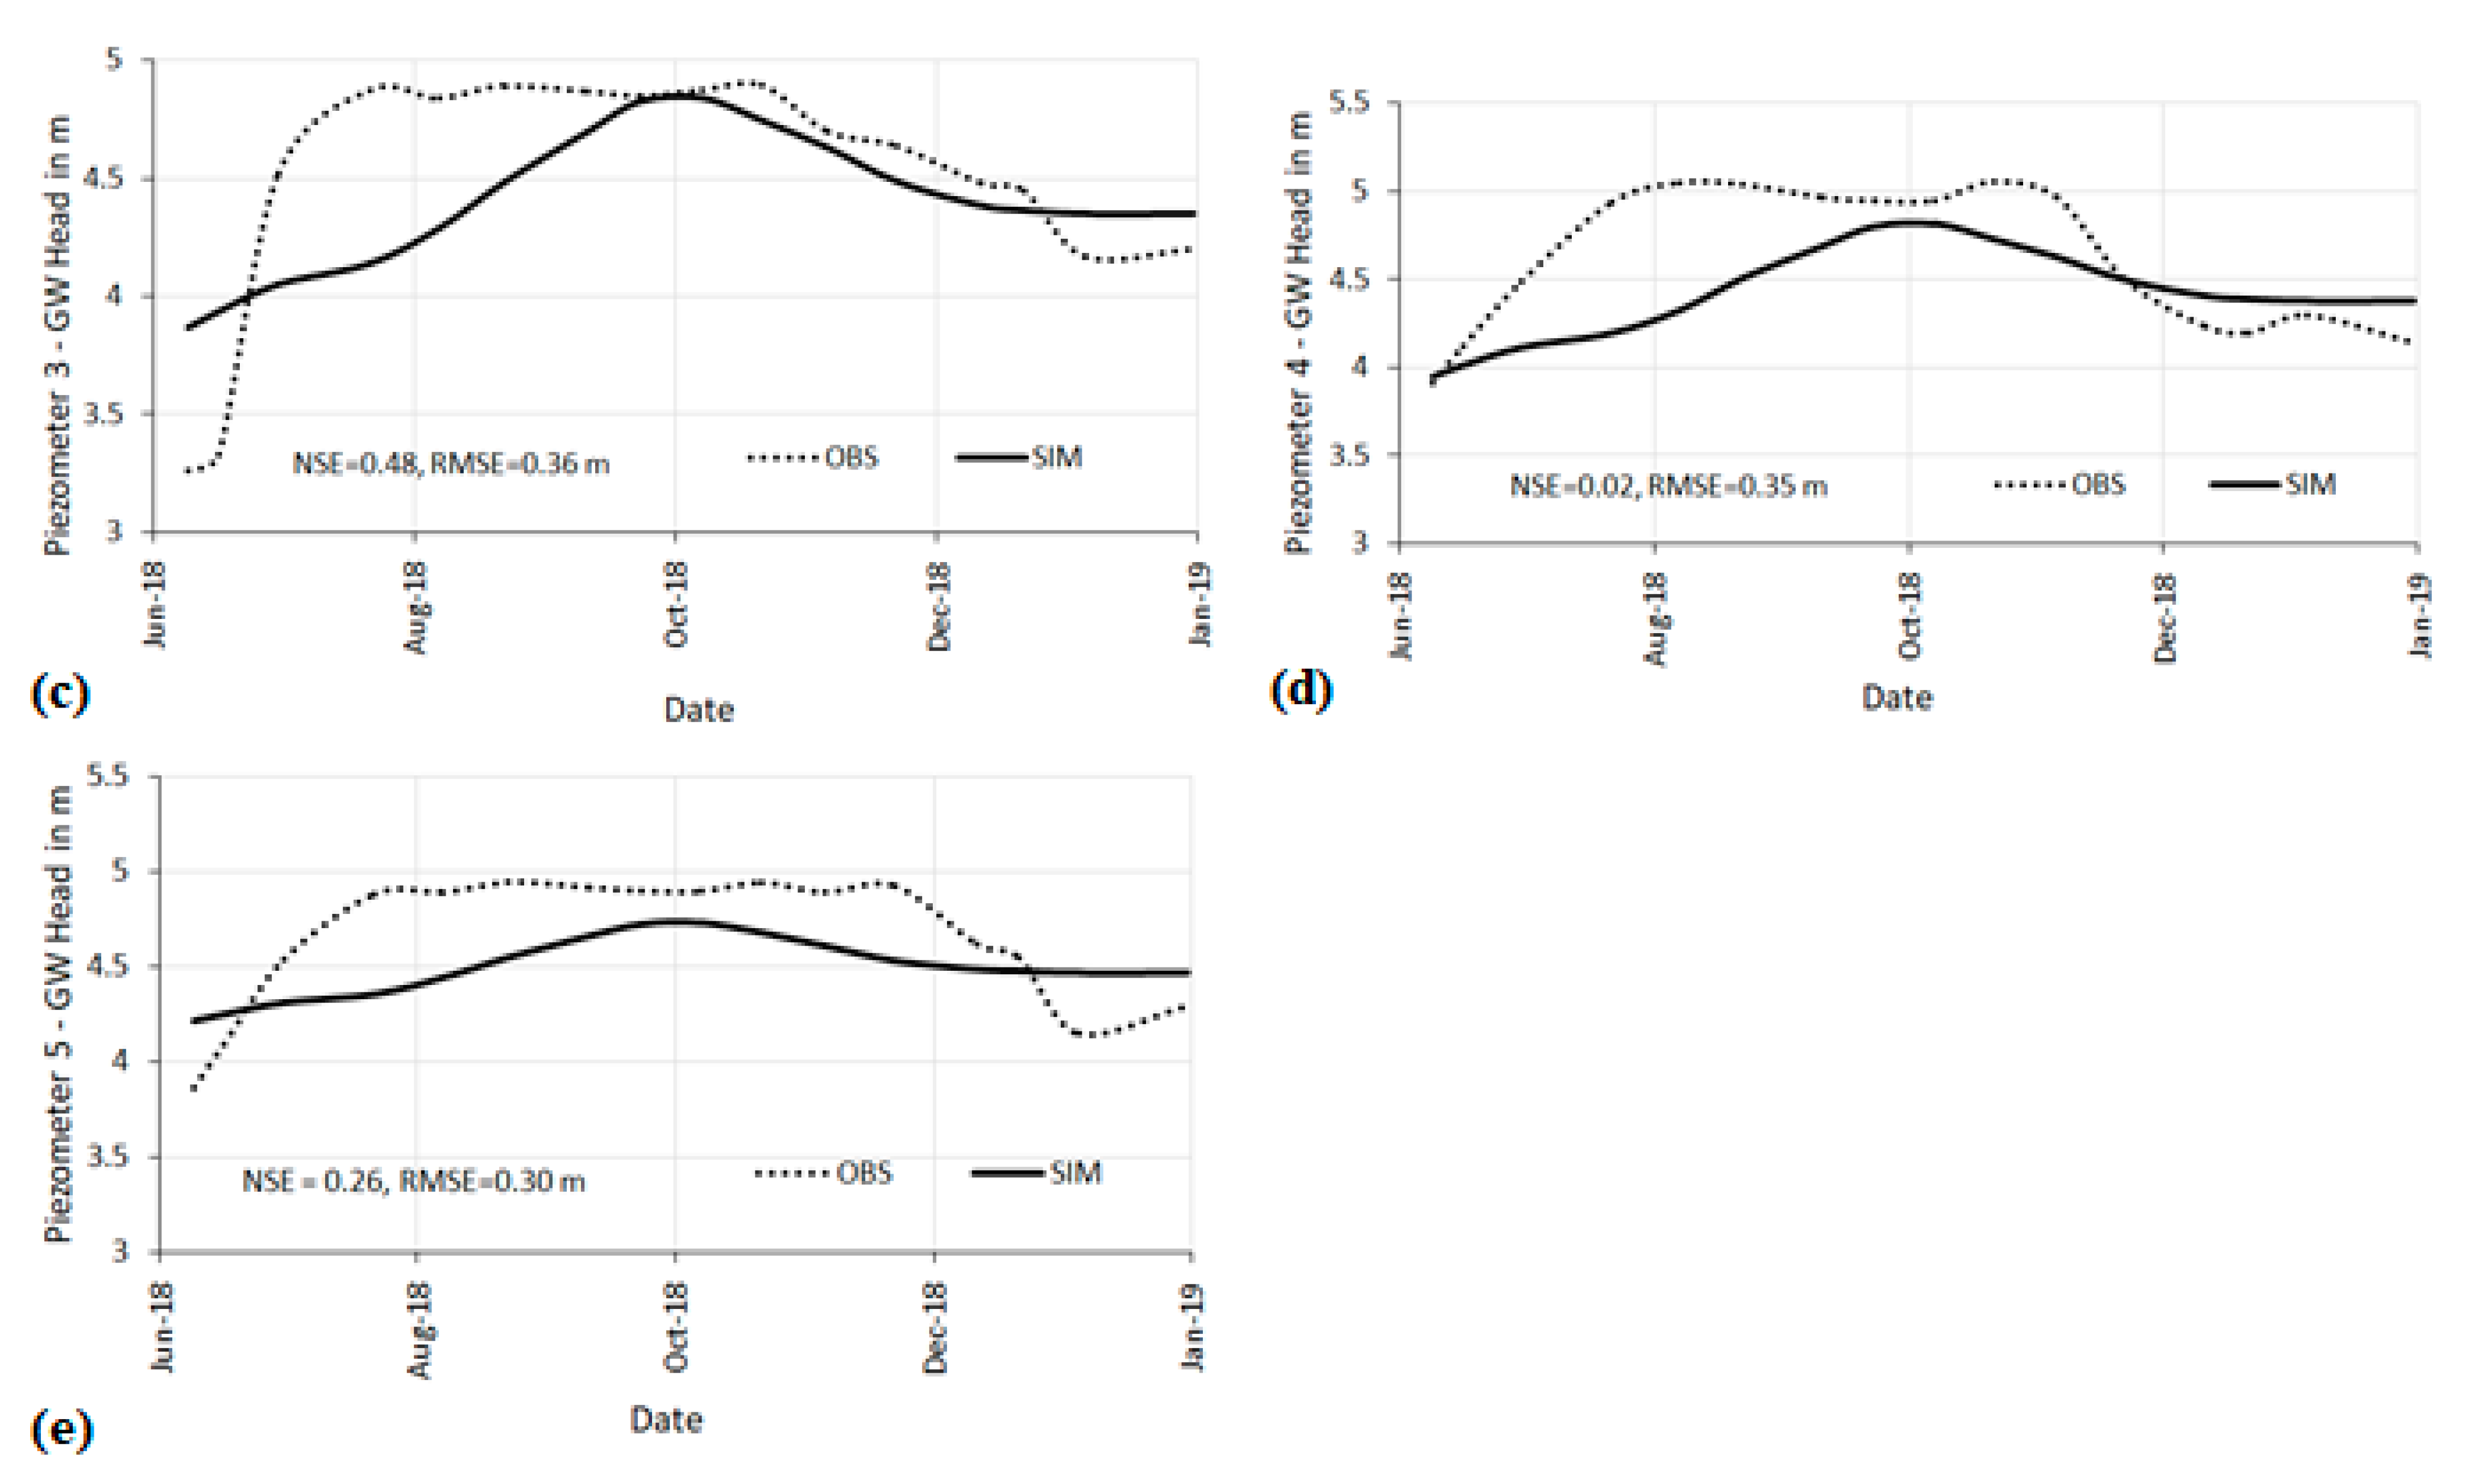
3.3. Model Calibration and Simulation Analysis

The simulated water table was compared with the measured water table for five piezometer locations as shown in the line plots of Figure 6. Statistical indices like the Nash–Sutcliffe Efficiency (NSE) and Root Mean Squared Error (RMSE) have shown (in the Figure 6) that the model provides a good simulation of the actual groundwater table in the study area. The overall trend in the simulated water table is comparable to that of observed data which suggests the credibility of the simulation. NSE values during the calibration period for piezometer 1, 2, 3, 4, and 5 were 0.46, 0.14, 0.32, 0.53, and 0.41, respectively, and the corresponding calibration RMSE values were 0.24, 0.40, 0.35, 0.28, and 0.26 m, respectively. NSE and RMSE for the validation phase showed a reasonable fit as well and the validation phase line plots are shown in Figure 7. It was found that the simulated water tables at piezometer 1, 4, and 5 matched comparatively well than other piezometers with the observed water tables during calibration. However, the model overestimated the water table depth in general, for piezometer 3, 4, and 5 (Figure 7), during the validation phase, but the deviation was within the acceptable range. A relatively small amount of data used for calibration may be causing this. The highest value of validation NSE and lowest value of validation RMSE were associated with piezometer 1 with numerical values of 0.50 and 0.25 m, respectively, whereas the poor model fit during validation was with piezometer 4 with numerical values of 0.02 and 0.35 m, respectively, for NSE and RMSE.

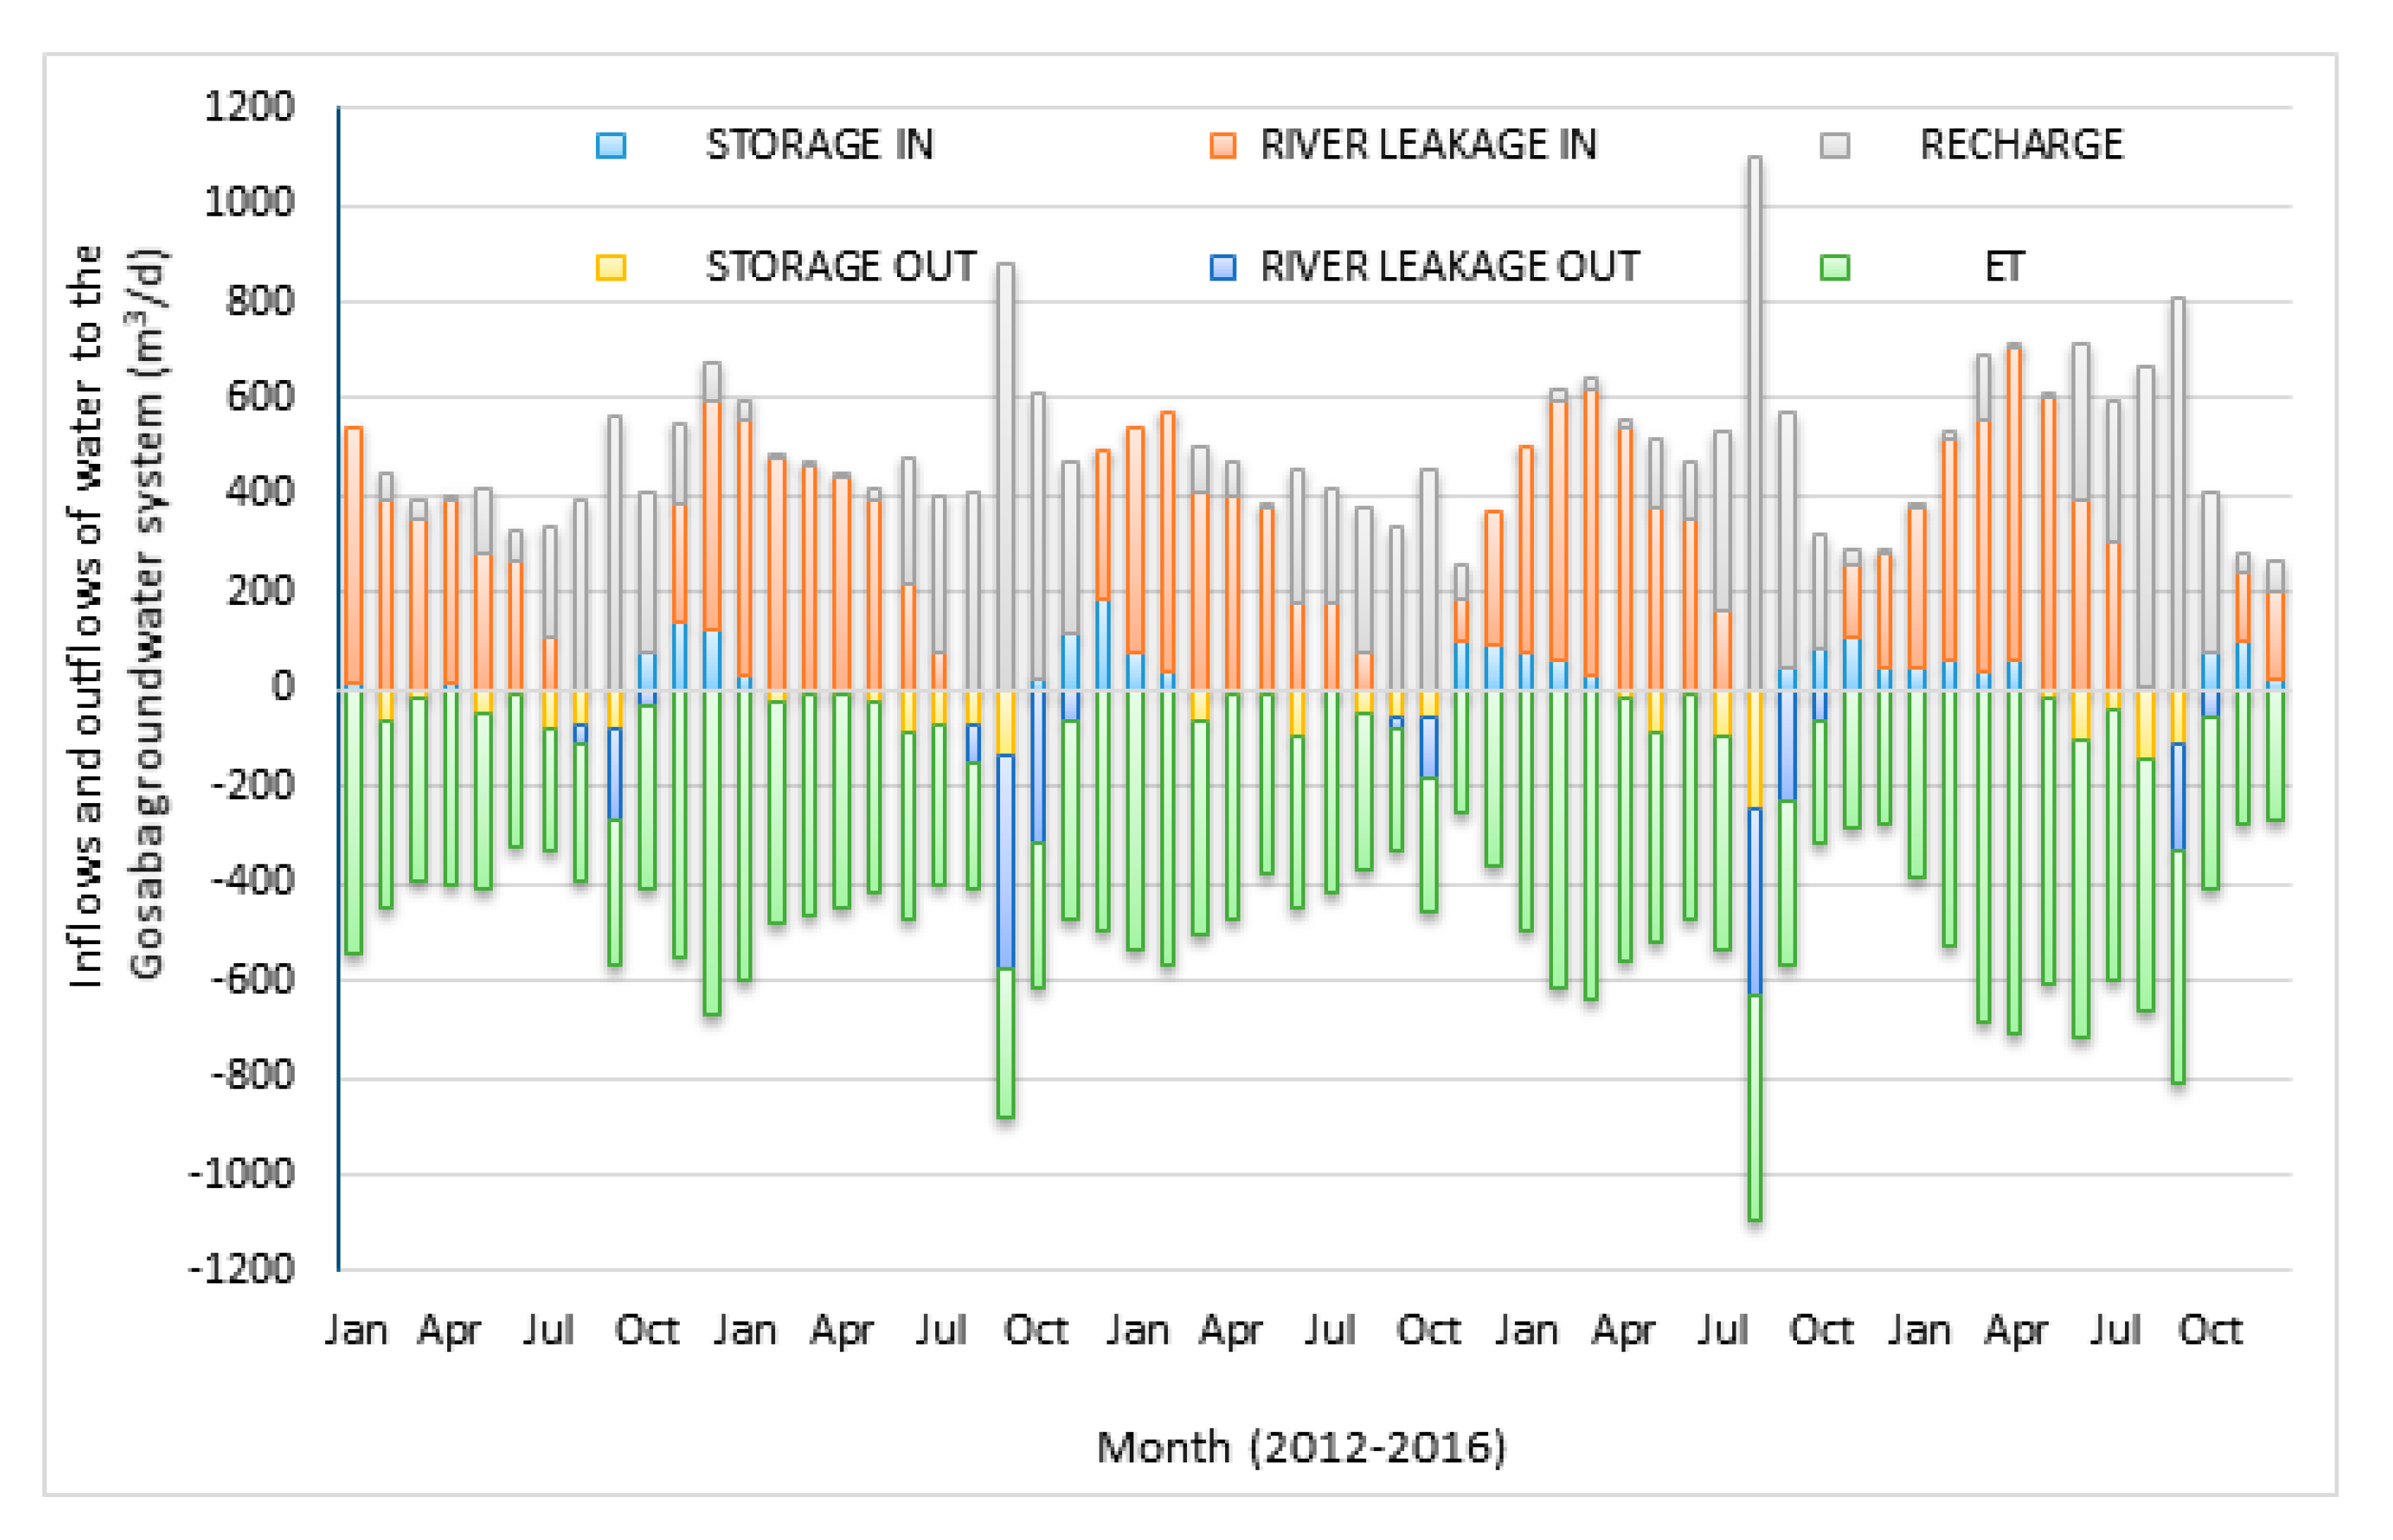
3.4. Groundwater Flow and Water Balance

The groundwater head contours obtained for the aquifer profile in various seasons (pre-monsoon, monsoon, and post-monsoon seasons of the year 2016) are shown in Figure 8. From the results, it is evident that the inflow from river to groundwater is predominant during the pre-monsoon season. Such conditions are conducive for salt build up in the top-most layer unless groundwater drainage is properly implemented. During monsoon season, there is a net influx of water through recharge. The highest inflow from the river was simulated during post-monsoon season from both tidal riversides to the inland areas with an average value of 554.8 m3 day−1, whereas other inflow water components (i.e., storage in and recharge) were relatively smaller with values of 39.8 m3 day−1 and 39.0 m3 day−1, respectively. In Gosaba Island, groundwater recharge happen predominantly in the monsoon season with an average value of 520.9 m3 day−1, followed by the post-monsoon season with 143.5 m3 day−1.The groundwater outflow discharge from Gosaba Island comes mainly in the form of contribution to evapotranspiration in addition to exchange with the river (Figure 9). The evapotranspiration contributes close to 99% of total outflow during dry pre-monsoon and post-monsoon months, whereas this contribution was close to 77.6% of the total outflow during the monsoon seasons.
Figure 9 indicates the trends in groundwater balance simulated in Gosaba Island during a five-year period (2012–2016). The major component of groundwater balance during pre-monsoon and post-monsoon seasons is river leakage, and major outflow component is evapotranspiration throughout the year. During the monsoon season, the major inflow component is natural recharge, but in certain years, river leakage inflow is also prominent.

3.5. Scenario Analysis

Comprehensive analysis results of the annual average of groundwater head as obtained from three scenarios (no drain scenario, with single drain and three drains) are shown in Table 2. Scenario 2 results show that implementing a single drain of 3 m width, 1.5 m depth, and conductance of 100 m2 day−1 drains considerable amount of water from the island during all seasons. The changes in groundwater head in the three seasons corresponding to Scenario 2 are shown in Figure 10, and corresponding variations for Scenario 3 is shown in Figure 11. These figures correspond to the variations in pre-monsoon, monsoon, and post-monsoon seasons of the year 2016. The single drain scenario has relatively smaller influence on water balance and shallow groundwater head in all seasons. It can be noted from Figure 8b that the groundwater head in the mid-region of the Gosaba Island cross-section is above the heads in both rivers during monsoon seasons during Scenario 1 (no drains) but it has changed considerably during Scenario 3 (Figure 11b). Installation of drains would have more effect in Gosaba during monsoon season for the scenario with three drains (Scenario 3). The Scenario 3 indicates that a considerable lowering of water table is achievable with three drains, with the central part of the island having a lowered water table compared to the river banks. The water table is shifting downwards by 0.15 m for three drains and 0.03 m for one drain in the dry season (pre-monsoon). Scenario 3 may be adopted in Gosaba Island for preventing water logging that also results in salt build up in the crop root zone area. Salt build-up in the crop rootzone due the capillary rise of saline groundwater is one of the major impediments to grow crops such as potato, maize, sunflower, vegetables, and pulses. in the dry season. Artificial drainage of water and salts can potentially facilitate growing crops in the dry season.

4. Discussion

The results of scenario analyses indicate that the groundwater head can be lowered by the installation of drains. This conforms with the findings of another study [6] in the region that poor management or absence of drains is a major factor contributing to water logging in the Sundarban islands. Climate change is expected to worsen the effects of water logging and salinity in the coastal islands of Sundarbans [55]. Installation of drains (Scenarios 2 and 3) would also result in reduced groundwater discharge into the river along the riverbank boundaries. Figure 12 shows the variation of water balance in Gosaba Island in terms of differences in river leakage inflow, evapotranspiration, and corresponding drain outflows simulated for one year for all three scenarios. Changes in groundwater balance can be observed during the pre-monsoon and monsoon seasons in this region when artificial drainage is implemented. It shows that the river inflow into groundwater is also reduced for Scenario 3 during pre-monsoon seasons (i.e., reducing the pre-monsoon river leakage value to 463.7 m3 day−1 (Scenario 3) from 554.7 m3 day−1 (Scenario 1)). The groundwater balance indicates that Scenario 3 would considerably alter the water balance with most of the water leaving the model area through the drains which are present in the cross-section equidistantly. The pre-monsoon water balance shows that the major source of inflow is the influx from the river, as rainfall is nearly zero, whereas the major outflow flux is groundwater contribution to evapotranspiration (ET).
This water balance changes slightly when drains are implemented. Drains remove 22 m3 day−1 and 80 m3 day−1 of water from the groundwater system for Scenarios 2 and 3, respectively. The lowering of the water table caused by this results in a slight decrease in groundwater contribution to ET. This is evident particularly for Scenario 3. Groundwater ET is significantly less for Scenario 3 compared to the base case. This has two advantages. One is decreased groundwater contribution to ET will help reduce salt accumulation in the root zone. Furthermore, lateral drainage can enhance removal of salt from the system. However, it is noteworthy that the simulation of Scenarios 2 and 3 shows increased influx from the river during monsoon and post-monsoon season. This could be because of the steeper gradient in the water table induced from the river towards the drains. In the current conceptual model, recharge is treated as a fixed input. However, in a more realistic set up, recharge is also expected to increase when the water table is lower, and this will have better impact on the leaching of salts.
These changes in water balance may benefit Gosaba Island in two ways. One is that decreased groundwater contribution to ET, especially in the pre-monsoon season, will help to reduce salt accumulation in the root zone, and secondly, lateral drainage can enhance the removal of salt from the system. Both will help growing crops in the dry season.
The drain discharges simulated during monsoon seasons were 75.2 m3 day−1 and 123.4 m3 day−1, respectively, for Scenarios 2 and 3, whereas this component during post-monsoon season had values of 77.9 m3 day−1 and 111.6 m3 day−1, respectively. The monsoon groundwater balance is significantly different from what the pre-monsoon dynamics in Gosaba Island. In this case, the major inflow component is recharge and the major outflow component is ET. There was no significant difference in the ET flux among scenarios. This is because, despite the implementation of drains, the water table remains shallow causing less implication on the ET dynamics in the area. It is also noteworthy that the implementation of drains results in steeper gradient and influx from the river to the groundwater table, especially given high river stages in monsoon season. The river influx was observed more prominent in post monsoon seasons in Gosaba Island as indicated in Figure 10c.
This preliminary modeling study shows encouraging results to consider drainage management as to solve the increasing challenge of water logging and salinity management in the deltaic region. The insights will be useful for farmers and policymakers in the region for planning various sustainable saline groundwater management. Building a drainage infrastructure could potentially be part of initiatives like the national employment guarantee scheme in India. The results from this preliminary study indicate that the implementation and proper management of drains can lower the water level in the island aquifers. Some previous studies indicate that salinity influx due to frequent natural events like the Aila cyclone and related tidal influxes [40] is growing in the region. Advanced numerical modeling, prediction uncertainty analysis, and optimization approaches can also be used for devising optimal management of coastal and deltaic aquifers under prediction uncertainty [55,56,57,58,59,60,61].

5. Conclusions

This study employed 2D cross-sectional groundwater flow model for Gosaba Island in Sundarbans using MODFLOW to simulate the groundwater flow and water balance. Model simulations were also used to understand how water balance may change if management practices (open drains) are adopted.
The major conclusions are
  • Gosaba Island is experiencing changes in rainfall and ET trends. Annual average values of rainfall increased by 72 mm and that of ET decreased by 284 mm from 1966 to 2016, i.e., an increase of 1.41 mm/year in rainfall and a decrease of 5.57 mm/year in ET. Salinity in surface water and groundwater in upper soil strata is a growing concern in the region during dry pre-monsoon seasons. MODFLOW model simulations were used to investigate the groundwater balance and potential drainage mechanisms to address this complex problem in Gosaba Island;
  • In Gosaba Island, shallow groundwater balance dynamics are mainly controlled by precipitation (recharge) and evapotranspiration, as well as the surface water–groundwater interaction with the tidal rivers, Gumor and Datta. The groundwater in the deeper layers does not have a large influence on the shallow groundwater table and all model parameters associated with deeper layers were insensitive to the shallow water dynamics. While this is influenced by the vertical conductivity of the intervening aquitard, groundwater pumping from the shallow aquifer could also be influencing the dynamic equilibrium in the vertical direction. Indicative sensitivity analysis shows that parameters governing recharge rate, tidal river conductance, and tidal riverhead are critical for understanding shallow groundwater dynamics and water logging conditions in the coastal islands;
  • Management scenario analysis was undertaken considering single and three equidistant subsurface drains conceptually represented in the model. Drainage of 80.9 m3 day−1 (during pre-monsoon), 123.4 m3 day−1 (during monsoon), 111.6 m3 day−1 (during post-monsoon) of water could be achieved by implementing three drains (Scenario 3) in Gosaba Island. These values correspond to the 2D cross-section and could be scaled to the whole island subject to the assumptions. The influence of drains (Scenario 3) on the groundwater head indicates that the water table could potentially be lowered by up to 0.33 m in monsoon season. While not explicitly modeled, the lowering of the water table is expected to be useful for removal of salt from the crop root zone. This will be critical for maintaining agricultural productivity in the region in the future as the problem of salinity has been growing in this region over the years. The model used in this preliminary research study could be further refined for better modeling of surface–water groundwater interaction by further calibration using multiple data types and longer time series record of observation data. Such models can be further coupled with solute transport models for better a understanding of the actual current status and future scenarios of groundwater salinity in the study area considering consequences of climate change and seawater rise. This scenario analysis may be improved further in the future by incorporating specific design criteria (i.e., dimensions, conductance, elevation, number, and spacing of drains of the drain the in the model), and it can provide better insight to address the most disastrous problems of groundwater salinity faced by the majority farmers of the Sundarbans regions of the Ganges delta.

Author Contributions

Conceptualization, S.J., R.R. and M.M.; methodology, S.J.; software, A.P., M.N.S.; validation, A.P.; formal analysis, A.P., M.N.S.; investigation, A.P.; resources, S.J.; data curation, S.K.S., U.K.M., D.B., S.S., K.K.M.; writing—original draft preparation, R.R., A.P.; writing—review and editing, S.J., M.M.; visualization, M.N.S., A.P.; supervision, R.R., S.J.; project administration, M.M.; funding acquisition, M.M. All authors have read and agreed to the published version of the manuscript.

Funding

The study was partially funded by the Australian Centre for International Agricultural Research (ACIAR) through the project ‘Cropping system intensification in the salt-affected coastal zones of Bangladesh and West Bengal, India’—LWR/2014/073.

Institutional Review Board Statement

Not applicable.

Informed Consent Statement

Not applicable.

Data Availability Statement

Not applicable.

Conflicts of Interest

The authors declare no conflict of interest.

References

  1. Kummu, M.; de Moel, H.; Salvucci, G.; Viviroli, D.; Ward, P.J.; Varis, O. Over the hills and further away from coast: Global geospatial patterns of human and environment over the 20th–21st centuries. Environ. Res. Lett. 2016, 11, 034010. [Google Scholar] [CrossRef]
  2. Schneider, P.; Asch, F. Rice production and food security in Asian Mega deltas—A review on characteristics, vulnerabilities and agricultural adaptation options to cope with climate change. J. Agron. Crop Sci. 2020, 206, 491–503. [Google Scholar] [CrossRef]
  3. Mainuddin, M.; Bell, R.W.; Gaydon, D.S.; Kirby, J.M.; Barrett-Lennard, E.G.; Glover, M.; Akanda, M.R.; Maji, B.; Ansar, A.M.; Brahmachari, K.; et al. An overview of the Ganges coastal zone: Climate, hydrology, land use, and vulnerability. J. Indian Soc. Coast. Agric. Res. 2019, 37, 1–11. [Google Scholar]
  4. Chakraborty, M.; Sarkar, S.; Mukherjee, A.; Shamsudduha, M.; Ahmed, K.M.; Bhattacharya, A.; Mitra, A. Modeling regional-scale groundwater arsenic hazard in the transboundary Ganges River Delta, India and Bangladesh: Infusing physically-based model with machine learning. Sci. Total Environ. 2020, 748, 141107. [Google Scholar] [CrossRef] [PubMed]
  5. Nath, A.; Samanta, S.; Banerjee, S.; Danda, A.A.; Hazra, S. Threat of arsenic contamination, salinity and water pollution in agricultural practices of Sundarban Delta, India, and mitigation strategies. SN Appl. Sci. 2021, 3, 560. [Google Scholar] [CrossRef]
  6. Ghosh, S.; Mistri, B. Drainage induced waterlogging problem and its impact on farming system: A study in Gosaba Island, Sundarban, India. Spat. Inf. Res. 2020, 28, 709–721. [Google Scholar] [CrossRef]
  7. Mainuddin, M.; Rahman, M.A.; Maniruzzaman, M.K.K.; Sarker, U.K.; Mandal, M.K.; Nanda, D.S.; Gaydon, K.J.M. The water and salt balance of Polders/Islands in the Ganges Delta. J. Indian Soc. Coast. Agric. Res. 2019, 37, 45–50. [Google Scholar]
  8. Mainuddin, M.; Maniruzzaman, M.; Gaydon, D.S.; Sarkar, S.; Rahman, M.A.; Sarangi, S.K.; Sarker, K.K.; Kirby, J.M. A water and salt balance model for the polders and islands in the Ganges delta. J. Hydrol. 2020, 587, 125008. [Google Scholar] [CrossRef]
  9. Sarangi, S.K.; Maji, B.; Sharma, P.C.; Digar, S.; Mahanta, K.K.; Burman, D.; Mandal, U.K.; Mandal, S.; Mainuddin, M. Potato (Solanum tuberosum L.) cultivation by zero tillage and paddy straw mulching in the saline soils of the Ganges Delta. Potato Res. 2020, 64, 277–305. [Google Scholar] [CrossRef]
  10. De Louw, P.G.B.; Sara, E.; Siemon, B.; Voortman, B.R.; Gunnink, J.; van Baaren, E.S.; Essink, G.H.P.O. Shallow rainwater lenses in deltaic areas with saline seepage. Hydrol. Earth Syst. Sci. 2011, 12, 3659–3678. [Google Scholar] [CrossRef] [Green Version]
  11. Yadav, S.; Manoranjan, K.; Mondal, A.S.; Krishna, J.S.V.; Zahirul, H.K.; Asish, S.; Humnath, B.; Humphries, E.; Jayanta, B.; Parvin, R.; et al. Community water management to intensify agricultural productivity in the polders of the coastal zone of Bangladesh. Paddy Water Environ. 2019, 18, 331–343. [Google Scholar] [CrossRef]
  12. Shedekar, S.V.; King, K.W.; Fausey, N.R.; Islam, K.R.; Soboyejo, A.B.O.; Kalcic, M.M.; Brown, L.C. Exploring the effectiveness of drainage water management on water budgets and nitrate loss using three evaluation approaches. Agric. Water Manag. 2021, 243, 106501. [Google Scholar] [CrossRef]
  13. Chang, T.-J.; Wang, C.; Chen, A.S.; Djordjević, S. The effect of inclusion of inlets in dual drainage modelling. J. Hydrol. 2018, 559, 541–555. [Google Scholar] [CrossRef]
  14. Mirlas, V. Applying MODFLOW model for drainage problem solution: A case study from Jahir irrigated fields, Israel. J. Irrig. Drain. Eng. 2009, 135, 269–278. [Google Scholar] [CrossRef]
  15. Mirlas, V. Assessing soil salinity hazard in cultivated areas using MODFLOW model and GIS tools: A case study from the Jezre’el Valley, Israel. Agric. Water Manag. 2012, 109, 144–154. [Google Scholar] [CrossRef]
  16. Mainuddin, M.; Karim, F.; Gaydon, D.S.; Kirby, J.M. Impact of climate change and management strategies on water and salt balance of the polders and islands in the Ganges delta. Sci. Rep. 2021, 11, 7041. [Google Scholar] [CrossRef] [PubMed]
  17. Giambastiani, B.M.S.; Antonellini, M.; Essink, G.H.P.O.; Stuurman, R.J. Saltwater intrusion in the unconfined coastal aquifer of Ravenna (Italy): A numerical model. J. Hydrol. 2007, 340, 91–104. [Google Scholar] [CrossRef]
  18. Saidi, S.; Bouri, S.; Dhia, H.B. Groundwater management based on GIS techniques, chemical indicators and vulnerability to seawater intrusion modelling: Application to the Mahdia–Ksour Essaf aquifer, Tunisia. Environ. Earth Sci. 2013, 70, 1551–1568. [Google Scholar] [CrossRef]
  19. Kumar, P. Multi isotopic approach to study temporal variation of groundwater quality in coastal aquifer of Saijo Plain, Shikoku Island, Japan. Water Resour. 2013, 40, 208–216. [Google Scholar] [CrossRef]
  20. Trabelsi, N.; Triki, I.; Hentati, I.; Zairi, M. Aquifer vulnerability and seawater intrusion risk using GALDIT, GQI SWI and GIS: Case of a coastal aquifer in Tunisia. Environ. Earth Sci. 2016, 75, 669. [Google Scholar] [CrossRef]
  21. Kaya, M.A.; Özürlan, G.; Balkaya, Ç. Geoelectrical investigation of seawater intrusion in the coastal urban area of Çanakkale, NW Turkey. Environ. Earth Sci. 2015, 73, 1151–1160. [Google Scholar] [CrossRef]
  22. Vijay, R.; Mohapatra, P.K. Hydrodynamic assessment of coastal aquifer against saltwater intrusion for city water supply of Puri, India. Environ. Earth Sci. 2016, 75, 588. [Google Scholar] [CrossRef]
  23. Lal, A.; Datta, B. Modelling saltwater intrusion processes and development of a multi-objective strategy for management of coastal aquifers utilizing planned artificial freshwater recharge. Modeling Earth Syst. Environ. 2018, 4, 111–126. [Google Scholar] [CrossRef]
  24. Werner, D.A.; Gallagher, M.R. Characterisation of sea-water intrusion in the Pioneer Valley, Australia using hydrochemistry and three-dimensional numerical modelling. Hydrogeol. J. 2006, 14, 1452–1469. [Google Scholar] [CrossRef]
  25. Lin, J.J.; Snodsmith, B.; Zheng, C.; Wu, J. A modeling study of seawater intrusion in Alabama Gulf Coast, USA. Environ. Geol. 2009, 57, 119–130. [Google Scholar] [CrossRef]
  26. Essink, G.H.P.O. Salt water intrusion in a three-dimensional groundwater system in the Netherlands: A numerical study. Transp. Porous Media 2001, 43, 137–158. [Google Scholar] [CrossRef]
  27. Schubert, C.E. Analysis of the Shallow Groundwater Flow System at Fire Island National Seashore, Suffolk County, New York; US Department of the Interior, US Geological Survey: Washington, DC, USA, 2010.
  28. Nofal, R.E.; Amer, M.A.; El-Didy, S.M.; Fekry, A.M. Delineation and modeling of seawater intrusion into the Nile Delta Aquifer: A new perspective. Water Sci. 2015, 29, 156–166. [Google Scholar] [CrossRef] [Green Version]
  29. Greggio, N.; Mollema, P.; Antonellini, M.; Gabbianelli, G. Irrigation management in coastal zones to prevent soil and groundwater salinization. Resour. Manag. Sustain. Agric. 2012, 10, 50534. [Google Scholar]
  30. Mollema, N.P.; Antonellini, M. Seasonal variation in natural recharge of coastal aquifers. Hydrogeol. J. 2013, 21, 787–797. [Google Scholar] [CrossRef]
  31. Kopmann, M.; Binning, P.J.; Bregnhøj, H. Groundwater System of Sundarbans (Basanti), West Bengal, India. In Groundwater of South Asia; Springer: Singapore, 2018; pp. 497–520. [Google Scholar]
  32. Goswami, R.; Roy, K.; Dutta, S.; Ray, K.; Sarkar, S.; Brahmachari, K.; Nanda, M.K.; Mainuddin, M.; Banerjee, H.; Timisina, J.; et al. Multi-faceted impact and outcome of COVID-19 on smallholder agricultural systems: Integrating qualitative research and fuzzy cognitive mapping to explore resilient strategies. Agric. Syst. 2021, 189, 103051. [Google Scholar] [CrossRef]
  33. Mandal, S.; Maji, B.; Sarangi, S.K.; Mahanta, K.K.; Mandal, U.K.; Burman, D.; Digar, S.; Mainuddin, M.; Sharma, P.C. Economics of cropping system intensification for small-holder farmers in coastal salt-affected areas in West Bengal: Options, challenges and determinants. Decision 2020, 47, 19–33. [Google Scholar] [CrossRef]
  34. Ray, K.; Sen, P.; Goswami, R.; Sarkar, S.; Brahmachari, K.; Ghosh, A.; Nanda, M.K.; Mainuddin, M. Profitability, energetics and GHGs emission estimation from rice-based cropping systems in the coastal saline zone of West Bengal, India. PLoS ONE 2020, 15, e0233303. [Google Scholar] [CrossRef]
  35. Mitra, A.; Gangopadhyay, A.; Dube, A.; Schmidt, A.C.K.; Banerjee, K. Observed changes in water mass properties in the Indian Sundarbans (northwestern Bay of Bengal) during 1980–2007. Curr. Sci. 2009, 97, 1445–1452. [Google Scholar]
  36. Yu, Y.; Mainuddin, M.; Maniruzzaman, M.; Mandal, U.K.; Sarangi, S.K. Rainfall and temperature characteristics in the coastal zones of Bangladesh and West Bengal, India. J. Indian Soc. Coast. Agric. Res. 2019, 37, 12–23. [Google Scholar]
  37. Sarangi, S.K.; Maji, B.; Mahanta, K.K.; Digar, S.; Burman, D.; Mandal, S.; Mandal, U.K.; Sharma, P.C.; Mainuddin, M.; Bell, R. Alternate kharif rice crop establishment methods and medium duration varieties to enable cropping system intensification in coastal saline region. J. Indian Soc. Coast. Agric. Res. 2019, 37, 115–122. [Google Scholar]
  38. Sarangi, S.K.; Maji, B.; Singh, S.; Burman, D.; Mandal, S.; Sharma, D.K.; Singh, U.S.; Ismail, A.M.; Haefele, S.M. Improved nursery management further enhances the productivity of stress-tolerant rice varieties in coastal rainfed lowlands. Field Crop. Res. 2015, 174, 61–70. [Google Scholar] [CrossRef] [Green Version]
  39. Burman, D.; Mahanta, K.K.; Sarangi, S.K.; Mandal, S.; Maji, B.; Mandal, U.K.; Bandyopadhyay, B.K.; Humphreys, E.; Sharma, D.K. Effect of Groundwater Use on Groundwater Quality, Piezometric Level and Boro Rice Productivity in the Sundarbans of West Bengal; CGIAR Challenge Program on Water and Food (CPWF), KRISHI: New Dehli, India, 2015. [Google Scholar]
  40. Haldar, A.; Debnath, A. Assessment of climate induced soil salinity conditions of Gosaba Island, West Bengal and its influence on local livelihood. In Climate Change and Biodiversity; Springer: Tokyo, Japan, 2014; pp. 27–44. [Google Scholar]
  41. Akter, R.; Sumaiya, S.; Rahman, M.; Ahmed, T.; Sakib, M.; Haque, A.; Rahman, M.M. Prediction of Salinity Intrusion due to Sea Level Rise and Reduced Upstream Flow in the GBM Delta. In Proceedings of the 20th Congress of the Asia Pacific Division of the International Association for Hydro Environment Engineering & Research (IAHR), Colombo, Sri Lanka, 29–30 August 2016; pp. 28–31. [Google Scholar]
  42. Rahman, M.M.; Ghosh, T.; Salehin, M.; Ghosh, A.; Haque, A.; Hossain, M.A.; Das, S.; Hazra, S.; Islam, N.; Sarker, M.H.; et al. Ganges-Brahmaputra-Meghna delta, Bangladesh and India: A transnational mega-delta. In Deltas in the Anthropocene; Palgrave Macmillan: Cham, Switzerland, 2020; pp. 23–51. [Google Scholar]
  43. Harbaugh, A.W. MODFLOW-2005, the US Geological Survey Modular Ground-Water Model: The Ground-Water Flow Process; Department of the Interior, US Geological Survey: Reston, VA, USA, 2005.
  44. Harbaugh, W.A.; Banta, E.R.; Hill, M.C.; McDonald, M.G. Modflow-2000, the U.S. Geological Survey Modular Ground-Water Model-User Guide to Modularization Concepts and the Ground-Water Flow Process; Open-File Report; USGS: Wshington, DC, USA, 2000; Volume 92, p. 134.
  45. Census of India. District Census Handbook South Twenty Four Parganas Village and Town Directory. Directorate of Census Operations West Bengal. 2011. Available online: https://censusindia.gov.in/2011census/dchb/DCHB_A/19/1917_PART_A_DCHB_SOUTH%20TWENTY%20FOUR%20PARGANAS.pdf (accessed on 2 June 2021).
  46. Ghosh, A.; Nanda, M.K.; Sarkar, D.; Sarkar, S.; Brahmachari, K.; Ray, K. Application of Multi-dated Sentinel-2 Imageries to Assess the Cropping System in Gosaba Island of Indian Sundarbans. J. Indian Soc. Coast. Agric. Res. 2019, 37, 32–44. [Google Scholar]
  47. Najeb, K.M. Report on Status of Groundwater Quality in Coastal Aquifers of India; Central Groundwater Board: New Dehli, India, 2014; pp. 53–54. Available online: http://cgwb.gov.in/WQ/Costal%20Report.pdf (accessed on 2 June 2021).
  48. Winston, R.B. ModelMuse: A Graphical User Interface for MODFLOW-2005 and PHAST; US Geological Survey: Reston, VA, USA, 2009.
  49. Gan, Y.; Duan, Q.; Gong, W.; Tong, C.; Sun, Y.; Chu, W.; Ye, A.; Miao, C.; Di, Z. A comprehensive evaluation of various sensitivity analysis methods: A case study with a hydrological model. Environ. Model. Softw. 2014, 51, 269–285. [Google Scholar] [CrossRef] [Green Version]
  50. Subramanya, K. Engineering Hydrology, 4th ed.; Tata McGraw-Hill Education: New York, NY, USA, 2013. [Google Scholar]
  51. Cox, N.M. Drainage for Salinity Control at Pithara; Salinity and Land Use Impacts Series; Report No. SLUI 46; Department of Water: Perth, Australia, 2010. Available online: https://www.water.wa.gov.au/__data/assets/pdf_file/0014/3209/84934.pdf (accessed on 2 June 2021).
  52. Bell, R.W.; Mainuddin, M.E.G.; Barrett-Lennard, S.K.; Sarangi, M.M.; Brahmachari, K.; Khokan, K.S.; Burman, D.; Don, G.; Mac, K.; Glover, M.; et al. Cropping systems intensification in the coastal zone of the Ganges delta: Opportunities and risks. J. Indian Soc. Coast. Agric. Res. 2019, 37, 153–161. [Google Scholar]
  53. Kabir, M.E.; Sarker, B.C.; Ghosh, A.K.; Mainuddin, M.; Bell, R.W. Effect of sowing dates on yield of wheat grown in excess water and salt affected soils in southwestern coastal Bangladesh. J. Indian Soc. Coast. Agric. Res. 2019, 37, 51–59. [Google Scholar]
  54. Paul, P.L.C.; Bell, R.W.; Barrett-Lennard, E.G.; Kabir, M.E. Impacts of different tillage systems on the yield of sunflower (Helianthus annuus L.) in a salt-affected clayey soil of the Ganges Delta. Soil Tillage Res. 2020, 197, 104489. [Google Scholar] [CrossRef]
  55. Sujana, D. Impact of Climate Change on the Salinity Situation of the Piyali River, Sundarbans, India. J. Water Resour. Prot. 2011, 3, 6318. [Google Scholar]
  56. Sreekanth, J.; Cui, T.; Pickett, T.; Rassam, D.; Gilfedder, M.; Barrett, D. Probabilistic modelling and uncertainty analysis of flux and water balance changes in a regional aquifer system due to coal seam gas development. Sci. Total Environ. 2018, 634, 1246–1258. [Google Scholar] [CrossRef] [PubMed]
  57. Sreekanth, J.; Moore, C.; Wolf, L. Estimation of optimal groundwater substitution volumes using a distributed parameter groundwater model and prediction uncertainty analysis. Water Resour. Manag. 2015, 10, 3663–3679. [Google Scholar] [CrossRef]
  58. Janardhanan, S.; Gladish, D.; Gonzalez, D.; Pagendam, D.; Pickett, T.; Cui, T. Optimal design and prediction-independent verification of groundwater monitoring network. Water 2020, 12, 123. [Google Scholar] [CrossRef] [Green Version]
  59. Sreekanth, J.; Moore, C. Novel patch modelling method for efficient simulation and prediction uncertainty analysis of multi-scale groundwater flow and transport processes. J. Hydrol. 2018, 559, 122–135. [Google Scholar] [CrossRef]
  60. Hörning, S.; Sreekanth, J.; Bárdossy, A. Computational efficient inverse groundwater modeling using Random Mixing and Whittaker–Shannon interpolation. Adv. Water Resour. 2019, 123, 109–119. [Google Scholar] [CrossRef]
  61. Yu, X.; Sreekanth, J.; Cui, T.; Pickett, T.; Xin, P. Adaptative DNN emulator-enabled multi-objective optimization to manage aquifer− sea flux interactions in a regional coastal aquifer. Agric. Water Manag. 2021, 245, 106571. [Google Scholar] [CrossRef]
Figure 1. The location map of study area, Gosaba Island, West Bengal, India.
Sustainability 13 06784 g001
Figure 2. The conceptual view of 2D cross-section adopted for Gosaba Island.
Sustainability 13 06784 g002
Figure 3. The methodology adopted in this study.
Sustainability 13 06784 g003
Figure 4. The time series analysis of evapotranspiration and precipitation in Gosaba Island during the 1996–2016 period.
Sustainability 13 06784 g004
Figure 5. The sensitivity analysis results of the most sensitive parameters (a) river conductance, (b) recharge, and (c) river stage in Gosaba Island.
Sustainability 13 06784 g005
Figure 6. Simulated and observed shallow groundwater head from five piezometers at Gosaba Island during calibration phase (a) piezometer 1, (b) piezometer 2, (c) piezometer 3, (d) piezometer 4, and (e) piezometer 5.
Sustainability 13 06784 g006
Figure 7. The line plots of simulated and observed shallow groundwater head from five piezometers at Gosaba Island during validation phase (a) piezometer 1, (b) piezometer 2, (c) piezometer 3, (d) piezometer 4, and (e) piezometer 5.
Sustainability 13 06784 g007aSustainability 13 06784 g007b
Figure 8. Seasonal variation in spatially distributed groundwater heads along with groundwater contours as simulated across the Gosaba Island cross-section ((a): pre-monsoon-2016, (b): monsoon-2016, and (c) post-monsoon-2016).
Sustainability 13 06784 g008
Figure 9. The simulated average inflows and outflows of water to the groundwater system in Gosaba Island during the 2012–2016 period.
Sustainability 13 06784 g009
Figure 10. Seasonal variation in spatially distributed groundwater heads along with groundwater contours as simulated across the Gosaba Island cross-section during Scenario 2 ((a): pre-monsoon-2016, (b): monsoon-2016, and (c) post-monsoon-2016).
Sustainability 13 06784 g010
Figure 11. Seasonal variation in spatially distributed groundwater heads along with groundwater contours as simulated across the Gosaba Island cross-section during Scenario 3 ((a): pre-monsoon-2016, (b): monsoon-2016, and (c) post-monsoon-2016).
Sustainability 13 06784 g011
Figure 12. Variation of the water balance changes in Gosaba Island under different scenarios. (a) Pre-monsoon season-2016, (b) monsoon season-2016, (c) post-monsoon season-2016.
Sustainability 13 06784 g012
Table 1. The hydraulic properties range assigned and best parameters for the model.
DataInitial Parameter RangesFinal Parameter ValueReference
Horizontal Hydraulic conductivity (Kx)L1: 10–800 m day−1L1 = 100GEC Report–1997 [49]
L2: 8.64 × 10⁻⁴ to 8.64 × 10⁻⁵ L2 = 5.640000 × 10⁻⁴ [50]
L3: 1000/240 = 4.1667L3 = 4.1667[47]
L4: 1000/200 = 5L4 = 5
Vertical Hydraulic conductivity (Ky)Kx/10L1 = 10ModelMuse manual [48]
L2 = 5.640000 × 10⁻⁵
L3 = 0.41667
L4 = 0.2
Specific storage (Ss = S/B)L1: 1 × 10⁻⁴ L1 = 2.5 × 10⁻⁴ [47]
L2: 3 × 10⁻⁴ to 1.1 × 10⁻³/100 = 3 × 10⁻⁶ to 1.1 × 10⁻⁵ L2, L3, L4 = 5.0 × 10⁻⁶ [50]
L3: 3 × 10⁻⁴ to 1.1 × 10⁻³/290 = 1 × 10⁻⁶ to 3.8 × 10⁻⁶
L4: 3 × 10⁻⁴ to 1.1 × 10⁻³/ 150 = 2 × 10⁻⁶ to 7.5 × 10⁻⁶
Specific yield (Sy = S-SsB)L1: 0.10L1 = 0.1[51]
L2: 0.01 to 0.10 [50]
L3 and L4: 0.10 to 0.30
Model top4–5 m4.5 mGoogle Earth
Soil layer depth50 m, 70–160 m, 170–400 m50 m, 70–160 m, 170–400 m[47]
Layer 4 up to 600 mLayer 4 up to 600 mGEC Report—1997 [49]
Recharge30% of rainfall (f = 12–18%)f = 0.15GEC Report—2015 [52]
F = Rainfall infiltration factor[50]
Table 2. Scenario simulation results indicating the influence of surface drains on groundwater head response in Gosaba Island.
ScenarioGroundwater Head Response in Gosaba Island (2012–2016)
Pre-MonsoonMonsoonPost-Monsoon
Scenario 1 (Without drain)3.65–4.32 m4.27–4.80 m4.26–4.44 m
Scenario 2 (single drain)3.62–4.32 m4.22–4.73 m4.16–4.48 m
Scenario 3 (three drains)3.50–4.23 m3.94–4.50 m3.86–4.36 m
Publisher’s Note: MDPI stays neutral with regard to jurisdictional claims in published maps and institutional affiliations.

