
Exploratory Analysis of Pedestrian Road Trauma in Finland


Abstract
:1. Introduction
2. Methods
2.1. Dataset
2.2. Analysis
3. Results
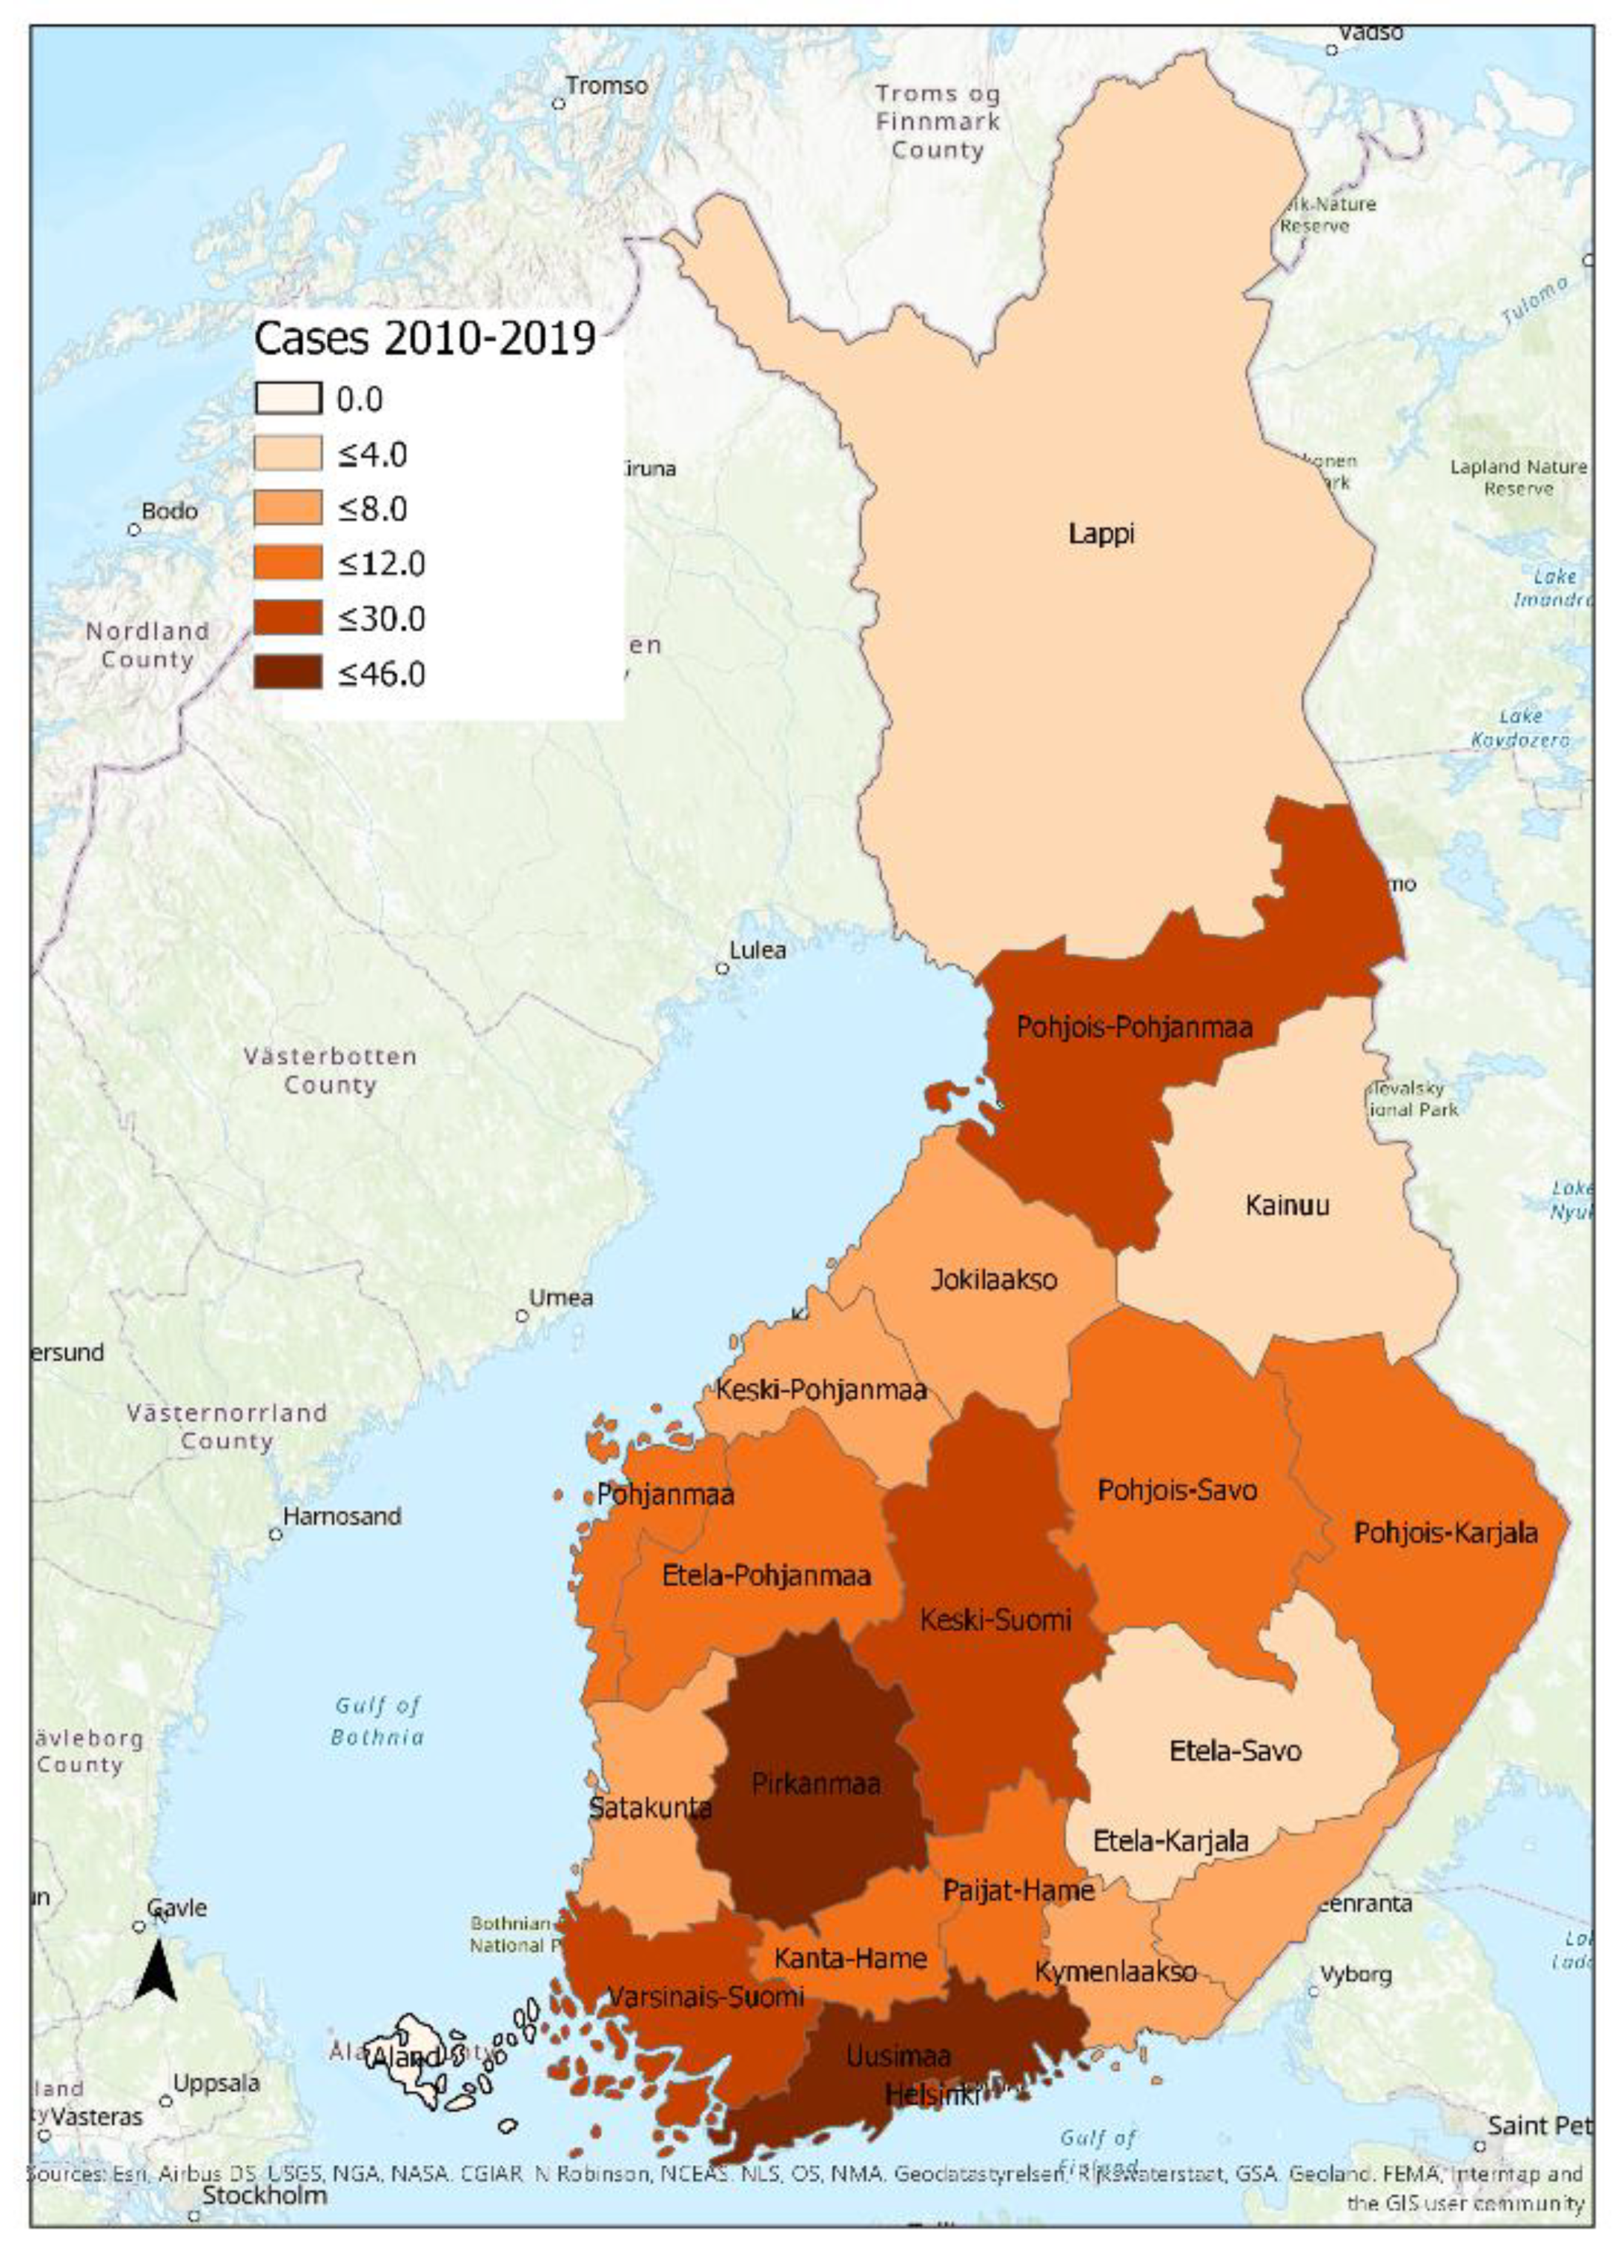
3.1. Investigation Region
3.2. Pedestrian Characteristics
3.3. Injury Characteristics
3.4. Road and Environment
3.5. Crash Mechanisms
3.6. Cluster Analysis
3.6.1. Cluster 1: Older Adults at Crossings
3.6.2. Cluster 2: Crossing in High-Speed Environments
3.6.3. Cluster 3: Off-Street Environments
3.6.4. Cluster 4: Intoxication
4. Discussion
Author Contributions
Funding
Data Availability Statement
Conflicts of Interest
References
- WHO. Pedestrian Safety: A Road Safety Manual for Decision-Makers and Practitioners; WHO: Geneva, Switzerland, 2013. [Google Scholar]
- Zegeer, C.V.; Bushell, M. Pedestrian crash trends and potential countermeasures from around the world. Accid. Anal. Prev. 2012, 44, 3–11. [Google Scholar] [CrossRef]
- WHO. Global Age-Friendly Cities: A Guide; World Health Organization: Geneva, Switzerland, 2007; ISBN 9241547308. [Google Scholar]
- O’Hern, S.; Oxley, J. Understanding travel patterns to support safe active transport for older adults. J. Transp. Heal. 2015, 2. [Google Scholar] [CrossRef]
- Barton, J.; Hine, R.; Pretty, J. The health benefits of walking in greenspaces of high natural and heritage value. J. Integr. Environ. Sci. 2009, 6, 261–278. [Google Scholar] [CrossRef]
- Rabl, A.; De Nazelle, A. Benefits of shift from car to active transport. Transp. Policy 2012, 19, 121–131. [Google Scholar] [CrossRef]
- Rafiemanzelat, R.; Emadi, M.I.; Kamali, A.J. City sustainability: The influence of walkability on built environments. Transp. Res. procedia 2017, 24, 97–104. [Google Scholar] [CrossRef]
- Kato, H. Effect of Walkability on Urban Sustainability in the Osaka Metropolitan Fringe Area. Sustainability 2020, 12, 9248. [Google Scholar] [CrossRef]
- Desa, U.N. The Sustainable Development Goals Report; United Nations: San Francisco, CA, USA, 2018. [Google Scholar]
- Janstrup, K.H. Road Safety Annual Report 2017; Technical University of Denmark: Lyngby, Denmark, 2017. [Google Scholar]
- WHO. Global Status Report on Road Safety 2018; WHO: Geneva, Switzerland, 2019. [Google Scholar]
- Griggs, D.; Stafford-Smith, M.; Gaffney, O.; Rockström, J.; Öhman, M.C.; Shyamsundar, P.; Steffen, W.; Glaser, G.; Kanie, N.; Noble, I. Sustainable development goals for people and planet. Nature 2013, 495, 305–307. [Google Scholar] [CrossRef]
- Mohan, D.; Jha, A.; Chauhan, S.S. Future of road safety and SDG 3.6 goals in six Indian cities. IATSS Res. 2021, 45, 12–18. [Google Scholar] [CrossRef]
- Huuskonen, M. In Proceedings of the Vision Zero Summit 2019, Helsinki, Finland, 12–14 November 2019.
- Malin, F.; Silla, A.; Mladenović, M.N. Prevalence and factors associated with pedestrian fatalities and serious injuries: Case Finland. Eur. Transp. Res. Rev. 2020, 12, 1–17. [Google Scholar] [CrossRef]
- Utriainen, R.; Pöllänen, M.; Liimatainen, H. Road safety comparisons with international data on seriously injured. Transp. Policy 2018, 66, 138–145. [Google Scholar] [CrossRef]
- Buehler, R.; Pucher, J. Trends in walking and cycling safety: Recent evidence from high-income countries, with a focus on the United States and Germany. Am. J. Public Health 2017, 107, 281–287. [Google Scholar] [CrossRef]
- Boufous, S.; de Rome, L.; Senserrick, T.; Ivers, R.Q. Single-versus multi-vehicle bicycle road crashes in Victoria, Australia. Inj. Prev. 2013, 19, 358–362. [Google Scholar] [CrossRef]
- O’Hern, S.; Oxley, J. Fatal cyclist crashes in Australia. Traffic Inj. Prev. 2018, 19, S27–S31. [Google Scholar] [CrossRef]
- LVM Act on the Investigation of Road and Off-Road Accidents. Available online: https://www.finlex.fi/fi/laki/alkup/2016/20161512 (accessed on 3 March 2021).
- Onnettomuustietoinstituutti (OTI). Liikenneonnettomuuksien Tutkintamenetelmä 2003; Onnettomuustietoinstituutti (OTI): Helsinki, Finland, 2018. [Google Scholar]
- Salo, I.; Parkkari, K.; Sulander, P.; Keskinen, E. In-Depth on-the-Spot Road Accident Investigation in Finland. In Proceedings of the 2nd International Conference on ESAR “Expert Symposium on Accident Research”; Bundesanstalt für Straßenwesen: Hannover, Germany, 2007; pp. 28–37. [Google Scholar]
- Norušis, M.J. IBM SPSS Statistics 19 Statistical Procedures Companion; Prentice Hall: Upper Saddle River, NJ, USA, 2012; Volume 496. [Google Scholar]
- Tkaczynski, A. Segmentation using two-step cluster analysis. In Segmentation in Social Marketing; Springer: Berlin/Heidelberg, Germany, 2017; pp. 109–125. [Google Scholar]
- Hair, J.F. Multivariate Data Analysis: A Global Perspective, 7th ed.; Prentice Hall: Upper Saddle River, NJ, USA, 2009. [Google Scholar]
- Bolorunduro, O.B.; Villegas, C.; Oyetunji, T.A.; Haut, E.R.; Stevens, K.A.; Chang, D.C.; Cornwell III, E.E.; Efron, D.T.; Haider, A.H. Validating the Injury Severity Score (ISS) in different populations: ISS predicts mortality better among Hispanics and females. J. Surg. Res. 2011, 166, 40–44. [Google Scholar] [CrossRef] [PubMed]
- O’Hern, S.; Oxley, J.; Logan, D. Older adults at increased risk as pedestrians in Victoria, Australia: An examination of crash characteristics and injury outcomes. Traffic Inj. Prev. 2015, 16, S161–S167. [Google Scholar] [CrossRef] [PubMed]
- Candappa, N.; Stephan, K.; Fotheringham, N.; Lenné, M.G.; Corben, B. Raised crosswalks on entrance to the roundabout—a case study on effectiveness of treatment on pedestrian safety and convenience. Traffic Inj. Prev. 2014, 15, 631–639. [Google Scholar] [CrossRef]
- Hezaveh, A.M.; Cherry, C.R. Walking under the influence of the alcohol: A case study of pedestrian crashes in Tennessee. Accid. Anal. Prev. 2018, 121, 64–70. [Google Scholar] [CrossRef]
- Lenné, M.G.; Corben, B.F.; Stephan, K. Traffic signal phasing at intersections to improve safety for alcohol-affected pedestrians. Accid. Anal. Prev. 2007, 39, 751–756. [Google Scholar] [CrossRef] [PubMed]
- Statistics Finland Finnish Road Statistics. Available online: https://www.stat.fi/til/tiet/2020/tiet_2020_2021-04-15_tie_001_en.html (accessed on 26 May 2021).
- Elvik, R. Why some road safety problems are more difficult to solve than others. Accid. Anal. Prev. 2010, 42, 1089–1096. [Google Scholar] [CrossRef]
- Liimatainen, H.; Pöllänen, M.; Nykänen, L. Impacts of increasing maximum truck weight–Case Finland. Eur. Transp. Res. Rev. 2020, 12, 1–12. [Google Scholar] [CrossRef] [Green Version]
- Thomas, P.; Morris, A.; Talbot, R.; Fagerlind, H. Identifying the causes of road crashes in Europe. Ann. Adv. Automot. Med. 2013, 57, 13. [Google Scholar]
- Hussain, Q.; Feng, H.; Grzebieta, R.; Brijs, T.; Olivier, J. The relationship between impact speed and the probability of pedestrian fatality during a vehicle-pedestrian crash: A systematic review and meta-analysis. Accid. Anal. Prev. 2019, 129, 241–249. [Google Scholar] [CrossRef]
- Rosen, E.; Stigson, H.; Sander, U. Literature review of pedestrian fatality risk as a function of car impact speed. Accid. Anal. Prev. 2011, 43, 25–33. [Google Scholar] [CrossRef]
- Elvik, R.; Vadeby, A.; Hels, T.; van Schagen, I. Updated estimates of the relationship between speed and road safety at the aggregate and individual levels. Accid. Anal. Prev. 2019, 123, 114–122. [Google Scholar] [CrossRef]
- Bahrololoom, S.; Young, W.; Logan, D. Modelling injury severity of bicyclists in bicycle-car crashes at intersections. Accid. Anal. Prev. 2020, 144, 105597. [Google Scholar] [CrossRef]
- Johansson, Ö.; Wanvik, P.O.; Elvik, R. A new method for assessing the risk of accident associated with darkness. Accid. Anal. Prev. 2009, 41, 809–815. [Google Scholar] [CrossRef]
- Laverty, A.A.; Millett, C.; Majeed, A.; Vamos, E.P. COVID-19 presents opportunities and threats to transport and health. J. R. Soc. Med. 2020, 113, 251–254. [Google Scholar] [CrossRef] [PubMed]
- Beck, M.J.; Hensher, D.A.; Wei, E. Slowly coming out of COVID-19 restrictions in Australia: Implications for working from home and commuting trips by car and public transport. J. Transp. Geogr. 2020, 88, 102846. [Google Scholar] [CrossRef] [PubMed]
- Elvik, R. The non-linearity of risk and the promotion of environmentally sustainable transport. Accid. Anal. Prev. 2009, 41, 849–855. [Google Scholar] [CrossRef] [PubMed]

| Region | Number of Cases (281) | % | Population (Estimate as per 31 December 2020) | Cases per 100,000 Population |
|---|---|---|---|---|
| Uusimaa (excluding Helsinki) | 46 | 16.4 | 1,045,758 | 4.40 |
| Pirkanmaa (Tampere region) | 31 | 11.0 | 519,391 | 5.97 |
| Varsinais-Suomi (Southwest Finland) | 30 | 10.7 | 481,403 | 6.23 |
| Helsinki | 28 | 10.0 | 656,920 | 4.26 |
| Pohjois-Pohjanmaa (North Ostrobothnia) | 17 | 6.0 | 301,264 | 5.64 |
| Keski-Suomi (Central Finland) | 16 | 5.7 | 274,778 | 5.82 |
| Kanta-Häme | 12 | 4.3 | 170,577 | 7.03 |
| Päijät-Häme | 12 | 4.3 | 199,146 | 6.03 |
| Pohjanmaa (Ostrobothnia) | 12 | 4.3 | 130,618 | 9.19 |
| Pohjois-Karjala (North Karelia) | 11 | 3.9 | 160,341 | 6.86 |
| Etelä-Pohjanmaa (South Ostrobothnia) | 10 | 3.6 | 187,679 | 5.33 |
| Satakunta | 8 | 2.8 | 216,716 | 3.69 |
| Pohjois-Savo (North Savo) | 8 | 2.8 | 243,576 | 3.28 |
| Keski-Pohjanmaa (Central Ostrobothnia) | 8 | 2.8 | 117,657 | 6.80 |
| Kymenlaakso | 7 | 2.5 | 169,437 | 4.13 |
| Jokilaakso | 7 | 2.5 | 121,166 | 5.78 |
| Etelä-Karjala (South Karelia) | 6 | 2.1 | 127,721 | 4.70 |
| Etelä-Savo (South Savo) | 4 | 1.4 | 139,787 | 2.86 |
| Kainuu | 4 | 1.4 | 71,664 | 5.58 |
| Lappi (Lapland) | 4 | 1.4 | 176,665 | 2.26 |
| Characteristics | Variable | N (281) | % |
|---|---|---|---|
| Gender | Female | 135 | 48.0 |
| Male | 146 | 52.0 | |
| Age group | 0–17 | 18 | 6.4 |
| 18–34 | 50 | 17.8 | |
| 35–54 | 49 | 17.4 | |
| 55–64 | 31 | 11.0 | |
| 65–74 | 52 | 18.5 | |
| 75+ | 81 | 28.8 | |
| Alcohol | Yes | 56 | 19.9 |
| No | 216 | 76.9 | |
| Not known | 9 | 3.2 | |
| Illegal narcotics | Yes | 8 | 2.8 |
| No | 265 | 94.3 | |
| Not known | 8 | 2.8 |
| Characteristics | Variable | N (281) | % |
|---|---|---|---|
| Injury severity | Died immediately | 145 | 51.6 |
| Died before treatment | 29 | 10.3 | |
| Died within 6 h | 43 | 15.3 | |
| Died within 6–24 h | 21 | 7.5 | |
| Died within 1–7 days | 25 | 8.9 | |
| Died within 7–30 days | 16 | 5.7 | |
| Died in more than 30 days | 2 | 0.7 | |
| Injury Severity Score | <9 = Mild | 4 | 1.4 |
| 9–15 = Moderate | 3 | 1.1 | |
| 16–24 = Severe | 19 | 6.8 | |
| >/= 25 = Profound | 224 | 79.7 | |
| Not recorded | 31 | 11.0 | |
| ICD-10 | Injuries to the head | 116 | 41.3 |
| Injuries to the thorax | 51 | 18.1 | |
| Injuries involving multiple body regions | 45 | 16.0 | |
| Injuries to the neck | 18 | 6.4 | |
| Injuries to the abdomen, lumbosacral region | 11 | 3.9 | |
| Other | 16 | 5.7 | |
| Not recorded | 24 | 8.5 |
| Characteristics | Variable | N (281) | % |
|---|---|---|---|
| Day of week | Monday | 52 | 18.5 |
| Tuesday | 38 | 13.5 | |
| Wednesday | 48 | 17.1 | |
| Thursday | 42 | 14.9 | |
| Friday | 39 | 13.9 | |
| Saturday | 26 | 9.3 | |
| Sunday | 36 | 12.8 | |
| Time of Day | 0:00–5:59 | 36 | 12.8 |
| 6:00–11:59 | 83 | 29.5 | |
| 12:00–17:59 | 112 | 39.9 | |
| 18:00–23:59 | 50 | 17.8 |
| Characteristics | Variable | N (281) | % |
|---|---|---|---|
| Road type | Highway | 53 | 18.9 |
| Main road | 13 | 4.6 | |
| Regional road | 30 | 10.7 | |
| Connecting road | 27 | 9.6 | |
| Main street | 47 | 16.7 | |
| Collector | 43 | 15.3 | |
| Other street | 21 | 7.5 | |
| Private road or area (e.g., yard) | 30 | 10.7 | |
| Light traffic route | 14 | 5.0 | |
| Other | 3 | 1.1 | |
| Road alignment | Straight | 201 | 71.5 |
| Curve | 44 | 15.7 | |
| Other/Not known | 36 | 12.8 | |
| Road cross-section | Mid-block | 127 | 45.2 |
| Intersection | 76 | 27.0 | |
| Public transport stop | 10 | 3.6 | |
| Overtaking lane | 1 | 0.4 | |
| Yard area or private grounds | 20 | 7.1 | |
| Road works | 2 | 0.7 | |
| Railway level crossing | 10 | 3.6 | |
| Car park | 6 | 2.1 | |
| Rest area | 1 | 0.4 | |
| Other | 27 | 9.6 | |
| Not known | 1 | 0.4 | |
| Adjacent land use | Residential area | 123 | 43.8 |
| Industrial area | 10 | 3.6 | |
| Trade and service area | 63 | 22.4 | |
| Agriculture and forestry area | 70 | 24.9 | |
| Other/not known | 15 | 5.3 | |
| Speed limit (km/h) | ≤30 | 19 | 6.8 |
| 40 | 91 | 32.4 | |
| 50 | 50 | 17.8 | |
| 60 | 20 | 7.1 | |
| 70 | 2 | 0.7 | |
| 80 | 49 | 17.4 | |
| ≥100 | 27 | 9.6 | |
| No speed limit | 17 | 6.0 | |
| Not known | 6 | 2.1 | |
| Road surface condition | Dry | 158 | 56.2 |
| Wet | 59 | 21.0 | |
| Snowy | 42 | 14.9 | |
| Only driving tracks clear | 14 | 5.0 | |
| Other/not known | 8 | 2.8 |
| Characteristics | Variable | N (281) | % |
|---|---|---|---|
| Counterpart | Passenger cars | 132 | 47.0 |
| Light vehicles | 22 | 7.8 | |
| Heavy vehicles | 70 | 24.9 | |
| Bus | 22 | 7.8 | |
| Motorcycle | 1 | 0.4 | |
| Light motorcycle | 2 | 0.7 | |
| Moped | 4 | 1.4 | |
| Tram | 2 | 0.7 | |
| Train | 10 | 3.6 | |
| Bicycle | 3 | 1.1 | |
| Multiple vehicles | 4 | 1.4 | |
| Other | 9 | 3.2 | |
| Mechanism | Pedestrian crossing | 141 | 5.3 |
| Pedestrian emerging from behind stationary vehicle | 6 | 2.1 | |
| Pedestrian stationary on road | 30 | 10.7 | |
| Pedestrian walking in direction of traffic | 15 | 5.3 | |
| Pedestrian walking towards traffic | 17 | 6.0 | |
| Pedestrian on footway or traffic island | 4 | 1.4 | |
| Rollover crash on the road | 21 | 7.5 | |
| Collision with train | 10 | 3.2 | |
| Passenger entering or leaving vehicle | 3 | 1.1 | |
| Reversing crash | 1 | 0.4 | |
| Collision into traffic island | 2 | 0.7 | |
| Collision with an obstacle on the road | 1 | 0.4 | |
| Running off to right on straight section of road | 1 | 0.4 | |
| Collision with animal | 1 | 0.4 | |
| Other pedestrian crash | 28 | 8.9 |
| Variable | Cluster 1 (28.6%) | Cluster 2 (27.9%) | Cluster 3 (25.7%) | Cluster 4 (17.8%) | p-Value |
|---|---|---|---|---|---|
| Age (mean) | 68.5 | 57.9 | 54.9 | 38.2 | ≤ 0.05 |
| Gender | Female (69.6%) | Male (58.4%) | Male (50.7%) | Male (75.5%) | ≤ 0.05 |
| Alcohol detected for pedestrian | No (88.6%) | No (88.3%) | No (80.3%) | Yes (61.2%) | ≤ 0.05 |
| Collision counterpart | Car (59.5%) | Car (50.6%) | Car (40.8%) | Heavy vehicle (51.0%) | ≤ 0.05 |
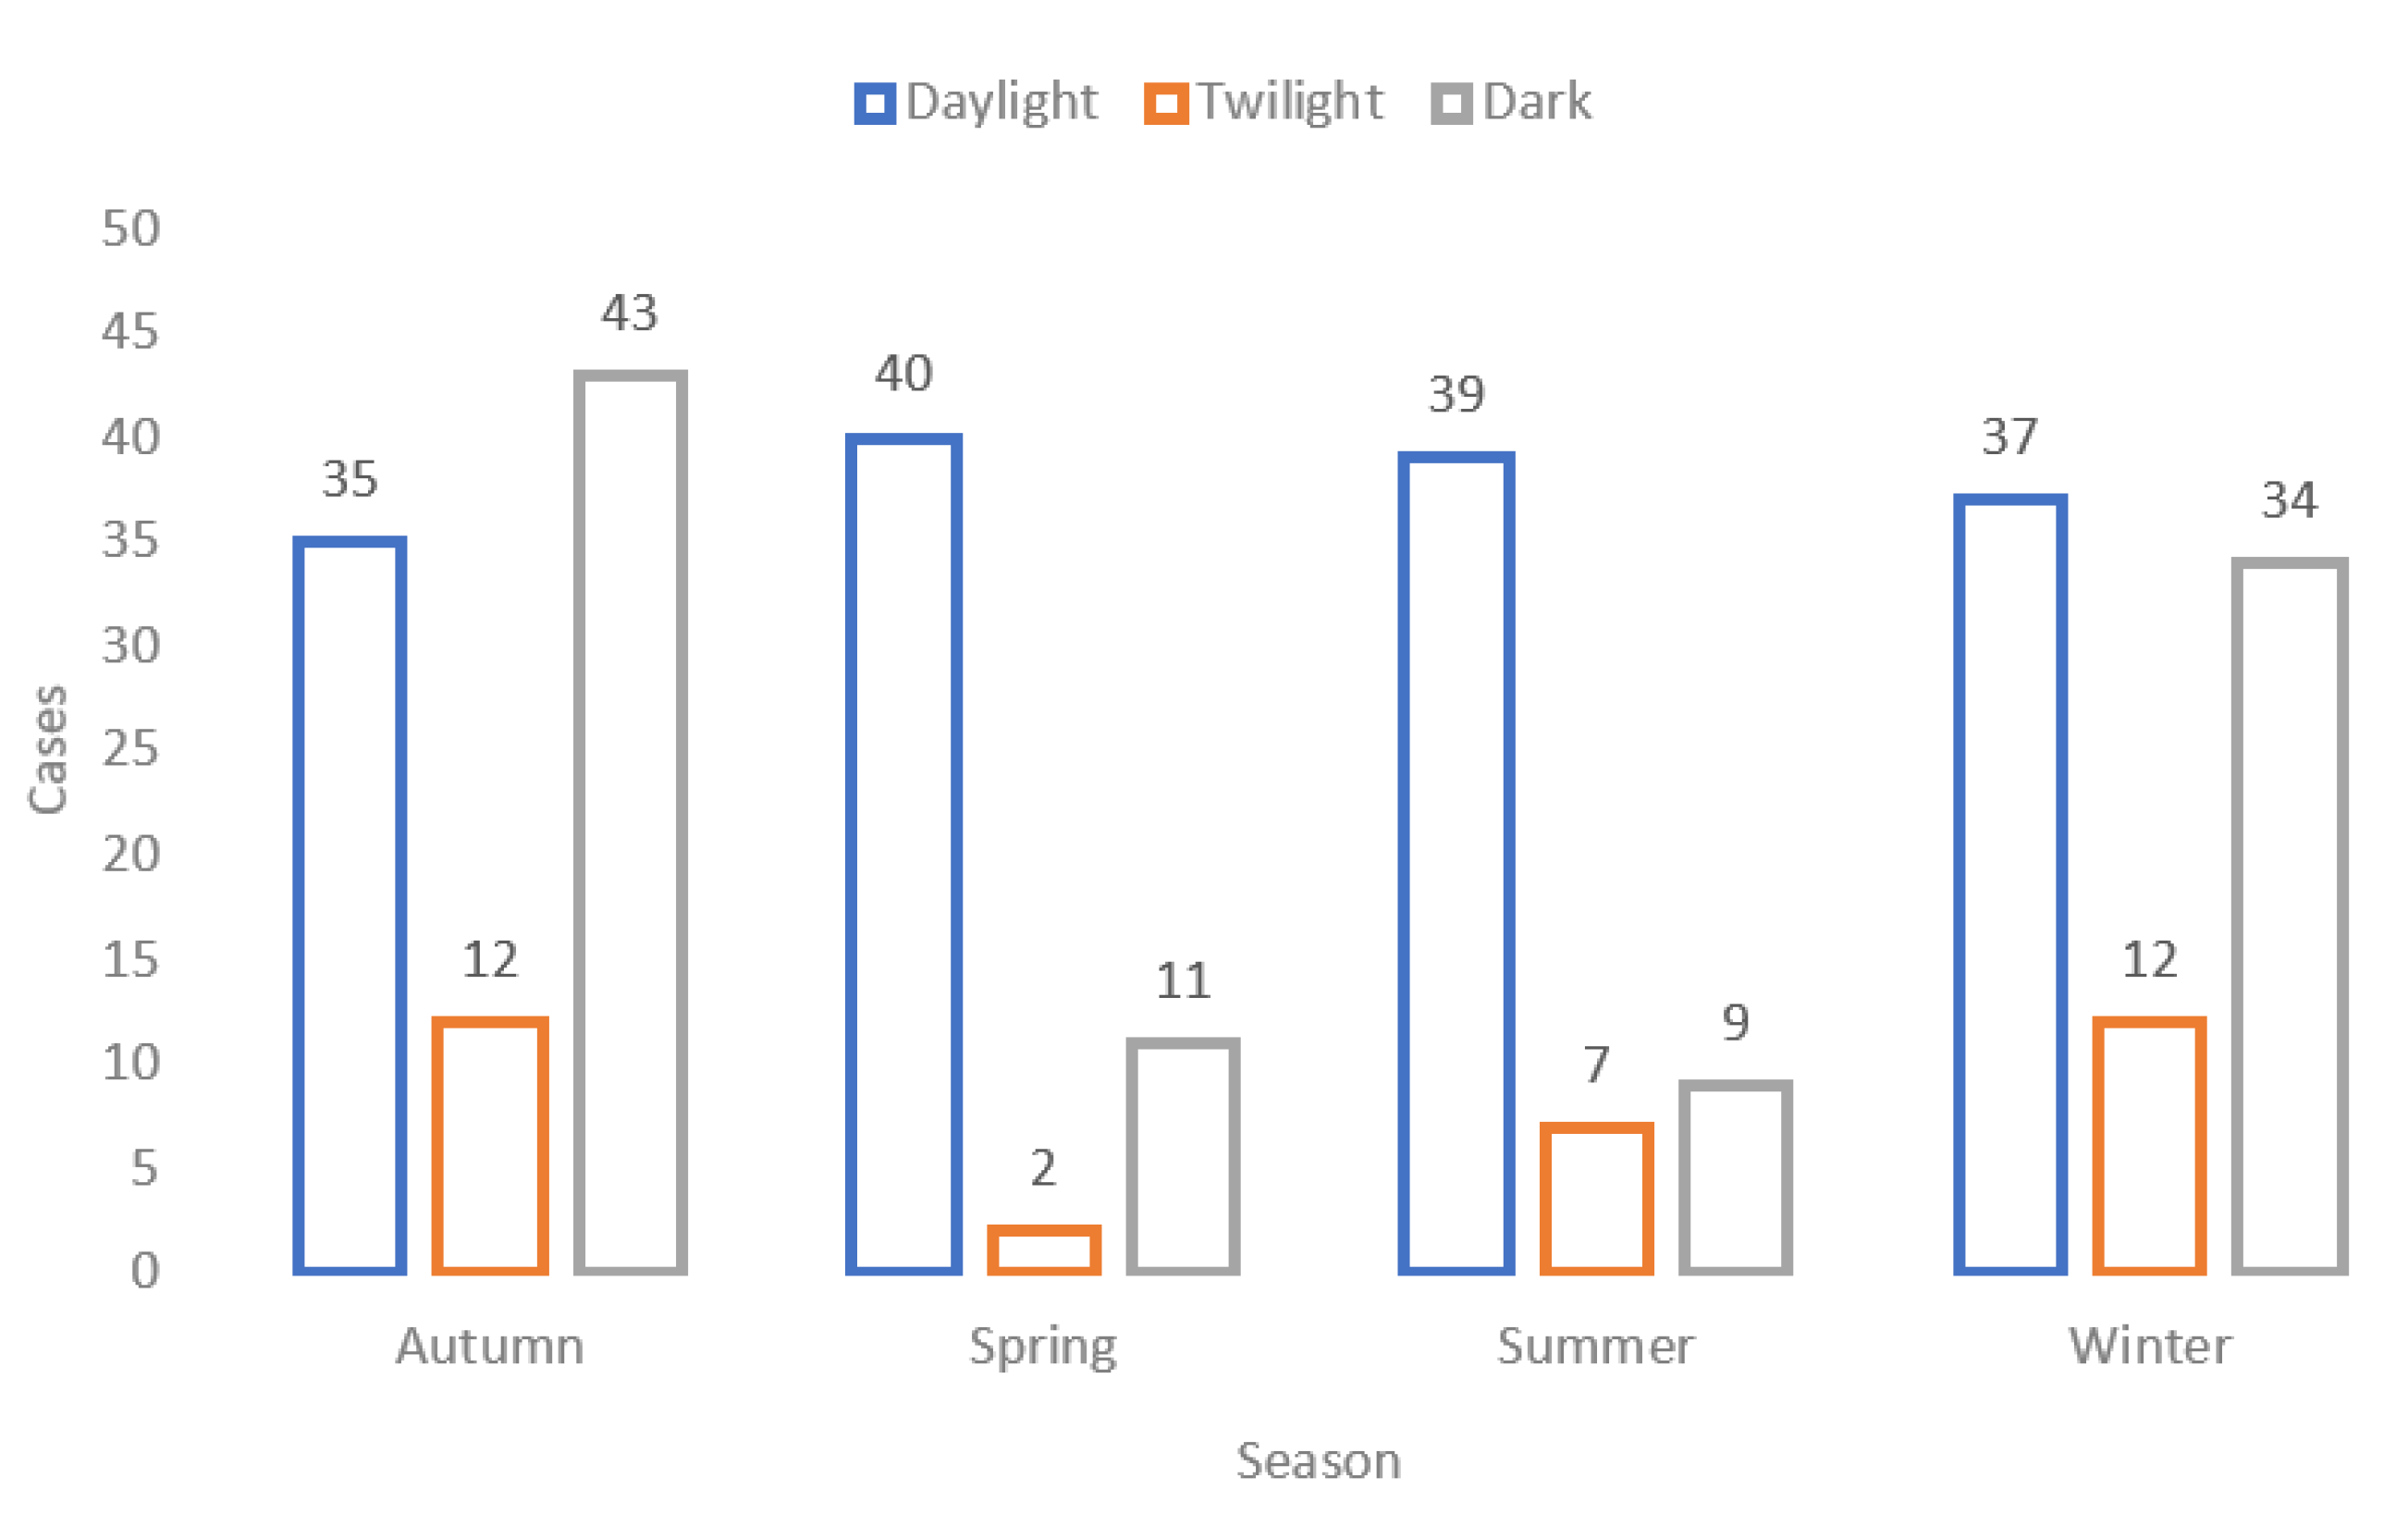
| Season | Winter (36.7%) | Winter (36.4%) | Spring (29.6%) | Autumn (44.9%) | ≤ 0.05 |
| Light conditions | Daylight (65.8%) | Daylight (57.1%) | Daylight (71.8%) | Dark (81.6%) | ≤ 0.05 |
| Time of day | 12:00–17:59 (55.7%) | 12:00–17:59 (51.9%) | 12:00–17:59 (39.4%) | 0:00–5:59 (55.1%) | ≤ 0.05 |
| Road type | Collector (41.8%) | Highway (32.5%) | Private road or area (38.0%) | Highway (57.1%) | ≤ 0.05 |
| Speed limit | 40 km/h (63.3%) | 80 km/h (44.2%) | 40 km/h (43.7%) | 100 km/h (32.7%) | ≤ 0.05 |
| Crash mechanism | Pedestrian on crossing (27.8%) | Pedestrian otherwise crossing road (48.1%) | Other pedestrian crash (25.4%) | Pedestrian stationary on road (42.9%) | ≤ 0.05 |
Publisher’s Note: MDPI stays neutral with regard to jurisdictional claims in published maps and institutional affiliations. |
© 2021 by the authors. Licensee MDPI, Basel, Switzerland. This article is an open access article distributed under the terms and conditions of the Creative Commons Attribution (CC BY) license (https://creativecommons.org/licenses/by/4.0/).
Share and Cite
O’Hern, S.; Utriainen, R.; Tiikkaja, H.; Pöllänen, M.; Sihvola, N. Exploratory Analysis of Pedestrian Road Trauma in Finland. Sustainability 2021, 13, 6715. https://doi.org/10.3390/su13126715
O’Hern S, Utriainen R, Tiikkaja H, Pöllänen M, Sihvola N. Exploratory Analysis of Pedestrian Road Trauma in Finland. Sustainability. 2021; 13(12):6715. https://doi.org/10.3390/su13126715
Chicago/Turabian StyleO’Hern, Steve, Roni Utriainen, Hanne Tiikkaja, Markus Pöllänen, and Niina Sihvola. 2021. "Exploratory Analysis of Pedestrian Road Trauma in Finland" Sustainability 13, no. 12: 6715. https://doi.org/10.3390/su13126715
APA StyleO’Hern, S., Utriainen, R., Tiikkaja, H., Pöllänen, M., & Sihvola, N. (2021). Exploratory Analysis of Pedestrian Road Trauma in Finland. Sustainability, 13(12), 6715. https://doi.org/10.3390/su13126715