Abstract
Road traffic accidents are currently between the seventh and tenth leading cause of death in the world, with approximately 1.35 million people killed per year. Despite extensive efforts by governments, according to the World Health Organization, road accidents still cause far too many deaths, especially among pedestrians, cyclists and two-wheel motor vehicle riders, who together account for almost 50% of road traffic fatalities. In particular, Spain had 410,974 traffic accidents between 2016 and 2019, involving 722,516 vehicles and 61,177 pedestrians with varying degrees of injury. This study uses the Bayesian network method to understand how the pedestrians’ responsibility and actions at the time of the traffic accident affect the injury suffered by said pedestrian, also considering the variables of the road infrastructure and vehicles at the accident site. The results confirm that the variables linked to the unsafe behavior of pedestrians, and their responsibility in traffic accidents, increase the risk of suffering serious or fatal injuries during an accident; for example, if a pedestrian is distracted this increases his/her probability of suffering a severe injury (27.86%) with respect to not being distracted (20.73%). Conditions related to traffic in high-speed areas, areas with no or poor lighting, and areas lacking sidewalks, also record increases in pedestrian injury, as is the case in the age group of pedestrians over 60 years of age.
1. Introduction
Road traffic accidents and road safety have undoubtedly become the subject of public health studies worldwide, as they are currently the seventh to tenth leading cause of global deaths [1]. Road traffic injuries rank sixth in the world in terms of years of life with disability, according to the World Health Organization [2]. Road safety is studied through different risk factors, such as infrastructure factors (type of road, lighting, pavements), human and behavioural factors (age, gender, actions taken) and vehicle factors (type of vehicle, speed of vehicles), and their interactions allow for a better understanding of the causes of road accidents and their impact on the injury rate of those involved [3,4].
In Spain, according to the “Dirección General de Tráfico” (DGT, General Directorate of Traffic), in 2019, 1755 people died (381 pedestrians), 130,475 were injured without hospitalisation (13,016 pedestrians) and 8613 were hospitalised (2069 pedestrians), as a result of 104,080 traffic accidents, placing the rate at 37 deaths per million inhabitants. In the case of pedestrians, there are concurrent factors in road traffic accidents, which are those related to people, vehicles and infrastructure [5].
Other studies conducted regarding pedestrians in Spain show that they have a two to seven times higher risk of being injured than a car driver. The risk of being injured in a traffic accident is very high, in fact, approximately 18% of the fatalities resulting from a traffic accident are pedestrians [6], a figure which, from the date of publication of the aforementioned book (2000) to the present day, is far from decreasing, given that in 2019, pedestrian fatalities accounted for 21.70% of those killed in road accidents [5].
Within the study entitled “Las principales cifras de la Siniestralidad Vial España 2019” (The main figures of Road Accidents in Spain 2019) prepared by the Observatorio Nacional de Seguridad Vial [5] (the Spanish National Road Safety Observatory), the most recurrent variables in the statistics of traffic accidents involving pedestrians are grouped into factors related to human behaviour, infrastructure and vehicles in the case of Spain. This study also highlights some important variables such as age, type of road where the accident occurs, distractions and light conditions at the time of the accident.
The study of pedestrian behaviour and their possible responsibility in traffic accidents is essential in order to understand the impact they can have on the degree of injury of accident victims, as well as on causing the actual traffic accidents. For example, according to Twisk, et al. [7], the use of certain electronic devices such as mobile phones and music players can impair pedestrian and cyclist behaviour when cycling in cities, and while they are not prohibited by law, road safety could benefit from pedestrians and cyclists limiting their use.
In another example, a study conducted to understand the interaction between human behavioural and infrastructure factors that may affect cyclist safety [8] found that traffic accidents could be predicted by studying variables related to risk behaviour and interactions with the user and infrastructure. Similarly, this research proposes the study of several of these variables and their possible impact on the safety of pedestrians, who, like cyclists, are more exposed to serious or fatal injuries than other road system users.
The interaction of pedestrians with their environment can also be studied to better understand the possibilities of preventing road accidents. Pedestrian behaviour, given certain circumstances in the infrastructure, seems to directly influence the generation of traffic accidents, or the harmfulness of pedestrian injuries during these accidents. A study conducted in Italy, using data from 2005 to 2015, suggests that the risk of pedestrian accidents can increase approximately twice as much when on-street parking is available [9].
As suggested by the study of [10] on traffic in Vietnam, the responsibility of pedestrians through their actions could have a relevant impact on the degree of injuries during a traffic accident, as well as the possibility of generating one by means of these same actions.
Risk behaviours and positive (proactive safe) behaviours are of relevant importance in studies and prevention of the causes of road accidents involving pedestrians and different road users, as mentioned in a validation study of a pedestrian behaviour questionnaire conducted in Spain in 2019 [11]. Some of these risk behaviours and positive behaviours were analysed in this study within the behavioural factor variables, using data gathered between the years 2016 to 2019 to assess pedestrian distractions, violations, actions and errors, as well as their positive opposites, when the traffic accident took place.
Having demonstrated the importance of variables related to pedestrian behaviour in traffic accidents, and the relevance of the study of these same accidents to protect the lives of road users, this study addresses the interaction of pedestrian behaviour variables with the degree of pedestrian injuries, also considering situational variables of a demographic, infrastructure and vehicle nature. The objective is to understand how the actions of pedestrians can influence the degree of pedestrian injuries during a road accident, enabling road safety decision-makers to take action to protect the lives of road users.
2. Materials and Methods
2.1. Bayesian Networks and Validation
Following the approach of Aldred et al. (2019) [12], in this study we consider Discrete Bayesian Networks [13] to model the probabilistic direct and/or conditional (in)dependence relationships between variables. Bayesian Networks are part of the set of probabilistic graphical models [14] whose associated graph is directed and acyclic (DAG). Such a graph reflects the probabilistic (in)dependencies between the different variables of the model resulting in a factorisation of the Joint Probability Distribution (JPD):
where are the variables included in the model and represents the set of parents of the variable given by the DAG. As a result, the learning process first seeks for these (in)dependencies obtaining the DAG (structural learning) and then, the parameters given by the factorisation are estimated (parametric learning) by maximum likelihood as these are the ones that better explain the observed data. To learn the DAG, the score-based greedy learning algorithm proposed by Buntine, W. (1991) [15] was applied. Note that the obtained DAG leads to a significant reduction of the JPD parameters, increasing the efficiency of the model learning process, and an easily interpretable representation of the relationships between the model variables included in the training sample.
Once the DAG and JPD, which together define the Bayesian Network, have been obtained from the sample [16], we can assess how the probabilities of the model’s variables are modified by introducing new evidence on one or more of its variables. That is, knowing that the variable takes the value we can answer the question “how does the probability of the rest of the variables change?” through the conditional probabilities and the factorisation shown above:
In particular, through such expressions we can obtain a Bayesian classifier of our target variable, in this case degree of pedestrian injury (pedestrians at risk of minor or no injury): MNI Risk; and pedestrians at risk of serious or fatal injury: Killed/Seriously Injured Risk (KSI Risk), which we will assess through cross-validation (10-fold) and considering the Area Under the ROC Curve as an evaluation measure [12,17], which is a standard measure of accuracy for binary probabilistic classifiers [18]. This parameter takes values in the interval [1], with 0 corresponding to a perfect anti-predictive model (assigns one class the opposite in all cases), 0.5 to a random predictor and 1 to a perfect model. Thus, for each subsample of the 10-fold and the joint prediction, obtained by combining the predictions on the 10-folds, an AUC (Area Under the Curve) value will be obtained, resulting in 11 values that show both the predictive capacity of the model and the variability of this capacity.
Similarly, we can naturally set up different sensitivity experiments of the target variable, or any of the model, to changes in different subsets of variables, allowing us to isolate the effect of each factor on the target variable. That is, given a subset of the variables, changes in the probability of injury harmfulness are assessed based on the values taken by that subset of variables (Section 3.2.2).
For the learning of the Bayesian Network and the evaluation of probabilities, the Matlab toolbox [19] Bayes Net (https://github.com/bayesnet/bnt, accessed on 1 June 2021) [20].
2.2. Gathering Data
The dataset used for the study comes from the database gathered over four years (2016, 2017, 2018 and 2019) relating to traffic accidents occurring in Spain. Such data was originally gathered by the Dirección General de Tráfico de España and provided to the authors for analysis. The data was gathered through four forms obtained from traffic accidents which occurred during the years mentioned above, resulting in four databases: accident base, driver base, pedestrian base and vehicle base.
For this study, the authors have used three of these databases: the accident database, the vehicle database and the pedestrian database. Within the accident database, there are variables related to the type of accident, where the severity of the accident is analysed through the injuries caused to the people affected in the accident, breaking down this information into minor injuries and no injuries, and serious and fatal injuries. The areas where the accidents occurred are also analysed, dividing them into roads or highways (high-speed zones) and crossing or street (low-speed zone), as well as the type of road where the accident occurs, like ring roads and bypasses, residential street, pedestrian streets and streets with special regulation. In addition, the database contains variables such as the type of sidewalk or the lack of any sidewalk, and also adds the favourable or unfavourable lighting conditions. In addition, in this database are some meteorological conditions that occurred at the time of the accident, divided into states such as cloudy, clear, light rain, heavy rain, hail or snow, and it also breaks down fog and visibility conditions for the driver.
On the other hand, in the vehicle database, all the characteristics of the vehicles involved in the accident are described, such as the type of vehicle, the vehicle documents, the mechanical situation, etc. Finally, the pedestrian database contains demographic data of the pedestrian such as age and gender, the injury suffered during the traffic accident, disaggregated into minor injuries and no injuries, and serious and fatal injuries. There is also information on the actions carried out by the pedestrian at the time of the traffic accident, the responsibility of this pedestrian in the accident and other important information that is detailed in the study.
The databases contain a total of 410,974 records for traffic accidents which occurred during the years 2016, 2017, 2018 and 2019 as well as 722,516 vehicles involved and a total of 61,177 pedestrians involved in traffic accidents, data that was collected from the “Formulario de Accidentes de Tráfico con Víctimas” (Casualty Traffic Accident Form). These databases contain 156 coded statistical items (variables) from the above-mentioned form. It is worthy of note that each accident has a unique identification (ID) number, in which more than one vehicle and more than one pedestrian may be involved, also bearing in mind that it is possible to have a traffic accident where no pedestrian is involved. For this reason, the total number of cases considered is the result of filtering out only accidents involving pedestrians, resulting in 56,253 accidents, 59,651 vehicles involved and making each pedestrian involved in a traffic accident a case study, resulting in a total of 61,177 cases to be analysed.
2.3. Study Variables
The study model has been divided into three groups in order to properly organise the process of calculation and analysis of results. As can be seen in Figure 1, the first level of study refers to the first level factors comprising the demographic factor (pedestrian gender and age), the vehicle factor (vehicle type), the infrastructure factor (area where the accident occurs, road type, pavement condition and lighting) and the behavioural factor (pedestrian action, pedestrian violation, pedestrian attention factors and alleged pedestrian errors) which studies the actions of the pedestrian during the traffic accident. The second level of study is made up by the pedestrian responsibility factor, comprising a single variable (pedestrian responsibility), referring to the existence, or lack thereof, of pedestrian responsibility in traffic accidents. Finally, in the third part of the model seen in Figure 1, the target variable (pedestrian degree of injury) can be observed, which has been divided into two states: pedestrians at risk of minor or no injury (MNI Risk) and pedestrians at risk of serious or fatal injuries (KSI Risk).
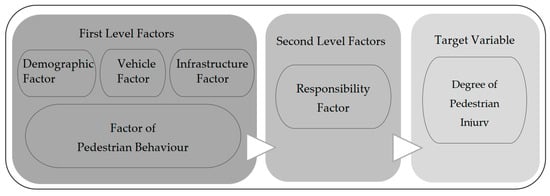
Figure 1.
Study model.
This study places special focus on the pedestrians’ degree of injury during road accidents (Table 1), emphasising the responsibility that the pedestrian may have through the actions he or she was taking at the time of the accident. As can be seen in Table 1, of the total number of cases analysed (61,177) where at least one pedestrian was involved in the traffic accident, 14.64% (8957) involved pedestrians with serious or fatal injuries.

Table 1.
Frequency of the target variable.
The responsibility factor variable, called “pedestrian responsibility”, has been discretised into two states (“yes” or “no”), to determine whether or not the pedestrian was responsible for causing the traffic accident (Table 2) and its direct influence on the degree of the injury. It can be seen that in 16.65% of the cases, the pedestrian was responsible for the accident, while in (38.62%) he/she was not. In the remaining cases it could not be determined whether or not the pedestrian was responsible for the accident.
Table 2.
Frequency of responsibility factor variables.
The behavioural factor variables are, in relation to the target variable, those variables that, through the actions taken by the pedestrian, could modify the risk of degree of injury through the pedestrian’s responsibility and by themselves. Table 3 summarizes the four variables considered and the frequency of occurrence in each of their states.
Table 3.
Frequency of behavioural factor variables.
Some variables, such as vehicle type, pedestrian age, pedestrian gender, accident location, pavement and road type, among others, are extensively studied to understand pedestrian degree of injury, as for example in the study by Seung-Hoon Park and Min-Kyung Bae [21] to analyse the pedestrian degree of injury rates by age group.
These variables have been considered in this study and distributed into three groups, referring to demographic, vehicle and infrastructure factors, with a total of seven variables (Table 4), according to the first study level reflected in the model represented in Figure 1. The percentage values of their occurrence in each case can be seen in Table 4, which shows a high participation of vehicles (cars, vans and off-road vehicles) in traffic accidents involving pedestrians (78.81%), as well as some significant values that are more repetitive and more frequent, such as people over 60 years of age (30.89%), the types of road (“urban crossing road” and “street”) (93.57%), raised pavements (46.85%) and lighting (92.21%). It is important to note that, when referring to raised pavements, we are referring to pavements that are not at the same level as the passing traffic, and not to overpasses over highways or streets within cities.
Table 4.
Frequency of situational factor variables.
Figure 2 shows the interaction of the Bayesian Network variables for this study, where the primary and secondary dependencies and connections of the target variable (pedestrian degree of injury) can be observed. In relation to the first level situational factors (demographic, vehicle, infrastructure), the variables “lighting”, “pavement” and “zone” are closely related to the pedestrian degree of injury.
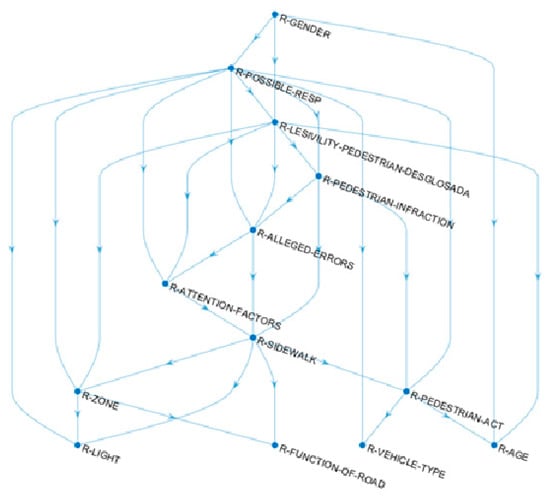
Figure 2.
Bayesian Network. Processed by the authors and generated in MatLab.
It is also important to note the direct connection of the degree of injury variable with pedestrian behaviour variables, such as “attention factors”, “alleged errors”, “pedestrian violation” and “pedestrian action”, as well as its close relationship with the variable “pedestrian responsibility”. All these interactions generate important changes in the probability of a pedestrian’s degree of injury, which can be verified in the results section.
The shape of the network and the interaction of all variables with various dependency connections and direct and indirect relationships is an indication of how the Bayesian network considers the interaction of all variables in the model and thus of the data of which it is comprised.
3. Results
3.1. Bayesian Network Study Model
The methodology and validation section explains how the validation of the model was performed, as well as the data learning method used by the Bayesian networks to achieve a reliable approximation of the results obtained. In the case of the study model of this research, it can be seen in Figure 2 how the target variable interacts with the variables of the different factors used in the sensitivity analyses. The reliability of these interactions, and hence the results obtained, are supported by the calculation of the area under the curve (AUC), which is shown in Table 5.
Table 5.
AUC for the objective variable.
The area under the curve (AUC) indicates the model’s ability to determine the probability of minor or no injury (MNI Risk) and fata or serious injury (KSI Risk) in the road traffic accident cases analysed. In the case of this study, the AUC values can be seen in Table 5, where AUC values correspond to the 10-fold (rows 1–10) and the joint series (row 11). The values vary from 0.71 to 0.75, demonstrating that there is no high variability present, which reflects the stability and accuracy of the Bayesian Network and its level of learning, confirming the viability of the proposed model and its ‘‘a priori’’ suitability for subsequent calculations.
3.2. Sensitivity Analysis
3.2.1. “A priori” Probabilities of the Model Variables with Respect to the Target Variable
Initially, “a priori” probabilities are calculated for each of the variables of the first level factors (demographics, infrastructure and pedestrian behaviour) and for the liability factor located at the second level of the proposed model. These probabilities are based on the two states proposed for the target variable (minor or no injury; serious or fatal injury), results which can be seen in Table 6 and Table 7. The “a priori” probabilities of the vehicle factor have not been studied, nor their possible combinations, since from the data provided by the DGT it is not possible to identify, for accidents with more than one vehicle, which vehicle has caused the pedestrian injury; however it is important to emphasise, as seen in Section 2.3 of this study, that cars (passenger cars, vans and off-road vehicles) are the type of vehicle most frequently involved in accidents involving pedestrians (78.74%).
Table 6.
“a priori” probability of the target variable according to the pedestrian behaviour and responsibility factor variables.
Table 7.
“a priori” probability of the target variable according to the first-level factor variables.
The results included in Table 6 show each of the pedestrian behaviours and responsibility factor variables and their “a priori” probabilities with respect to the target variable. As regards “pedestrian responsibility” it can be clearly observed that in a traffic accident the risk of serious or fatal injury decreases by (5.15%) if the pedestrian has no responsibility for the accident, with the states of this variable being “yes” (22.09%) and “no” (16.94%). In relation to the variables (pedestrian action, pedestrian violation, pedestrian attention factors and presumed pedestrian errors) that are grouped in the pedestrian behaviour factor according to the model represented in Figure 1, the ‘‘a priori’’ probabilities of these variables can be observed in Table 6, highlighting actions such as crossing correctly (14.89%), not committing violations (13.49%), not being distracted (20.73%) and not committing errors (15.03%), which represent the lowest values of the probability of enduring a serious or fatal injury for each of these variables, with differences of up to 24.30% with their opposite states, such as walking out between parked vehicles (19.32%) and walking unlawfully on a road (37.79%).
As for the rest of the first-level factors, the ‘‘a priori’’ probabilities of the states of the target variable with respect to the variables that are grouped in this factor are shown in Table 7. For example, in the case of the demographic factor in the variables “age” and “gender”, where people in the 25–40 age range have the lowest probability of suffering serious or fatal injury in a traffic accident (10.55%) and people over 60 years of age have the highest probability (22.10%); the division by gender denotes a slightly lower probability in the case of women (13.91%) and a higher probability in the case of men (16.25%).
On the other hand, in the infrastructure factor, several important values can be observed in the variables that make up this factor, such as that the “a priori” probability of suffering a serious or fatal injury for the pedestrian in traffic accidents is considerably lower if the area of the accident is “street or crossing” with (13.76%), while this probability rises to (33.47%) if the accident happens in the area “main road or motorway”, where the speed limits are higher. Similarly, the “a priori” probability of suffering serious or fatal injuries is higher when there are no pavements (20.02%) or no or poor lighting (17.39%), compared to the other states of the variables “pavement” and “lighting”, which fall to (16.87%) and (14.77%) if there are raised pavements or proper lighting, respectively.
According to the results observed in the ‘a priori’ probabilities of the target variable states in relation to the situational, behavioural and pedestrian responsibility factor variables, the correct actions of the pedestrian and the situational conditions in which the traffic accident occurs have a significant impact on the pedestrians’ degree of injury.
3.2.2. Sensitivity Analysis of the Model Variables with Respect to the Target Variable
In relation to the main objective of this study and following the model established for it, as well as the interaction generated by Bayesian network learning, the sensitivity analysis has been carried out considering the following interactions: (1) the pedestrian’s degree of injury outcome due to the pedestrian’s responsibility in the accident with respect to demographic variables; (2) the pedestrian’s degree of injury outcome due to the pedestrian’s responsibility in the accident with respect to infrastructure variables; (3) the pedestrian’s degree of injury outcome due to the pedestrian’s actions and the responsibility factor.
- (1)
- Results related to the pedestrian’s degree of injury due to his/her responsibility in the road traffic accident with respect to demographic variables (Table 8 and Table 9).
Table 8. Gender-based pedestrian degree of injury probabilities in relation to age groups.
Table 9. Pedestrian degree of injury probabilities based on pedestrian responsibility in relation to gender and age groups.
In terms of pedestrian degree of injury rates with respect to personal variables (Table 8), it can be seen for the group of people aged 25 to 40 years, both for the female gender (9.11%) and for the male gender (12.05%), that the probability values representing serious injuries are lower than those of the rest of their group. It is also important to note that with regard to the “a prior” probabilities of suffering a serious or fatal injury according to gender, male (16.25%) and female (13.91%), that age becomes an important factor, as the risk of suffering these types of injuries when the study group is over 60 years of age increases to (23.37%) in the case of the male gender (difference of 7.12%) and to (21.12%) in the case of the female gender (difference of 7.21%).
For the case of the same variables of the personal factor (gender and age), but in relation to the pedestrian’s responsibility in the traffic accident, the degree of injury probabilities is provided in Table 9. The ‘‘a priori’’ values of pedestrian responsibility for pedestrian degree of injury in fatal and serious injury accidents is 22.09% when there is responsibility and 16.94% when there is no responsibility. There is a significant shift in these values when there is pedestrian responsibility and also when the population is over 60 years old, reaching 31.83% in the probability of having serious or fatal injuries (difference of 9.74%); while when there is no responsibility in the group over 60 years old, the difference is a little less with respect to the ‘a priori’ probabilities (8.02%), evidencing that responsibility and age are important factors in pedestrian safety.
On the other hand, it can be observed that in the interaction between pedestrian responsibility and gender, there is no major difference in any of their states with respect to the “a priori” probabilities of suffering a serious or fatal injury depending on the pedestrian’s responsibility for the accident.
- (2)
- Results related to the pedestrian’s degree of injury due to responsibility in the road traffic accident with respect to the infrastructure variables (Table 10 and Table 11).
Table 10. Pedestrian degree of injury probability based on pedestrian responsibility and infrastructure factor location variables.
Table 11. Pedestrian degree of injury probability based on pedestrian responsibility and infrastructure factor situational variables.
In terms of pedestrian degree of injury severity based on pedestrian responsibility and the variables “zone” and “road type” which attempt to describe the location where the traffic accident occurred (Table 10), significant variations are found with respect to the ‘a priori’ probabilities of having a serious or fatal pedestrian injury, as these fall when the accident occurs in the state “urban crossing road/street” when there is no pedestrian responsibility (16.25%) as well as when there is responsibility (19.01%); the most notable variation occurs when there is pedestrian responsibility and the accident takes place in the “main road/motorway” state (49.36%), where the increase climbs to 27.27% in the described injury risk with respect to its ‘‘a priori’’ probability under the same conditions (22.09%).
Similarly, in the case of the variable “type of road”, Table 10 reflects the differences in all the states of this variable, and that the responsibility of the pedestrian plays an important role in the traffic accident, since where there is no pedestrian responsibility, all the probabilities of suffering serious or fatal injuries during the traffic accident are seen to drop with respect to those where there is responsibility. However, the greatest increase in this risk is recorded in the peri-urban or ring roads (high speed), reaching a probability of 30.62% with respect to the ‘a prior’ probability of 22.09%, registering a difference of 8.53%, similar to the figures seen in the specially regulated zones (29.71%), with a difference of 7.62% with respect to their equal condition in the ‘a priori’ probabilities.
Under the same conditions, significant differences can be seen in the pedestrian’s degree of injury risk with respect to his or her responsibility and the situational variables of the infrastructure factor (Table 11), where it can be seen that the variable “pavement” seems to have a particular influence in the state in which it does not exist, i.e., when the traffic accident occurs in a place where there is no pavement for the pedestrian to walk on, increasing the risk of serious or fatal injury to 36.17% with respect to 22.09% of its “a priori” value (difference of 14.08%). Even if the pedestrian is not responsible for the accident, the risk of serious or fatal injury increases to 20.39% compared to the “a priori” probability of 16.94% if there are no pavements to walk on (an increase of 3.45%).
It is also important to note that in the case of the variable “lighting”, the behaviour is similar to that of pavements, since in both states of the variable “pedestrian responsibility” the probability of suffering serious or fatal injuries during the traffic accident decreases when there is adequate lighting (natural or artificial), which stands at 21.77% if there is pedestrian responsibility (a 0.32% decrease with respect to the “a priori” probabilities) and 16.93% if there is no pedestrian responsibility (a 0.01% decrease with respect to the ‘a prior’ probabilities). The same relationship can be observed in the opposite case, where lighting (natural or artificial) is poor or non-existent, the risk increases up to 24.62% when there is pedestrian responsibility (2.53% increase over the “a prior” probabilities) and to 17.24% when there is no pedestrian responsibility (0.30% increase over the “a priori” probabilities).
- (3)
- Results related to the pedestrians’ degree of injury rate due to the interaction of his/her actions and responsibility for the accident (Table 12).
Table 12. Probability of pedestrian injury according to pedestrian responsibility and variables with respect to pedestrian actions.
Table 12 shows the sensitivity analysis of pedestrians’ degree of injury based on the pedestrian’s responsibility and the different actions carried out by the pedestrian during the traffic accident. In the first section, it can be seen that in almost all states of the variable “pedestrian action”, the probability of suffering a serious or fatal accident increases with respect to the ‘a priori’ probabilities of pedestrian responsibility when the action committed is not correct, with the exception of the state called “crossing properly”, where the probability value remains remarkably similar. For example, the case in which the probability of degree of injury increases the most is in the “walking or standing” state (on the roadway or hard shoulder), reaching a value of 35.90% in the case of pedestrian responsibility for the accident (a 13.81% increase), and in the case of no responsibility. The greatest increase is found in the “walking out” state (between parked vehicles), with a value of 22.53%, a 5.59% increase with respect to the “a priori” probabilities.
When talking about pedestrian violations, we can observe that in all cases where a pedestrian commits a violation, regardless of his or her responsibility for the accident, the probability of suffering a serious or fatal accident increases, with the exception of when no violation is committed, in which case it decreases to 18.07% if there is responsibility (a 4.02% decrease) and 16.89% if there is no responsibility (a 0.05% decrease). The largest increase is registered when the pedestrian is walking or standing on the roadway in an unlawful manner (47.84%), resulting in a 25.75% increase in the probability of serious or fatal injury during the road traffic accident compared to the “a priori” probability of 22.09%. In the case of not being responsible for the traffic accident, the highest increase in the probability of having a serious or fatal injury during the traffic accident occurs when the pedestrian does not respect traffic lights (51.88%), compared to 16.94% of the ‘a priori’ probability (34.94% increase).
With respect to the variable “pedestrian care factors”, the greatest increase in the probability of suffering a serious or fatal injury during the traffic accident occurs when the pedestrian has just witnessed a previous accident or suffers from a sudden illness, which are represented in the state “previous illness or accident” with a probability of 46.30% if the pedestrian is responsible for the accident, and 30.19% if the pedestrian is not responsible, with an increase of 24.21% and 13.25%, respectively, in comparison to the ‘a priori’ probabilities (22.09%) and (16.94%).
Finally, with respect to Table 12, we have the sensitivity analysis relating to the alleged pedestrian errors, the cases where clear errors are recorded and there is responsibility for the traffic accident on the pedestrian’s part. The probabilities increase significantly in all states; for example, for the state “failure to see a sign” the probability of having a serious or fatal injury reaches 32.50%, as well as 32.94% in the state “incorrect manoeuvre”, with differences of 10.85% and 10.41% compared to its “a priori” probability of 22.09%.
4. Results Discussion
Pedestrian behaviours (actions, mistakes, violation, or distractions) and their responsibility for road accidents directly impact the likelihood of serious or fatal injuries during road accidents. The “a priori” probabilities show that a pedestrian has a 22.09% chance of serious or fatal injury if he/she is responsible for the accident, which decreases to 16.94% if the pedestrian is not responsible for the accident. These “a priori” probabilities are compared in this study with the interaction of behavioural and situational variables to understand the changes in pedestrian injury probabilities in different situations.
Some of the data initially worthy of note in this study (Table 6), are behaviours related to distractions with respect to other accidents or distractions in general (including distractions due to the use of technological equipment and mobile phones), where a difference in the probability of having a serious or fatal injury can be seen between the states “No factor is appreciated” with 20.73% and “Distraction” with 27.86%, values that are in accordance with what is expressed by Useche, Alonso and Montoro (2020) [11]. The study also found, for example, that the use of mobile phones, as well as other social trends, could have implications for pedestrian safety.
As with the pedestrian behaviour factors, some other variables related to demographic and infrastructure factors (Table 7), show high probabilities of suffering a serious or fatal injury in a traffic accident compared to other states of their own variables; for example, people over 60 years old reach a probability of 22.10%, and an even higher value can be observed on main roads or motorways where speed limits are higher (33.47%); something similar can be understood from the study carried out by Rasouli, et al.(2017) [22], which studies the relationship between situational factors such as the speed of vehicles or the infrastructure of a pedestrian crossing on the behaviour of the pedestrian to perform certain actions, encountering findings of the possible interrelationship between these factors, as studied in this research.
Table 8 and Table 11 show how pedestrian responsibility in traffic accidents, in interaction with demographic and infrastructure variables, show states with a higher risk of serious or fatal injury, especially when there are no pavements (36.17%), poor or no lighting (24.62%), high-speed roads that are not pedestrian-friendly (49.36%) and age groups over 60 years old (31.83%). Consistent with these data, a study published in 2020 using data from China [23], found that the higher severity of pedestrian casualties in traffic accidents is closely related to age (elderly), lighting conditions (occasional darkness), roads (high speed) and infrastructure (such as pavements), as well as pedestrian behaviour.
Overall, in Table 8 and Table 12 of this study, it can be seen that in the interaction of all variables and pedestrian responsibility, there is at least one state where the probability of serious or fatal injury in a traffic accident increases significantly, even more so when the interaction is with the behavioural variables, which may be the elements leading to pedestrian responsibility in a traffic accident. For example, Table 12 shows that the pedestrian behaviours “not respecting a traffic light” and “unlawfully on road” increase this risk to 51.88% and 47.84%, respectively. These values, as well as the others shown in the tables above, are in line with the findings of the study conducted by [24], where it is said that the high level of pedestrian risk behaviour (pedestrian behaviour) reinforces the idea that in several cases pedestrians are the cause of certain traffic accidents, increasing their risk of being injured.
In particular, in Table 12, it can be evidenced that some actions of pedestrians such as standing and walking on inappropriate places, crossing inadequately or not seeing traffic signs, leading to an increase in the probability of suffering serious or fatal injuries during a traffic accident. Two studies conducted to understand traffic flow prediction and emergency traffic light control systems, indicate that prediction techniques using artificial neural networks and traffic light control systems dealing with accidents at intersections using deterministic and stochastic petri nets [25,26], can help improve accident management.
From the above, it is clear that pedestrian behaviours through their actions before and during road accidents are critical to reducing the number of road traffic fatalities and injuries. Therefore, this study provides important data on the interrelation of certain variables (demographic and infrastructure), pedestrian behavioural variables and pedestrian responsibility in road accidents with the probability of being seriously injured or killed as a result of a road accident. These data allow us to think about the implementation of preventive actions in programmes to reduce traffic accidents and the degree of pedestrian injury, as well as the possibility of new technological designs that consider the behaviour of road users with a view to reducing the impact of possible traffic accidents.
5. Conclusions
As mentioned at the beginning of this study, road accidents continue to be a major cause of death or disability among road users. As a result, the efforts of road safety enforcement agencies worldwide are enormous, with multinational programmes such as the “Vision Zero” project or the World Health Organisation’s “Global Plan for the Decade of Action for Road Safety”, which, among other topics, discusses the factors of responsibility and behaviour of road users, with the fixed idea of reducing the rate of road accidents and road traffic injuries and fatalities.
Comparatively, there is not a large amount of previous research that can related pedestrian behaviour and pedestrian responsibility in road accidents to the likelihood of serious or fatal injuries during road accidents. In this study, the relationships between demographic, infrastructure, behavioural and pedestrian responsibility factor variables were investigated to better understand how pedestrian actions (conditions that can be changed) and situational variables (conditions that cannot be changed) influence the degrees of pedestrian injury in traffic accidents.
As pointed out in some of the other articles studied and discussed in this research, this study confirms the close relationship between pedestrian behaviour and the degree of pedestrian injury during road accidents. The findings indicate that unsafe pedestrian behaviours increase the likelihood of serious or fatal injuries during road accidents, and that safe behaviours help to reduce this likelihood, strengthening the lines along which road safety programmes can be promoted and scaled up to reduce accident rates globally.
5.1. Practical Implications
This study provides general contextualisation of the degree of pedestrian injury due to traffic accidents, and how their behaviour through their actions can influence the outcome of a pedestrian injury and in relation to causing accidents. Road safety regulators worldwide, and particularly in Spain, could consider the results obtained in this research for creating various road safety activities, focusing on raising awareness of the unsafe actions of pedestrians and other vulnerable road users when travelling in shared spaces or near vehicles. Activities designed to raise awareness could focus on three main points: (1) the pedestrian’s responsibility for the traffic accident, since in these cases there is a possibility of being the cause of injury to third parties, and furthermore, the probability of being seriously injured or even killed is very high; (2) traffic offences and errors on roads and pavements, which can focus on making pedestrians and vulnerable road users feel the need to pay attention to traffic signs; and, (3) pedestrian actions and attention factors, which are fundamental to ensuring order, safety and accident prevention in the world’s road spaces.
5.2. Limitations and Future Research
Primarily, this study is limited by the amount of data (2016 to 2019) and variables in the global database. This was built from the four databases provided by the Spanish Directorate General of Traffic (DGT). There are several elements of study that have not been analysed in the proposed network that may be of great interest in understanding the causes behind traffic accidents and the degree of pedestrian injury. Due to the naturalness of learning of the Bayesian networks, which gather a large amount of data for their operation, some peculiarities of each variable in its different states may go undetected, so a more extensive and separate research into the most relevant states found in this study would be advisable; for example, the incidence of the states of the variable “pedestrian violations”, which generate the highest values for the probability of serious or fatal injury during a traffic accident, the states “not respecting a traffic light” and “standing unlawfully on the road”, could be better analysed separately and even disaggregated for further study. Likewise, important situational factors occurred during the accident should also be analysed, such as the meteorological conditions that are included in the questionnaire filled out during traffic accidents in Spain, which could influence the actions of pedestrians and drivers in traffic accidents. However, this study is based on individual pedestrian behaviour, but it is also possible to analyse group behavioural factors.
Author Contributions
Conceptualisation, J.D.F. and S.G.-H.; methodology, S.H. and J.D.F.; software, J.D.F. and S.H.; validation, J.D.F., S.H. and S.G.-H.; resources, S.G.-H.; writing-original draft preparation, J.D.F.; writing-review and editing, J.D.F., S.G.-H., M.Á.M. and S.H.; project administration, S.G.-H. All authors have read and agreed to the published version of the manuscript.
Funding
This research received no external funding.
Informed Consent Statement
Not applicable.
Data Availability Statement
Not applicable.
Acknowledgments
We would like to thank the Dirección General de Tráfico de España for providing the data for this study, as well as the people who collaborated in the research.
Conflicts of Interest
The authors declare that they have no conflicts of interest.
References
- WHO. The Top 10 Causes of Death. Available online: https://www.who.int/news-room/fact-sheets/detail/the-top-10-causes-of-death (accessed on 1 June 2021).
- WHO. Global Health Estimates: Life Expectancy and Leading Causes of Death and Disability. Available online: https://www.who.int/data/gho/data/themes/mortality-and-global-health-estimates (accessed on 1 June 2021).
- Oviedo-Trespalacios, O.; Scott-Parker, B. The sex disparity in risky driving: A survey of Colombian young drivers. Traffic Inj. Prev. 2018, 19, 9–17. [Google Scholar] [CrossRef] [PubMed]
- Luo, Q.; Chen, X.; Yuan, J.; Zang, X.; Yang, J.; Chen, J. Study and simulation analysis of vehicle rear-end collision model considering driver types. J. Adv. Transp. 2020, 2020, 1–11. [Google Scholar] [CrossRef]
- de Seguridad Vial, O.N. Las Principales Cifras de la Siniestralidad Vial. España 2019; Dirección General de Tráfico: Madrid, España, 2019. [Google Scholar]
- Montoro, L.; Alonso, F.; Esteban, C.; Toledo, F. Manual de seguridad vial: El factor humano. Univ. Psychol. Bogotá 2002, 1, 87–88. [Google Scholar]
- Twisk, D.A.; Commandeur, J.J.; Vlakveld, W.P.; Shope, J.T.; Kok, G. Relationships amongst psychological determinants, risk behaviour, and road crashes of young adolescent pedestrians and cyclists: Implications for road safety education programmes. Transp. Res. Part F Traffic Psychol. Behav. 2015, 30, 45–56. [Google Scholar] [CrossRef]
- Useche, S.; Montoro, L.; Alonso, F.; Oviedo-Trespalacios, O. Infrastructural and human factors affecting safety outcomes of cyclists. Sustainability 2018, 10, 299. [Google Scholar] [CrossRef]
- Congiu, T.; Sotgiu, G.; Castiglia, P.; Azara, A.; Piana, A.; Saderi, L.; Dettori, M. Built environment features and pedestrian accidents: an Italian retrospective study. Sustainability 2019, 11, 1064. [Google Scholar] [CrossRef]
- Dinh, D.; Vũ, N.; McIlroy, R.; Plant, K.; Stanton, N. Effect of attitudes towards traffic safety and risk perceptions on pedestrian behaviours in Vietnam. IATSS Res. 2020, 44, 238–247. [Google Scholar] [CrossRef]
- Useche, S.A.; Alonso, F.; Montoro, L. Validation of the Walking Behavior Questionnaire (WBQ): A tool for measuring risky and safe walking under a behavioral perspective. J. Transp. Health 2020, 18, 100899. [Google Scholar] [CrossRef]
- Aldred, R.; García-Herrero, S.; Anaya, E.; Herrera, S.; Mariscal, M.Á. Cyclist injury severity in Spain: a Bayesian analysis of police road injury data focusing on involved vehicles and route environment. Int. J. Environ. Res. Public Health 2020, 17, 96. [Google Scholar] [CrossRef] [PubMed]
- Castillo, E.; Gutiérrez, J.M.; Hadi, A.S. Sensitivity analysis in discrete Bayesian networks. IEEE Trans. Syst. Man Cybern. Part A Syst. Hum. 1997, 27, 412–423. [Google Scholar] [CrossRef]
- Koller, D.; Friedman, N. Probabilistic Graphical Models: Principles and Techniques; MIT Press: Cambridge, MA, USA, 2009. [Google Scholar]
- Buntine, W. Theory refinement on Bayesian networks. In Uncertainty Proceedings 1991; Elsevier: Amsterdam, The Netherlands, 1991; pp. 52–60. [Google Scholar]
- Neapolitan, R.E. Learning Bayesian Networks; Pearson Prentice Hall: Upper Saddle River, NJ, USA, 2004; Volume 38. [Google Scholar]
- Fawcett, T. An introduction to ROC analysis. Pattern Recognit. Lett. 2006, 27, 861–874. [Google Scholar] [CrossRef]
- Hanley, J.A.; McNeil, B.J. The meaning and use of the area under a receiver operating characteristic (ROC) curve. Radiology 1982, 143, 29–36. [Google Scholar] [CrossRef] [PubMed]
- Matlab. MATLAB Para Inteligencia Artificial. Available online: https://es.mathworks.com/ (accessed on 1 June 2021).
- Murphy, K. The bayes net toolbox for matlab. Comput. Sci. Stat. 2001, 33, 1024–1034. [Google Scholar]
- Park, S.-H.; Bae, M.-K. Exploring the determinants of the severity of pedestrian injuries by pedestrian age: a case study of Daegu Metropolitan City, South Korea. Int. J. Environ. Res. Public Health 2020, 17, 2358. [Google Scholar] [CrossRef] [PubMed]
- Rasouli, A.; Kotseruba, I.; Tsotsos, J.K. Understanding pedestrian behavior in complex traffic scenes. IEEE Trans. Intell. Veh. 2017, 3, 61–70. [Google Scholar] [CrossRef]
- Hu, L.; Wu, X.; Huang, J.; Peng, Y.; Liu, W. Investigation of clusters and injuries in pedestrian crashes using GIS in Changsha, China. Saf. Sci. 2020, 127, 104710. [Google Scholar] [CrossRef]
- Poó, F.M.; Ledesma, R.D.; Trujillo, R. Pedestrian crossing behavior, an observational study in the city of Ushuaia, Argentina. Traffic Inj. Prev. 2018, 19, 305–310. [Google Scholar] [CrossRef] [PubMed]
- Chen, X.; Wu, S.; Shi, C.; Huang, Y.; Yang, Y.; Ke, R.; Zhao, J. Sensing Data Supported Traffic Flow Prediction via Denoising Schemes and ANN: A Comparison. IEEE Sens. J. 2020, 20, 14317–14328. [Google Scholar] [CrossRef]
- Qi, L.; Zhou, M.; Luan, W. Emergency traffic-light control system design for intersections subject to accidents. IEEE Trans. Intell. Transp. Syst. 2015, 17, 170–183. [Google Scholar] [CrossRef]
Publisher’s Note: MDPI stays neutral with regard to jurisdictional claims in published maps and institutional affiliations. |
© 2021 by the authors. Licensee MDPI, Basel, Switzerland. This article is an open access article distributed under the terms and conditions of the Creative Commons Attribution (CC BY) license (https://creativecommons.org/licenses/by/4.0/).