1. Introduction
Urbanization creates opportunities for economic development, better quality of life, and reductions in poverty, but urban environments also present numerous challenges such as crime, congestion, and pollution [
1,
2]. Among the many consequences of congestion are lower productivity, high environmental impacts, and greater inequality. INRIX [
3] provides a congestion impact index, rating Bogotá, Rio de Janeiro, Mexico City, Istanbul, and Sao Paulo as the most congested cities in 2019. One of the main measures adopted to combat congestion in these Latin American cities since the end of the 1990s has been the construction of Bus Rapid Transit (BRT) systems [
4]. In BRT systems, roadways are exclusively dedicated to buses where interaction with other traffic is minimized. BRT systems accommodate passenger capacity that can be as high as that in a metro system, at a fraction of the cost. However, one key disadvantage for BRT systems, unlike metro systems, is the competition for ground-level space with other urban space users. In cities with BRT systems, priority is given to buses over all other modes of transport and urban space is re-designed to favour the BRT system, as described by Hidalgo and King [
5].
A healthy economy is crucial for cities and requires an efficient movement of goods and services. One of the major challenges for cities in achieving sustainability is urban freight transport. However, city planning focuses primarily on passenger transport. Freight is primarily a business-to-business industry, and the cities’ efforts to address the impacts are often limited to urban and traffic planning [
6]. Yet, urban freight transportation and urban development are interdependent. Any interruption or blockage of the flow of goods in and out of a metropolis would certainly increase retail price levels, impair the development of the urban centre itself, slow economic activity, and drain financial resources from the municipal budget [
7]. In addition, with the growth of e-commerce distribution channels, the urban demand for goods will become more pronounced and fragmented as many small packages will need to be delivered to customers’ locations quickly. As this commerce model continues to grow, urban freight will require more road and delivery space, which will bring new challenges both for the public sector and for consumer-focused industries [
8].
Urban freight transport is often encouraged to mitigate its externalities with punitive measures (e.g., access restrictions), since from a public perspective, freight is seen as a nuisance rather than as an enabler of the economy [
2]. This is particularly acute in: (i) Dense city areas with limited or no space for road capacity expansion (where land uses have developed organically over time, becoming incompatible with logistics demands); and (ii) areas that have been re-designed to prioritize BRT projects, and where freight vehicles and logistic operations are restricted. This paper will focus on the latter.
The extended implementation of BRT systems is relatively new, with many large projects starting in the beginning of the 21st century, as presented by Trubia et al. [
4]. The main objective of this paper is to propose a methodology, using six criteria, to evaluate the impacts on urban freight operations caused by the implementation of BRT systems, and to identify other relevant spill-over effects. This paper uses Cali (Colombia) as the case study for analysis. The main question is how BRT implementation has affected freight operations and how we can evaluate these impacts. We propose an evaluating matrix of 12 sub-criteria to assess future projects and expansions of BRT systems towards more sustainable systems that include freight transport operations. This methodology could be applied to other cities with large-scale implementations of BRTs, and be compared with the results from Cali. The conclusion section outlines some relevant strategies in BRT systems to consider loading and unloading operations and flux, and offers further recommendations.
2. Background
Latin American cities have seen significant transformations in the last two decades [
9]. One of the biggest changes has been the construction of BRT systems that have become the axis of mobility in 56 Latin American cities (31.81% of the cities that have BRT around the world), with 20,909,541 passengers per day mobilized (61.49% of global passengers) and 1863 km constructed (35.09% of of global kilometers) [
10]. BRT systems are “a flexible, rubber-tired form of rapid transit that combine stations, vehicles, services, running ways and information technologies into an integrated system with strong identity” [
11]. The first BRT system was constructed in Curitiba (Brasil) in 1982, and then in Bogota (Colombia) in 2000. The BRT in Bogota became the proof of concept that such systems could enhance mobility in large cities without compromising the large budgets needed for other social projects. BRTs were then implemented in various cities both in emerging and developed countries: five cities in Africa (2.84%), 45 in Asia (25.56%), 44 in Europe (25%), 21 (11.93%) in Northern America, five in Oceania (2.84%), and 56 in Latin America (31.81% as shown) [
10]. BRTs in developed countries often have different characteristics, as they complement existing public transportation modes and their capacity needs do not require exclusive lanes for all corridors.
In Colombian cities, there are three types of bus operations: Articulated, standard, and feeder buses. Recently, new buses powered by engines with Natural Gas Vehicles (NGV) and electric vehicles were put into operation. The projects also include integrated cable car systems to improve access to remote areas. Although most BRT systems in Colombia and in Latin America are facing financial crises, BRT systems have been successfully implemented in terms of geographic coverage (in Cali, 90.7% of the city was covered by the system in 2018 [
12,
13,
14,
15,
16,
17], with an average of 455,000 users per day [
18]). The initial investment came from increased public subsidies, and operations are usually financed by toll/tariff collections. Previous evaluations show that BRT systems are extremely environmentally friendly [
19] and that congestion in the city’s main corridors has decreased, particularly in terms of heavy vehicles. In addition, infrastructure, land use, and quality of urban space since BRT systems were implemented [
19]. However, few studies have evaluated the environmental impacts of BRT systems in urban areas where heavy traffic has been diverted.
BRT systems have enabled cities in emerging economies to streamline their transport services into one-bus-one-owner systems that were previously multiple small enterprises that competed, often unfairly, for service. Several Latin American cities have replaced their semi-deregulated and dispersed public transport services, improving the quality of service issues and multiple negative externalities [
5]. Communities needed a more efficient, cleaner, and safer alternative for public transport, and BRT systems represented a low cost and flexible alternative for cities that could not implement expensive, rigid rail systems. Nonetheless, as reported in the literature, implementing such systems is complex, and entails multiple challenges and unforeseen consequences [
20,
21,
22,
23].
A list of barriers to BRT passenger operations includes [
22]: (i) Institutional complexities and lack of technical capacity; (ii) lack of alignment among stakeholders; (iii) strong promotion of competing modes; (iv) the perception of BRT as a lower quality mode of transport; (v) traditional bias towards vehicle capacity expansions; (vi) opposition from existing bus operators; and (vii) lack of community participation [
22]. Other challenges include underestimating the implementation effort (i.e., optimism bias); discontinuities due to political cycles; lack of national policies supporting BRT development; insufficient funding for adequate implementation; and not enough time for construction [
22]. Along with these barriers, several authors have noted the additional challenge of integrating BRT systems with other forms of mobility [
24].
In terms of freight, two main conflicts with BRTs have been studied in the literature: Freight vehicle restrictions and the removal of loading zones. Lyons et al. [
25] analyzed the impacts of prohibiting freight vehicles over 3.5 tons on BRT and trolleybus corridors in Mexico City. The authors highlighted that many of these corridors traverse industrial areas and overlap with corridors previously used by freight vehicles. The authors compared the current scenario versus other scenarios in a macroscopic model to estimate the impacts on flows and local emissions (NOx and CO). They concluded that medium and heavy truck bans on what used to be the main freight corridors produced travel time increases of between 7 and 9% for freight vehicles, but they did not show any major impact on congestion or emissions [
25].
Fatnassi et al. [
8] proposed a shared transportation option that could be used to move passengers and goods in urban areas, respectively. They argue that sharing the network will increase the utility and decrease the implementation costs associated with this transportation mode. In Paris (France), a public transport project sought to isolate bus circulation from the rest of the traffic to increase bus speed and improve public transport service, however, it made goods deliveries extremely difficult. Through active engagement from retailers and freight transport experts, loading zones encroached on or were built on the sidewalk [
26]. In New York City, the public transit corridors on Third Avenue caused conflicts mainly due to a lack of loading space on the east side. To solve this, the bus lane was moved to an offset design in which the parking and loading space were added to the curb [
27].
The Complete Streets approach has attracted attention as a way of looking at mobility from an urban space planning perspective and not exclusively from a traffic perspective. Complete Streets are street designs that accommodate all users inclusively (public transportation, freight, and non-motorized transportation). Vandegrift and Zanoni [
28] define Complete Streets as a policy and design approach that requires streets to be designed and operated to allow equal access to all people and major forms of transportation, rather than just motor vehicles. They state that the design principles of Complete Streets include pedestrian infrastructure, traffic calming, and accommodating bicycle and public transit. Complete Streets is a concept that was initially aimed at integrating bicycles, private cars, and public transportation systems. New York and Paris implemented Complete Streets principles to integrate freight and BRTs. Conway [
29] provides a set of design solutions to accommodate freight vehicles in Complete Streets and to reduce conflicts between freight vehicles and vulnerable roadway users.
As shown in this literature review, there is increasing interest in the integration of public transport systems with other urban transportation users. Although there are some recommendations and assessments of the impacts of certain BRT measures on freight, there is a lack of studies looking at the medium to long-term impacts of BRT systems on freight operations. Moreover, there are no studies from developing countries where BRT systems are the backbone of public transportation. This paper studies the implementation of BRT systems and the conflicts with freight operations using multiple perspectives and criteria (i.e., legislation, environmental impacts, mobility patterns, infrastructure developments, and land use) in Cali (Colombia), a representative Latin American case study.
3. Method
An ex-post assessment is proposed to evaluate the impact of BRT systems on urban freight. A set of relevant criteria and sub-criteria is defined, based on a literature review and a set of semi-structured interviews with six experts in different professions that work in institutions of the local government (additional information about these interviews is provided in [
30]. The interviewees were asked to give a score for 12 sub-criteria in an adaptation of an ex-post Analytical Hierarchical Process [
31] using scores from 1–10. The 12 sub-criteria were grouped in six key criteria as presented below:
Mobility patterns (2): “Congestion” and “Sustainable mobility”;
Environmental impacts (2): “Noise and pollution” and “Public space quality”;
Infrastructure for loading and unloading operations (3): “Schedules”, “Way of transporting goods”, and “Implementing costs”;
Land use (1): “Land use value”;
Legislation (3): “Policy—legal framework”, “Control”, and “Tax benefits”;
Geographic distribution (1): “Localization (for logistic corridors)”.
Most decision problems are analyzed by assigning weights to criteria based on some higher objectives [
31]. The alternatives are then rated with respect to these criteria and their priorities weighed and summed. This is a similar process as using the composition principle of the Analytic Hierarchy Process [
31] (i.e., weighing the elements of a level by the priorities of their parent criteria and adding these to obtain an overall priority for each element).
For each criterion, a set of sub-criteria was defined and some variables and data sources were identified to operationalize the assessment. The results of this ex-post assessment will be informative for future BRT projects as the analysis includes potential explanations for why the BRT implemented in Cali had negative effects on urban freight. The analysis will also shed light on what design factors should be considered in future projects to avoid hindering urban freight, and thus negatively affecting the whole system.
Interviews were conducted in six governmental agencies that are concerned in one way or another with strategies for urban freight activities. The Planning Department carries out urban mobility plans and defines land use policy. The Transit and Transport Agency define normativity for parking zones and traffic regulations (including for bikes) and manage roadway infrastructure. The Infrastructure Agency is in charge of civil engineering works, road maintenance, and public roadway infrastructure development. The Police are in charge of controlling public space occupation, surveillance, and safety. The Environmental Department supports environmental initiatives and controls pollution and contaminants, and the Municipal Enterprise for Urban Renewal Projects (a public-private institution) is in charge of the main renewal projects in downtown Cali [
30].
As shown in the following sections, different data sources were used to evaluate the performance of the BRT system in terms of those criteria. The evaluation focused on assessing the changes in freight performance prior to and post implementation of the BRT.
3.1. Data Sources
For mobility patterns, the main inputs were the Average Daily Traffic (ADT) on national roads since 1997 [
32], vehicle counts and an analysis of the level of road infrastructure service for motorized mobility [
33], and a total of 2915 truck interception surveys carried out as part of the Mobility Survey in Cali [
34].
To ascertain the environmental impacts, the authors used data from the municipality’s Environmental Department [
35]. This entity monitors local emissions using nine stations spread across the city. The level of emissions is assessed via the Air Quality Index (AQI), based on the US EPA (United States Environmental Protection Agency) methodology, which takes into account the most pervasive air pollutants (PM10, SO
2, NO
2, O
3, and CO) [
35].
With regards to the infrastructure criteria, we used secondary data from reports that describe the infrastructure in the area of influence of the BRT [
19]. This was complemented with in situ observations, Google Street View, geographical information systems data, and local surveys to describe the characteristics of the infrastructure (e.g., parking facilities, road capacity, curbside spaces, street profiles) before and after the implementation of the BRT.
For the land use criteria, the authors used secondary data, mainly from two reports describing the regulations and the evolution of land uses in the area of influence of the BRT corridor [
19,
36].
For the legislative analysis, the documents principally include 15 decrees dating from 1976 to 2017. We also considered more than 180 judicial reactions such as demands, administrative solicitations, claims, complaints, and right of petitions that are officially documented in the Legal Counsel Office of Metro Cali S.A. (BRT management body) and Local Planning Offices. We used key variables in a comparison matrix (see Index B; Analysis Matrix): “Considerations”, “Type of Vehicles”, “Area or Road Axis”, “Schedules”, “Control”, “Sanctions”, and “Others.” Plotting the restricted areas and corridors for freight transport from 1976 to 2017 was also useful in identifying geographical legislation patterns.
For the geographic distribution analysis, geographical legislation patterns were also useful, as well as an Origin–Destination (OD) matrix that relies on data collected and analyzed by the city authorities [
34]. Cali’s OD freight matrix makes it possible to compare different patterns both in areas where BRT was implemented and in areas not served by the BRT according to previous zonal classification studies [
36]. These studies were analyzed and mapped using the arctoolbox functions provided by the software Esri
®ArcMap
TM, California USA, permitting a broad view of the key variables.
Semi-structured interviews, including with businesses, carriers and shippers, courier company managers, public authority representatives, local resident representatives, and two researchers, were used to make a descriptive analysis concerning the legislative and geographic distribution of BRT and freight systems, and were used to complement hard data particularly in the case of infrastructure and land-use when historical data was not available.
3.2. Data Analysis
A quantitative impact assessment [
37] was applied to assess the environmental impacts and mobility pattern criteria, while a qualitative descriptive analysis was applied to assess changes in legislation, geographic distribution, infrastructure, and land-use criteria. For the environmental impacts and mobility pattern criteria, the changes before and after implementing the BRT were assessed using a quasi-experimental design to which a Difference in Differences (Diff-Diff) Method was applied. In the Diff-Diff method, the change in the output variable was assessed between a treatment group (T) and a control group (C) in two particular points in time: Before implementation (t0) and after implementation (t1) of the BRT. Following [
37], the impact (i.e., the effect of the treatment) can be captured as:
3.3. Study Case
There are 53 Latin American cities that have implemented BRT systems, mobilizing a total of 19,964,541 passengers per day, with 169 corridors, totalling 1748 km [
10]. The average population in these 53 cities is 2,068,920 inhabitants, the average population of their metropolitan areas is 4,235,281 inhabitants, and the average population density in the metropolitan areas is 9273 inh/m
2. The average distance of truck corridors in the 53 cities is 33 km, and the average number of corridors is 3.
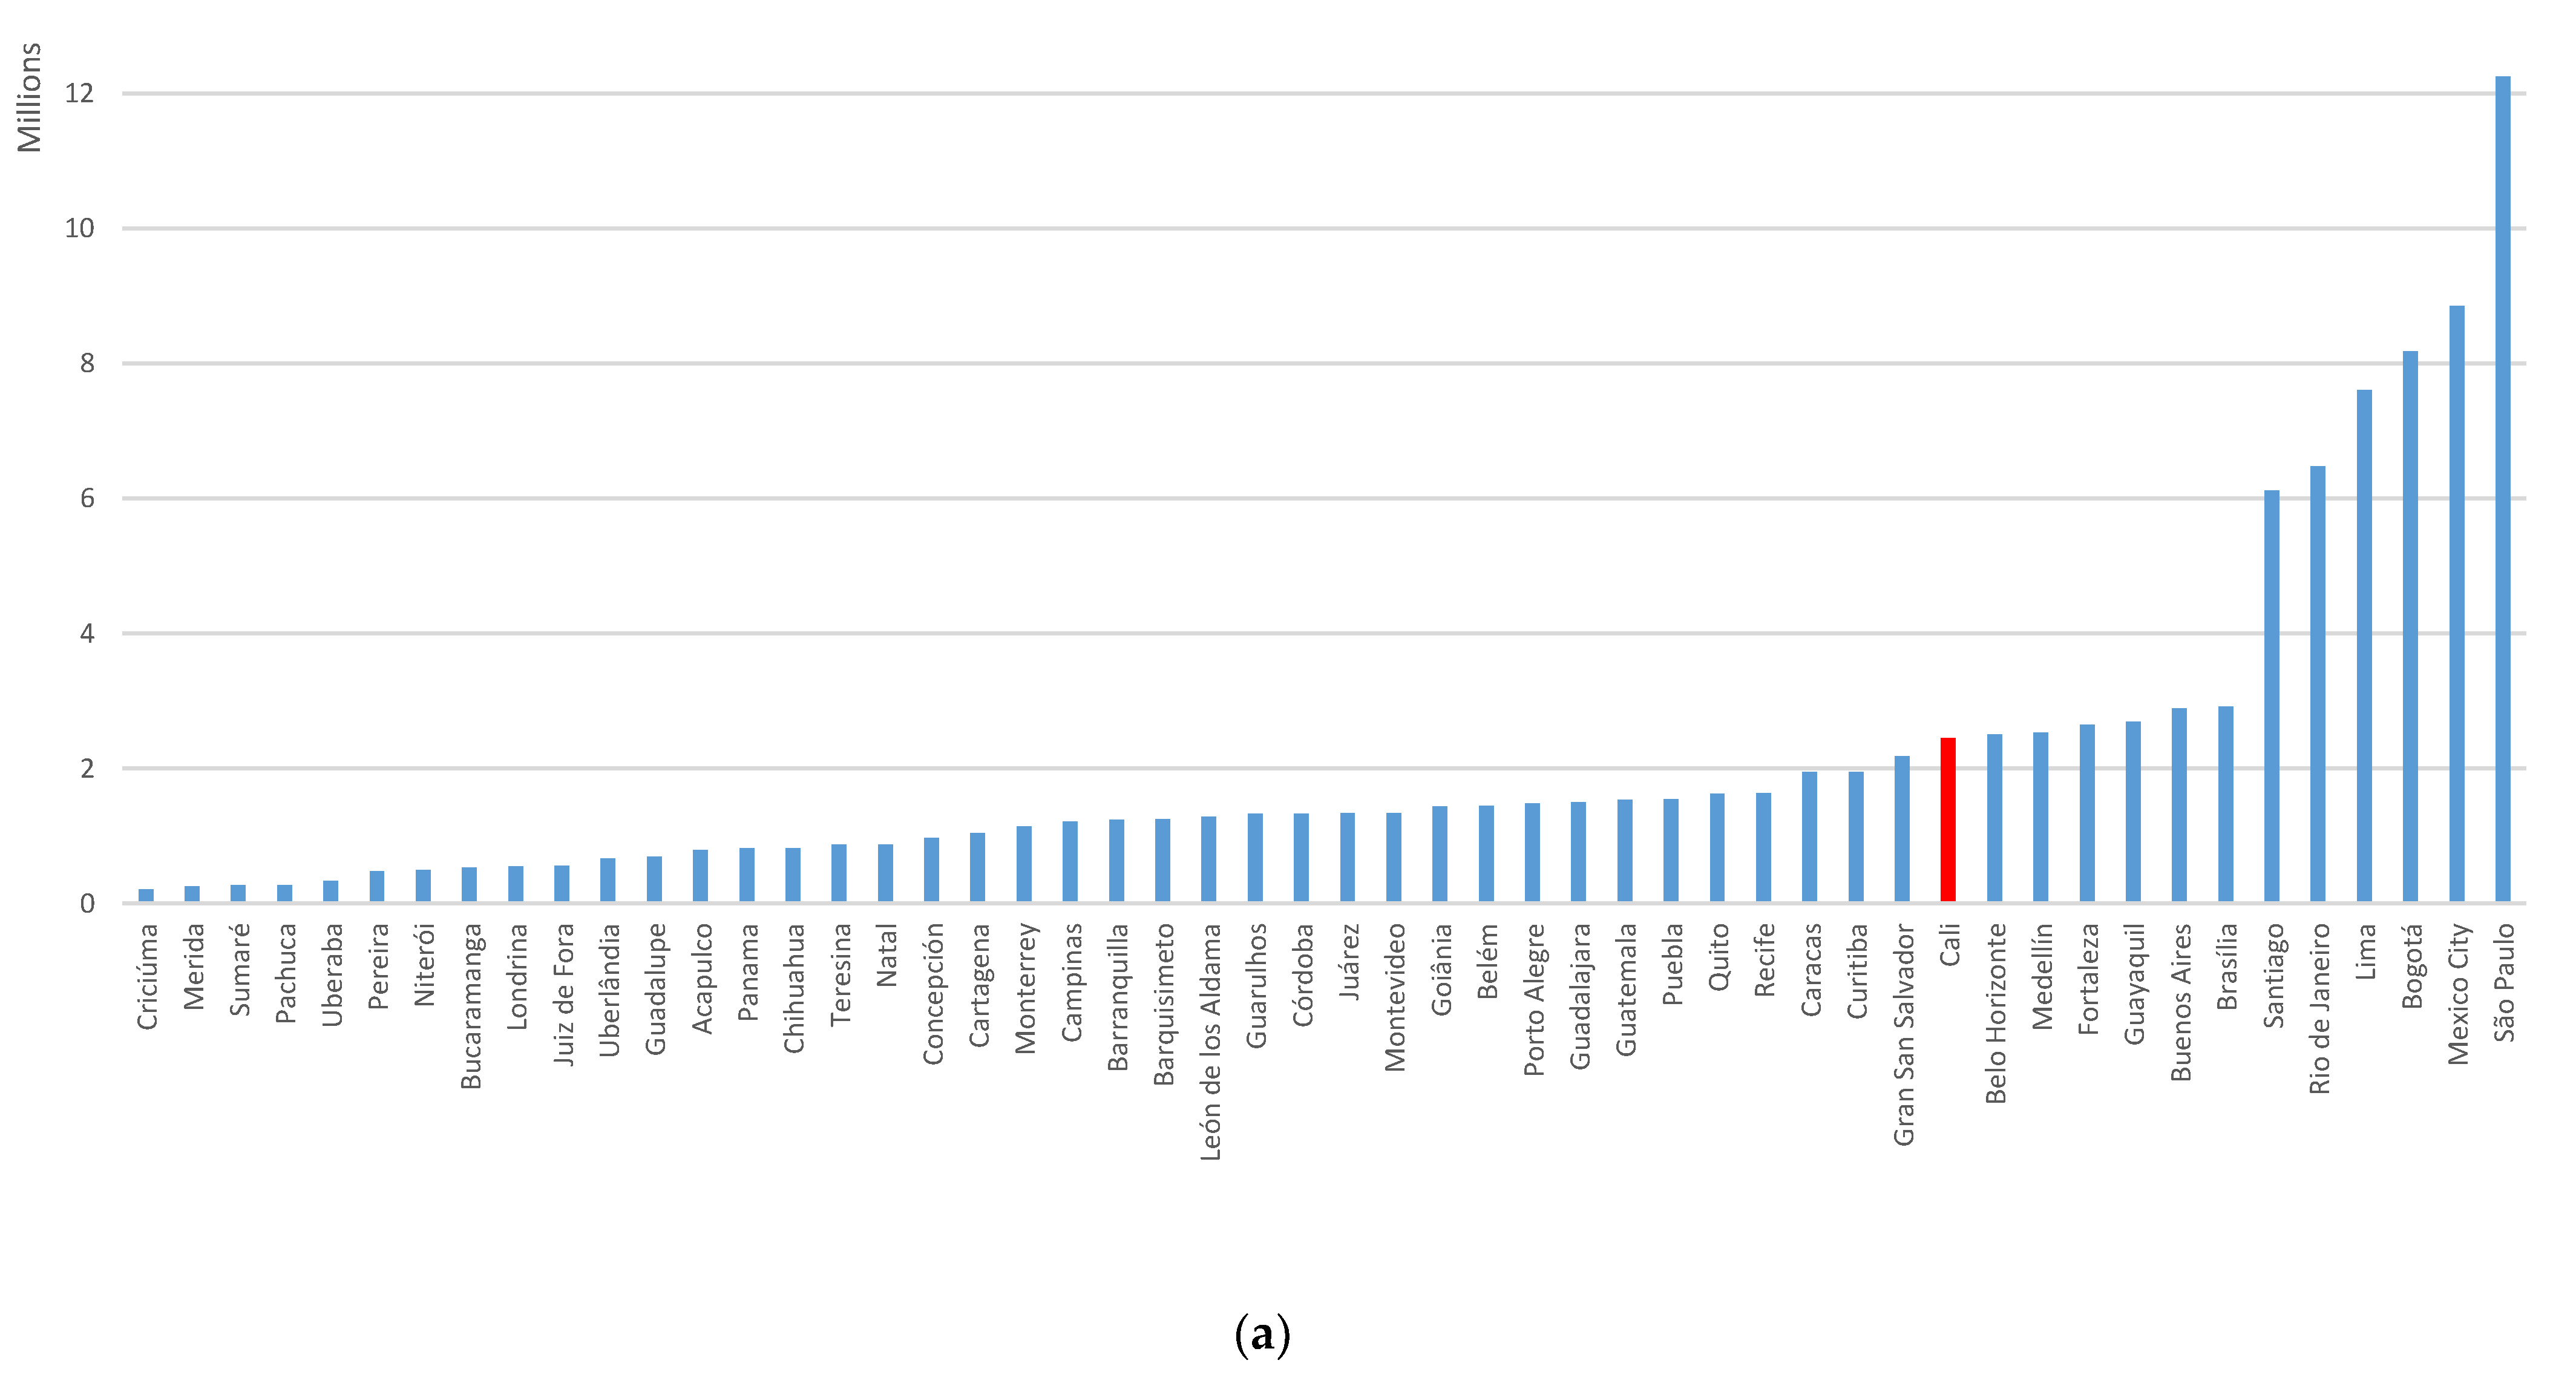
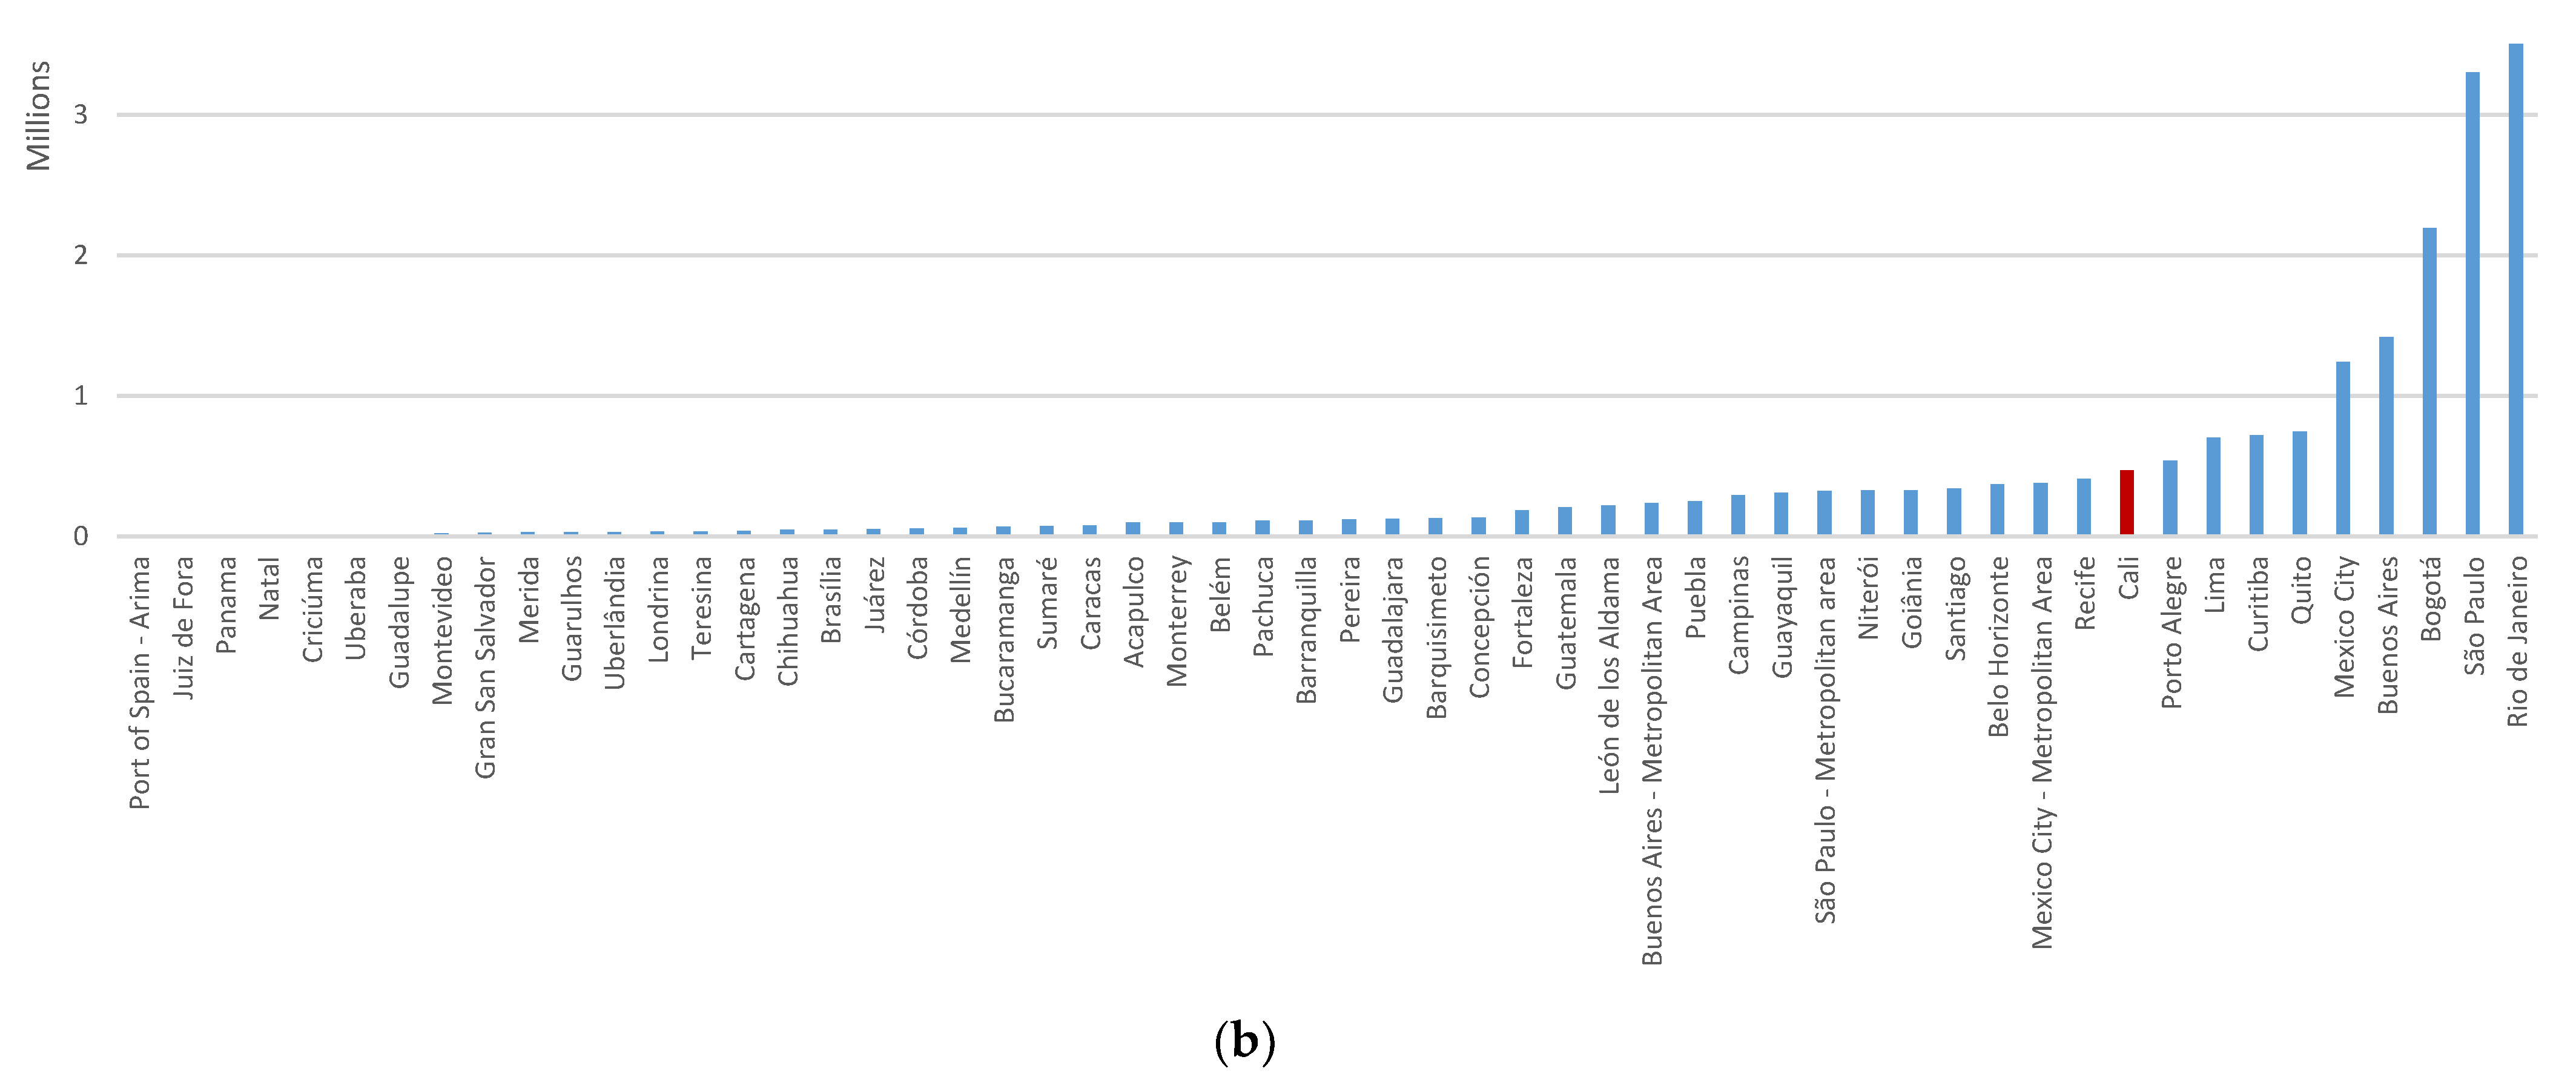
We selected Cali as the case study due to: (i) Its size, with over 2 million inhabitants and fast growth. Cali is large enough to have major congestion issues without being in a state of gridlock, as in other larger cities; (ii) its public transportation system uses a BRT network that has been in place for 10 years; (iii) it is home to large companies, particularly in the sugar and beverages industries, and approximately 135,000 delivery trips and 60 metric tonnes of goods are generated in the city every day. It is also close to Buenaventura, the country’s largest port; and (iv) both primary and secondary data were available from multiple sources. In terms of population, number of, and length in kilometres of its corridors, Cali is similar to Porto Alegre, Brazil; Curitiba, Brazil; Belo Horizonte, Brazil; Guayaquil, Ecuador; and Buenos Aires, Argentina, see
Figure 1.
4. Results
The scientific method used in this study would permit the evaluation of alternative BRT designs in the particular contexts of Latin American cities that need to more fully account for and include freight operations.
4.1. Ex-Post Evaluation
To evaluate public transport policies and big projects that influence urban freight transport, we present here the weights proposed, see
Table 1. Interviewees considered the sub-criteria “schedules” and “localization” as the most important variables, and “tax benefits” as the least important (12.30%). The most important criterion is the geographic distribution of logistic corridors (i.e., integrated or segregated from BRT systems), and defining those corridors represents a crucial decision when planning the transport policy. The average weight is 8.03, and the standard deviation is 1.17, indicating a low variability observed in the criteria’s weights. Pedestrianization and traffic calming measures are highly supported by authorities, residents, and scholars. Nevertheless, experts expressed concern about how these projects might impact freight operations. They agree that freight transport normativity is not updated and not exhaustive, and that they have never participated in the decision-making process.
4.2. Mobility Patterns
Secondary data containing Average Daily Traffic (ADT) on national roads since 1997 [
32] was used to plot traffic growth in the Cali metropolitan area. The ADT analysis shows an accelerated growth of 48% (across 11 years), in particular in those corridors that connect industrial and logistic areas with the urban area from 2004 (before BRT implementation) to 2015 (after BRT implementation). Private vehicle and truck traffic have grown by 55 and 56%, respectively, but bus traffic has grown by only 6%.
The ADT values are used to compare traffic increases between t0 = 2004 and t1 = 2015 in (a) industrial areas and (b) mixed industrial/commercial areas, and in areas (i) served by a BRT or (ii) not served by a BRT, as shown in
Table 2.
According to the Diff-Diff Analysis, private car traffic grew by 93% in the entry points to the city served by the BRT system in an industrial area where truck restrictions were imposed, while it was reduced by 98% in a mixed area (industrial and commercial). Truck traffic grew 141% in a mixed area, but it declined by 20% in an industrial area. This indicates that BRT implementation could alter traffic depending on the very specific context and land use of the city. Truck restrictions have allowed an intensification of private car flows in BRT corridors in industrial areas, which contribute to congestion and emissions. These restrictions are also probably concentrating truck traffic in non-BRT corridors. Although this analysis showed that BRT stations and corridors in the urban area could alter private and truck traffic, other variables influence the nature and the magnitude of the possible impacts. As establishments located in mixed areas in BRT corridors will still need to receive their supplies, it is reasonable to conclude that part of the increase in small vehicle traffic is explained by smaller vehicles—rather than trucks—making deliveries to those establishments. There is evidence in the literature that freight companies react to truck restrictions using smaller vehicles to deliver in those areas [
38].
Vehicle counts and an analysis of the level of road infrastructure service for motorized mobility [
33] shows that most heavy goods traffic is concentrated in the city’s western corridors. A low level of service can be seen in most of the main routes throughout the city during peak hours, including BRT corridors. It is also evident that most of the city access shows a low level of service as well. The rate of motorization in the city is probably the main reason for congestion. This is due to the fact that there are far more private vehicles than goods vehicles on the road. The only policy restriction on private vehicles is the traffic reduction scheme known as “pico y placa”, that consists of restrictions applied to cars during the peak hours, based on the number plates. The detailed modal distribution of heavy traffic for the city network indicates that BRT corridors have mostly reduced 3- to 4- axle trucks [
33].
A total of 2915 truck interception surveys were carried out as part of the Mobility Survey in Cali [
34]. In response, 46.54% of total freight vehicles surveyed identified the BRT system area as their destination; and 27.73% of total freight vehicles surveyed gave the BRT system influence area as the start of their journey. It is important to highlight that 62.14% of urban freight trips have destinations within the BRT system’s area of influence, and 57.13% of urban freight trips begin in those areas [
36]. It can also be seen that the city centre, and the south micro-centre (both BRT areas of influence) are the most important origins and destinations for trucks intercepted at the periphery. Three-axle trucks represent 81% of intercepted trucks, with 35% destined for warehouses, and 25% for distribution centres, followed by factories and businesses. Of the trucks surveyed destined for the city centre, 35% go to unload and 22% go to load. Of the trucks surveyed that gave the city centre as their origin, 13% go to unload and 10% go there to load.
4.3. Emissions Estimations
The air-quality index (AQI) in Cali for 2013 to 2018 was higher in eastern air quality stations. AQI growth was more significant in non-BRT areas (78.5%) than in BRT areas (63.22%). The pollutant that contributes the most to the AQI value is Particulate Matter PM 2.5, which is linked to serious respiratory health effects. Particulate matter is higher from diesel vehicles than from gasoline vehicles, and most freight vehicles over 3.5 tons have a diesel engine.
The annual mean monthly maximum values allow us to compare air quality between t0 = 2013 and t1 = 2018 in monitoring stations located either in (a) industrial areas or (b) commercial areas, and in areas (i) served by a BRT or (ii) not served by a BRT, as shown in
Table 3. The main BRT corridor (Calle 5, Carrera 15) showed the lowest AQI values in recent years (35.3 and 23.4), while areas not served by the BRT where there are no truck traffic restrictions showed the highest AQI values.
Results show that local emissions decreased in BRT areas of influence, mostly in commercial areas, while local pollution increased in industrial areas. As discussed, medium- and large-truck traffic increased in corridors in the east of the city where there are no vehicle size restrictions. In industrial areas served by BRT corridors, local emissions increased. Emissions were therefore transferred from commercial to industrial areas. It is noteworthy that the relative positive effect seen in the commercial use areas is lower than the negative effect realized in the industrial areas. Some factors explaining this pattern are the use of small freight vehicles in commercial areas and the increase in overall traffic.
4.4. Infrastructure
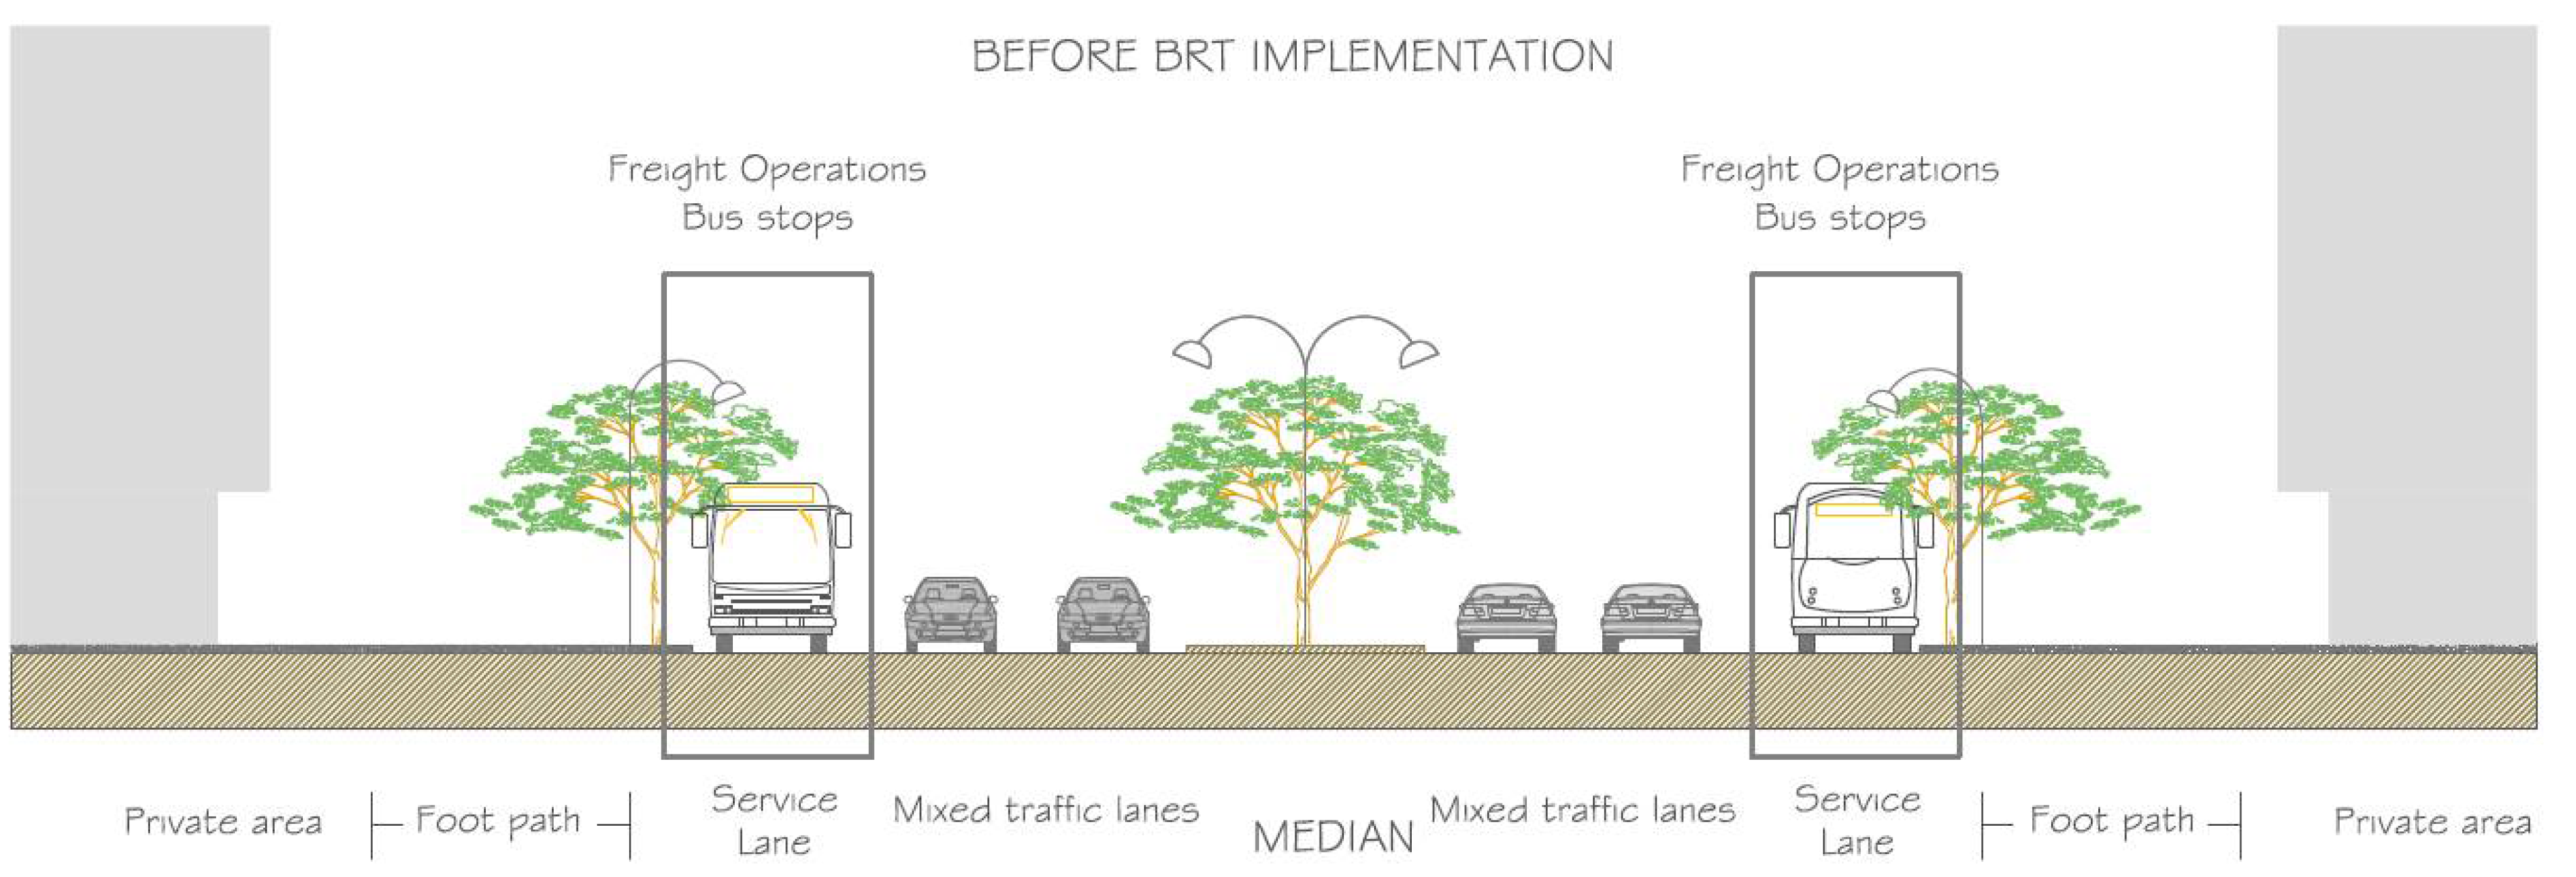
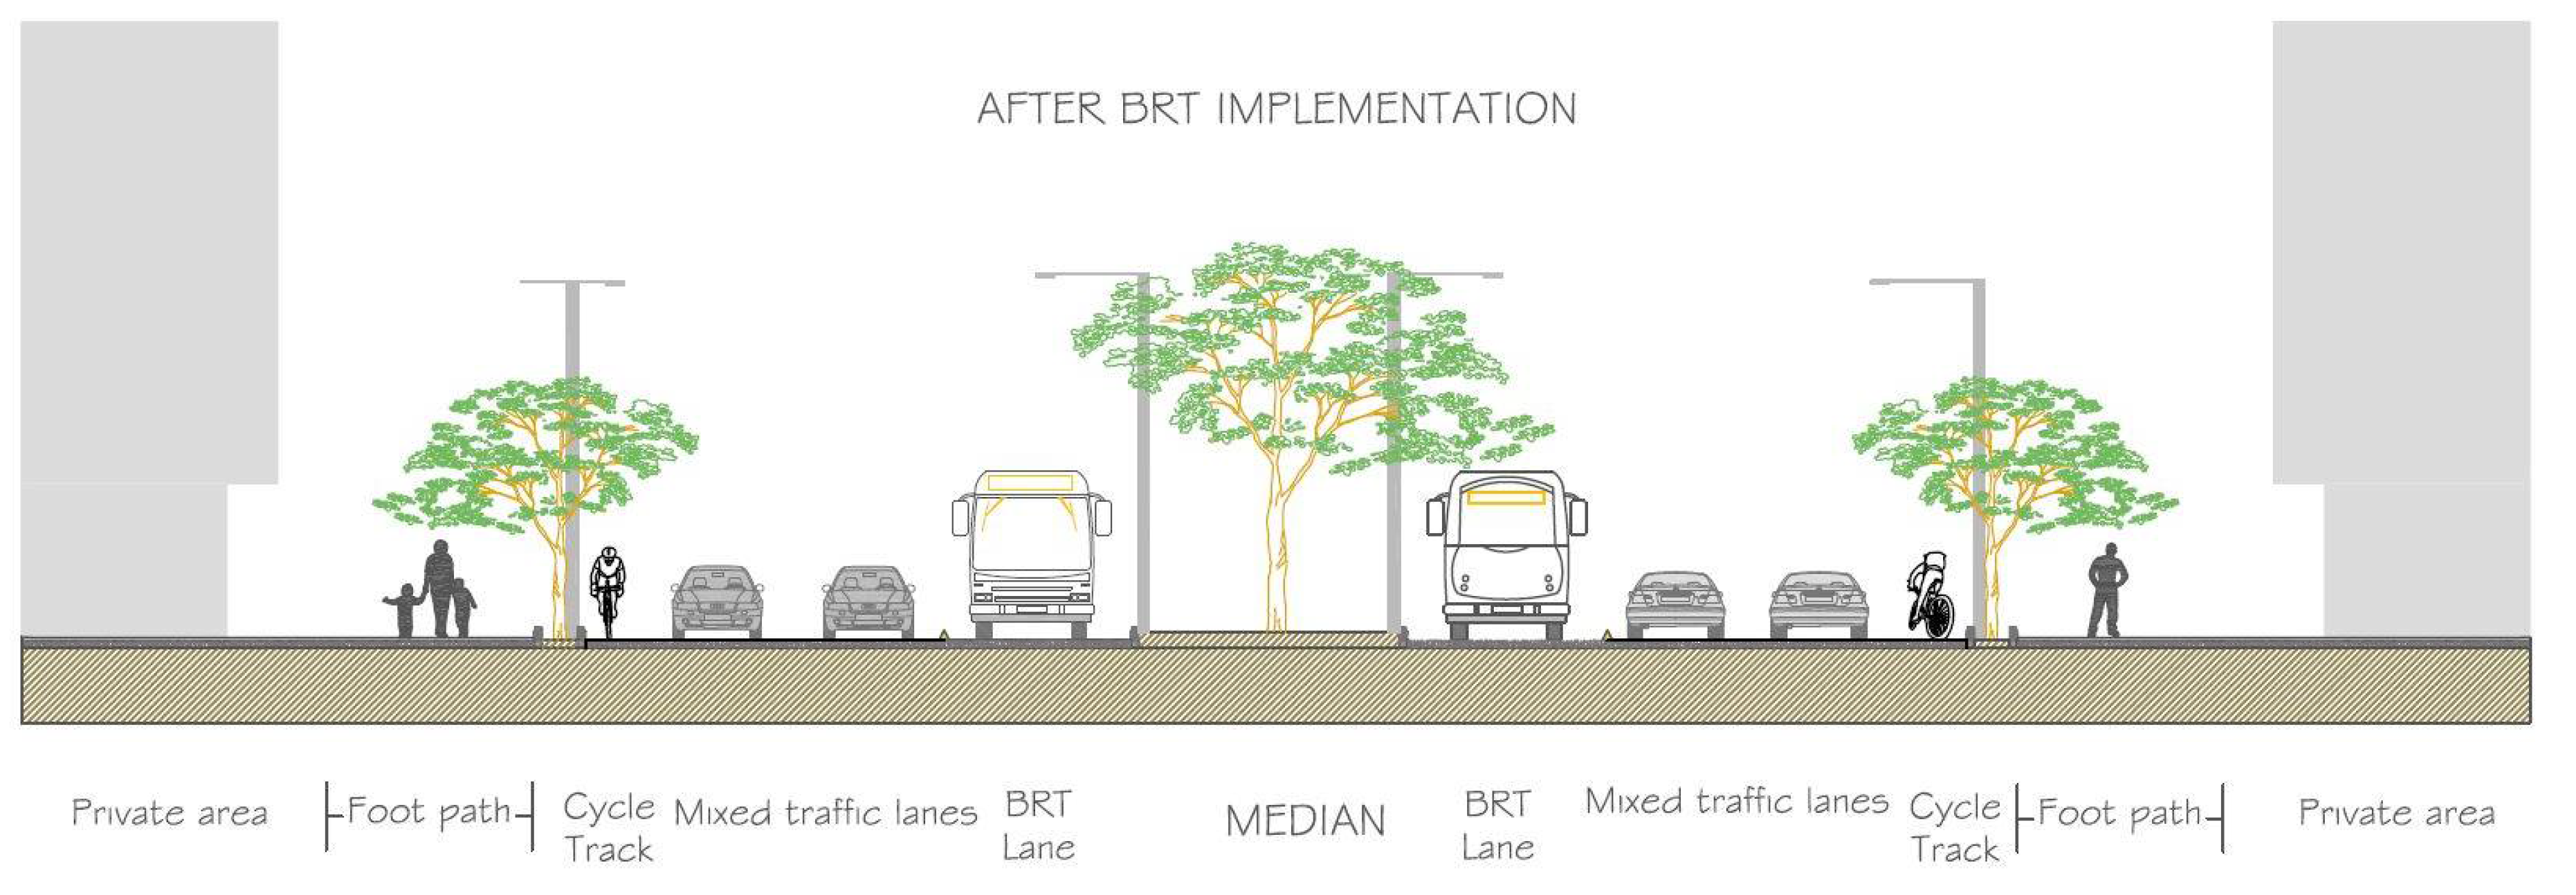
The visual differences in street cross-sections before and after the implementation of BRT corridors show whether the systems are suitable for logistic activities (mainly loading/unloading operations) and for freight vehicle operations, as shown in
Figure 2. Logistics facilities such as bays and service lanes close to the BRT corridors were reduced significantly after BRT implementation, according to the businesses, carriers, and shippers surveyed. Just three freight bays/10 km were officially allocated in the project along BRT corridors. Some businesses had to demand new loading/unloading bays to improve their operations, but this process was slow and generally unsuccessful. Curbside space was not allocated to all users. In fact, the system’s platform height impeded access for freight vehicles. Access ramps for commercial establishments were restricted (under certain stringent conditions) to avoid parking on pedestrian paths, a very common phenomenon before BRT implementation. Carriers claimed that commercial vehicles circle around and double park since there is insufficient curb space, and they cannot carry out their operations within the law. Consequently, trucking companies frequently pay high parking fines, the costs of which are passed on to the customer. Double parking also forces vehicles and multimodal travelers to move around trucks blocking a lane to make deliveries, posing safety risks for all involved. Smaller businesses commented that BRT in commercial areas leads to public space degradation, while corridors where there is no BRT have been revitalized. This is due to the fact that parking restrictions have made some businesses move to streets where, without the BRT restrictions, there is more flexible parking.
BRT corridors were built on old urban corridors to host BRT lanes and stations. In the city center, section cross-widths accommodate two directional BRT lanes, but are not wide enough for other modal traffic, including urban freight bays. Private vehicle lanes were narrowed to host exclusive BRT lanes, reducing accessibility for trucks and emergency vehicles. Pedestrian paths and medians were modified and landscaped. Cycle lanes were increased in some corridors, but footpaths were not significantly modified (their variability is between −1 and 1 m, with an average width of 3.65 m). The BRT project was also supposed to implement cycle lanes on 40% of the system, nonetheless, some have an average width of 1.14 m, which is below optimal specifications and leads to conflicts with taxis, motorcycles, and trucks. In addition, medians were reduced by between 30% and 100% as well as main lanes (which were created as exclusive lanes for the BRT), so that buses could overtake each other. Service lane restrictions were reinforced for parking and heavy truck traffic (as well as traditional transport systems) along the 49 km of BRT corridors, and only three parking solutions were incorporated for loading/unloading operations.
4.5. Land Use
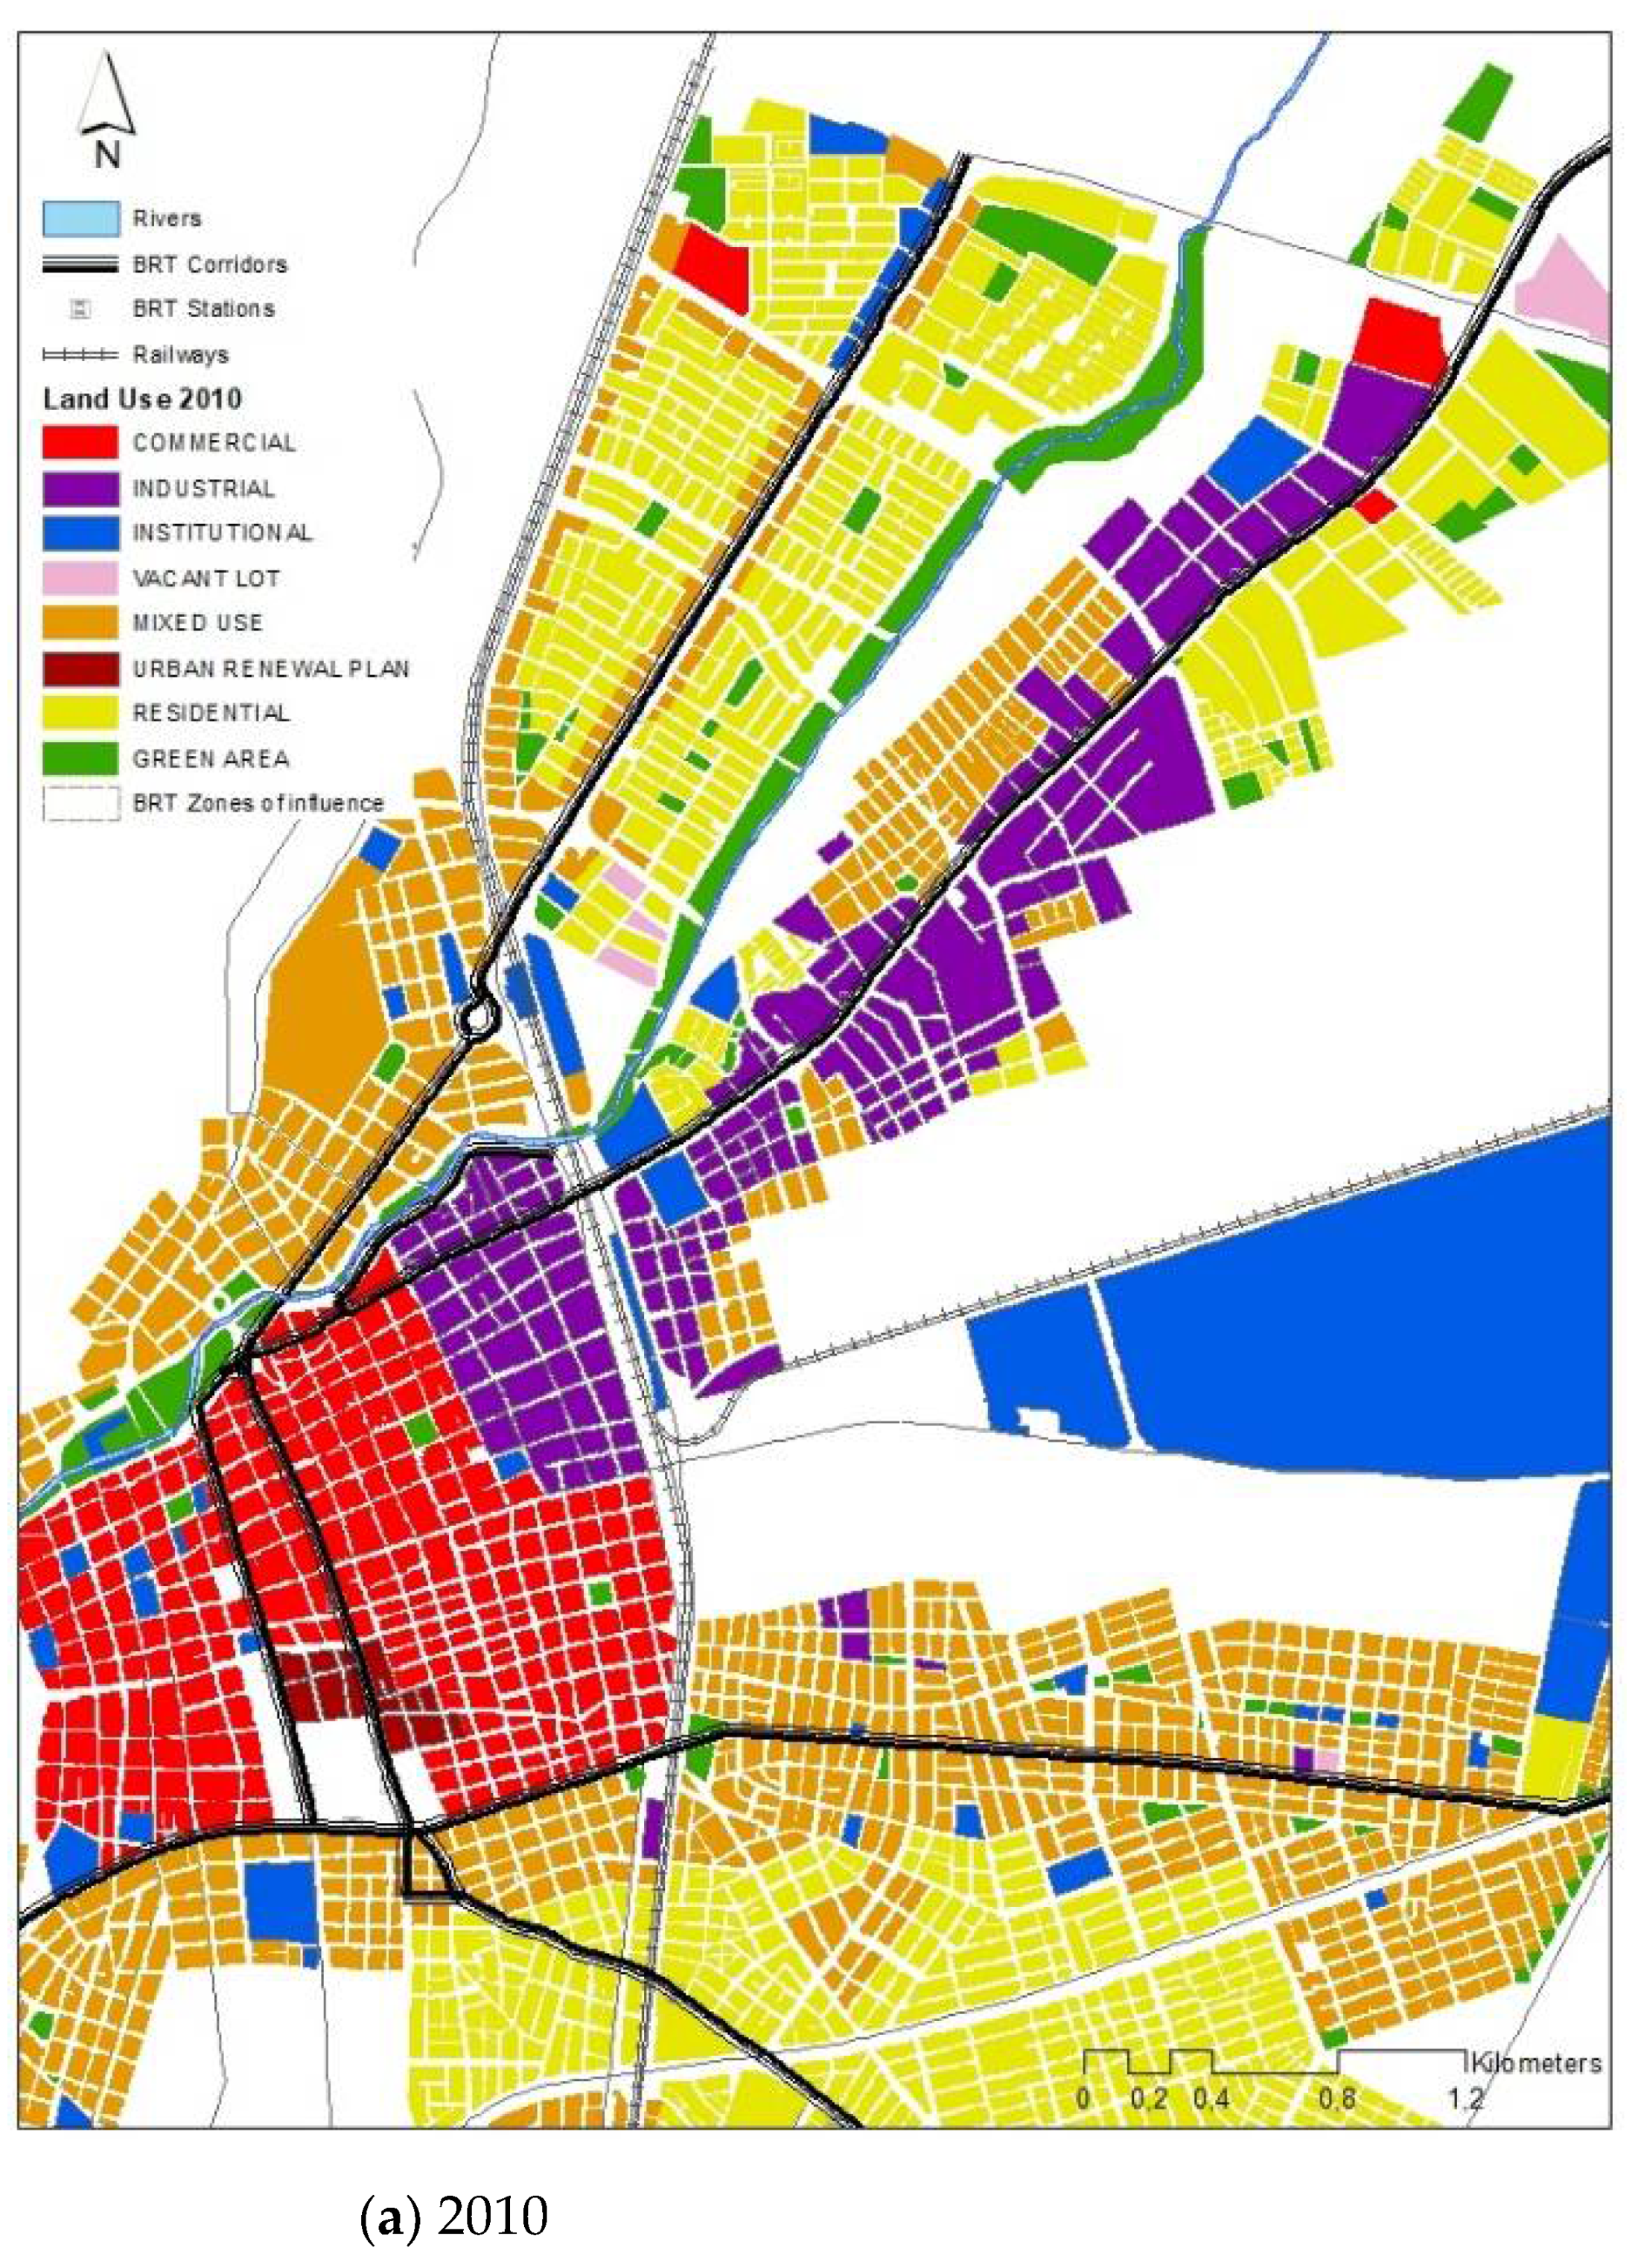
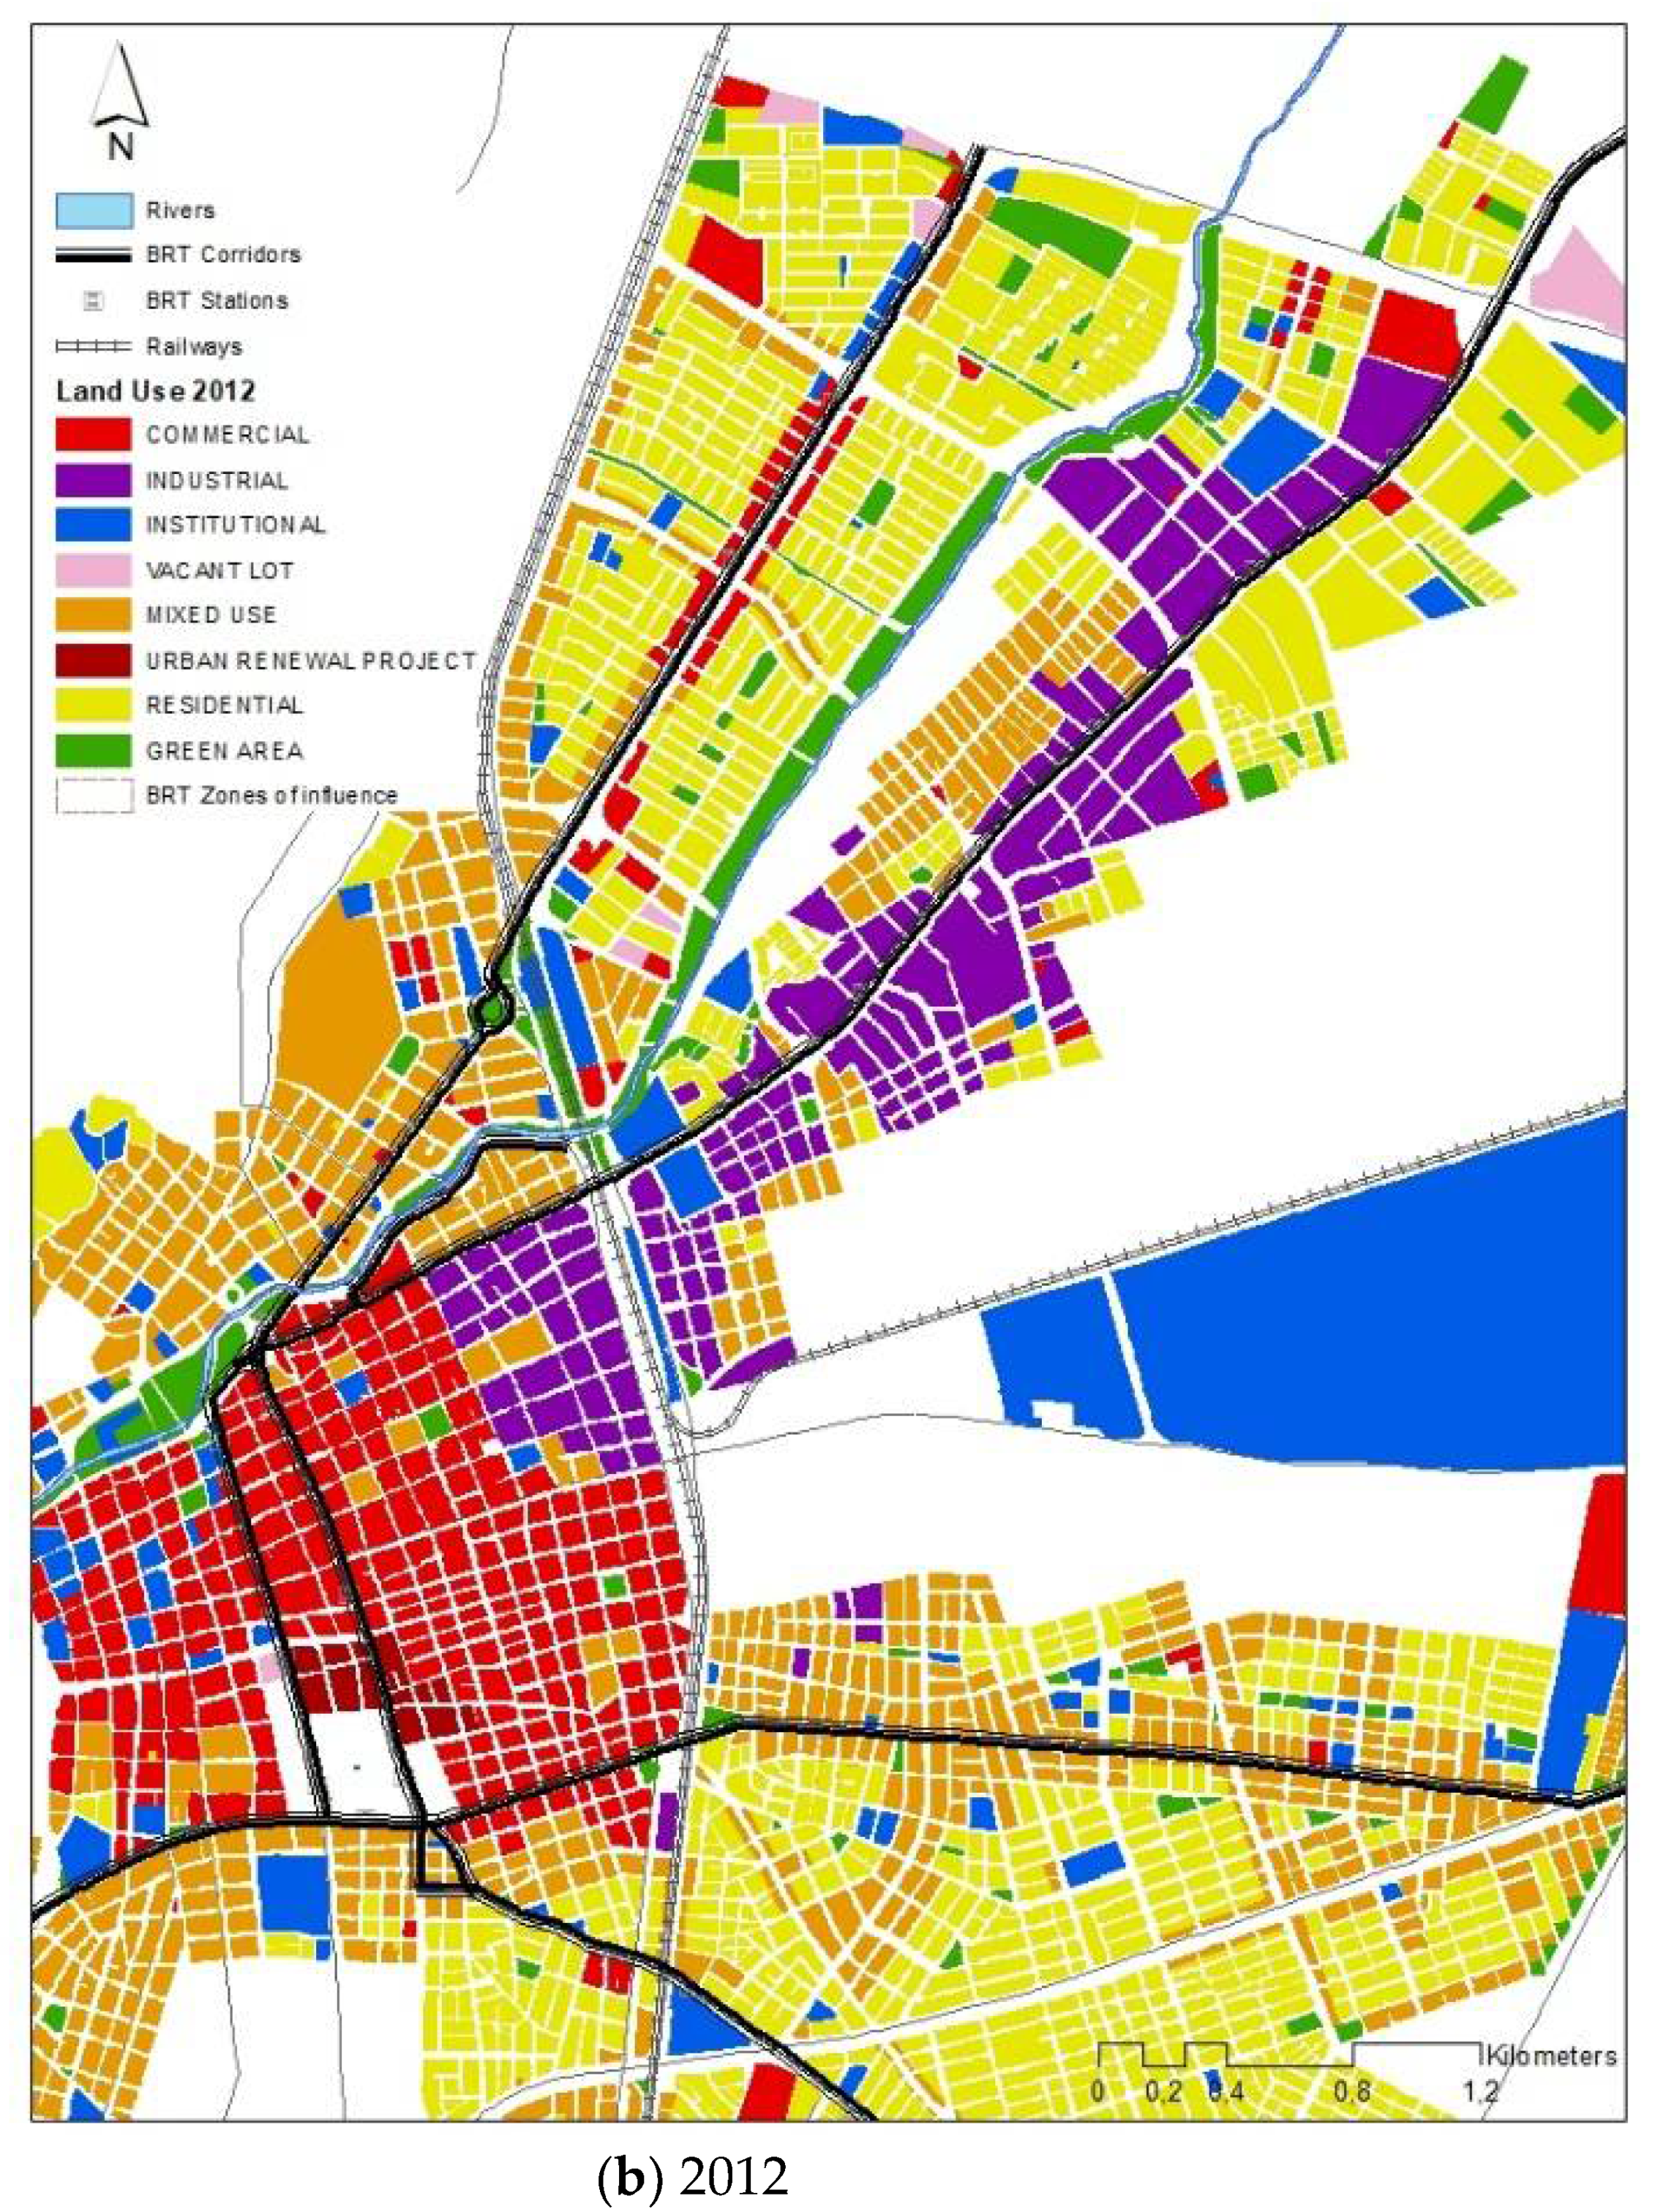
The urban context is characterized by a change of land use over space and time, see
Figure 3. This paper uses a complementary geographical analysis to gain a deeper understanding of land use changes by examining mobility attractors, commercial and institutional facilities such as hospitals, universities, and shopping centers, etc. Land use changes demonstrate how economic activities have changed since the construction and implementation of the BRT corridors. The information analyzed was taken from two different databases: The cadastral office, and the planning office for the years 2000, 2007, 2010, and 2012 (georeferenced). These databases show that land use on BRT corridors has changed from residential use only to mixed use or from mixed use to commercial and institutional use. Mixed use mostly occurs in central areas, and on the BRT corridor themselves (or in business centers). In those areas, vacant lots have been used for residential projects and for big shopping centers, while industrial use has been reduced in the urban area.
BRT implementation has increased commercial and mixed use in the city, but it has reduced the industrial use that was once concentrated in the central area. However, in the entire urban area, the industry diminished in the first period, when BRT construction ended and the implementation started. In contrast, commerce increased strongly, and the number of residential projects has increased strongly and they are part of the most important urban projects.
City services are concentrated along BRT corridors and their zones of influence. Most hospitals, schools, universities, and shopping centers are located on the west side of the city, near these corridors [
40]. The BRT connects these services well, but they generate and attract multiple freight services [
34] that are mostly carried out in small vans and trucks, due to traffic restrictions. This has made the city more congested, since the freight vehicle fleet is substantial, and the number of detours that logistic services need to make continues to increase.
4.6. Legislation
Old legislation was issued to protect urban corridors from truck traffic and its negative impacts. More recently, legislation has been issued focusing on improving the efficiency and safety of the BRT system.
The general legislative climate is very restrictive and reactive towards freight operations, with freight blamed for traffic congestion, road network degradation, and the occupation of public space by loading and unloading operations. However, studies or statistics are rarely used to support these considerations. The need to increase private traffic speeds and protect pedestrian paths is often mentioned, without concrete actions. Efforts to promote a logistic system and organize logistic corridors are evident, but such legislative attempts have not generally been successful. Only one decree in 2016 is based on technical studies and statistical support, but in 2017 it was modified based on carrier opposition.
The decrees were issued at irregular periods, with 10 years elapsing without freight transport legislation and then three contradictory acts passed in the same year.
The decrees refer to “schedules”, “vehicle sizes and types” that vary over time, as does the geographic area considered. In terms of “prohibitions”, loading and unloading operations in the BRT axes are emphatically restricted the recent years. The “control” of normativity is mainly attributed to only one local institution, while “sanctions” or fines are characterized based on national policy. Local standards fluctuate and do not correspond to a general policy and freight plan, rather, they correspond only to urban transport boundaries, which fail to acknowledge the metropolitan interaction between the main city and its neighbouring municipalities. Local legislations tend to remediate the topical division and generalization of national legislation, but there are several dysfunctionalities.
4.7. Geographic Distribution
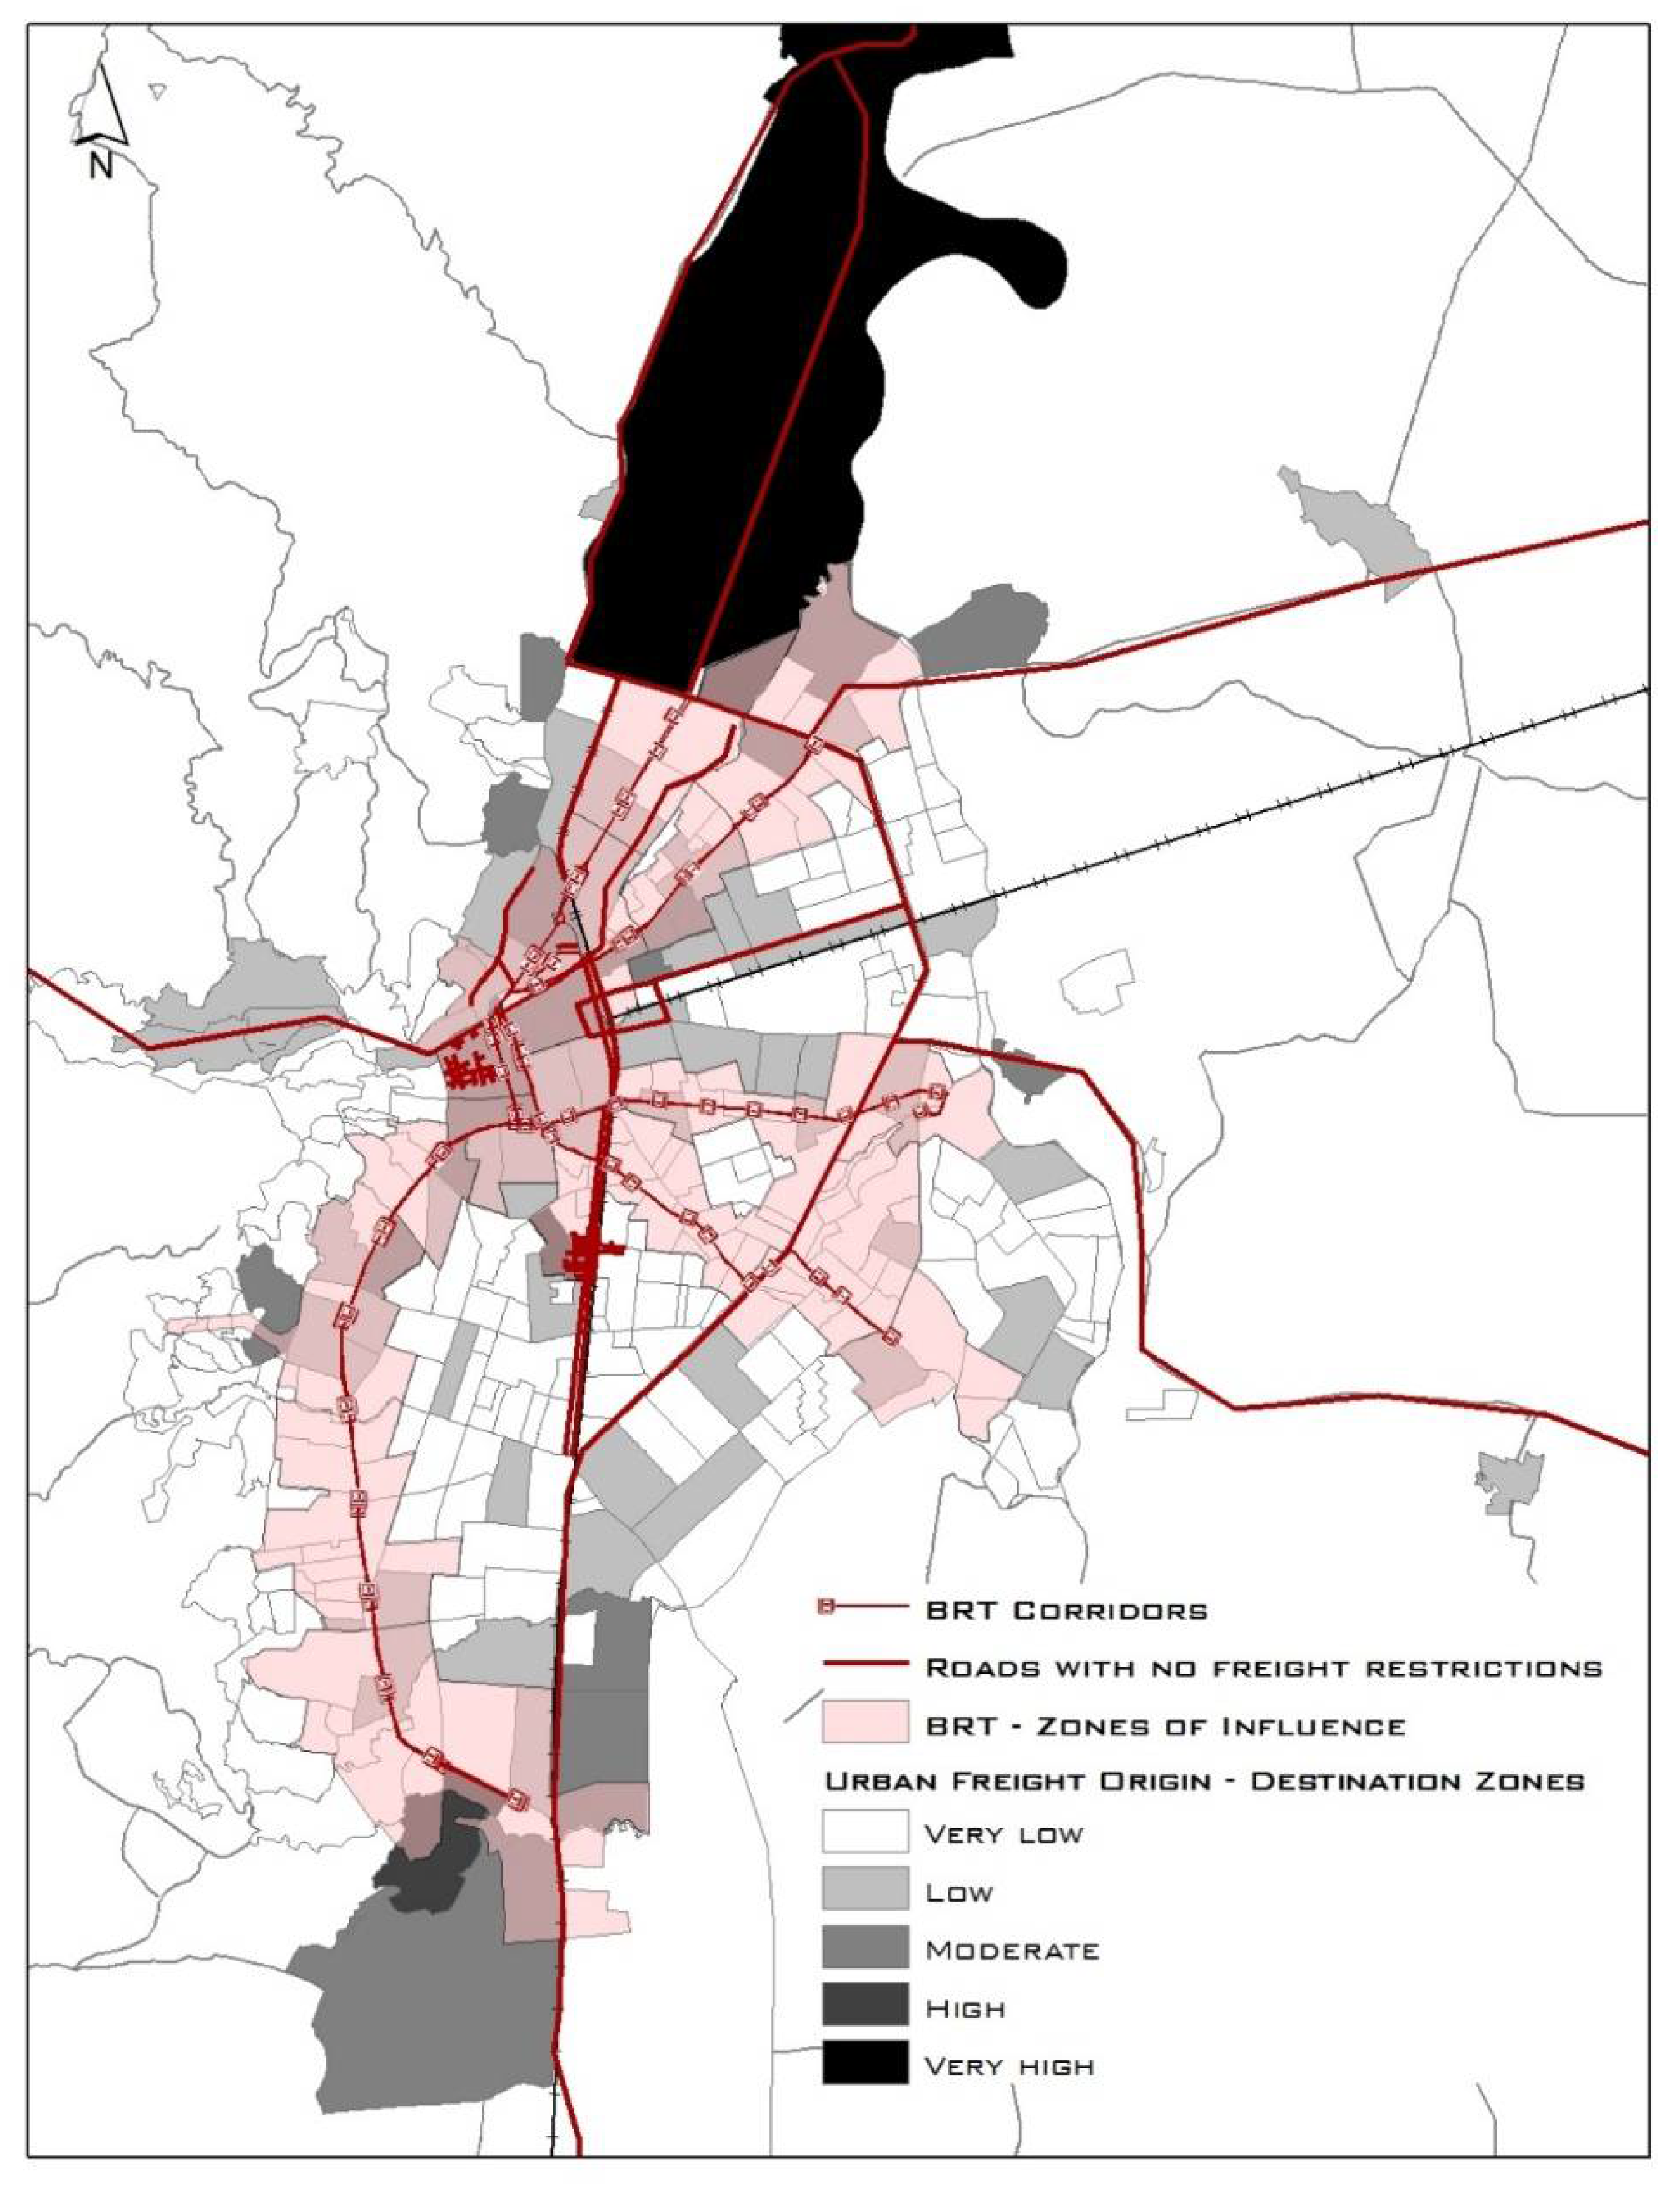
In terms of geographic distribution (see
Figure 4), it was necessary to plot BRT corridors, logistic corridors (streets with no freight restrictions), and freight origin destination zones. Doing so made clear that corridors assigned for freight traffic were located in eastern areas, while freight traffic, and loading and unloading activities are forbidden in public transport corridors in the western areas of the city. This creates a large segregation between freight and passenger operations in the city, and passenger-freight conflicts in the central area. Heavy traffic distribution is out of balance between high- and low-income areas, generating more externalities in poor residential neighbourhoods, considering that in Latin America, poor neighbourhoods are generally isolated to the periphery areas. Legislation is geographically isolated as well, and only takes into account some corridors and small areas, neglecting the whole urban context and the metropolitan area. When the BRT axes were implemented, businesses and retailers were unhappy and demanded that the municipality propose new designs with specific requirements for their operation.
Figure 4 shows the city of Cali with its BRT corridors, logistic corridors (streets with no freight restrictions), and the main areas of origin and destination for freight deliveries made by trucks. The north zone attracts and generates very high freight traffic. The spatial segregation of passengers (to the west) and freight transport (to the east) are very well illustrated when plotting passenger and logistic corridors. However, freight transport generation zones and freight transport attraction zones are spatially distributed in both corridors.
5. Discussion
Academic attention has focused on the performance of BRTs [
5,
21,
41,
42] but few studies have considered the impact of BRTs on other transport systems, such as urban freight transport [
22,
25]. This paper proposes a new approach to evaluate BRT systems by defining a set of relevant criteria and sub-criteria for which data could be obtained prior to and post implementation in areas where a BRT system was implemented, and in areas outside the BRT system area of influence. This approach moves beyond studies that evaluate BRT performance only in the area of influence [
19,
43]. This evaluation permits a preliminary view of the impact of BRT systems on urban freight operations, with the aim of fostering more, and more detailed, future evaluations.
Based on the methodology proposed and the six criteria evaluated, it appears that the BRT system in Cali failed to take into consideration urban freight infrastructure or relevant measures in its operational model. One of the main objectives of creating BRT systems in cities around the world is to design infrastructure that consists of dedicated lanes and proper vehicles and stations to reduce the need for, and use of, private transport. Congestion can be greatly reduced when users attracted by the efficiency of BRT give up using their private vehicles [
4]. Results from this study showed that in BRT corridors, freight traffic has been markedly reduced, but small vehicle traffic has increased significantly, some of which can be attributed to freight. In the implementation of BRT corridors, truck traffic (and in particular big trucks), were diverted to non-BRT corridors to reduce congestion. As a result, detours made by freight vehicles have grown in other areas outside the BRT corridors, increasing congestion across the entire city. Most of the truck traffic is now concentrated in non-BRT corridors. BRT corridors have mostly reduced 3- to 4-axle truck flow, but that freight traffic has been redistributed now, with the use of vans, small trucks, and even private vehicles for deliveries, according to interviews.
Geographically, it can be seen that corridors assigned for freight traffic (in particular for transit and accessibility) are located in non-BRT corridors or suburban areas, while freight traffic and loading/unloading operations are banned in public transport corridors. Legislation incentivizes this segregation of logistics operations into very specific corridors and areas. Emissions data confirm how environmental impacts are bigger where there are no freight restrictions, and there are no BRT corridors. This segregation coincides as well with the geographic segregation of high- and low- income groups.
The behaviour of truck traffic and logistic settlements at the city’s border relates as well to the location of BRT terminal stations and corridors. At connections where BRT stations are absent, the number of trucks has grown significantly. In contrast, truck restrictions could have permitted the intensification of private car flows, which are contributing to congestion and emissions. BRT zones represent 28% of the starting points of goods and 65% of the destinations for trucks surveyed. BRT zones of influence are important attractors of goods, despite truck traffic and loading/unloading restrictions. Interviews also reveal that freight flows are concentrated in non-BRT corridors, increasing travel distances and time required to supply BRT corridors.
Public policy proposed mixed land use along BRT corridors, and this was confirmed by the land use analysis, which shows that residential use has changed to mixed use or from mixed use to commercial and institutional use. Mixed use occurs mostly in central areas and on BRT corridors (or business centers). In general, higher-density, mixed-use development is most favorable to transit since it generates greater patronage, and guideways and stations can often be more effectively integrated into such development [
11]. Vacant lots have been used for residential projects and big shopping centers, and industrial use has declined in the central urban area. The land use most prevalent along BRT corridors focuses on housing projects, commerce, and services, which are not traditionally compatible with big industry and logistics services. This phenomenon implies an increase in the kilometers traveled by small freight vehicles which may have a negative impact on mobility and the environment as presented in previous research [
36]. On the other hand, housing projects, businesses, and services are attracting and generating more freight transport, which requires good connections with industrial and logistics services.
An analysis of the transportation and freight legislation also revealed that land use regulations foster mixed land uses where both residential and commercial activities take place, especially along BRT corridors. Previous studies also revealed that when a new mass transit system has been implemented, the area where it is located must be subject to requalification works, producing relevant cost increases [
4]. Loading and unloading infrastructure and freight services along BRT corridors were not part of these investments. On the contrary, the corridors have strict parking restrictions affecting commerce and the economy. Land use management and infrastructure planning lay the foundation for future efficient traffic operations. Freight transport and goods deliveries have to be an integral part of any such policies, and need to be considered carefully during the planning stage [
7]. The cases of Bogotá and Ahmedabad reveal that in the absence of proactive planning and attempts to entice private development near stations, few land-use changes occur [
44]. The lack of infrastructure for loading and unloading operations, and restrictions in BRT corridors increase double parking in the influence area, adding to the distances traveled and increasing congestion. These conditions increase costs for logistics companies and their customers, as has been previously found in other studies [
45]. Insufficient parking spaces lead to cruising behaviors, which result in increased costs for both travelers looking for parking, as well as in-transit travelers [
46]. These effects are direct consequences of inadequate infrastructure planning in the BRT corridors and poor traffic management.
Based on the semi-structured interviews conducted for this study, we could confirm that many establishments consider BRT projects or even projects concerning sustainable mobility such as pedestrian paths or cycle lanes to be detrimental to the welfare of commerce. Respondents indicated congestion, inadequate docking space, inadequate curb space for delivery trucks, and oppressive parking regulations as examples of the effects of these projects. On the other hand, experts are highly concerned with implementing large sustainability projects.
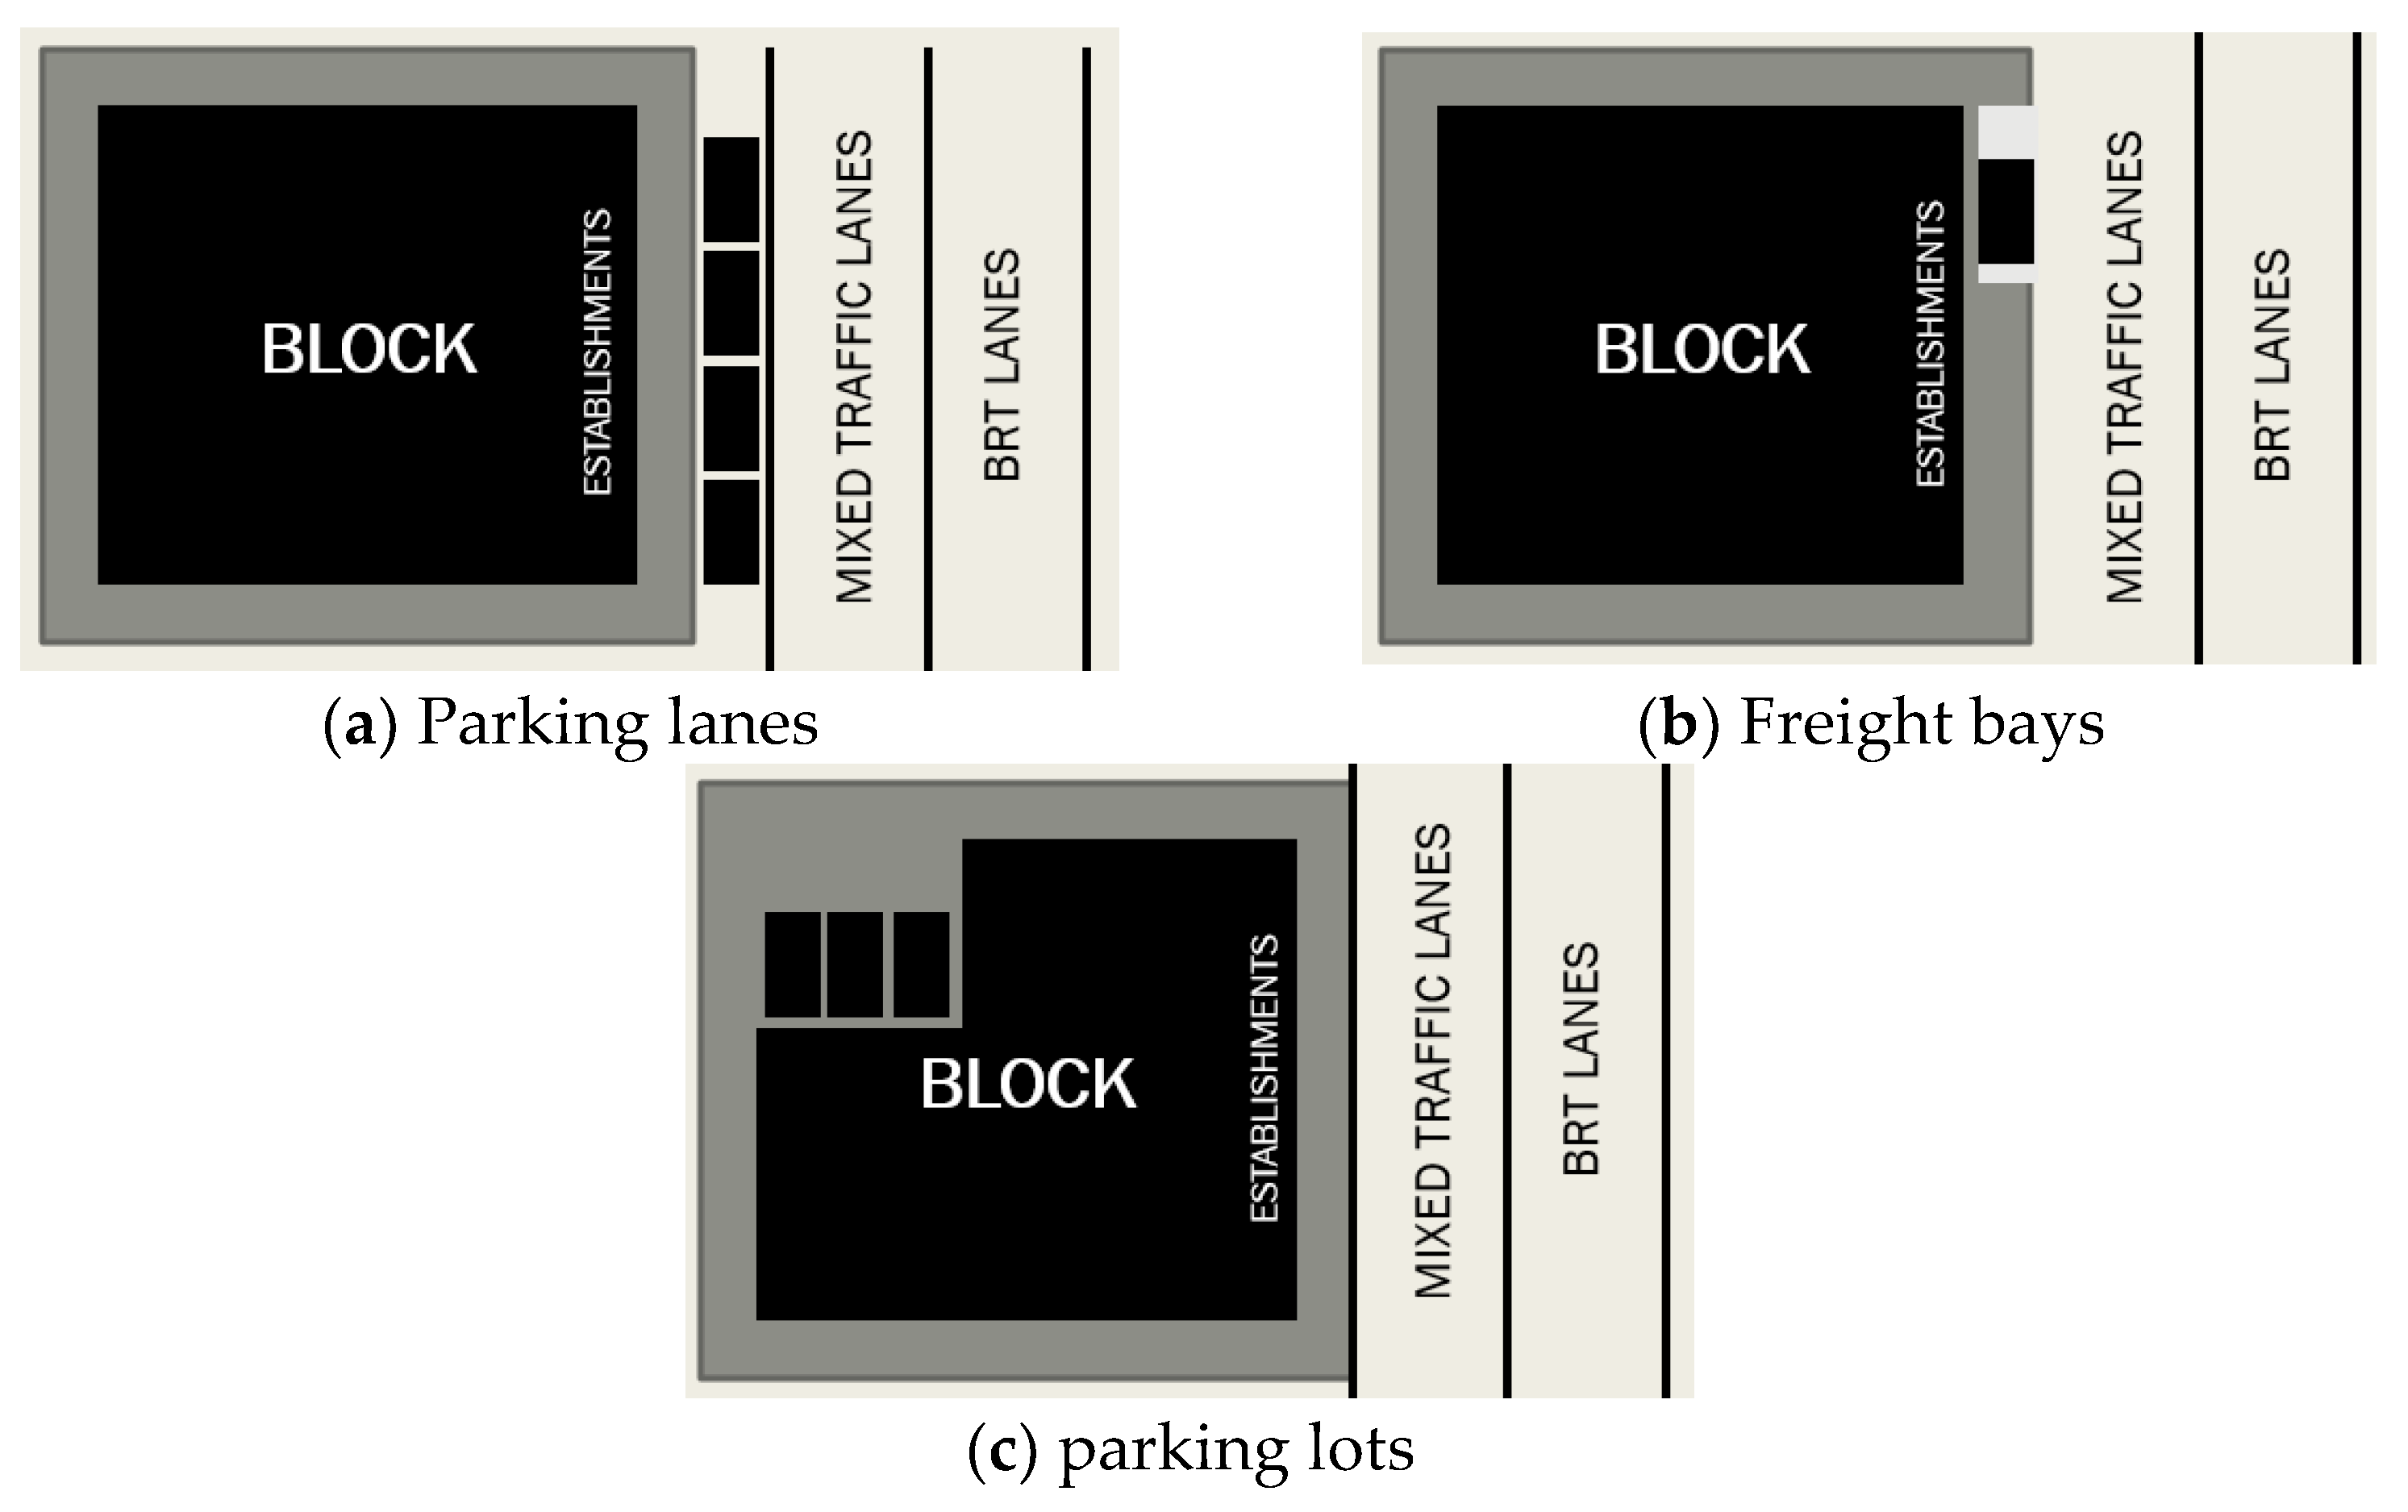
Models could be developed to test logistics facilities along BRT corridors (see
Figure 5) such as parking lanes (a), freight bays (b), and parking lots (c). These alternatives could be rated with respect to the criteria proposed in Part 4, based on [
31].
The lack of sufficient space for freight infrastructure could be remedied with new measures and strategies set out in multiple studies, such as off-hour deliveries or deliveries staggered during the day [
47,
48,
49,
50,
51,
52], traffic management [
1], urban freight platforms [
53,
54,
55,
56,
57], and cargo cycles [
58,
59,
60,
61,
62]. In other words, curbside management must be complemented with freight demand management to reduce peak period needs. Curbside management is generally focused on BRT performance issues, and fails to include the needs of businesses along the corridor [
23,
44].
BRT systems benefit from being located in urban corridors with a lot of businesses and services and the businesses benefit from the BRT system as well. It is important to estimate the number of logistic facilities needed to also properly satisfy the freight needs of the citizens, businesses, and services along the BRT corridor. Methodologies to identify real demand have been presented by several authors [
63,
64].
BRT station locations and designs should be developed cooperatively with the surrounding community [
11]. Community support is essential in identifying and assessing potential sites for transit facilities and for developing design concepts [
11]. These strategies and measures could be evaluated with the criterion weight presented.
6. Conclusions
BRT systems are rapidly expanding around the world, and are constantly expanding locally and city-wide, as shown in BRT global data [
10]. In addition, new pedestrian projects are being considered in current logistics corridors, commercial zones or urban freight attractor zones. Many of these projects are designed to limit private vehicle traffic, and the resultant urban congestion. Additionally, while cities do need to maintain and promote sustainability, mobility, and quality of life, it is not possible to do so while ignoring the urban good distribution systems that serve the economic needs and health of cities [
65].
Tight restrictions on freight traffic along BRT corridors do not contribute to a reduction in congestion or local pollution. While in the short-term, heavy vehicle restrictions improved congestion and emissions on BRT corridors in Cali, the better traffic flow conditions and the large truck restrictions have induced a growth in small vehicle demand, incentivizing the use of private cars and increasing the number of small freight vehicle trips.
The BRT corridor could implement new strategies that consider more city distribution needs, by implementing innovative infrastructure and vehicles, schedules, time windows for deliveries, prioritization of different types of vehicles (gas, hydrogen, electric), and new policies that include tax benefits, mobility management (control devices such as parking meters), and night distribution. Results and experiences have, however, shown that unintended side-effects might occur when implementing many of these actions [
65]. Any new strategy or policy needs to take into consideration the number of freight and service trips made, and the number of freight facilities required in the areas involved.
In future research, we propose to expand this analysis to other cities that have or are considering, implementing BRT corridors [
10]. Data availability can restrict the analysis, especially in terms of information from before BRT implementation. However, evaluations can be flexible and redesigned according to the specific context information available in each city. In those instances where there is sufficient information and data, more criteria and sub-criteria could be incorporated, to increase the reliability of the analysis. In the opposite scenario, interviews and questionnaires with stakeholders are helpful to overcome the lack of data, especially in terms of historic information. We strongly recommend the ex-post Analytical Hierarchical Process [
31] with a greater variability of stakeholders. It could be desirable to test specific strategies using a multi-factor multi-criteria analysis [
66,
67,
68,
69].
A more equitable system of allocation for logistic facilities is required in public spaces along BRT corridors. It is important that BRT facilities recognize the unique character of neighborhoods and districts served by the system for a context-sensitive design [
11]. Systemwide design themes must be sufficiently flexible to encourage an appropriate balance between system continuity and contextual design [
11]. This is in the line with Complete Streets principles, which are based on the need to accommodate all users in the same urban space [
28,
29,
70,
71,
72,
73,
74,
75].
More thought and research are needed into how best to design urban transport systems and corridors, and ways to make them inclusive of, and conducive to sustainable urban logistics [
6,
76,
77].


