1. Introduction
Off-peak delivery (OPD) is the delivery of goods during the evening and overnight hours. This strategy has the potential to alleviate congestion during peak periods and increase the utilization of excess transportation infrastructure capacity during off-peak periods. It is expected to offer greater efficiency to delivery firms by increasing travel speeds and reducing delivery service times. Greater travel speeds, with fewer accelerations and decelerations have potential to reduce greenhouse gas emissions (GHG) and air pollutants. However, concerns exist about community impacts, especially noise at night. This paper investigates the benefits and challenges of an OPD pilot in the Region of Peel. The OPD pilot was initiated with the intention of informing the design and potential implementation of large-scale permanent OPD programs across the Province of Ontario.
OPD programs have been implemented in numerous cities such as New York City, Paris, and Barcelona due to the observed benefits in the urban areas [
1]. These urban OPD programs have documented benefits and challenges for society and business as outlined in
Section 2. In contrast, this pilot is, to our best knowledge, the first OPD program that focuses on suburban areas. Three firms with a total of 14 pilot retail stores participated in the OPD pilot in the Region of Peel from March to August 2019. Pilot retail stores were chosen where OPD was feasible and beneficial for participating firms, with fewer expected community conflicts. During the OPD pilot program, local municipalities in the Region of Peel provided a noise-by-law exemption to allow the firms to deliver to the pilot stores in the off-peak hours (7:00 p.m. to 7:00 a.m. the next day).
This paper analyzes truck trips and stop records from the three participating firms to investigate benefits and challenges of the pilot program in terms of average travel speed, service time, emissions, and noise complaints. Furthermore, this paper describes post-pilot interviews held with logistics managers of the three firms. The results from these interviews provide rich insights about successes, challenges, and ways that the OPD programs could be improved.
Overall, this paper aims to provide lessons from this pilot to inform potential broader implementations of OPD. The desired outcomes are:
To assess the benefits and challenges of the OPD pilot program in the Region of Peel;
To provide evidence and insights for firms that may consider OPD to improve the efficiency of transporting goods;
To provide evidence and insights for municipalities or other government organizations that are considering implementation of a large-scale permanent OPD programs.
The paper is organized as follows; first, a background review is provided, followed by a description of the OPD pilot in the Region of Peel. The data cleaning and processing steps are then described, followed by data analysis results, lessons learned from post-pilot interviews, and conclusions.
2. Background Review
A review of international case studies in OPD was conducted, prior to the pilot, in order to improve our understanding of: (a) the key benefits and challenges to expect in a pilot program, and (b) the appropriate strategy for evaluation and benchmarking of results. A tabulation of these case studies is provided in the
Appendix A. The case studies include applications in Sao Paulo, New York City, Denmark, Colombia, Stockholm, Barcelona, Orlando, Toronto, and London, UK.
Table A1 in the
Appendix A categorizes the case studies in terms of the geographical location, time frame (year and duration), the scale of operations (number of shippers, carriers and receivers involved), performance measures used, strategies for recruitment, unique technologies employed and current status. These case studies have shown that a successful off-peak delivery program can result in productivity improvements in freight operation, decreases in truck traffic, and decreases in environmental externalities. However, these benefits are dependent on cooperation and communication between shippers, receivers and carriers. This section reviews the benefits and challenges associated with delivering during off-peak hours.
2.1. Benefits and Challenges
Benefits of off-peak delivery include societal benefits to residents, and operational benefits to businesses. Both are important goals for urban residents, since productive goods delivery improves the health of the regional economy, which leads to jobs and less expensive consumer products. A primary goal of off-peak deliveries is to reduce congestion during the day-time hours when traffic congestion is the greatest. Removing truck traffic during congested periods frees up roadway capacity during the day and potentially reduces travel times for commuters, including those using transit modes that operate in mixed traffic. Reduction in truck travel during the day-time also reduces air quality pollutants emitted at that time. Diesel engines in trucks disproportionally produce emissions of NOx and particulate matter (PM) which have harmful health effects [
2]. Cyclists and pedestrians, who are more likely to be at the roadside during the day-time hours, could therefore experience positive health effects from a shift in truck travel (and the resulting emissions) to the evening or earlier morning. Reductions in truck idling and slower travel speeds in congestion are also expected to reduce the total emissions for the same number of deliveries. Reduced interactions between trucks and vulnerable road users such as pedestrians and cyclists, who more often travel during the day, also have the potential to benefit from an improvement in safety [
3].
For businesses, the benefits of off-peak delivery can include faster travel time while traveling to and from customers and reduced unloading time during the delivery. Lower traffic levels are generally experienced during the overnight hours, leading to shorter travel time, higher travel speeds, less idle time, and fewer emissions. Holguin-Veras et al. [
4] organized a pilot off-peak delivery project that moved the delivery schedules of 35 food delivery firms to off-peak hours. The trucks were monitored using GPS technology to track location and speed. A speed increase between the depot and first customer was observed, from 11.8 mph to 20.2 mph, while a smaller increase was found while traveling between subsequent customers. It was estimated that the delivery time during the pilot project was, on average, half of what would usually be experienced during the morning hours, when the majority of the deliveries would have taken place.
Making deliveries in urban areas can also be difficult due to the lack of proper truck parking. It is estimated that upwards of 96,000 additional vehicle kilometers are traveled every year on an average city block due to the search for parking [
5]. For commercial vehicles, the additional parking search time is likely to have a significant impact on total tour time. In addition, the delivery of many types of goods requires parking near the delivery location. As a direct result of this, many commercial vehicles are forced to park illegally closer to their delivery location, resulting in parking tickets. Parking is easier to find in the off-peak period [
6].
Several studies have shown the potential of off-peak delivery in reducing truck emissions. Yannis et al. [
7] used a traffic simulation model to show improvements in overall traffic emissions by restricting truck movement during peak hours. Campbell [
8] generated analytical models which showed that emissions reductions were possible, but only under conditions where the average speed increased. Holguin-Veras et al. [
9] collected GPS data of delivery trucks from three cities in the Americas to analyze the effect of off-peak time versus regular-time deliveries on emission estimation. They showed that off-peak delivery can reduce the emission by 13% to 67% compared to regular-hour delivery.
For the case of Los Angeles, where there were night-time restrictions on truck movements in some areas, the increase in average speed is negated by the extra distance needed to travel to avoid the restricted areas [
8]. The Barcelona night-time delivery project showed the potential for reducing the number of trucks required to make deliveries. The project showed that seven smaller trucks that would normally make the daily deliveries could be replaced by two larger trucks that would normally not be able to maneuver through downtown peak hour traffic [
10].
The implementation of an off-peak delivery program requires addressing a number of challenges, including receiver participation in the off-peak delivery program, noise restrictions when delivering near residential areas, and security issues associated with making deliveries at night.
Considerable research [
11,
12,
13,
14] suggests that a critical barrier to consider is receiver willingness or ability to accept off-peak delivery. Selection of participants in an off-peak delivery program should consider the ability of their receivers to accept off-peak deliveries.
Noise regulations and by-laws may restrict what activities may be done at night. Night-time noise can generate opposition to off-peak delivery projects from members of the community [
14]. Noise can come from moving products within the vehicle, loading and unloading the ramp, backup beepers as well as closing doors [
14]. Wang et al. [
15] and Holguin-Veras et al. [
14] suggest some possible solutions to reduce noise, including electric trucks, isolated and insulated refrigeration units, low noise lifts, “quiet” truck beds or liners and driver training. In Barcelona, delivery trucks were refurbished to include many of the low noise technologies. Noise caused by the delivery was shown to differ very little from ambient background noise [
10]. In Copenhagen, Denmark, noise has been considered the biggest challenge in the implementation of OPD due to strict noise regulation during off-peak hours [
16]. A pilot off-peak delivery project organized by Ontario’s Ministry of Transportation [
17] monitored the noise levels of deliveries in downtown Toronto. The conclusions of the pilot project were that the “background hum” of the urban environment was able to mask the sounds of the off-peak delivery, and that the noise produced in the residential areas was sufficiently low as not to bother the residents. No complaints were received during the pilot project from residents.
2.2. Off-Peak Delivery Methods
Assisted delivery is the most common delivery method for day-time deliveries. It involves having a person present in the receiving store to accept deliveries. Assisted delivery poses a barrier to OPD if the receiver does not otherwise maintain staff in the off-peak hours.
Different methods for unassisted delivery exist, depending on the type of product being delivered and the business setup. Delivery lockers or staging areas do not require direct access to the store [
18]. Both methods require a space separate from the interior of the business premises where the delivery can be placed. The downside is that some products, like perishable goods, frozen items, or high-value goods require extra infrastructure that can be expensive. Virtual cages use a series of small sensors to monitor a small area of floor space in the store [
18]. Drivers are allowed access to this small area inside the store where they can leave the goods. The sensors are able to detect if the driver leaves the virtual cage and enters into restricted areas of the store. A driver may be given access to the store, either through the use of a key or electronic code [
18]. This is less expensive than delivery lockers because no additional space or infrastructure is needed. However, trust between carrier/driver and receiver is required and security measures would have to be altered when drivers changed jobs.
The OPD pilot in this project seeks to avoid the challenges of unassisted delivery by recruiting firms that operate a distribution center and the retail stores. This way, both shippers and receivers are the same firms, so the coordination between these stakeholders is not as challenging for the implementation of the pilot program.
3. Overview of the OPD Pilot in the Region of Peel
Region of Peel, located to the west of the City of Toronto, is a major freight hub in North America with a population of 1.4 million. Approximately 1.8 billion dollars’ worth of goods moves every day through the region and goods movement contributes
$49 billion CAD of GDP to the region’s economy [
19]. The Region of Peel represents around 25% of all truck activities in Ontario. Therefore, implementing the OPD program, as a truck demand management strategy, can result in a significant improvement in goods movement in the region.
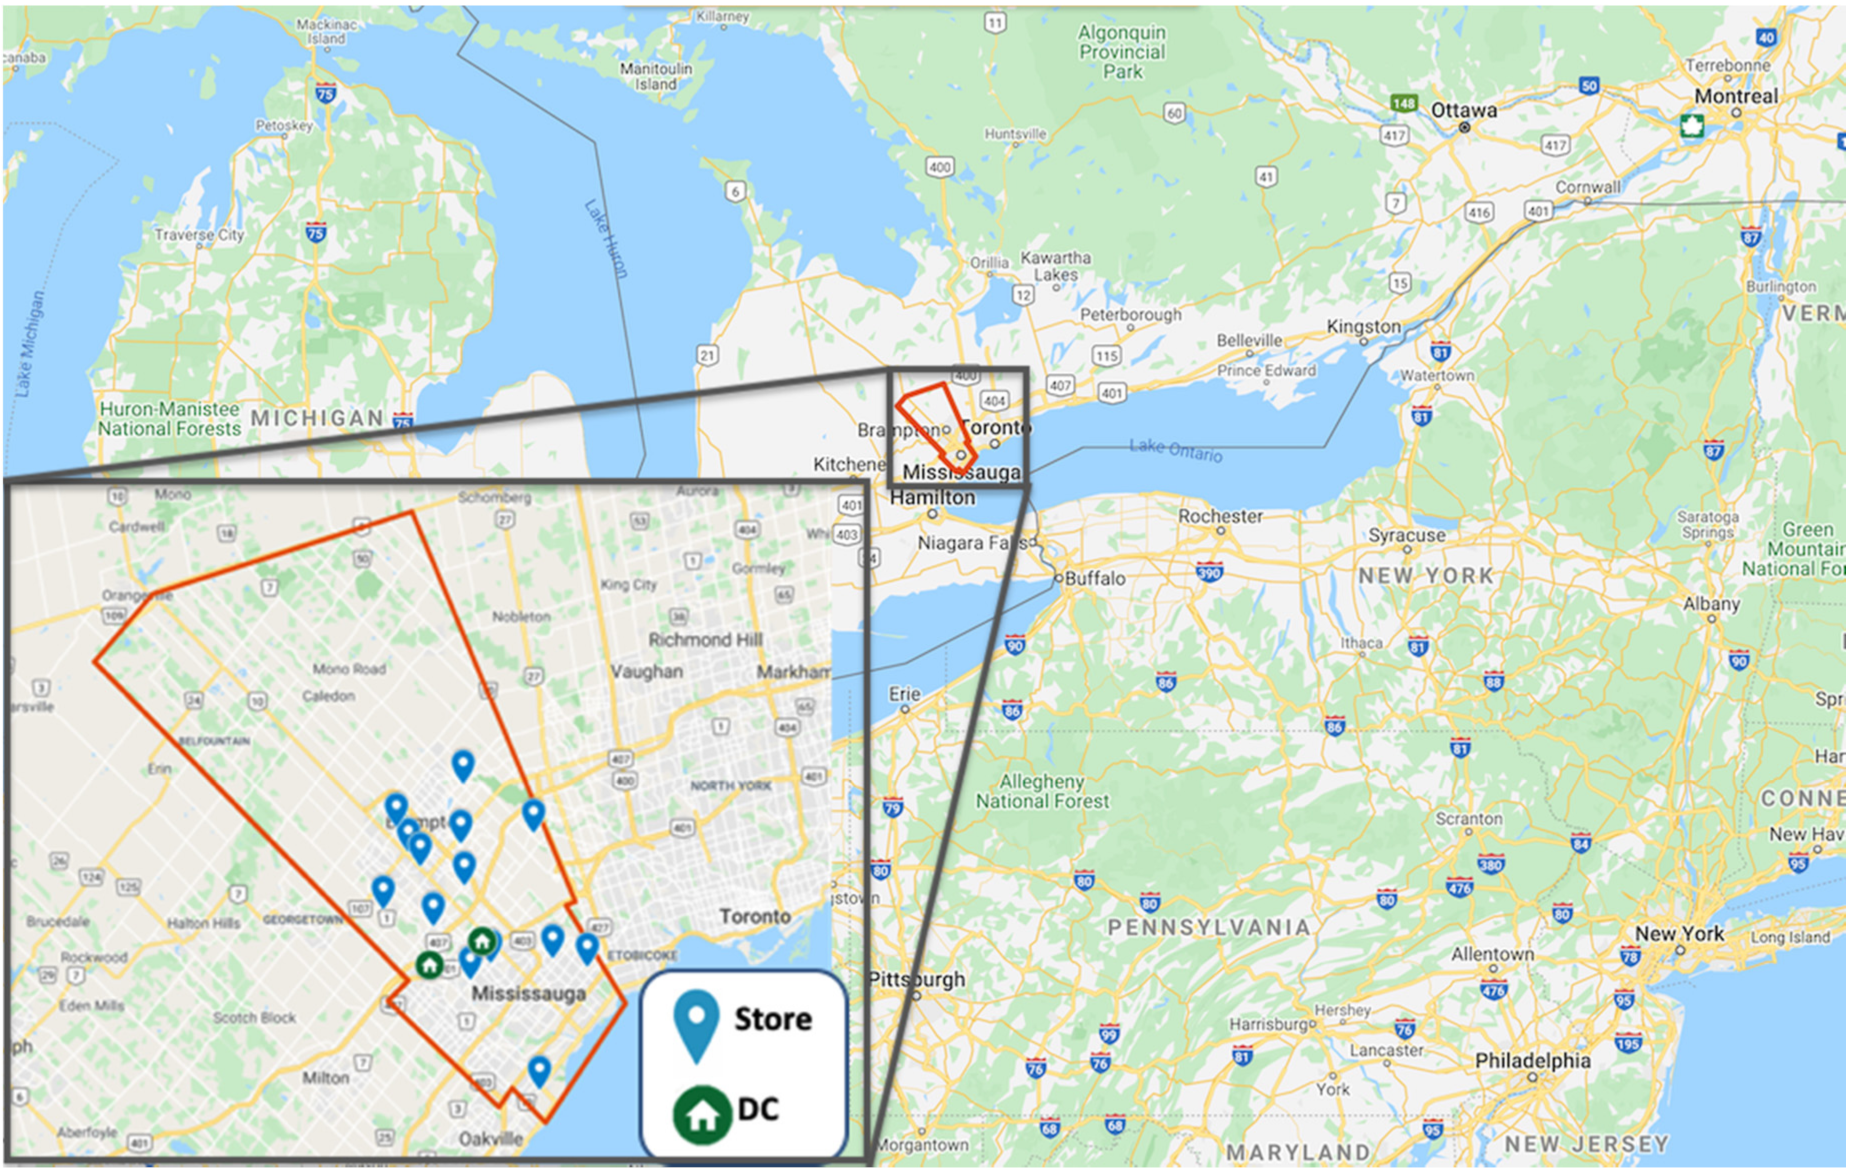
Three firms participated in the off-peak delivery program over a six-month period from 25 February to 31 August 2019. These firms include the Liquor Control Board of Ontario (LCBO), Loblaw Incorporated, and Walmart Canada. The three firms shifted deliveries to a total of 14 participating retail stores. The retail stores were selected, in collaboration with each firm and the Region of Peel, on the basis of their proximity to residential areas and the expected operational benefits. The selected retail stores are shown in
Figure 1. For the three firms, two distribution centers are located in the Region of Peel (these two are shown in
Figure 1), one is located in London, Ontario, and one in Cambridge, Ontario (not shown in
Figure 1).
The local municipalities in Peel, which include the Cities of Brampton, Mississauga and the Town of Caledon, provided a blanket exemption from the noise by-laws to allow deliveries to be made in the evening for the duration of the pilot program.
4. Data
We received truck tracking and other databases from each of the three participating firms for the duration of the six-month pilot period. Data were received from each firm starting from end of February or early March 2019 (depending on the firm) to 31 August 2019. Data received from each participating firm included:
Truck trip information (either provided as tracking information or trip summaries);
Retail outlet (receiver) addresses;
Truck fleet attributes (including age and truck type).
The following tasks were performed:
Develop a procedure to clean the data that were received, and impute missing information;
Process the data to extract estimates of performance measures including travel speed, delivery service time, and vehicle emissions for each trip that has accessed the 14 participating retail centers;
Summarize the differences between day-time (7:00 a.m. to 7:00 p.m.) and off-peak (7:00 p.m. to 7:00 a.m.) performance for each of these performance measures.
This section summarizes the methodology used to clean and process the data.
4.1. Data Cleaning
Data received from each firm include information about each stop within each tour (where a tour is defined as a sequence of consecutive trips starting at a depot, moving to other locations and back to the depot). The cleaned dataset includes only those tours that originated from the firms’ depot(s) and that accessed one of the pilot retail stores participating in the off-peak delivery program. In addition to the travel times calculated from the GPS-based data sets, we also extracted truck trip information (e.g., distances and travel time from Google Maps, since none of the datasets from the participating firms provided us with truck travel distance). Data management, data cleaning, and processing were conducted using Pandas package in Python. The following steps were taken as part of data cleaning:
Sort truck trips and stop records and delete any duplicates
Identify trips and stops for each truck tour
Link stops to retail store addresses, to allow for spatial analysis in Google maps
Identify and impute missing data (i.e., trip arrival and departure times) using travel time estimates from Google maps
Estimate the route, travel distance and speed using Google Maps
4.2. Data Processing
The following attributes are calculated for each stop or trip, based on GPS-based truck tracking information received from each participating firm:
Stop GPS service time: the difference between departure and arrival times for each stop, which represents amount of time spent for loading or unloading goods at the stop;
Trip GPS travel time: the difference between the arrival time of the end stop and departure time of start stop.
Google maps was used to supplement the GPS data where concern arose due to GPS inaccuracies, as follows:
Trip Google Map (Gmap) travel time: travel time between two stops estimated using Google Map API;
Trip Google Map (Gmap) distance: the trip distance between two stops estimated using Google Map API;
Stop Adjusted Service Time: This is an adjusted stop GPS service time, where the GPS service time is adjusted by a factor that is equal to the division of trucks\tour Google Map service time by truck tour GPS service time;
Emissions: Five emission measurements, including GHG, CO, NOx, PM10, and PM2.5 are calculated from the MOtor Vehicle Emission Simulator (MOVES) [
20] based on trip speed, distance, vehicle type, and vehicle age.
5. Results
Performance measures include average service time, average speed, emission factors, and noise. These performance measures are summarized separately for trips that are performed in the day-time period (7:00 a.m. to 7:00 p.m.) and in the off-peak period (7:00 p.m. to 7:00 a.m.).
5.1. Service Time
Average service time is assessed at each pilot retail store as the first element of performance measurement. For two firms, the stop GPS service time is selected; however, for the third firm, the accuracy of GPS service time is questionable. The company reported that since the GPS tracker ping is recorded every 15 min, the accuracy of recorded entry and exit times to stores is +/− 15 min. We also observed negative and zero service times, which were removed as outliers. Therefore, the stop adjusted service time is chosen as the indicator of service time for the third firm.
Table 1 provides the summary of average service times for the 14 pilot retail stores in the day-time (7:00 a.m. to 7:00 p.m.) and off-peak hours (7:00 p.m. to 7:00 a.m.), after data cleaning, from March to August 2019.
Table 1 shows average service time in off-peak hours compared to the day-time. The average service time is equal to 72 min based on 3714 observations during day-time hours. A significant variance was found in service times. For some firms, the service times increased in the off-peak hours, while for others the service time decreased. Discussions with logistics staff indicated that there were a variety of logistical reasons for delays in the off-peak period. Insights into the reasons are provided in the Lessons Learned section.
Table 1 also provides a result of a
t-test for the difference between off-peak and day-time service times. This analysis shows a statistically significant higher service times in off-peak time compared to day-time stops with over 99% confidence level.
Table 2 shows the percentage of off-peak stops for the pilot retail stores. Overall, the proportion of stops made at participating retail stores during off-peak hours during the pilot was 1.30%.
5.2. Average Speed
Average speed is calculated as an indicator of travel time. Average speed is a preferred indicator over travel time because truck routes selected from day-to-day vary as a result of dynamic routing of the participating firms, which would pose difficulties in the comparison of travel times. The average speed is based on the trips from participating firms’ depots and retail stores to the pilot retail stores. These trips are extracted after cleaning of the data provided by participating firms. Trip speeds are calculated using Google Map queries due to the imprecise GPS tracking data of the third firm and unreasonably low GPS speed from the first firm. We use Google Map speeds (determined for the observed trip departure time) for all three firms so that the speed performance measurement is consistent across the three firms.
Table 3 presents a summary of the average speed for day-time and off-peak hours. The average speed is weighted based on the trip length.
Table 3 shows a higher average speed in off-peak hours compared to day-time hours. From March to August 2019, the average speed of the trips in the off-peak hours is 18.1% faster than those that happened in day-time hours. The last column shows the result of a weighted
t-test on significance of the difference between off-peak and day-time average speeds. The analysis confirms a statistically significant difference between the two average speeds with over 99% confidence.
5.3. Emissions
Five emission estimates, including GHG, CO, NOx, PM10, and PM2.5, were determined from MOVES based on trip speed, distance, vehicle type, and vehicle age. The average age of the truck fleet is considered for all trips instead of vehicle age specific to each trip due to a lack of data on specific vehicles used for each trip. The average age of vehicles, provided by each firm, is one, two, and eight years for the first, second, and third firms, respectively.
Table 4 provides average emission factors (weighted by trip kilometers) for the five emissions for day-time and off-peak. Improvements in GHG emissions averaged at 10.6% for trips made in the off-peak. Reductions in air pollutants, including CO, NOx, PM10, and PM2.5, ranged from 10.8% to 15.0%. The result of a
t-test confirms a statistically significant difference between GHG and air pollutants in off-peak compared to day-time hours with a confidence level over 99%.
5.4. Noise
Residents were informed of the off-peak delivery pilot via the Region of Peel website and social media at the outset of the pilot. The project team diligently tracked any noise complaints submitted to (a) the Region of Peel, (b) the Municipalities of Mississauga and Brampton, and (c) the three participating firms. No noise complaints were submitted over the course of the off-peak delivery pilot.
6. Lessons Learned
Post-pilot interviews were conducted with the logistics managers from LCBO, Loblaw Incorporated and Walmart Canada that were most familiar with the OPD pilot. The purpose of the interviews was to learn about challenges, successes, and ways that the pilot program could be improved. The post-pilot interview includes the following 12 questions:
What are the most important challenges/barriers to making more deliveries in the off-peak?
Were there any additional logistics costs associated with delivering off-peak? (e.g., staffing distribution center after hours, overtime pay).
Did your drivers prefer to work in the evening/early morning?
What challenges/feedback were expressed to you from the retail stores? Did the retail store managers have any additional expenses as a result of the pilot, e.g., extra evening staff)?
What advantages were there from a logistics perspective?
Did you learn of any security issues?
Did you learn of any safety issues (e.g., backing up at night, visibility)?
Was there less or more congestion at the drop-off sites (e.g., conflicts with other carriers)?
Do you see the potential to further expand on the off-peak delivery program (if the by-law exemption was made permanent)? Would this benefit your company’s operations?
What proportion of your total operations do you think could be moved off-peak?
What changes would you recommend for the program (e.g., expand hours past 11:00 p.m.?)
Did you ever receive any noise complaints?
6.1. Overall Experience
First, the companies were asked about the challenges/barriers to OPD. Few challenges were expressed, rather, all three firms identified that the OPD pilot was beneficial, and in one case, complaints were received from the retail stores about returning to the original schedule when the pilot ended. Since the companies involved in the pilot program were large, major changes in routing procedures were not needed to accommodate the adjustment to the off-peak for the limited number of participating retail stores.
Part of the success of the program was related to the careful selection of retail stores. First, retail stores were selected in locations that were not remote, therefore routing to multiple retail stores was facilitated, which was considered by one firm to be more cost effective than engaging in OPD for a single remote retail store. Second, retail stores were successfully chosen to avoid complaints from neighboring residents. While all firms were concerned with the potential for noise complaints, none were received. Third, some advantages were attributed to OPD in terms of staffing, store preparation and shelf stocking. One firm pointed out that deliveries could be made at a time that facilitated store preparation prior to opening time. Finally, it was noted by one firm that the truck/trailer assets could be better utilized, because the same vehicle could make a trip during the day and then another trip in the evening.
6.2. Logistics Costs
No additional logistics costs were identified by the participating firms as a result of the OPD pilot. The project team was concerned in particular about any additional staffing costs for the retail stores or distribution centers for increased off-peak activity. None of the three participating firms identified any additional staffing costs. One firm pointed out that the distribution centers ran overnight shifts even before the pilot started so there were no incremental changes. Another pointed out that some of the cost savings associated with faster travel speeds were mostly experienced by the carrier, who was under a fixed contract, though in the longer-term this could lead to lower costs to the stores. The only additional costs that were anticipated would be with the retail stores, which could incur additional staffing costs for an overnight crew; however, the pilot retail stores did not incur these costs because their current staffing systems could accommodate the OPD. Expansion of the program to include retail stores without after-hours staffing could lead to additional costs. One firm pointed out that the existing staff could be used more productively due to the off-peak timing of the shipments.
6.3. Driver Experience
One concern of the project team was about the driver/carrier experience. Two of the firms engaged their outsourced carriers in the OPD program and one firm used their own fleet of drivers. Those that outsourced their transportation identified that the carriers would likely prefer to make deliveries during off-peak hours because they are paid by the kilometer, or by the shipment, and therefore would financially benefit from faster travel speeds. For own-account transportation, no specific preference was identified, rather it was pointed out that individual drivers have mixed preferences of the time of day they prefer to work.
6.4. Distribution Centre Experience
It was noted by one firm that some benefits were experienced at a distribution center because it was possible to spread out the workload to avoid bottlenecks. Another firm pointed out that, since the pilot program was relatively small, there may have been efficiency gains that were not noticeable given the scale of operations of the firm.
6.5. Retail Store Experience
The experience at the retail stores was generally positive. One firm pointed out that the store presentation could be better in the morning because more time was available for retail staff to set up the store before opening. Other firms noted the importance of preparation time. If an OPD schedule can be organized with enough advance notice, then staffing and space in the backroom could be arranged to handle the deliveries. The only additional concern that was raised was that for some retail outlets the parking lots were busier in the evening with customers, which could be more difficult for the drivers to navigate. Therefore, evening deliveries would be better suited for retail stores with loading bays. The biggest advantage noted from the retail store perspective was the predictability of shipments. One firm noted that the deliveries arrived within minutes of the expected arrival time, when made in the off-peak hours. Predictable delivery times were found to be helpful with staffing.
6.6. Safety, Security, and Noise
No concerns were raised about any safety or security issues associated with OPD. All participating firms pointed out that drivers are trained to operate safely, and their loading docks are well-lit. It was noted by one firm that security was not an issue because stores were not located in isolated locations. All three participating firms confirmed that no noise complaints were made to the companies as a result of the OPD pilot.
6.7. Congestion at the Retail Stores
Logistics managers were asked about congestion at the retail locations in the off-peak. While it was noted that there are more customers in the evening hours, there was some diversity amongst firms about how busy staff were in the evening. One firm noted that there is less congestion in the delivery bays in the evening, because most other carriers deliver during the day and pointed out that OPD allowed for a spreading of the receiving workload over the course of the day and easier management of space in the backroom. Another firm suggested that retail staff may be busier in the evening, and some conflicts happened with other carriers at that time.
6.8. Expansion of the OPD Program
All participating firms enthusiastically supported the continuation and expansion of the OPD program. Substantial expansion of the program to new retail stores was advocated by all three firms. Some limitations on which retail stores could participate were related to (a) remoteness of stores (easier to deliver off-peak to stores that are not isolated), and (b) stores that already had staff assigned to work in the off-peak. All three firms felt that the pilot was run effectively and proposed few changes for expansion of the program. One suggestion was to include delivery arrival time predictability as an additional performance measure.
7. Conclusions
This paper investigated the benefits and challenges of off-peak deliveries for a pilot in the Region of Peel. In contrast to previous off-peak delivery projects, this is the first project focusing on deliveries in suburban areas. Three firms participated: LCBO, Loblaws, and Walmart, involving deliveries to 14 pilot retail stores. The analysis shows that during the six-month pilot, from March to August 2019, 30.1% of deliveries to pilot retail stores were made in off-peak hours (7:00 p.m. to 7:00 a.m.). The average speed of the trips that were made in off-peak hours during the six-month pilot is 18.1% faster than those that happened in day-time hours. Having higher speed in off-peak hours leads to lower emission factors. The total greenhouse gas emissions/km decreased by 10.6%, and emissions factors for air quality pollutants, including CO, NOx, PM10 and PM2.5 reduced by 10.8% to 15.0%. Results for service times varied between firms, but on average increased by 15.2%, indicating activities in the off-peak hours at the retail stores that prevented overall improvements in service time compared to day-time deliveries. Interviews with logistics managers identified that some delivery activities took longer for one company in the off-peak hours, in part because of the presence of potentially busier staff at that time of day.
The pilot off-peak delivery program is considered to be a success. From a public policy perspective, the movement of delivery vehicles to times of day when congestion is lower makes better use of available roadway capacity and reduces congestion for other road users during the peak travel time. Increases in commercial vehicle travel speed leads to lower emission factors which benefits public health and helps reduce the regional contributions to GHG emissions. If any additional noise occurred as a result of the OPD pilot program, it was not great enough to result in any noise-related complaints. From a business perspective, the improvements in travel speed reduce logistics cost and improve fuel efficiency and therefore enhance the business competitiveness of participating firms.
All three participating firms enthusiastically supported the continuation and expansion of the OPD program and expressed a strong willingness to continue participation. All of the participating firms considered the program to be well-organized and well-run and proposed few suggested changes, aside from the program’s expansion. Given the success of the Region of Peel OPD pilot, efforts were made to develop a program to expand the Region of Peel pilot to encompass other municipalities in the Greater Toronto and Hamilton Area and to expand the number of firms involved in the program.
On 19 March 2020, in response to COVID-19, the Ontario Government announced the Municipal Emergency Act 2020 to relax noise by-laws for goods delivery across the entire Province of Ontario. This measure to facilitate supply chains in an emergency situation was made possible, in part, based on the outcomes of the pilot presented in this paper. Our next step is to evaluate the experience of OPD in this Ontario-wide emergency to allow OPD.
Author Contributions
The authors confirm contribution to the paper as follows: study conception and design: M.J.R., S.K., and S.S.; literature review: G.A., M.J.R., and K.M.; analysis and interpretation of results: K.M., M.J.R.; draft manuscript preparation: K.M., M.J.R. All authors reviewed the results and approved the final version of the manuscript.
Funding
This study was funded by the Region of Peel, The Atmospheric Fund, Metrolinx, and the University of Toronto.
Institutional Review Board Statement
Not applicable.
Informed Consent Statement
Not applicable.
Data Availability Statement
Restrictions apply to the availability of these data. Data were obtained from Walmart, Loblaws, and LCBO and the data are unavailable to the public.
Acknowledgments
The contribution of MRK Innovations and Partners in Project Green are acknowledged. We thank Walmart, Loblaws, and LCBO for participating in the OPD pilot program. We acknowledge the help from An Wang from the Transportation and Air Quality Research Group for helping with the emissions analysis in this project.
Conflicts of Interest
The authors declare no conflict of interest.
Appendix A
Table A1.
Summary of Off-Peak Delivery Projects.
Table A1.
Summary of Off-Peak Delivery Projects.
| Location, Year [Reference]. | # of Carriers/Shippers | # of Receivers | Duration 1 | Performance Measures | Strategy | Technologies Used | Status of the Study |
|---|
| Sao Paulo, (FIFA), 2014 [21]. | 1 carrier (DHL)
1 shipper | 2 retail outlets | 2 weeks | -Speed (travel time)
-Productivity (Unloading time)
-Safety/Security risks (qualitative)
-Noise complaints | -Staffed OPD
-No cash incentive | Not mentioned | Project continued to second phase (next row) |
| Sao Paulo, 2014–2015 [22]. | Carrier: SETCESP
syndicate | 11 firms with 45 retail stores | 12 weeks October 2014 -
April 2015 | -Speed
-Productivity
-Safety (incidents from Police data)
-Noise (complaints and measurements) | -Staffed and unstaffed OPD
-No cash incentive | -Shadowing (measuring noise)
-Armed escort in 2 cases
-Truck GPS | -OPD a City policy
-Entire city implementation planned for 2016
-16 large firms, 9 new |
| New York City, 2009 [4]. | 20 trucks (8 vendors) | 35 receivers | 3 stages (each 1 month) | -Speed/service time
-Survey satisfaction | -Staffed (50%) and unstaffed (50%)
-Cash incentives ($2000/receiver and $300/truck to carriers) | -GPS enable smartphones
-Network models to assess to network wide impacts
-Follow-up survey | -Continued to second phase (next row)
-50% (unstaffed) remained with OPD |
| New York City, 2013 [14] | | 400 receivers | Unknown | -Speed/service time
-Survey satisfaction
-Noise | | -Low noise trucks/equipment
-Noise monitoring | -175–200 companies have shifted to OPD |
| Denmark (Copenhagen), 2012–2013 [16]. | 7 carriers | Unknown | Unknown | -Speed
-Fuel consumption (data was provided by the companies) | -No cash incentives | | -Most companies were happy to have participated.
-2 decided to continue OPD |
| Colombia, 2015 [23]. | 17 | | 8 weeks | -Cost
-Time
-Logistics
-Environment
-Safety | -Workshops
-Letters
-Scheduled one on one meetings
-Air quality measurements | Use of GPS data loggers
-Truck GPS
-Air emissions sensors
-Noise monitoring | -5 firms (mostly supermarkets) are continuing with OPD. |
| Stockholm, 2014 [24]. | 1 shipper
1 carrier with 2 trucks
(1 hybrid, 1 biogas) | ~30 restaurants and hotels in downtown Stockholm | 2 years (including preparation) | -Driving efficiency
-Delivery reliability
-Energy efficiency
-Service efficiency
-Noise complaints
-Route efficiency
-Post surveys | | -Trucks equipped with noise monitor
-GPS data
-Fuel level measurement | -OPD was extended for this carrier.
-Noise, cost benefit analysis is on-going |
| Barcelona, 2003 [25]. | One supermarket chain
-2 large trucks for OPD replacing 7 vans | 2 supermarket locations | 11 p.m.–12 a.m. and 5–6 a.m.
For 4 months | -Noise measurements
-Noise complaints | -Staffed delivery—No financial incentives
-Use of larger trucks | -Noise monitor (Police) | -By 2010, the supermarket chain has expanded OPD to over 407 store locations across Spain.
-Other supermarkets have considered OPD |
| Orlando, FL, USA [25]. | 1 shipper: Orlando health | 1 receiver: Central Florida hospital | 9 months | -Air quality
-Congestion
-Walkability on campus and in the neighborhood | | | |
Ontario, 2014
(Downtown Toronto) [26]. | 5 carriers | Over 30 receivers | 4 weeks | -Noise
-Travel time
-Participant experience | -No incentives | | The downtown pilot was a successful test in advance of the Panam/Parapanam Games (next row) |
| Ontario, 2015 (Panam/Parapanam Games) [26]. | Unknown | 100 businesses | 6 weeks | -Noise | -No incentives | | |
| London Olympics, 2012 [27]. | | | | -Noise disturbance | -TFL Code of practice | | |
References
- Sánchez-Díaz, I.; Georén, P.; Brolinson, M. Shifting urban freight deliveries to the off-peak hours: A review of theory and practice. Transp. Rev. 2016, 37, 521–543. [Google Scholar] [CrossRef]
- Minet, L.; Chowdhury, T.; Wang, A.; Gai, Y.; Posen, I.D.; Roorda, M.; Hatzopoulou, M. Quantifying the air quality and health benefits of greening freight movements. Environ. Res. 2020, 183, 109193. [Google Scholar] [CrossRef] [PubMed]
- Beck, L.F.; Dellinger, A.M.; O’neil, M.E. Motor vehicle crash injury rates by mode of travel, United States: Using exposure-based methods to quantify differences. Am. J. Epidemiol. 2007, 166, 212–218. [Google Scholar] [CrossRef] [PubMed]
- Holguín-Veras, J.; Ozbay, K.; Kornhauser, A.; Brom, M.A.; Iyer, S.; Yushimito, W.F.; Ukkusuri, S.; Allen, B.; Silas, M.A. Overall impacts of off-hour delivery programs in New York City Metropolitan Area. Transp. Res. Rec. 2011, 2238, 68–76. [Google Scholar] [CrossRef]
- Shoup, D. The High Cost of Free Parking; Planners Press: Chicago, IL, USA, 2005. [Google Scholar]
- Nourinejad, M.; Wenneman, A.; Habib, K.N.; Roorda, M.J. Truck parking in urban areas: Application of choice modelling within traffic microsimulation. Transp. Res. Part A Policy Pract. 2014, 64, 54–64. [Google Scholar] [CrossRef]
- Yannis, G.; Golias, J.; Antoniou, C. Effects of urban delivery restrictions on traffic movements. Transport. Plan. Tech. 2006, 29, 295–311. [Google Scholar] [CrossRef]
- Campbell, J.F. Peak period large truck restrictions and a shift to off-peak operations: Impact on truck emissions and performance. J. Bus. Logist. 1995, 16, 227–247. [Google Scholar] [CrossRef]
- Holguín-Veras, J.; Encarnación, T.; González-Calderón, C.A.; Winebrake, J.; Wang, C.; Kyle, S.; Herazo-Padilla, N.; Kalahasthi, L.; Adarme, W.; Cantillo, V.; et al. Direct impacts of off-hour deliveries on urban freight emissions. Transp. Res. D Transp. Environ. 2018, 61, 84–103. [Google Scholar] [CrossRef]
- Chiffi, C. Silent Ineer-City Overnight Deliveries in Barcelona (Spain). Available online: http://www.eltis.org/discover/case-studies/silent-inner-city-overnight-deliveries-barcelona-spain (accessed on 2 May 2017).
- Holguín-Veras, J.; Pérez, N.; Cruz, B.; Polimeni, J. Effectiveness of financial incentives for off-peak deliveries to restaurants in Manhattan, New York. Transp. Res. Rec. 2006, 1966, 51–59. [Google Scholar] [CrossRef]
- Holguín-Veras, J.; Silas, M.; Polimeni, J.; Cruz, B. An Investigation on the Effectiveness of Joint Receiver-Carrier Policies to Increase Truck Traffic in the Off-peak Hours—Part I: The Behavior of Receivers. Netw. Spat. Econ. 2006, 7, 277–295. [Google Scholar] [CrossRef]
- Holguín-Veras, J.; Silas, M.; Polimeni, J.; Cruz, B. An investigation on the effectiveness of joint receiver-carrier policies to increase truck traffic in the off-peak hours—Part II: The Behavior of Carriers. Netw. Spat. Econ. 2007, 8, 327–354. [Google Scholar] [CrossRef]
- Holguín-Veras, J.; Wang, C.; Browne, M.; Hodge, S.D.; Wojtowicz, J. The New York City off-hour delivery project: Lessons for city logistics. Procedia Soc. Behav. Sci. 2014, 125, 36–48. [Google Scholar] [CrossRef]
- Wang, X.; Zhou, Y.; Goevaers, R.; Holguin-Veras, J.; Wojtowicz, J.; Campbell, S.; Miguel, J.; Webber, R. Feasibility of Installing Noise Reduction Technologies on Commercial Vehicles to Support Off-Hour Deliveries; Final report submitted to New York State Energy and Research Development Authority and New York State Department of Transportation; Rensselaer Polytechnic Institute: Troy, NY, USA, 2014. [Google Scholar]
- Kolstrup, K.; Frank, C. Off-Hour Delivery Pilots: The Danish Experience. COE SUFS Webinar. 2016. Available online: https://coe-sufs.org/wordpress/wp-content/uploads/2016/04/Webinar_Updates-OHD-Part-I_-Final-04-13-2016.pdf (accessed on 25 July 2020).
- Ontario Ministry of Transportation. Keep Your Business Moving Creating a Games Travel Plan; Ontario Ministry of Transportation: Toronto, ON, Canada, 2015.
- Holguín-Veras, J.; Marquis, R.; Campbell, S.; Wojtowicz, J.; Wang, C.; Jaller, M.; Hodge, S.D.; Rothbard, S.; Goevaers, R. Fostering the use of unassisted off-hour deliveries: Operational and low-noise truck technologies. Transp. Res. Rec. 2013, 2379, 57–63. [Google Scholar] [CrossRef]
- Region of Peel. Peel Region Goods Movement Strategic Plan 2017–2021. 2017. Available online: https://www.peelregion.ca/pw/transportation/goodsmovement/pdf/goods-movement-strategic-plan-2017-2021.pdf (accessed on 25 July 2020).
- United States Environmental Protection Agency. Latest Version of MOtor Vehicle Emission Simulator (MOVES). Available online: https://www.epa.gov/moves/latest-version-motor-vehicle-emission-simulator-moves (accessed on 10 July 2020).
- Bertazzo, T.; Hino, C.; Lobão, T.; Tacla, D.; Yoshizaki, H. Business case for night deliveries in the city of São Paulo during the 2014 World Cup. Transp. Res. Proc. 2016, 12, 533–543. [Google Scholar] [CrossRef]
- Yoshizaki, H.; Barbieri da Cunha, C.; The Sao Paolo Off-Hours Delivery Pilot Project. COE SUFS Webinar. 2016. Available online: https://coe-sufs.org/wordpress/wp-content/uploads/2016/04/Webinar_Updates-OHD-Part-I_-Final-04-13-2016.pdf (accessed on 25 July 2020).
- Zambrano, A.M.; Martinez, S.E.; Ballasteros, F.A.; Off-Hours Delivery Pilot Project in Bogotá. COE SUFS Webinar. 2016. Available online: https://coe-sufs.org/wordpress/wp-content/uploads/2016/04/Webinar_Updates-OHD-Part-I_-Final-04-13-2016.pdf (accessed on 25 July 2020).
- Koutoulas, A.; Franklin, J.P.; Eliasson, J. Assessing night-time deliveries in Stockholm, Sweden. Transp. Res. Rec. 2017, 2605, 54–60. [Google Scholar] [CrossRef]
- LaBelle, J.; Frève, S.F. Exploring the Potential for Off Peak Delivery in Metropolitan Chicago: Research Findings and Conclusions. 2016. Available online: https://rosap.ntl.bts.gov/view/dot/31424 (accessed on 3 December 2020).
- Zimmerman, D.; Wiginton, L. Improving Urban Freight Efficiency: Global Best Practices in Reducing Emissions in Goods Movement. 2017. Available online: https://www.pembina.org/reports/urban-freight-report-final.pdf (accessed on 3 December 2020).
- Browne, M.; Allen, J.; Wainwright, I.; Palmer, A.; Williams, I. London 2012: Changing delivery patterns in response to the impact of the Games on traffic flows. Int. J. Urban. Sci. 2014, 18, 244–261. [Google Scholar] [CrossRef]
| Publisher’s Note: MDPI stays neutral with regard to jurisdictional claims in published maps and institutional affiliations. |
© 2020 by the authors. Licensee MDPI, Basel, Switzerland. This article is an open access article distributed under the terms and conditions of the Creative Commons Attribution (CC BY) license (http://creativecommons.org/licenses/by/4.0/).

 ,
, 

