Article

Decoupling Analysis between Economic Growth and Air Pollution in Key Regions of Air Pollution Control in China

1
Key Laboratory of Urban Environment and Health, Institute of Urban Environment, Chinese Academy of Sciences, Xiamen 361021, China
2
University of Chinese Academy of Sciences, Beijing 100049, China
*
Author to whom correspondence should be addressed.
Sustainability 2021, 13(12), 6600; https://doi.org/10.3390/su13126600
Submission received: 1 May 2021 / Revised: 7 June 2021 / Accepted: 8 June 2021 / Published: 9 June 2021
(This article belongs to the Special Issue Regional Ecology and Sustainability)

Abstract

:
The Chinese government has implemented a number of environmental policies to promote the continuous improvement of air quality while considering economic development. Scientific assessment of the impact of environmental policies on the relationship between air pollution and economic growth can provide a scientific basis for promoting the coordinated development of these two factors. This paper uses the Tapio decoupling theory to analyze the relationship between regional economic growth and air pollution in key regions of air pollution control in China—namely, the Beijing–Tianjin–Hebei region and surrounding areas (BTHS), the Yangtze River Delta (YRD), and the Pearl River Delta (PRD)—based on data of GDP and the concentrations of SO2, PM10, and NO2 for 31 provinces in China from 2000 to 2019. The results show that the SO2, PM10, and NO2 pollution in the key regions show strong and weak decoupling. The findings additionally indicate that government policies have played a significant role in improving the decoupling between air pollution and economic development. The decoupling between economic growth and SO2 and PM10 pollution in the BTHS, YRD, and PRD is better than that in other regions, while the decoupling between economic growth and NO2 pollution has not improved significantly in these regions. To improve the relationship between economic growth and air pollution, we suggest that the governments of China and other developing countries should further optimize and adjust the structure of industry, energy, and transportation; apply more stringent targets and measures in areas of serious air pollution; and strengthen mobile vehicle pollution control.

1. Introduction

Since China’s economic reform, the country’s economy has developed rapidly. However, this development has been accompanied by the excessive consumption of resources and the deterioration of environmental quality. For example, industrialization has had a deleterious impact on ambient air quality [1,2]. Many factors related to economic growth have an impact on pollutant emissions, such as fossil energy consumption, electricity consumption, urbanization, and globalization [3,4]. In the 21st century, the conflict between economic development and environmental protection has become prominent. In particular, the emission of air pollutants from the consumption of large amounts of fossil energy has a significant impact on human health [5,6]. This has had serious impacts on the general public and has become a major bottleneck for China’s sustainable development. As of 2019, 57% of China’s cities still failed to meet the threshold of air quality standards, with the Beijing–Tianjin–Hebei region (BTH) and surrounding areas and the Fen–Wei Plain being especially highly polluted [7]. Protecting ecosystems while maintaining steady economic development has become an enormous challenge for the Chinese government. As the ministry in charge of air pollution prevention and control, the Ministry of Ecology and Environment is researching how to formulate scientific and rational environmental policies that can not only reduce pollution emissions but also promote the improvement of environmental quality without negatively affecting economic development.
During the 21st century, China has made great efforts to reduce air pollution by promulgating and implementing laws, regulations, and environmental policies and implementing emission reduction projects for atmospheric pollutants such as sulfur dioxide (SO2), nitrogen oxides (NOx), and soot. Since 2012, China has made a strategic decision to promote the construction of an “ecological civilization”, putting forward the concept that “clear waters and green mountains are as good as mountains of gold and silver”. In June 2013, China promulgated and implemented the Action Plan for the Prevention and Control of Air Pollution (the Action Plan), which emphasizes the key regions for atmospheric governance, i.e., the BTH, Yangtze River Delta (YRD), and Pearl River Delta (PRD) [8,9]; in 2018, China promulgated the “Three-Year Action Plan to Beat Air Pollution” (the Three-Year Action Plan), an updated version of the Action Plan, and the country has since made great efforts to optimize the industrial structure, energy structure, transportation structure, and land-use structure and adjust the key regions. To further focus on areas with more severe air pollution and to strengthen regional joint prevention and control [10], the Three-Year Action Plan promotes air quality improvement while pushing economic restructuring and upgrading to achieve high-quality development. Furthermore, since 2000, China has been making continuous efforts to “decouple” air pollution from economic growth. Its long-term goal is to build a “Beautiful China” that achieves sustainable development and highly developed ecological civilization by 2035.
Decoupling, a physical concept developed in the 1960s, refers to the lack of a response relationship between two or more physical quantities that are correspondingly related. Used by economists in the late 20th century to analyze the correlation between resource consumption as well as waste discharge and economic output, the decoupling coefficient is used to measure the extent to which environmental pollution is linked to economic growth [11]. Some scholars put forward that decoupling is the best measure for studying the relationship between economic development and emissions of greenhouse gases or air pollutants [12].
The decoupling theory has two models: (1) the model proposed by the Organization for Economic Cooperation and Development [13] uses the end-to-end ratios of environmental pressures to economic ratios to characterize decoupling in order to indicate the relationship between economic development and environmental pollution [14]; (2) the model proposed by Tapio uses a new decoupling coefficient based on the concept of elasticity [15], which reflects the decoupling among variables based on their response variable and the timeframe and divides the decoupling into eight types. This new decoupling coefficient has been widely used in studies of the relationship between economic growth and the state of the environment: Wang and Jiang studied the decoupling elasticity between China’s economy and carbon dioxide (CO2) emissions and found that the decoupling elasticity showed a downward trend from 2002 to 2014, and the decoupling state was categorized by expansive negative decoupling and weak decoupling [16]. Additionally, by analyzing data from different provinces, Cohen et al. found that China’s emissions decoupling elasticity is higher than that of developed countries and lower than that of major developing countries and predicted that China’s emissions will continue to decouple as its economy grows [17]. Through research on the decoupling of economic growth and SO2 emissions in China, Russia, Japan, and the United States, Wang et al. found that, in the United States and Japan, SO2 emissions were more decoupled from economic growth than in China and Russia and that the change of environmental governance policy has a significant impact on a country’s decoupling between economic growth and pollution emissions [18]. Moreover, by examining the decoupling between economic output and carbon emissions in Beijing and Shanghai, Wang et al. found that Beijing was more decoupled than Shanghai [19], while Wang concluded that the Beijing–Tianjin–Hebei region was categorized by weak decoupling of economic growth from carbon emissions [20].
In China, the decoupling between environmental pollution and the economy mainly has the following characteristics: (1) Focusing on the field of carbon emissions, there are relatively few studies on the decoupling of economic growth from environmental pollution. (2) The scope of current research is mostly limited to the whole country, or some provinces or cities, such as the study of Yu et al. on the whole of China [21] and the studies of Lai et al. and Ji et al. on the provinces of Hunan, Guangdong, and Yunnan, respectively [22,23]. Furthermore, Wang et al. and Xu et al. studied the relationship between air pollutant emissions and economic growth in the cities of Tianjin and Panzhihua [24,25]. Regional development differences are an essential feature of China’s economy, with different regions being at different stages of economic development [26]. The same pattern applies to air pollution in China: in recent years, the severity of air pollution has significantly varied among different regions [27]. However, there have been relatively few studies of the decoupling between environmental pollution and the economy at the regional scale. Zhang et al. and Shi et al. investigated 31 Chinese provinces and studied the decoupling between economic development and environmental pollution among Eastern, Central, Western, and Northeastern China [28,29]. Only Xi et al. conducted a study on the decoupling between industrial growth and environmental pollution in the Bohai Economic Rim [26]. (3) Atmospheric pollutant emissions are often used to represent environmental pressure, while the atmospheric concentration of pollutants is less used. Sulfur dioxide, soot, and PM2.5 are the most widely used air pollution indicators [30,31,32]. Only Xia et al. performed a comprehensive analysis of SO2, soot, and NOx, which are the primary air pollutants in China [33]. Based on the above studies, this article selects the relationship between air pollution and economic growth as the research topic, targeting the Chinese provinces that are most economically developed, densely populated, and heavily polluted, and which share common industrial characteristics. This paper analyzes the concentrations of SO2, inhalable particles (PM10), and nitrogen dioxide (NO2) at the regional scale. The main research questions are as follows: (1) What is the impact of China’s environmental policies on the relationship between economic growth and air pollution? (2) What is the impact of selecting key regions for atmospheric pollution control on the relationship between economic growth and air pollution in these regions? (3) What are possible problems with China’s efforts to build an ecological civilization?
In summary, China’s severe air pollution is a major obstacle to its sustainable economic and social development, as the key regions for atmospheric governance are the most prominent areas of contradictions. To date, there has been no systematic analysis of the relationship between economic growth and air pollution in the key regions. Therefore, this paper aims to perform a systematic evaluation of the relationship between economic growth and air pollution in the key regions and to obtain an in-depth understanding of the achievements and problems associated with China’s air pollution prevention and control policies for promoting regional economic development and air quality improvement. Furthermore, practical policy recommendations are put forward for China and other developing countries to coordinate high-quality economic development and the high-level protection of the ecological environment.

2. Materials and Methods

2.1. Research Areas

The Action Plan and Three-Year Action Plan list the BTH, the YRD, and the PRD, and the Fen–Wei Plain as key regions for air pollution prevention and control. These regions cover 12 municipalities and provinces that are economically developed and densely populated, namely Beijing, Tianjin, Hebei, Shanxi, Shanghai, Jiangsu, Zhejiang, Anhui, Shandong, Henan, Guangdong, and Shaanxi. In 2019, 7 of these 12 provinces, such as Beijing and Shanghai, ranked in the top 10 in China in terms of gross domestic product (GDP) per capita, while 10 of these provinces, such as Shanghai and Tianjin, ranked in the top 10 in China in terms of population density [34,35]. The aforementioned 12 regions are among the most polluted regions in China; for example, in the BTH and the Fen–Wei Plain, air pollutant emissions per unit area are about four times the national average [9]. In the above 12 provinces, the conflicts between economic development and environmental protection and human health are prominent, and, hence, it is vital to carry out relevant research.
To facilitate data analysis, this paper studies the following three major areas based on the Action Plan and the Three-Year Action Plan: (1) the BTHS, including the cities/provinces of Beijing, Tianjin, Hebei, Shanxi, Henan, Shandong, and Shaanxi; (2) the YRD, including the provinces of Shanghai, Jiangsu, Anhui, and Zhejiang; and (3) the PRD, including Guangdong Province. In addition to the above 12 provinces, the remaining 19 provinces of China are considered as non-key regions for atmospheric governance, i.e., non-key regions (Figure 1). Moreover, considering the large scale of BTHS, this paper analyzes Beijing and Shaanxi (two typical provinces in BTHS) separately so that the results will be more beneficial for targeted policymaking.

2.2. Materials

In the field of empirical research on the decoupling of economic growth from environmental pollution, GDP and GDP per capita are often used as indicators of economic growth. There are two main types of environmental pollution data: (1) data of industrial pollutant discharge (e.g., industrial waste gas and wastewater discharge); and (2) data of pollutant concentration (e.g., atmospheric pollutant concentration), whose accuracy and reliability are better than those of the emission data. The focus of air environmental management in China has changed from the total discharge volume of pollutants control to air quality improvement. Monitoring data are the most objective indicator of air quality, which directly affects human health. Therefore, this paper chooses pollutant concentration data as an indicator of environmental pressure, which not only meets the current environmental management needs but also ensures that the data are intuitive and reliable.
This paper uses the GDP and GDP per capita of 31 provinces from 2000 to 2019 as indicators of economic development. The GDP data and population data were derived from the official website of the National Bureau of Statistics of China. GDP was calculated at a constant price level, using 2000 as the base period to counteract the effects of inflation. Among the six basic air pollutants, this paper selects the concentrations of SO2, PM10, and NO2 to reflect air pollution. This decision was made for two reasons: (1) The continuity and integrality of the data. This study collected data spanning from 2000 to 2019, yet PM2.5 and O3 have only been monitored in China since 2013. Thus, insufficient data were available to use these two substances in this study. (2) The status of air pollution in China. SO2 and PM10 are two key pollutants that have been the focus of air pollution control in China over the past 20 years. Additionally, compound pollution problems caused by PM2.5 and ozone (O3) have become increasingly prominent in China in recent years, considering that the emissions of SO2, particulate matter (PM), NO2, volatile organic compounds (VOCs), and ammonia (NH3) have also increased in recent years [9,36]. The concentrations of SO2 and PM10 can directly reflect the emissions of SO2 and PM, while the concentration of NO2 is closely related to the emission of NOx. The concentration data were all obtained from the Ministry of Ecology and Environment of the People’s Republic of China (Table 1).

2.3. Methodology

2.3.1. Conceptual Framework

Based on the Tapio Decoupling Model and regression analysis, this paper uses the GDP and GDP per capita and SO2, PM10, and NO2 concentration data to analyze the economic development and air pollution in the key regions of air pollution control in China. It also assesses the decoupling relationship between air pollution and economic development and its trend. Moreover, policy recommendations are put forward based on the analysis of the impacts of China’s air pollution prevention and control policies on the abovementioned decoupling results (Figure 2).

2.3.2. Tapio Decoupling Model

The Tapio Decoupling Model is based on the decoupling elasticity theory, which studies the relationship between economic development and environmental quality. The decoupling coefficient reflects the sensitivity of environmental pollution change to the change in economic growth. According to the Tapio Decoupling Model, the decoupling of environmental pollution from economic growth can be expressed as a decoupling coefficient, which is calculated by dividing the percentage change of environmental pollution by the percentage change of GDP or GDP per capita in a given period [14] as follows:
Tt+1 = %ΔEt+1/%ΔGt+1 = (ΔEt+1/Et)/(ΔGt+1/Gt)
where Tt+1 represents the decoupling coefficient at time t + 1; ΔEt+1 and ΔGt+1 represent the change of environmental pollution and the change of economic growth at time t + 1, respectively; while Et and Gt represent the level of environmental pollution and the economic growth at time t, respectively.

2.3.3. Classification of Decoupling

Based on the positive/negative change of environmental pollution and economic growth and using elasticity values of 0, 0.8, and 1.2 as the critical values, the decoupling coefficient was calculated using Formula (1). Then, the relationships between economic growth and environmental pollution were categorized into decoupling, connecting, and negative decoupling [15]. Decoupling was sorted into eight types according to the degree of superiority or inferiority: strong decoupling, weak decoupling, expansive connection, expansive negative decoupling, recessive decoupling, recessive coupling, weak negative decoupling, and strong negative decoupling. These eight types were represented in four quadrants (Table 2).

2.3.4. Data Preprocessing

Given that China has only been monitoring PM10 and NO2 concentrations at a large scale since 2001, to ensure the data’s validity, this paper selects the average annual concentration of SO2 from 2000 to 2019 and the yearly average concentration of PM10 and NO2 from 2001 to 2019 for analysis. Additionally, in 2012 and 2013, China implemented new Ambient Air Quality Standards (GB 3095-2012) and the Technical Regulation for Ambient Air Quality Assessment (HJ 663-2013), which tightened the requirements for the validity of monitoring data and statistics. As a direct result of this, the number of monitoring sites that were used in the evaluation changed significantly between 2012 and 2013, leading to discrepancies and poor comparability for pollutant concentration statistics between these two years. Therefore, to guarantee the continuity and comparability of data analysis and reduce outliers induced by various statistical methods, the 2013 data are excluded from the result analysis.

3. Results

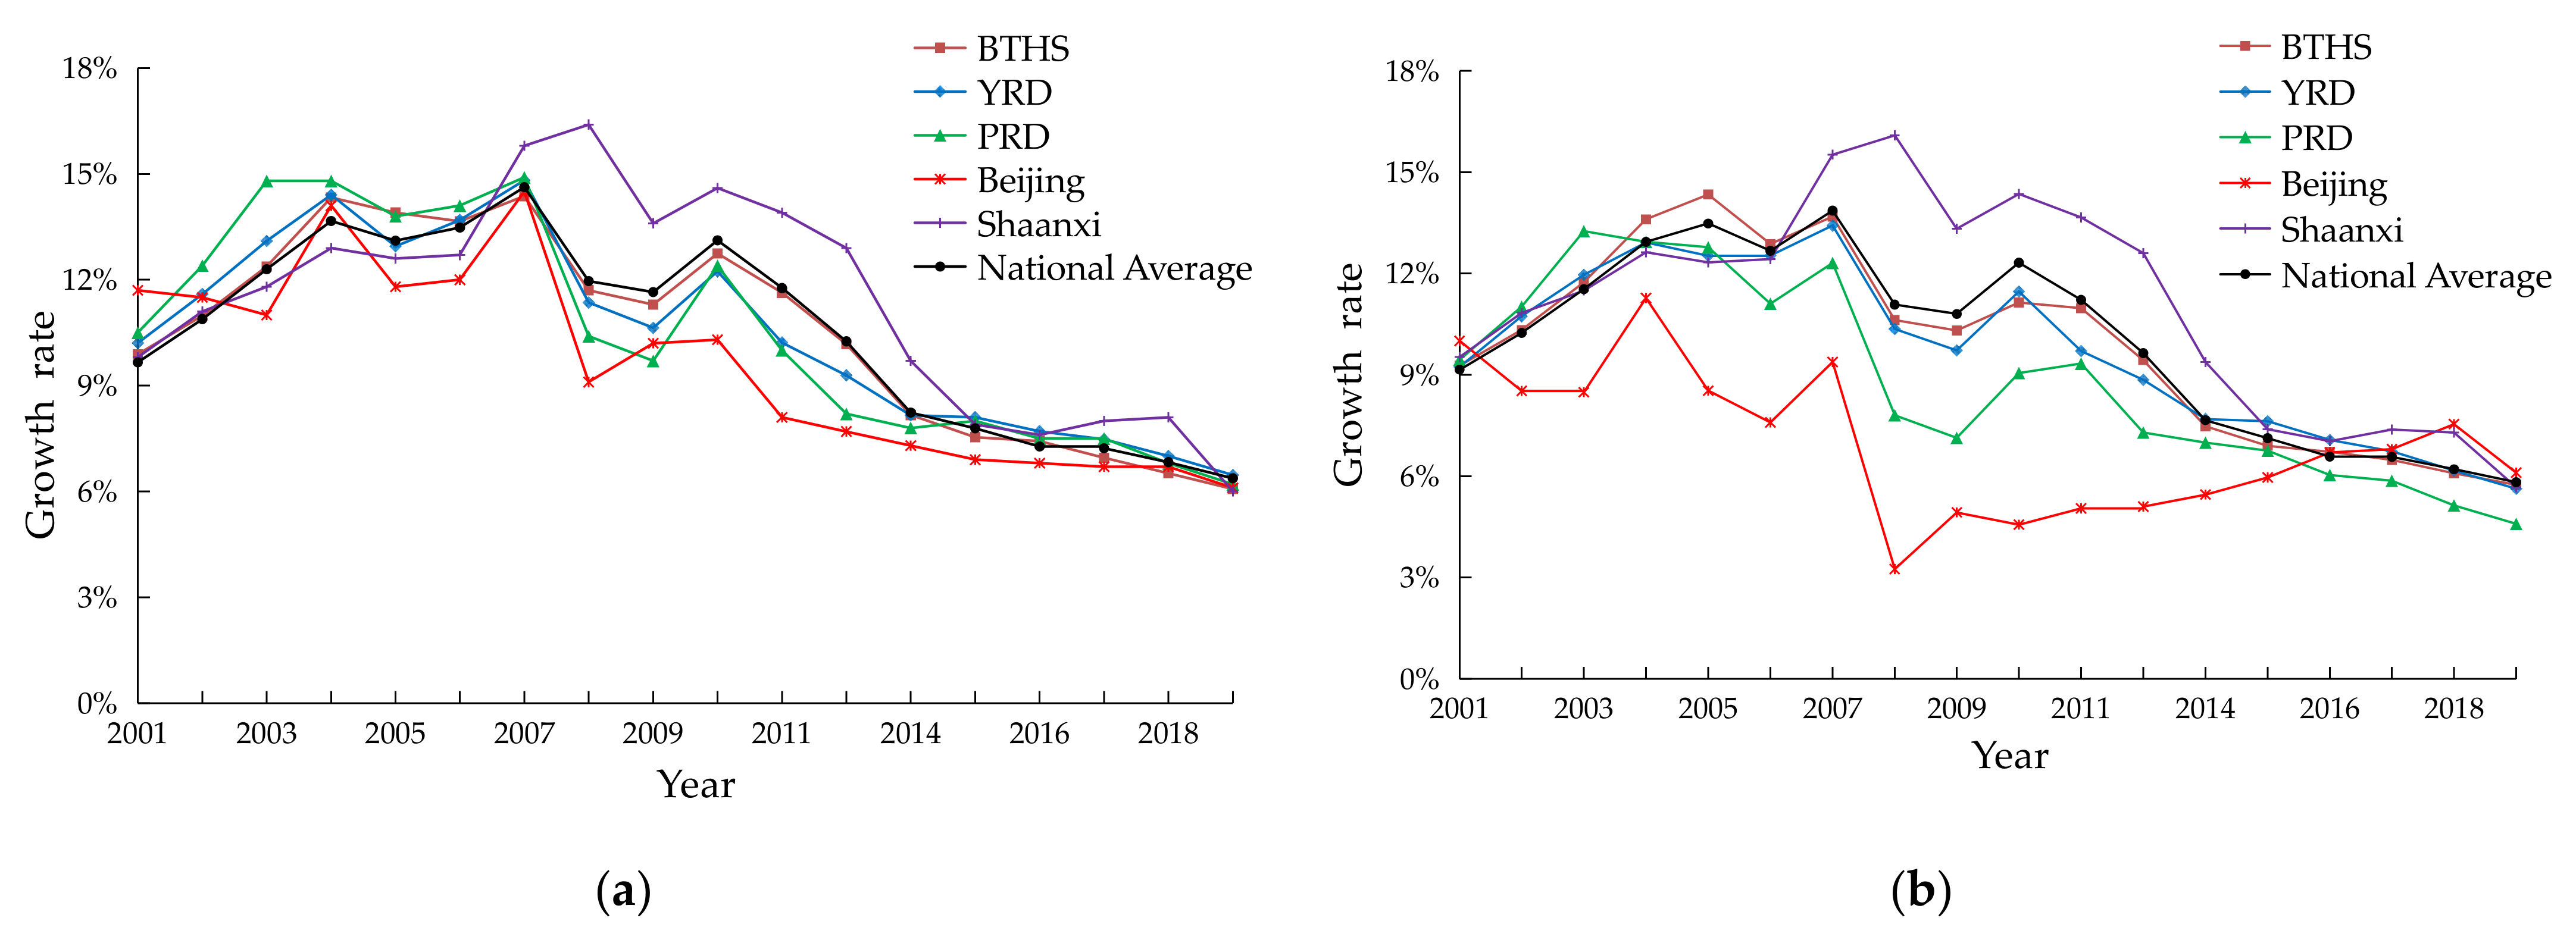
3.1. Economic Growth

3.1.1. National Level

Between 2000 and 2019, the national economy maintained a high growth rate, with the annual growth rates of GDP and GDP per capita staying above 6.4% and 5.8%, respectively (Figure 3). From 2000 to 2007, the growth rates of GDP and GDP per capita increased from 9.7% to 14.6% and from 9.2% to 13.9%, respectively. However, in 2008–2012, the growth of these parameters slowed markedly, with GDP and GDP per capita falling from their peaks in 2007 to 10.3% and 9.6%, respectively, in 2012. In 2014–2019, the growth of these parameters decreased but remained stable at around 6%.

3.1.2. Key Regions

Throughout 2000–2019, the economy of the three key regions maintained a high growth rate, with annual growth rates of GDP and GDP per capita of 6.1% and 4.6%, respectively; these growth rates are roughly the same as those of the whole country during the same period. The period of 2001–2007 was a period of high growth, with the annual GDP growth rate reaching a maximum value of 14.9% (PRD in 2007) and the GDP per capita growth rate reaching a maximum value of 14.3% (BTHS in 2005). In 2008–2012, there was a marked slowdown in economic growth, with the PRD having the slowest growth rate; in this region, the annual growth rates of GDP and GDP per capita in 2012 were 8.2% and 7.3%, respectively. From 2014 to 2019, the rate of economic growth continued to slow in all regions except for the PRD, where the GDP per capita declined significantly in 2018–2019, with the growth rates of the other regions being close to the national average level, with an average difference of less than 1%.

3.1.3. Typical Provinces

Between 2000 and 2019, the economic growth rates of Beijing and Shaanxi showed completely different trends. From 2001 to 2007, Beijing’s economy maintained high growth, with the annual growth rates of GDP and GDP per capita remaining above 7%. In 2008, the growth rate dropped sharply, with the annual growth rate of GDP per capita dropping to 3.2%. From 2009 to 2019, Beijing’s GDP growth rate showed a downward trend, with the lowest annual growth rate of 6.1% being observed in 2019, while the growth rate of GDP per capita increased each year, peaking at 7.5% in 2018. Beijing is the only region considered in this study where the GDP per capita growth rate increased each year between 2010 and 2019. This phenomenon may be related to the slowdown in population growth in Beijing during this period; Beijing’s population growth declined from 5.5% in 2010 to 0% in 2019. The trend of Shaanxi’s economic growth was roughly the same as the national average, with the GDP and GDP per capita reaching their respective peaks of 16.4% and 16.1% in 2008 and their respective minima of 6.0% and 6.1% in 2019.

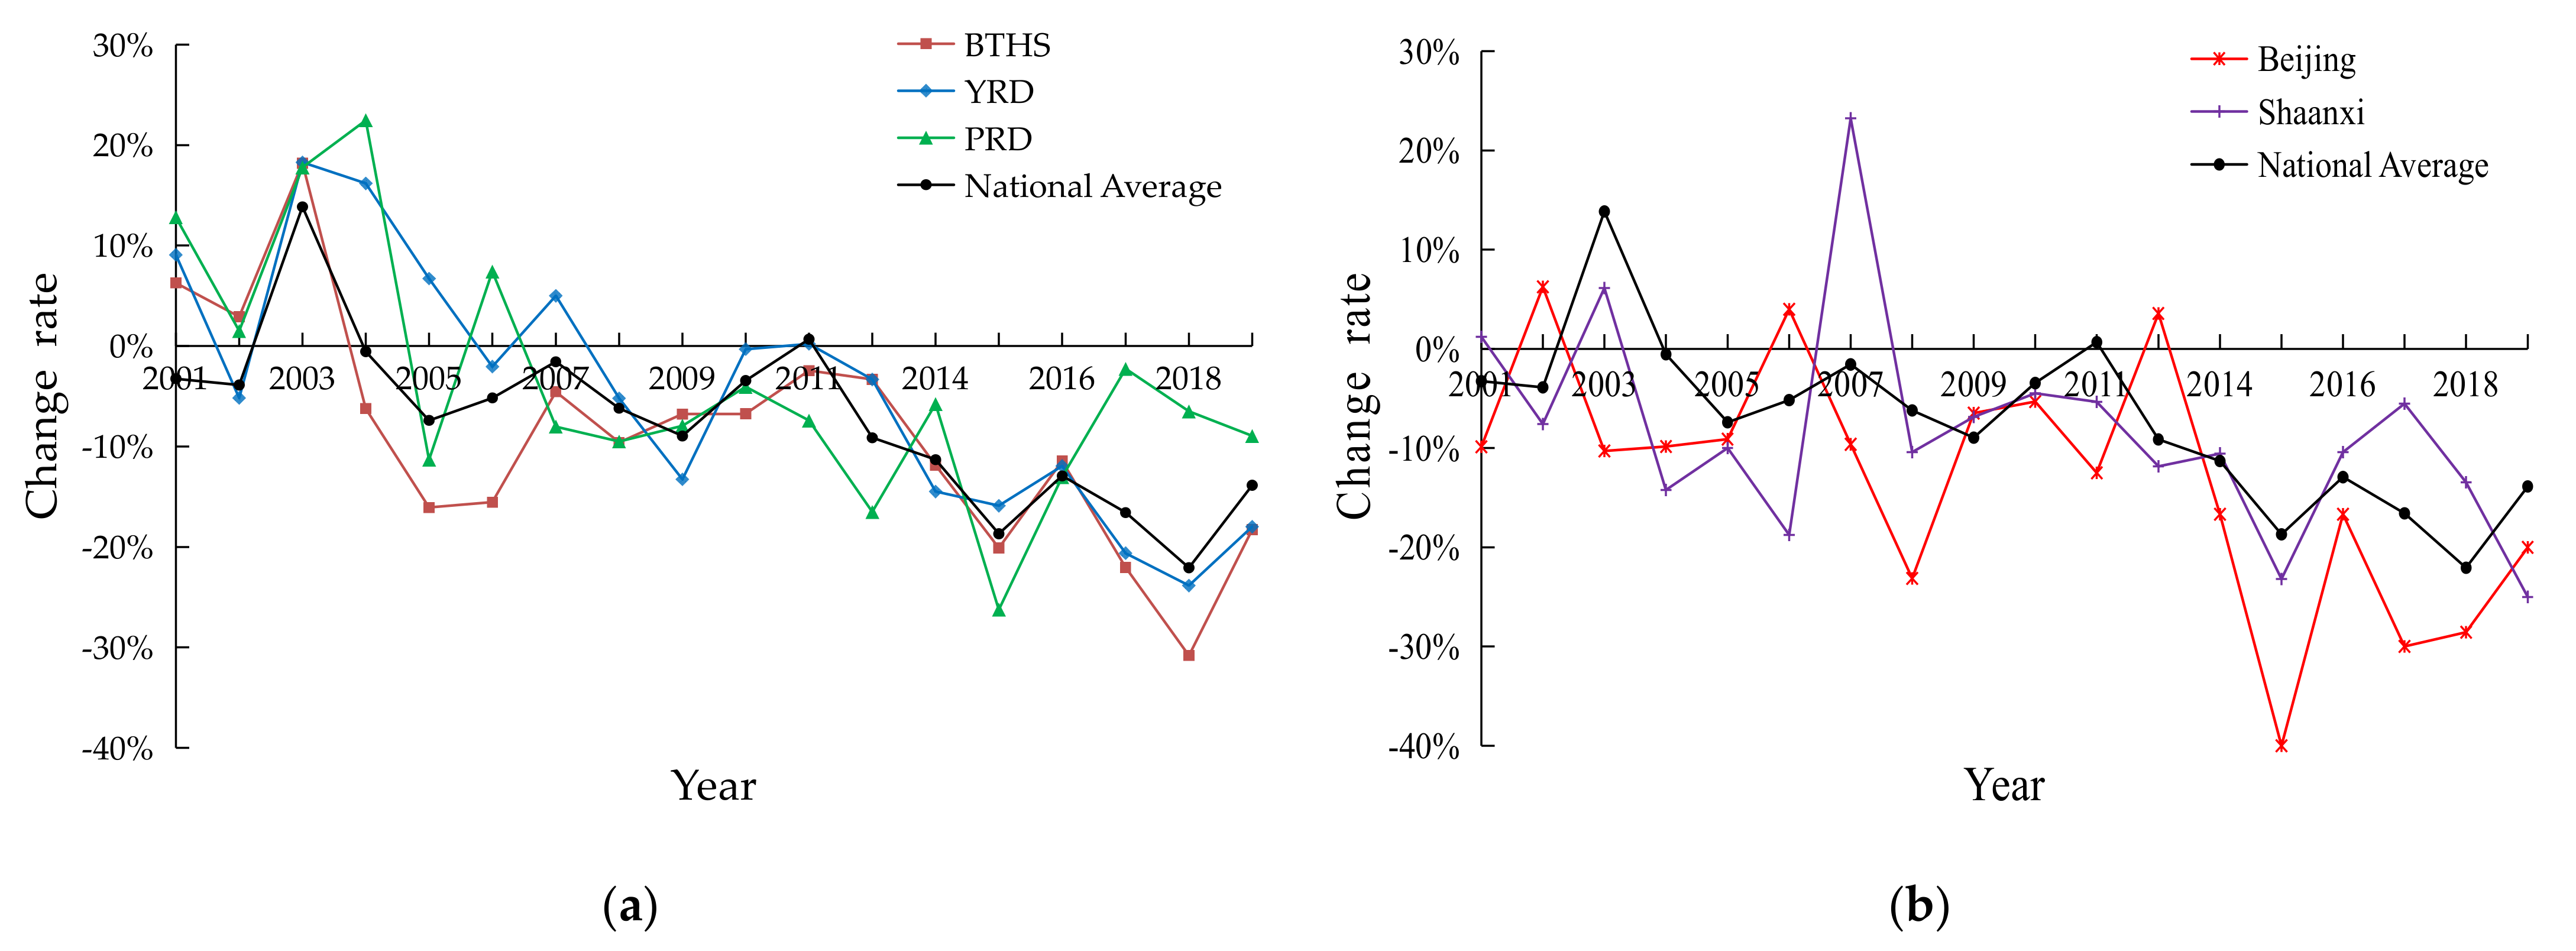
3.2. Analysis of the Decoupling of Economic Growth from SO2 Concentration

3.2.1. Evolution of SO2 Concentration

From 2000 to 2019, the average concentration of SO2 in China showed a sharp decline, dropping by 75.6% between 2000 and 2019. The national average SO2 concentration slowly rose from 2001 to 2003, with an increase of 13.9% in 2003. From 2004 to 2012, it maintained a steady downward trend, with the maximum annual decrease of 9.1% occurring in 2012. From 2014 to 2019, the average national SO2 concentration decreased to a larger degree than in previous years, with the largest decline of 22.1% being observed in 2018. For the key regions (Figure 4a), the SO2 concentrations also decreased significantly between 2000 and 2019, with decreases of 79.5%, 64.4%, and 53.8% in BTHS, YRD, and PRD, respectively. The declines between 2014 and 2017 were larger than those in previous years, with decreases of 20.1%, 15.9%, and 26.2%, respectively. Between 2018 and 2019, the SO2 concentrations in the BTHS and YRD regions continued to decline significantly, reaching the highest annual decreases of 30.8% and 23.8%, respectively, in 2018, while the PRD’s decline was smaller. For the typical provinces (Figure 4b), the trend of SO2 concentration decline was stable between 2000 and 2019, with Beijing experiencing a decrease of 40.0% in 2015 and Shaanxi experiencing a reduction of 25.0% in 2019, which are higher than the national average decrease in SO2 concentration.

3.2.2. Decoupling Analysis

The decoupling coefficients between SO2 pollution and GDP as well as GDP per capita in China’s key regions and typical provinces from 2001 to 2019 are shown in Figure 5. The change trends of the decoupling coefficients of SO2 concentration and GDP as well as GDP per capita are basically the same for all of the studied areas. In the following, GDP per capita is taken as an example. The following characteristics were observed: First, from a nationwide perspective, China has a good level of decoupling between SO2 pollution and economic development. Except for 2003, all other years have strong and weak decoupling, of which strong decoupling years accounted for 89.4%. The decoupling coefficient showed a clear downward trend, from a peak of 1.20 in 2003 to the lowest value of −3.56 in 2018. Second, the following was found for the key regions (Figure 5c): (1) Decoupling was very good. Except for 2001, 2003, and 2004, the decoupling was either strong or weak, and from 2012 to 2019, the decoupling was strong. (2) Decoupling improved markedly between 2014 and 2019. The decoupling coefficient declined remarkably from 2004 to 2005, from expansive negative decoupling to strong decoupling or weak decoupling. Additionally, there was another significant decline between 2014 and 2015. The decoupling coefficients in the BTHS and PRD regions reached their lowest levels of −5.06 and −3.87, respectively, in 2018, while that of the PRD reached its lowest level of −3.88 in 2015. (3) From 2014 to 2019, the decoupling in the BTHS and YRD regions was better than the national average and that of the PRD. During this period, the average decoupling coefficients in the BTHS, YRD, and PRD regions and the whole country, were −2.97, −2.63, −1.75, and −2.42, respectively. From 2017 to 2019, the decoupling coefficient in the PRD region was significantly higher than those of the BTHS and YRD regions, which contributed significantly to its high average level from 2014 to 2019. Third, for the typical provinces (Figure 5d), from 2014 to 2019, Beijing’s decoupling was generally significantly better than the national average. From 2018 to 2019, the decoupling in Shaanxi improved significantly, with the decoupling coefficient dropping significantly. In 2019, the decoupling coefficient in Shaanxi maintained a downward trend despite the overall rebound in the whole country, reaching a record low of −4.41; this was the first time since 2016 that it was below the national average (−2.38 in 2019), and the difference (2.03) was the largest ever.

3.2.3. Trend Analysis

According to the regression analysis of SO2 concentration and GDP per capita in the three key regions from 2001 to 2019 (Figure 6), the R2 values of the fitting curves between SO2 concentration and GDP per capita in the three key regions are all more than 0.6, showing a strong correlation. With the increase of GDP, the SO2 concentration in the three key regions generally showed a steady downward trend; this indicates that, in recent years, SO2 pollution in these key regions has been gradually reduced alongside economic growth, and the relationship between the two is well-coordinated, which is mutually confirmed by the results of the decoupling analysis.

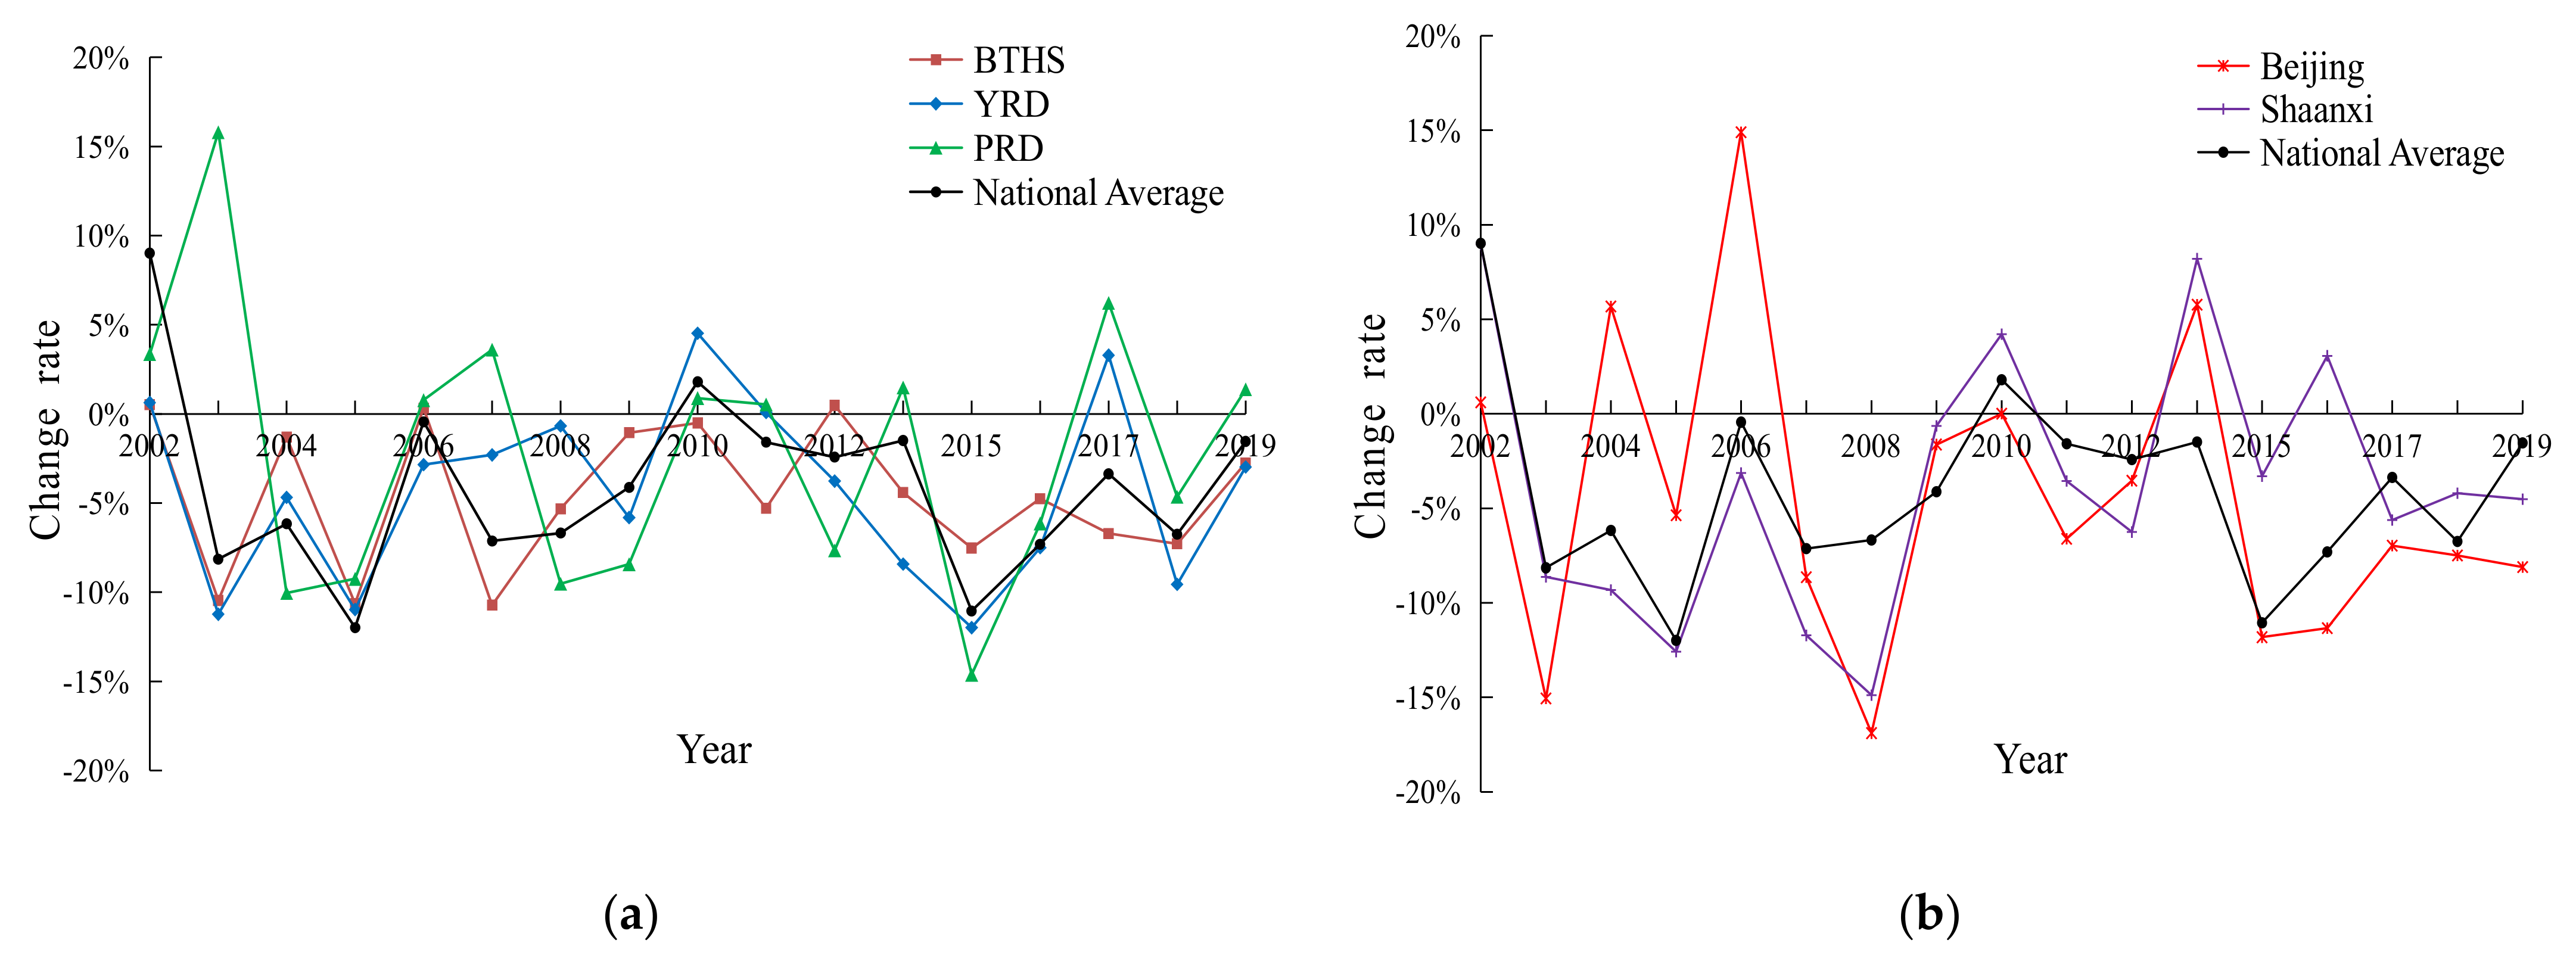
3.3. Analysis of the Decoupling of Economic Growth from PM10 Concentration

3.3.1. Evolution of PM10 Concentration

From 2001 to 2019, the overall PM10 concentration in China showed a steady downward trend, falling by a total of 44.2%. From 2003 to 2005, there was a significant decline, with decrease rates of 12.0% and 11.1% in 2005 and 2015, respectively (Figure 7a). Between 2001 and 2019, the PM10 concentration decreased by 33.6%, 46.7%, and 27.9% in the BTHS, YRD, and PRD regions, respectively. From 2002 to 2017, there was generally a steady decline in all three regions. From 2018 to 2019, the concentration continued to decline in the BTHS and YRD regions, while in the PRD region, it first declined and then rose. For the typical provinces (Figure 7b), the PM10 concentration in Beijing dropped sharply from 2014 to 2019, except for a rebound in 2014 due to frequent sandstorms and a dry climate [37]; meanwhile, in Shaanxi, there was a rising trend from 2014 to 2016 and a falling trend from 2017 to 2019. In Shaanxi, there was a decline of 4.5% in 2019, which was lower than the national annual average over 2014–2019, besides 2017.

3.3.2. Decoupling Analysis

The decoupling coefficients between PM10 pollution and GDP as well as GDP per capita in China’s key regions and typical provinces from 2002 to 2019 are shown in Figure 8. The change trends of the decoupling coefficients between PM10 concentration and GDP as well as GDP per capita are basically the same. In the following, GDP per capita is taken as an example. The following characteristics were observed: First, from a nationwide perspective, China has a good level of decoupling between PM10 pollution and economic development. Except for 2002 and 2010, strong decoupling years accounted for 88.9% of years from 2001 to 2019. Decoupling improved from 2014 to 2019. Before 2014, the decoupling coefficient did not fall below −0.9; however, it dropped significantly from 2014 to 2019, with the lowest value of −1.55 occurring in 2015. Second, the following was found for the key regions (Figure 8c): (1) Decoupling was very good between 2002 and 2019. Except for the PRD in 2003 and 2017, which showed expansive negative decoupling, all years and regions had either strong or weak decoupling, and after 2014, the decoupling was strong in the BTHS. (2) Decoupling improved in all three regions between 2014 and 2019. In all regions, the mean value of the decoupling coefficient between 2014 and 2019 was lower than that between 2002 and 2012. The decoupling coefficient reached its lowest value in 2018, 2015, and 2015 in BTHS (−1.20), YRD (−1.57), and PRD (−2.17), respectively. (3) From 2014 to 2019, the decoupling coefficients in the BTHS and YRD regions were lower than the national average and that in the PRD. From 2014 to 2019, the average decoupling coefficients in the BTHS, YRD, and PRD regions and the whole country, were −0.85, −0.89, −0.42, and −0.79, respectively. Similar to the case of SO2, the PRD’s decoupling coefficient was higher than those of the two other regions from 2017 to 2019, thus increasing its average level from 2014 to 2019. Third, for the typical provinces (Figure 8d), except for 2014, Beijing’s decoupling coefficients were lower than the national average from 2014 to 2019. Shaanxi’s decoupling improved significantly from 2017 to 2019, with the decoupling coefficient decreasing considerably during this time; in 2019, it maintained a downward trend despite the overall rebound in the whole of China, reaching a minimum of −0.80. Between 2014 and 2019, it was lower than the national average (−0.27), besides 2017.

3.3.3. Trend Analysis

According to the regression analysis between PM10 concentration and GDP per capita in the three key regions from 2001 to 2019 (Figure 9), the R2 values of the fitting curves between PM10 concentration and GDP per capita in the YRD and PRD regions are both more than 0.7, showing a strong correlation. However, the R2 value in the BTHS region is only 0.25, indicating a weak correlation. With increasing GDP, the PM10 concentration in the three key regions generally showed a steady downward trend. This result suggests that, in recent years, PM10 pollution in the key regions has gradually reduced alongside economic growth, which is mutually confirmed by the results of the decoupling analysis.

3.4. Analysis of the Decoupling of Economic Growth from NO2 Concentration

3.4.1. Evolution of NO2 Concentration

From 2001 to 2019, the concentration of NO2 in China experienced an overall slow decline with fluctuation, decreasing by 9.2%. From 2002 to 2012, there was no noticeable change trend, with the total change being below 4.1%. From 2014 to 2019, the variation was slightly larger than that in the previous years. Meanwhile, for the key regions (Figure 10a), the concentration of NO2 did not change remarkably between 2001 and 2019, with a total decrease of 5.2%, 1.2%, and 5.7% in the BTHS, YRD, and PRD regions, respectively. For the typical provinces (Figure 10b), the concentration of NO2 in Beijing had a clear downward trend between 2001 and 2019, decreasing by 47.9%, with the largest annual decline of 25.5% occurring in 2008. The NO2 concentration in Shaanxi fluctuated within a narrow range, with the magnitude of the fluctuation increasing in 2014–2017 and decreasing significantly in 2018–2019. In 2019, the concentration of NO2 in Shaanxi maintained a downward trend despite the overall rebound in the BTHS region, with a year-on-year decrease of 3.0%, which was the first time that Shaanxi’s NO2 concentration fell below the national average during 2012–2019.

3.4.2. Decoupling Analysis

The decoupling coefficients between NO2 concentration and GDP as well as GDP per capita in China’s key regions and typical provinces from 2002 to 2019 are shown in Figure 11. The change trends of the decoupling coefficients between NO2 concentration and GDP as well as GDP per capita are basically the same. In the following, GDP per capita is taken as an example. The following characteristics were observed: First, from a nationwide perspective, China has a good level of decoupling between NO2 pollution and economic development. Between 2002 and 2019, the decoupling was either strong or weak, with strong decoupling accounting for 66.7% of years. However, there was no sign of improvement between 2014 and 2019, as 50% of the years did not reach strong decoupling during this period, with the decoupling coefficients of 2017 and 2019 being the highest ever. Second, for the key regions (Figure 11c), the following was observed: (1) Overall, the decoupling was good between 2002 and 2019. Except for the YRD and PRD, which showed expansive negative decoupling in 2003, 2010, and 2017, the other years and regions experienced either strong or weak decoupling; strong decoupling accounted for about two-thirds of the total years (note that this proportion was not as high as for SO2 and PM10). (2) No significant improvement in decoupling occurred between 2014 and 2019. During this period, the three key regions failed to achieve strong decoupling in 50% of the years, and the maximum difference in the average decoupling coefficient was 0.15 from 2002 to 2012. (3) From 2014 to 2019, the decoupling in the BTHS and YRD regions was slightly better than that of the PRD as well as the national average. Meanwhile, the average decoupling coefficients in the BTHS, YRD, and PRD regions and the whole country, were −0.23, −0.11, −0.05, and −0.16, respectively. Third, for the typical provinces (Figure 11d), from 2014 to 2019, Beijing’s decoupling coefficient was lower than the national average, except that it was affected by the rebound of NO2 concentration in 2014. From 2018 to 2019, there was a marked improvement in the decoupling in Shaanxi, with a year-on-year decline of −0.53 in 2018, the largest decrease observed in the period 2002–2019. The decoupling coefficient remained negative in 2019, when the national average decoupling coefficient rebounded; in this year, Shaanxi’s decoupling coefficient was below the national average for the first time in 2014–2019.

3.4.3. Trend Analysis

According to the regression analysis between NO2 concentration and GDP per capita in the three key regions from 2001 to 2019 (Figure 12), the R2 value of the fitting curve between NO2 concentration and GDP per capita in the PRD is larger than 0.5, showing a strong correlation. However, the R2 values in the YRD and BTHS regions are both less than 0.1, showing no correlation. This shows that, in recent years, NO2 pollution in the YRD and BTHS regions has not been reduced alongside economic growth, which confirms that NO2 pollution is a prominent shortcoming associated with economic development in the key regions.

4. Discussion

4.1. Impact of China’s Environmental Policy on the Decoupling between Economic Growth and Air Pollution

China’s SO2 and PM10 emissions mainly come from coal-based fossil fuel and biomass combustion, with coal-fired power stations and energy-intensive industries contributing the most [9,38,39]. NO2 emissions mainly come from NOx produced by fossil fuels, high-temperature biomass combustion, and automobile exhaust [40,41,42]. Since the beginning of the 21st century, China has issued several national environmental protection plans, air pollution prevention plans, and control plans. Some important measures have been carried out, including the control of SO2 and soot emission from coal-fired power stations and steel and nonferrous metal smelting industries and the elimination of energy-intensive and high-emission industries, thus significantly reducing pollutant emissions and promoting the sustained improvement of air quality [43]. From 2001 to 2019, year-on-year declines in SO2, PM10, and NO2 concentrations occurred in 17 years, 16 years, and 12 years, respectively, accounting for 89.4%, 88.9%, and 66.7% of years, respectively. Since 2012, China has made a strategic decision to promote the construction of an “ecological civilization”, which has provided both the central government and local governments with stronger will, clearer objectives, better legislation, and more incentive measures and enforced stricter actions to improve air quality. In 2018, the National Conference of Ecological Environment Protection put forward the idea that “clear waters and green mountains are as good as mountains of gold and silver”, which provides ideological guidance for atmospheric control. The essence of “clear waters and green mountains are as good as mountains of gold and silver” is to realize the coordination of economic growth and environmental protection. Guided by this new development concept and the strategy of promoting ecological civilization construction, in 2013, the State Council of the People’s Republic of China for the first time promulgated a national air pollution prevention and control policy, namely, the Action Plan. This changed the status quo in which the former State Environmental Protection Administration of the People’s Republic of China was the only department in charge of air pollution prevention and control [44,45]. The same applies to the Three-Year Action Plan promulgated in 2018. Both policies comprehensively address key industries such as coal-fired power stations and highly polluting and energy-consuming enterprises such as iron and steel, civil bulk coal, and coal-fired boilers, promoting the optimization and adjustment of the structure of industry, energy, transportation, and land-use at the national level.
The measures set out in the Action Plan and the Three-Year Action Plan have achieved remarkable results. Compared with 2013, China’s SO2, PM10, and NOx emissions in 2017 were lower by 59%, 36%, and 21%, respectively, indicating a significant improvement in air quality [36]. In 2019, the concentration of SO2 in China was equivalent to that in developed countries such as Europe and the United States, with a decrease of nearly two-thirds compared with 2013, while the concentration of PM10 was lower by nearly 30% compared with that in 2013 [45]. Since 2000, China’s air quality has continued to improve, and its economy has not been affected by the increasing investment in air pollution control or the strengthening of the management and control of industrial enterprises. During the same period, China has maintained strong economic growth, with GDP and GDP per capita rising year by year, which has promoted the decoupling between air pollution and economic development in the country. The analysis performed in this study showed that the concentrations of SO2 and PM10 have both reduced alongside economic growth in recent years, showing a good state of decoupling. This has prompted a significant optimization of the decoupling between air pollution and economic development in China. From 2001 to 2019, the years with strong decoupling between SO2, PM10, and NO2 pollution and economic development accounted for 89.4%, 88.9%, and 66.7% of years, respectively, indicating a good relationship between economic development and environmental protection.
Previous quantitative research on air pollution prevention and control policies across the Taiwan Strait showed that the Action Plan and the Three-Year Action Plan have resulted in a significant decline of PM2.5 concentrations. These policies have mainly focused on enhancing energy-saving and emission-reduction approaches and intensifying the optimization and adjustment of industrial and energy systems to promote low-emission development in China. Aside from controls for industries with high energy consumption and high pollution, the elimination of backward production capacity, and coal consumption control, the Three-Year Action Plan also emphasized the development of green industries and set goals for the proportion of low-carbon and efficient energy consumption [46]. Therefore, we believe that the environmental policies that have been implemented in China over the past 20 years, and especially the strategic decision to promote ecological civilization construction, have strongly and continuously promoted the decoupling of economic development from air pollution. Such changes demonstrate that China’s environmental policy allows the continuous improvement of its citizens’ living standards brought about by economic development while realizing the gradual improvement of the environment, especially air quality. Meanwhile, some empirical studies have shown that environmental degradation has a significant negative impact on economic growth, which supports the findings of the present study [2].
It is also important to note that China faces great pressure to achieve steady economic growth and sustained improvement in air quality due to the COVID-19 pandemic and the complicated domestic and international situations that this has created. We suggest that the Chinese government should promote ecological civilization construction, continue to promote the concept that “clear waters and green mountains are as good as mountains of gold and silver”, and adhere to the new concept of green development. Additionally, we suggest that the Chinese government formulate and implement an air governance policy at the national level and that a new action plan for the prevention and control of air pollution be issued to promote sustained improvement in air quality and balance economic development and ecological environment protection.

4.2. Impact of the Selection of Key Regions on Regional Decoupling

The results of this paper indicate that, from 2014 to 2019, the decoupling of economic development from air pollution in the BTHS and YRD was better than the national average. From 2014 to 2019, in the BTHS and YRD, the decoupling coefficients between SO2 pollution and GDP per capita were, respectively, 0.55 and 0.21 lower than the national average, and the decoupling coefficients between PM10 and GDP per capita were, respectively, 0.04 and 0.10 lower than the national average. In 2018, China adjusted the key regions of air pollution control by excluding the PRD and adding several cities in Shaanxi within the Fen–Wei Plain key regions. This adjustment had a direct impact on the regional decoupling between economic development and air pollution: First, the decoupling in the PRD after 2017 was significantly worse than the national average. From 2018 to 2019, the average decoupling coefficients between SO2 and PM10 and economic growth were 1.36 and 0.39 higher than the national average, respectively. Second, from 2018 to 2019, the decoupling in Shaanxi improved significantly and was remarkably better than the national average level. In 2019, the decoupling coefficients between SO2 and NO2 pollution and GDP per capita were the lowest since 2014 (−4.41) and the second-lowest since 2014 (−0.52), while the decoupling coefficient for PM10 was the lowest since 2014 (−0.80), which were all lower than the national average.
The above results can be attributed to the fact that the Three-Year Action Plan and the Action Plan have different priorities for the goals and policies in the key regions. As mentioned above, the Action Plan is the first comprehensive plan for the prevention and control of air pollution promoted at the national level and places a high priority on the three key regions (the BTHS, YRD, and PRD regions) and formulating more stringent targets and measures [9,44]. Furthermore, preferences are given to the key regions regarding science and technology, capacity funding, and capacity building. For instance, the National Joint Research Center for Tackling Key Problems in Air Pollution Control was established in 2017. This research center organized nearly 2000 scientists and first-line researchers to carry out concentrated research on the causes and control of heavy air pollution in the BTHS region and set up a team of experts to carry out a “customized strategy for each city” campaign and offer technical guidance, which expanded to Xi’an, Xianyang, and other cities in the Fen–Wei Plain in 2018. Since 2017, the central government has invested more than 20 billion yuan to support key regional cities in carrying out clean heating campaigns in winter and took the lead in launching a national atmospheric photochemical monitoring network in the BTH, YRD, and other regions in 2018 [45,47]. Moreover, since 2017, China has conducted intensified supervision in key regions to organize, urge, and guide local governments to rectify major environmental problems. The abovementioned measures have played a key role in reducing the air pollutants in the key regions, which has been better than the national average reduction. In 2020, the decline rate of aerosol optical depth (AOD) and the atmospheric SO2 and NO2 columns in the BTH, YRD, and PRD regions were all higher than the national average in 2015, according to satellite remote sensing data, which are consistent with data from the national ambient air quality monitoring network [48]. Xi et al. found that the decoupling between industrial development and air pollutant emissions in the Beijing–Tianjin–Hebei region is better than that in central and southern Liaoning (which is a non-key region) [26]. Therefore, we believe that China’s implementation of stricter management and effective measures through the designation of priority areas for air pollution control will significantly improve the coordination between air pollution and regional economic development.
In future research, it is suggested that the planning of a new air pollution control action plan should involve the comprehensive analysis of the current general air pollution situation and a scientific delimitation of the key regions of air pollution control. Additionally, the central government should also strengthen supervision and support for non-key regions and provide policy guidance and financial and technical support. For example, it could extend the “customized strategy for each city” campaign to cities in non-key regions, strengthen scientific and technological support for air pollution control, guide and promote the improvement of urban air quality in non-key regions, and simultaneously optimize the decoupling of economic development from air pollution.

4.3. Analysis of the Causes of Insignificant Improvement of NO2 Decoupling

The results of this paper suggest that, from 2014 to 2019, the decoupling of economic development from NO2 pollution was not significantly improved, unlike the decoupling of economic development from SO2 and PM10 concentrations. We believe that this is due to the fact that the NO2 concentration in China did not decrease significantly from 2001 to 2019. During this period, China made great efforts to reduce NOx emissions through measures such as the ultralow-emission retrofitting of thermal power stations and the steel industry, the comprehensive renovation of coal-fired boilers, and emission control of mobile sources. However, NOx emissions are related to every aspect of residential living and production, which makes the reduction of NOx difficult and costly [44]. Many studies have shown that the most significant contribution to the reduction of NOx emissions in China in recent years has come from industrial enterprises. Due to the rapid growth of motor vehicle numbers and other factors, the effect of NOx emission reduction from mobile sources is not significant. Between 2015 and 2020, NOx emissions in China decreased by 16%; however, this reduction was much less than that in SO2 [9,36,48,49]. The success of NOx control in Beijing is instructive of how to improve the decoupling between NO2 pollution and economic development. Since 1998, Beijing has taken the lead in China to regulate motor vehicle emissions by formulating and implementing more stringent local standards for motor vehicle emissions and oil quality than the national average, the elimination of old vehicles, and the vigorous promotion of new energy vehicles. These actions have effectively reduced vehicle exhaust pollution and significantly reduced total NOx emissions. In the past 20 years, the total amount of pollutants from various mobile sources, including NOx, has decreased dramatically in Beijing, although the number of motor vehicles has increased threefold. Between 1998 and 2017, the amount of NOx emitted by motor vehicles in Beijing decreased by 55%, resulting in a 37.8% reduction in NO2 concentration during the same period [44,50,51]. Thus, a significant improvement was made in the decoupling of economic development from NO2 pollution. Since Beijing has maintained a GDP per capita growth rate of over 5.0% since 2011 except for 2014, it has achieved a strong decoupling between NO2 pollution and economic development.
Additionally, this study showed that Beijing’s decoupling coefficient between NO2 pollution and GDP per capita reached −7.86 in 2008, which is the lowest decoupling coefficient in any year among the studied regions. In the same year, Beijing’s decoupling coefficients between SO2 and PM10 and GDP per capita experienced a similar abrupt sharp drop. This phenomenon may be due to the fact that Beijing’s GDP per capita growth rate slowed down in 2008, accompanied by a sharp drop in the concentration of air pollutants. These changes can be attributed to the fact that Beijing hosted the Olympic Games in 2008: First, many Olympic investment projects launched before 2008 exerted a huge depressing effect on the economy. In 2008, the Olympic-related projects under construction were completed or coming to an end, which had little impact on the GDP growth. This, in combination with factors such as sudden and severe natural disasters in China, caused Beijing’s GDP growth to slow in 2008 [52,53]. Second, the Olympic Games attracted much foreign labor, which promoted population growth in Beijing. In 2008, Beijing’s resident population grew by 5.7%—the highest yearly increase ever recorded—which dragged down the GDP per capita growth. Third, to control air pollution before the Olympic Games, Beijing had implemented enhanced control measures such as vehicle traffic restrictions, resulting in a significant year-on-year reduction in the concentrations of various pollutants during 2008; for example, the NO2 concentration declined by 25.5% in that year, the highest yearly drop ever recorded. Additionally, an assessment performed by the United Nations Environment Programme showed that temporary motor vehicle control measures taken during the Olympics resulted in a 46% reduction in NOx emissions compared to the baseline [54].
Therefore, we believe that the control of motor vehicle emissions directly determines the effectiveness of NOx emission reduction and NO2 pollution control. In the future, China should focus on mobile sources such as motor vehicles and vessels, vigorously promulgate efforts to reduce NOx emissions, continue to deepen the adjustment of the traffic and transportation structure, promote the “Railway Transition” (the transfer of highway transport to railway transport), improve emission standards for motor vehicles and vessels, strengthen the supervision of motor vehicle and vessel exhausts, promote new-energy vehicles and vessels, and improve rail transportation and the electrification and cleanliness of transportation.

5. Conclusions and Policy Recommendations

This paper focuses on regions of China where the contradiction between the environment and economic growth is most prominent. Using nearly 20 years of environmental air quality monitoring data, it systematically and comprehensively assesses the relationship between air pollution and economic development in key regions of air pollution control and summarizes the experience in air pollution prevention and control. Thus, it provides a scientific basis for China and other developing countries to coordinate high-quality economic development and the high-level protection of the ecological environment. In the 21st century, China has implemented several state-level air pollution control policies and taken effective measures to reduce air pollutant emissions. Thus, China has achieved sustained improvement in air quality while maintaining rapid economic growth, and the relationship between air pollution (SO2, PM10, and NO2) and economic growth has been fully decoupled. Since 2012, the country has made the strategic decision to promote the construction of an “ecological civilization”, which has changed the old status quo of “treatment after pollution” and opened a new development path of prioritizing ecological conservation and boosting green development. Economic development and environmental protection have been taken into account at the national level, and efforts have been made to promote economic transformation and high-quality development through pollution control. In this context, China has promulgated the Action Plan and the Three-Year Action Plan to promote the decoupling of SO2 and PM10 pollution from economic growth across the country. In these two plans, the state focuses on key regions of atmospheric governance (the BTHS, YRD, and PRD regions) and gives strong support in areas such as science and technology, capacity funding, capacity building, and supervision, and consequently, the decoupling of economic growth from air pollution in these key regions are more optimized than that in other regions. Although the overall decoupling of economic development from air pollution in China is good, it is worth noting that the decoupling of economic growth from NO2 pollution has not improved significantly in recent years due to the limited effectiveness of NOx emission reduction from mobile sources (e.g., motor vehicles), which has become a shortcoming in China’s plan to achieve a comprehensive decoupling of economic development from air pollution.
In addition, this paper puts forward the following suggestions: First, China and other developing countries should change from the development path of “pollution first, control later” and turn to a sustainable development path of “prioritizing ecological conservation and boosting green development”. They should also intensify the optimization and adjustment of industry, energy, and transportation; eliminate backward production capacity; and promote the use of renewable energy instead of fossil energy. Second, national-level air pollution prevention and control policies with legal force and executive force should be formulated in China and other developing countries, focusing on geographical areas where air pollution problems are most prominent with more stringent goals and measures. Moreover, support for technology, capital, and capacity building should be increased. The vigorous improvement of regional air quality could set a demonstrative example that could be followed by other areas. Third, it is recommended to strengthen the control of motor vehicle pollution by steadily improving the quality of motor oil, accelerating the elimination of old vehicles, and improving motor vehicle emission standards. Additionally, new-energy vehicles should be vigorously promoted, and efforts should be made to reduce NOx emissions and promote the steady decline of NO2 concentration.

Author Contributions

Conceptualization, J.L.; methodology, J.L.; resources, J.L.; data curation, J.L.; writing—original draft preparation, J.L.; writing—review and editing, J.L., L.H., L.W., and L.T.; supervision, L.T.; funding acquisition, L.T. All authors have read and agreed to the published version of the manuscript.

Funding

This research was funded by the National Key R&D Plan (2016YFC0502902).

Data Availability Statement

In this study, the data of population and GDP were obtained from the official website of the National Bureau of Statistics of China. The concentration data of SO2, PM10, and NO2 were acquired from the Ministry of Ecology and Environment of the People’s Republic of China.

Acknowledgments

The authors kindly thank all the stakeholders who actively participated in the data collection and validation throughout this study. They also offer special thanks to the Ministry of Ecology and Environment of the People’s Republic of China for assisting in data collection.

Conflicts of Interest

The authors declare no conflict of interest.

References

  1. Sun, D.Q.; Zhang, J.X.; Hu, Y.; Jiang, J.L.; Zhou, L. Spatial analysis of China’s eco-environmental quality: 1990–2010. J. Geogr. Sci. 2013, 23, 695–709. [Google Scholar] [CrossRef]
  2. Azam, M. Does environmental degradation shackle economic growth? A panel data investigation on 11 Asian countries. Renew. Sustain. Energy Rev. 2016, 65, 175–182. [Google Scholar] [CrossRef]
  3. Etokakpan, M.U.; Akadiri, S.S.; Alola, A.A. Natural gas consumption-economic output and environmental sustainability target in China: An N-shaped hypothesis inference. Environ. Sci. Pollut. Res. 2021, 1–13. [Google Scholar] [CrossRef]
  4. Akadiri, S.S.; Alola, A.A.; Bekun, F.V.; Etokakpan, M.U. Does electricity consumption and globalization increase pollutant emissions? Implications for environmental sustainability target for China. Environ. Sci. Pollut. Res. 2020, 27, 25450–25460. [Google Scholar] [CrossRef] [PubMed]
  5. Taghizadeh-Hesary, F.; Rasoulinezhad, E.; Yoshino, N.; Chang, Y.; Taghizadeh-Hesary, F.; Morgan, P.J. The energy–pollution–health nexus: A panel data analysis of low- and middle-income Asian countries. Singap. Econ. Rev. 2020, 66, 435–455. [Google Scholar] [CrossRef]
  6. Taghizadeh-Hesary, F.; Taghizadeh-Hesary, F. The impacts of air pollution on health and economy in Southeast Asia. Energies 2020, 13, 1812. [Google Scholar] [CrossRef] [Green Version]
  7. Ministry of Ecology and Environment. Report on the State of the Ecology and Environment in China 2019. Available online: http://english.mee.gov.cn/Resources/Reports/ (accessed on 23 September 2020).
  8. The State Council. The Action Plan for the Prevention and Control of Air Pollution; The State Council: Beijing, China, 2013.
  9. Feng, Y.Y.; Ning, M.; Lei, Y.; Sun, Y.M.; Liu, W.; Wang, J.N. Defending blue sky in China: Effectiveness of the “Air Pollution Prevention and Control Action Plan” on air quality improvements from 2013 to 2017. J. Environ. Manag. 2019, 252, 109603. [Google Scholar] [CrossRef]
  10. The State Council. The Three-Year Action Plan to Beat Air Pollution; The State Council: Beijing, China, 2018.
  11. Hao, D.H.; Li, C.X.; Li, G.Z. Decoupling analysis of economic growth and carbon emissions in Hebei province. Appl. Mech. Mater. 2014, 448, 4520–4523. [Google Scholar] [CrossRef]
  12. Dong, B.; Zhang, M.; Mu, H.; Su, X. Study on decoupling analysis between energy consumption and economic growth in Liaoning province. Energy Policy 2016, 97, 414–420. [Google Scholar] [CrossRef]
  13. OECD. Indicators to Measure Decoupling of Environmental Pressure from Economic Growth; OECD: Paris, France, 2002. [Google Scholar]
  14. Chen, J.; Wang, P.; Cui, L.; Huang, S. Song M. Decomposition and decoupling analysis of CO2 emissions in OECD. Appl. Energy 2018, 231, 937–950. [Google Scholar] [CrossRef]
  15. Tapio, P. Towards a theory of decoupling: Degrees of decoupling in the EU and the case of road traffic in Finland between 1970 and 2001. Transp. Policy 2005, 12, 137–151. [Google Scholar] [CrossRef] [Green Version]
  16. Wang, Q.; Jiang, R. Is China’s economic growth decoupled from carbon emissions? J. Clean. Prod. 2019, 225, 1194–1208. [Google Scholar] [CrossRef]
  17. Cohen, G.; Jalles, J.; Loungani, P.; Marto, R.; Wang, G. Decoupling of emissions and GDP: Evidence from aggregate and provincial Chinese data. Energy Econ. 2019, 77, 105–118. [Google Scholar] [CrossRef] [Green Version]
  18. Wang, H.; Hashimoto, S.; Yue, Q.; Yue, Q.; Moriguchi, Y.; Lu, Z.W. Decoupling analysis of four selected countries. J. Ind. Ecol. 2013, 17, 618–629. [Google Scholar] [CrossRef]
  19. Wang, Q.; Zhao, M.; Li, R. Decoupling sectoral economic output from carbon emissions on city level: A comparative study of Beijing and Shanghai, China. J. Clean. Prod. 2019, 209, 126–133. [Google Scholar] [CrossRef]
  20. Wang, Z.Y. The empirical study on the relationship between energy consumption, carbon emissions and economic growth in Beijing- Tianjin- Hebei. J. Ind. Technol. Econ. 2017, 36, 82–92. [Google Scholar] [CrossRef]
  21. Yu, Y.D.; Chen, D.J.; Zhu, B.; Hu, S.Y. Eco-efficiency trends in China, 1978–2010: Decoupling environmental pressure from economic growth. Ecol. Indic. 2013, 24, 177–184. [Google Scholar] [CrossRef]
  22. Lai, W.W.; Hu, Q.L.; Zhou, Q. Decomposition analysis of PM2.5 emissions based on LMDI and Tapio decoupling model: Study of Hunan and Guangdong. Environ. Sci. Pollut. Res. 2021. [Google Scholar] [CrossRef]
  23. Ji, S.P.; Lv, W.D.; Meng, L.; Yang, X.J.; Yang, H.J.; Chuan, Y.M.; Chen, H.Y.; Tasawar, H.; Ahmed, A.; Bashir, A. Decoupling environmental pressures from economic growth based on emissions monetization: Case in Yunnan, China. J. Clean. Prod. 2019, 208, 1563–1576. [Google Scholar] [CrossRef]
  24. Wang, Z.; Zhao, L.; Mao, G.Z.; Wu, B. Eco-Efficiency trends and decoupling analysis of environmental pressures in Tianjin, China. Sustainability 2015, 7, 15407–15422. [Google Scholar] [CrossRef] [Green Version]
  25. Xu, H.F.; Fang, Y.P.; Liu, Y.W. Decoupling analysis of environmental pressure and economic development: A case of the industrial system in Panzhihua. In Proceedings of the IEEE 2011 International Conference on Electronics, Communications and Control (ICECC), Ningbo, China, 1 September 2011. [Google Scholar] [CrossRef]
  26. Xi, Y.; Yan, D.; Zhang, J.; Fu, X. Decoupling analysis of the industrial growth and environmental pollution in the Circum-Bohai-Sea region in China. Environ. Sci. Pollut. Res. 2021, 28, 19079–19093. [Google Scholar] [CrossRef] [PubMed]
  27. Wang, Y.; Lai, N.; Mao, G.; Zuo, J.; Crittenden, J.; Jin, Y.; Moreno-Cruz, J. Air pollutant emissions from economic sectors in China: A linkage analysis. Ecol. Indic. 2017, 77, 250–260. [Google Scholar] [CrossRef] [Green Version]
  28. Zhang, X.; Geng, Y.; Shao, S.; Song, X.; Fan, M.; Yang, L.; Song, J. Decoupling PM2.5 emissions and economic growth in China over 1998–2016: A regional investment perspective. Sci. Total. Environ. 2020, 714, 136841. [Google Scholar] [CrossRef]
  29. Shi, Y.B.; Zhao, X.X.; Jang, C.L.; Chang, C.P. Decoupling effect between economic development and environmental pollution: A spatial-temporal investigation using 31 provinces in China. Energy Environ. 2019, 30, 755–775. [Google Scholar] [CrossRef]
  30. Qian, Y.; Cao, H. Decoupling and decomposition analysis of industrial sulfur dioxide emissions from the industrial economy in 30 Chinese provinces. J. Environ. Manag. 2020, 260, 110142. [Google Scholar] [CrossRef] [PubMed]
  31. Yu, Y.D.; Zhou, L.; Zhou, W.J.; Ren, H.T.; Kharrazi, A.; Ma, T.J.; Zhu, B. Decoupling environmental pressure from economic growth on city level: The case study of Chongqing in China. Ecol. Indic. 2017, 75, 27–35. [Google Scholar] [CrossRef]
  32. Fang, D.B.; Yu, B.L. Driving mechanism and decoupling effect of PM2.5 emissions: Empirical evidence from China’s industrial sector. Energy Policy 2020, 149, 112017. [Google Scholar] [CrossRef]
  33. Xia, H.H.; Ding, L.; Yang, S.W.; Wu, A.P. Socioeconomic factors of industrial air pollutants in Zhejiang Province, China: Decoupling and Decomposition analysis. Environ. Sci. Pollut. Res. 2020, 27, 28247–28266. [Google Scholar] [CrossRef]
  34. National Bureau of Statistics of China. China Statistical Yearbook 2019; China Statistics Press: Beijing, China, 2019.
  35. Ministry of Housing and Urban-Rural Development. Urban Construction Statistical Yearbook. Available online: http://www.mohurd.gov.cn/xytj/tjzljsxytjgb/jstjnj/ (accessed on 11 April 2021).
  36. Zheng, B.; Tong, D.; Meng, L.; Liu, F.; Hong, C.P.; Geng, G.N.; Li, H.Y.; Li, X.; Peng, L.Q.; Qi, J.; et al. Trends in China’s anthropogenic emissions since 2010 as the consequence of clean air actions. Atmos. Chem. Phys. 2018, 18, 14095–14111. [Google Scholar] [CrossRef] [Green Version]
  37. Xinhua News Agency. Beijing: In 2014, the Annual Average Concentration of PM2.5 Decreased by 4.0% Year-on-year, But Dust Pollution Rebounded. Available online: http://www.gov.cn/xinwen/2015-01/04/content_2799777.htm (accessed on 23 September 2020).
  38. Chen, W.Y.; Xu, R.N. Clean coal technology development in China. Energy Policy 2010, 38, 2123–2130. [Google Scholar] [CrossRef]
  39. He, K. Multi-resolution Emission Inventory for China (MEIC): Model Framework and 1990–2010 Anthropogenic Emissions. In Proceedings of the AGU Fall Meeting, San Francisco, CA, USA, 3 December 2012. [Google Scholar]
  40. Fu, M.; Liu, H.; Jin, X.; He, K. National-to port-level inventories of shipping emissions in China. Environ. Res. Lett. 2017, 12, 114024. [Google Scholar] [CrossRef]
  41. Liu, F.; Beirle, S.; Zhang, Q.; van der A, R.J.; Zheng, B.; Tong, D.; He, K. NOx emission trends over Chinese cities estimated from OMI observations during 2005 to 2015. Atmos. Chem. Phys. 2017, 17, 9261–9275. [Google Scholar] [CrossRef] [PubMed] [Green Version]
  42. Ding, J.; Van der A, R.J.; Mijling, B.; Jalkane, J.P.; Johansson, L.; Levelt, P.F. Maritime NOx emissions over Chinese Seas derived from satellite observations. Geophys. Res. Lett. 2018, 45, 2031–2037. [Google Scholar] [CrossRef] [Green Version]
  43. Chai, F. Review and prospect on the atmospheric pollution control in China. Environ. Sustain. Dev. 2020, 3, 5–13. [Google Scholar] [CrossRef]
  44. Lu, X.; Zhang, S.; Xing, J.; Wang, Y.; Chen, W.; Ding, D.; Wu, Y.; Wang, S.; Duan, L.; Hao, J. Progress of air pollution control in China and its challenges and opportunities in the ecological civilization era. Engineering 2020, 6, 1423–1431. [Google Scholar] [CrossRef]
  45. Ministry of Ecology and Environment. Beat Air Pollution: China Air Quality Improvement Report (2013–2018); Ministry of Ecology and Environment: Beijing, China, 2019. [Google Scholar]
  46. Wang, L.; Bi, J.; Meng, X.; Geng, G.; Huang, K.; Li, J.; Tang, L.; Liu, Y. Satellite-based assessment of the long-term efficacy of pm2.5 pollution control policies across the taiwan strait. Remote. Sens. Environ. 2020, 251, 112067. [Google Scholar] [CrossRef]
  47. Liu, S.J.; Chu, Y.X.; Hu, J.N. Clean air actions and air quality improvements—Beijing-Tianjin-Hebei and surrounding areas, China, 2013−2019. China CDC Wkly. 2020, 2, 418–421. [Google Scholar] [CrossRef]
  48. The Chinese Academy of Engineering. Final Evaluation Report on the Implementation of the Three-year Action Plan to Beat Air Pollution; The Chinese Academy of Engineering: Beijing, China, 2021. [Google Scholar]
  49. Zhang, Q.; Zheng, Y.X.; Tong, D.; Shao, M.; Wang, S.X.; Zhang, Y.H.; Xu, X.D.; Wang, J.N.; He, H.; Liu, W.Q.; et al. Drivers of improved PM2.5 air quality in China from 2013 to 2017. Proc. Natl. Acad. Sci. USA 2019, 116, 24463–24469. [Google Scholar] [CrossRef] [PubMed] [Green Version]
  50. UN Environment. A Review of 20 Years’ Air Pollution Control in Beijing; United Nations Environment Programme: Nairobi, Kenya, 2019. [Google Scholar]
  51. Wu, Y.; Zhang, S.; Hao, J.; Liu, H.; Wu, X.; Hu, J.; Liu, H.; Walsh, M.P.; Wallington, T.J.; Zhang, K.M.; et al. On-road vehicle emissions and their control in China: A review and outlook. Sci. Technol. 2017, 574, 332–349. [Google Scholar] [CrossRef] [PubMed] [Green Version]
  52. Chen, Q.S. Analysis of Olympic Economy-empirical analysis based on the Beijing Olympics. China Market 2019, 16, 31–32. [Google Scholar] [CrossRef]
  53. Xinhua News Agency. In the First Half of 2008, Beijing’s Economic Growth Rate Dropped by 1.1 Percentage Points Year-on-Year. Available online: http://www.gov.cn/jrzg/2008-07/21/content_1051443.htm (accessed on 23 September 2020).
  54. UN Environment. A Review of Air Pollution Control in Beijing (1998–2013); United Nations Environment Programme: Nairobi, Kenya, 2016. [Google Scholar]
Figure 1. A map showing the key regions for atmospheric governance in China. BTHS: the Beijing–Tianjin–Hebei region and surrounding areas, including the provinces of Beijing, Tianjin, Hebei, Shanxi, Henan, Shandong, and Shaanxi; YRD: the Yangtze River Delta region, including the cities/provinces of Shanghai, Jiangsu, Anhui, and Zhejiang; and PRD: the Pearl River Delta region.
Sustainability 13 06600 g001
Figure 2. The conceptual framework of this study.
Sustainability 13 06600 g002
Figure 3. The growth rates of (a) GDP and (b) GDP per capita in the key regions (BTHS, YRD, PRD) and typical provinces (Beijing, Shaanxi) of China, 2001–2019.
Sustainability 13 06600 g003
Figure 4. The variation trend of the average annual SO2 concentration in (a) the key regions and (b) the typical provinces of China, 2001–2019.
Sustainability 13 06600 g004
Figure 5. The decoupling coefficients between SO2 pollution and (a) GDP in key regions, (b) GDP in typical provinces, (c) GDP per capita in key regions, and (d) GDP per capita in typical provinces of China, 2001–2019.
Sustainability 13 06600 g005
Figure 6. The trend of SO2 concentration and GDP per capita in key regions of China, 2001–2019.
Sustainability 13 06600 g006
Figure 7. The variation trend of the annual average PM10 concentration in (a) key regions and (b) typical provinces of China, 2002–2019.
Sustainability 13 06600 g007
Figure 8. The decoupling coefficient between PM10 pollution and (a) GDP in key regions, (b) GDP in typical provinces, (c) GDP per capita in key regions, and (d) GDP per capita in typical provinces of China, 2002–2019.
Sustainability 13 06600 g008
Figure 9. The trend of PM10 concentration and GDP per capita in key regions of China, 2001–2019.
Sustainability 13 06600 g009
Figure 10. The variation trend of the average annual NO2 concentration in (a) key regions and (b) typical provinces of China, 2002–2019.
Sustainability 13 06600 g010
Figure 11. The decoupling coefficient between NO2 pollution and (a) GDP in key regions, (b) GDP in typical provinces, (c) GDP per capita in key regions, and (d) GDP per capita in typical provinces of China, 2002–2019.
Sustainability 13 06600 g011
Figure 12. The trend of NO2 concentration and GDP per capita in key regions of China, 2001–2019.
Sustainability 13 06600 g012
Table 1. The indicators that were used to assess the decoupling between economic growth and air pollution.
ParameterSelected IndicatorData SourceIndicator Description
Economic growthGDPAnnual GDP and population figures for 31 provinces, as acquired from the website of the National Bureau of Statistics of the People’s Republic of ChinaGDP was calculated at a constant price level, using 2000 as the base period, to counteract the effects of inflation
GDP per capita
Environmental pressure (air pollution level)Annual average concentration of SO2Ministry of Ecology and Environment of the People’s Republic of ChinaData for 2013 were excluded in this analysis due to changes in monitoring statistical norms
Average annual concentration of PM10
Average annual concentration of NO2
Table 2. The Tapio decoupling coefficients and classifications of types of decoupling.
QuadrantΔEt+1ΔGt+1Decoupling TypeDecoupling CoefficientMeaning
IV<0>0Strong decouplingT < 0GDP increases and emissions decrease
I>0>0Weak decoupling0 < T ≤ 0.8GDP increases and emissions increase
Expansive connection0.8 < T ≤ 1.2GDP increases and emissions increase at the same rate
Expansive negative decouplingT > 1.2GDP increases and emissions increase more than GDP
III<0<0Recessive decouplingT > 1.2GDP decreases and emissions decrease more than GDP
Recessive coupling0.8 < T ≤ 1.2GDP decreases and emissions decrease at the same rate
Weak negative decoupling0 < T ≤ 0.8GDP decreases and emissions decrease less than GDP
II>0<0Strong negative decouplingT < 0GDP decreases and emissions increase
Publisher’s Note: MDPI stays neutral with regard to jurisdictional claims in published maps and institutional affiliations.

