Abstract
In evaluating agricultural products, knowing the specific product varieties is important for the producer, the industrialist, and the consumer. Human labor is widely used in the classification of varieties. It is generally performed by visual examination of each sample by experts, which is very laborious and time-consuming with poor sensitivity. There is a need in commercial hazelnut production for a rapid, non-destructive and reliable variety classification in order to obtain quality nuts from the orchard to the consumer. In this study, a convolutional neural network, which is one of the deep learning methods, was preferred due to its success in computer vision. A total of 17 widely grown hazelnut varieties were classified. The proposed model was evaluated by comparing with pre-trained models. Accuracy, precision, recall, and F1-Score evaluation metrics were used to determine the performance of classifiers. It was found that the proposed model showed a better performance than pre-trained models in terms of performance evaluation criteria. The proposed model was found to produce 98.63% accuracy in the test set, including 510 images. This result has shown that the proposed model can be used practically in the classification of hazelnut varieties.
1. Introduction
The world’s most important hazelnut producer, Turkey, has 73% of the world’s hazelnut production areas with approximately 734.409 ha of hazelnut planting area. Turkey’s hazelnut production volume constitutes approximately 70% of world production [1]. Turkey exports 75% of the hazelnut produced. Product quality is an important determinant of hazelnut export, and it affects export revenues directly. The commercial importance of hazelnuts has increased the interest in variety standard and their characterization [2]. Characteristic features (Table 1) and a georeferenced map (Figure 1) of some hazelnut varieties grown in Turkey are presented [3].

Table 1.
Characteristic of some Turkish hazelnut varieties.
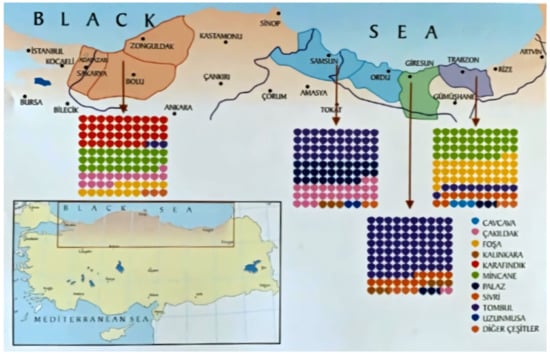
Figure 1.
The georeferenced map of the different Turkish hazelnut varieties [3].
It is essential to develop highly accurate, non-destructive, fast, and objective evaluation methods in post-harvest processes for safe production and marketing of agricultural products. Examinations and controls made by the human workforce are still used in large areas. For example, human labor is widely used in the separation and classification of hazelnut in hazelnut processing factories in our country. This method is highly time-consuming, tiring, tedious, low-sensitivity, and costly. For this reason, highly accurate, effective, non-invasive, and safe alternative methods should be developed to determine the varieties and quality of hazelnut.
Different methods have been put forward to classify the varieties of hazelnuts. Giraudo et al. automatically identified defective hazelnuts with multivariate analysis methods in RGB images and then used them to create classification models [4]. Solak and Altınısık succeeded in classifying hazelnut varieties using image processing and the mean-based, k-mean clustering technique [5]. Menesatti et al. demonstrated the potential use and effectiveness of shaped techniques to distinguish hazelnut varieties [6]. Güvenç et al. classified the partial shell-removed hazelnut kernel, shell removed, and rotten hazelnut kernels using a computer vision approach [7]. Koc et al. performed the classification of hazelnut types DL4J and ensemble learning algorithms [8]. DNA-based studies have also been carried out to classify hazelnuts, but this is laborious and expensive work [9,10]. No study on deep learning could be found in the classification of hazelnut varieties.
In this context, we come across many different practices in which artificial intelligence is used to process and evaluate data. The main difficulty in using artificial intelligence is solving tasks that people solve intuitively but are challenging to perform numerically [11,12,13,14]. Machine learning, which is a sub-branch of artificial intelligence, enables researchers to handle real problems numerically. Machine learning creates algorithms to recognize the patterns in data and make predictions accordingly [15,16,17]. Machine learning-based methods are applied in many areas, such as ecology, mining, urban planning, defense, space research, and especially agriculture [18,19,20]. Of these methods, deep learning is one of the most commonly used, and its most important feature is that it has the ability to learn relevant features from images automatically. Features can be learned in depth by different deep learning architectures, and they can be extracted as the input of classification models.
Moreover, deep learning is very effective for big data analysis [21,22,23,24,25,26,27]. In particular, the convolutional neural network (CNN), one of the deep learning models, has come to the forefront due to its success in computer vision in application areas. CNNs are a type of artificial neural network that use convolution processes in at least one of the layers [28].
One of the deep learning models, CNNs, includes several layers called convolutional, pooling and fully connected (Figure 2). The function of convolutional layers is feature extractions, while pooling layers function as compressors, and fully connected layers make the classification. Image features are extracted, and a convolutional layer learns representations of image features. Several filters are a given stride used to perform a 3-D convolution and produce feature maps from the input image. At the output of the layer, each feature map represents features extracted from locations of the input image with the help of one set of shared weights. A pooling layer is used to modify the output results of the convolutional layer. The low-level feature representation could be transformed into high-level feature representation, which is approximately invariant to small translations of the input by using pooling function, reducing the dimensionality of each feature map but retaining the essential information. The fully connected layer consists of the weights, biases, and neurons and connects the neurons between two different layers. These layers are usually placed before the output layer [29].
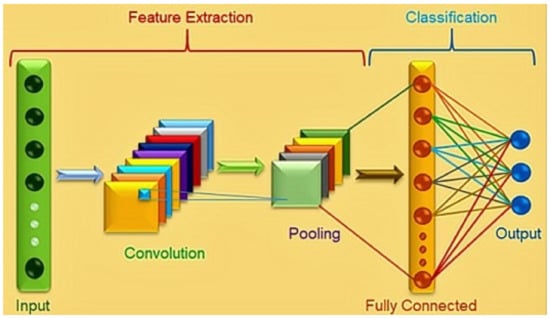
Figure 2.
Convolutional neural network structure.
The deep learning neural networks have shown a powerful and excellent performance on several agricultural applications, such as fruit classification [30], plant identification [31], crop classification [32], weed classification [33], quality evaluation [34], and field pest classification [35].
CNNs gained great popularity as an effective method for classifying images in many areas. Especially in agriculture, CNN-based approaches have been used for fruit classification. Torres et al. developed a CNN model which classified three apple and three peach varieties with 95.45% success [36]. Sakib et al. obtained two CNN models [37] for fruit classification using Fruits-360 data set [38]. Mureşan and Oltean presented the evaluation of a basic CNN model, AlexNet, and GoogLeNet models for fruit recognition [39]. Wang and Chen created a CNN model with eight layers, and they classified the 3600 images of 18 species of fruit with 95.67% success [40]. Zhu et al. used an AlexNet network model to classify vegetable images. The authors trained CNN models on different data sets by changing the number of vegetable images. The results of the classification showed that accuracy decreased as the number of images decreased. In addition, they compared the accuracy rates of the CNN-based method with the backpropagation neural network and support vector machine (SVM) classifier [41]. A six-layer CNN was designed by Lu et al. to classify fruit. The fruit dataset included 1800 images from 9 types of fruits taken by a digital camera. The proposed CNN model was compared with voting-based-SVM (VB-SVM), wavelet entropy (WE), and genetic algorithm (GA) [42]. A modified visual geometry group (VGG) model was used by Zeng [43] to classify vegetables and fruit. A bottom-up graph-based visual saliency model was used for fruit region segmentation, followed by a CNN model learning image for the classification task.
CNNs are very effective for classification and recognition, and they decrease errors in classification significantly [44]. Although CNNs have received much more attention than other machine learning algorithms, they have not been used in hazelnut researches, and not a single article using CNN has been reported on this topic.
The study area of our review is defined as the identification of fruit classification tasks to determine class according to the specific type.
Based on the attention CNNs have received in recent years and the fact that CNN has not been studied on hazelnuts before, we are presenting a review of the use of CNNs applied to the fruit imaging process, especially in the fields of classification and determination. In addition, our study is an example of practical application to be used in different samples by providing an approach to researchers about CNNs.
2. Materials and Methods
2.1. Dataset
Seventeen hazelnut varieties commonly grown in Turkey were used in our study (Figure 3). The hazelnuts were obtained from the Republic of Turkey Ministry of Agriculture and Forestry Hazelnut Research Institute. A camera with a resolution of 14.1 megapixels was used in taking the images. All images were taken from the same distance (20 cm) with a special setup. Light difference was taken into consideration while taking the images. Two hundred fifty images were taken for each variety. The images were obtained in two seasons as 2019 and 2020 to ensure variation.
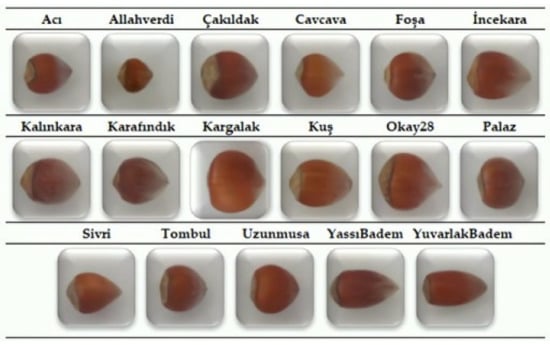
Figure 3.
Hazelnut varieties used in the study.
The data set includes a total of 4250 images. This data set was grouped into training, validation, and test sets. There were 3485 data in the training set, 255 data in the validation set, and 510 data in the test set (Table 2).
Table 2.
Hazelnut data set.
2.2. Convolutional Neural Networks
The five CNN models were used in the study to classify 17 hazelnut varieties. These models are Lprtnr1 and pre-trained (VGG16, VGG19, ResNet50, and InceptionV3) models. Lprtnr1 model and pre-trained models were compared.
A CNN model named Lprtnr1 was designed by the authors (Figure 4). The Lprtnr1 model consists of an input layer, four convolutional layers, a flattening layer, a fully connected layer, and an output layer. Codes of the Lprtnr1 model are given in Supplementary Materials.
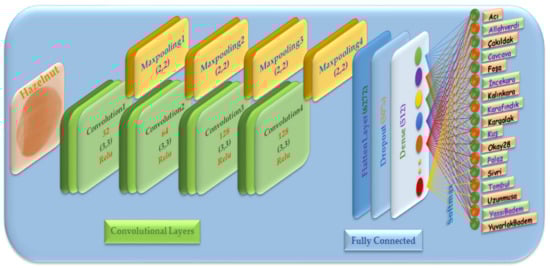
Figure 4.
The specific configurations of designed CNN (Lprtnr1) architecture.
A kernel was applied to the input image matrix with the convolution process in the first convolutional layer. Then ReLu activation function was used. After passing through the activation layer, the pooling layer was applied to reduce the image size and processing power in the network on the feature map. The max-pooling method was used here. Similarly, the Lprtnr1 model had four convolutional layers and a pooling layer. The number of kernels used in convolutional layers was 32, 64, 128, and 128, respectively. Flattening was applied after passing from convolution layers, and a fully connected layer was formed in the next process step. To prevent the overfitting of the network and to increase model performance, dropout was performed. In the proposed model, a dropout of 0.5 was applied to the ANN with one hidden layer. For the network to make an accurate estimation, the cost function should automatically be reduced to the lowest value. The “Adam” optimization algorithm was used to determine and update the weight values that provide this. “Categorical Cross Entropy” cost function was preferred because multiple classifications were made in our study. Softmax activation function was used because 17 different classifications would be made from the images of hazelnut varieties [45,46,47,48]. Some Mathematical Expressions about CNN are given in Supplementary Materials.
Pre-trained models were preferred because of their performance and ability to bring out specific architectural innovations. The four different pre-trained models were included in this study. These are VGG16, VGG19, ResNet50, and InceptionV3 models.
The VGG model was developed in 2014 by the Visual Graphics Group (VGG) at Oxford. Many variations of the VGG were implemented, such as VGG16 and VGG19, and these variations were different only in terms of the number of convolution layers used [49].
ResNet50, which was developed at Microsoft and described in 2015, uses a residual model which involves shortcut connections. In this model, color images are expected to have the square shape 224 × 224 [50].
The third version of the Inception networks family is InceptionV3, which was initially developed for the GoogLeNet model. Unlike traditional CNNs, the main idea of Inception architectures is to make multiple kernel filter sizes operate on the same level rather than stacking them sequentially, which is known as making the networks wider instead of deeper [51].
These models were used for feature extraction. To adapt the chosen models to the data set in our study, the convolution layers in all of these models were frozen and kept in their original form, while the last classification layer was removed. The number of varieties, which is 17, was added in the last layer to classify the hazelnut varieties.
This study was conducted on the hazelnut data set consisting of 17 varieties. Because the number of images in the data set was small, and to prevent overfitting, extensive data augmentation was applied, including the techniques mentioned earlier. The data set was grouped as 82% training, 6% validation, and 12% test. First, training and validation sets were used to perform the training process and parameter selection.
It is important to make sure that we have the best possible training model in the study. In this context, a technique called model checkpoint was applied. This model checkpoint observes the changes during training. If there is a positive change in the validation loss, the model checkpoint replaces the existing retained model with a new one in which validation loss is better than the existing one. Thus, the best possible model was obtained at the end of the training process. The results on the unknown data were evaluated by using the test set with the best model obtained. These procedures were applied for each of the 5 models used in the study. All parameters were used in the same way for each model.
2.3. Evaluation Metrics
Various evaluation metrics are used to find out the performance of the classifier. The evaluation metrics used in the study are explained below [52].
A confusion matrix was used to express classification accuracy numerically. The confusion matrix is one of the most commonly used techniques in machine learning, and it includes information about the actual and predicted classes obtained by a classification system. The confusion matrix has two dimensions: actual and predicted classes. While each row represents an actual class example, each column represents the state of a predicted class. In the confusion matrix, TP is the number of true positive, TN is the number of true negative, FP is the number of false positive, and FN is the number of false negative.
2.3.1. Accuracy
The accuracy of the classifier is quantified with this metric. The number of correctly classified data is divided by the total number of the data to calculate accuracy.
2.3.2. Precision
Precision shows how much of the data predicted as positive are predicted correctly. In other words, high precision means fewer false positives.
2.3.3. Recall
The recall is the metric of determining the completeness of the classifier. Higher recall indicates lower false negatives, while lower recall indicates higher false negatives. Precision often decreases with an improvement in recall.
2.3.4. F1-Score
To obtain the F1-score, the product of recall and precision is divided by the sum of recall and precision.
3. Results
CNN is used widely for image classification. In this study, the performance of different CNN architectures was evaluated for the classification of hazelnut varieties, the classification accuracy of the proposed CNN model (Lprttnr1) pre-trained models (VGG16, VGG19, ResNet50, and InceptionV3) was compared. While the proposed model was trained from scratch, pre-trained models were previously trained, and they were used as feature extractors. The same optimization algorithm was applied to each model, and the performances of these models were observed.
Table 3 shows the evaluation metrics of both validation sets and test sets of 5 CNN models. Here, the results are summarized for each model. The training process was carried out using the same settings in each model to obtain results that can be compared. For this purpose, the same input shape and batch size, the same training–validation–test split, the same learning rate, and the same optimizer were used. As the complexity or depth of the model increases, overfitting also increases even if data augmentation and dropout are applied. This situation results from the fact that the data set used is not large enough.
Table 3.
Average evaluation metrics of the five CNN models.
For this reason, the results change depending on the depth of the CNN model, the complexity of the classification, and the amount of data. The Lprtnr1 model (the proposed CNN model) gave much better results because it is a much simpler model than the pre-trained models. Because pre-trained models provided lower test accuracy/F1-score and higher test loss, they were unsuitable models for classification. In the hazelnut classification data set, the Lprtnr1 model was found to reach 98.63% accuracy.
To consider a model as the best model, it must have performed well in the training data set and the validation data set [53]. In this sense, the Lprtnr1 model was found to be the best model. Sensitivity analysis also indicated that the proposed model is the most influential model to classify hazelnut varieties [54].
In the Lprtnr1 model, the variation trend of training loss almost overlaps validation loss (Figure 5). At the same time, the variation trend of training accuracy is also consistent with that of validation accuracy (Figure 6). This situation shows that the model does not have an overfitting problem with the parameters chosen during the training process. These results show that the proposed network can distinguish the matched images in the input well.
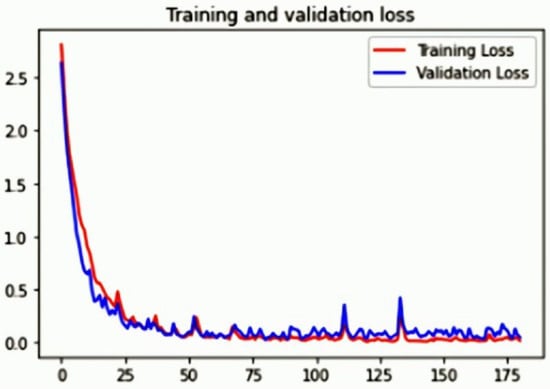
Figure 5.
Training and validation loss of Lprtnr1 model during the model training for hazelnut variety classification.
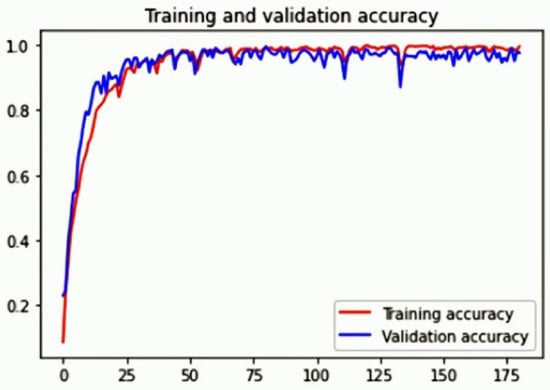
Figure 6.
Training and validation accuracy of Lprtnr1 model during the model training for hazelnut variety classification.
Figure 7 shows the confusion matrix of the validation set for the Lprtnr1 model. In the confusion matrix, while the diagonal axis number shows the number of accurate classifications, the others show the number of inaccurate classifications. The classification accuracy rate of all varieties except for Foşa and Uzunmusa is 100%. Classification accuracy rates were found as 93.33% and 86.66% for Foşa and Uzunmusa varieties, respectively. The general classification accuracy rate of all variables for the validation set is 98.82%. Figure 8 shows the confusion matrix of the test data set for the Lprtnr1 model. While the classification accuracy rate of Allahverdi, Cavcava, Foşa, Kargalak, Palaz, Sivri, and Uzunmusa varieties was 96.66%, that of the other variables was 100%. The general classification accuracy rate of all varieties for the test data set is 98.63%.

Figure 7.
Confusion matrix with the Lprtnr1 model of the validation dataset.
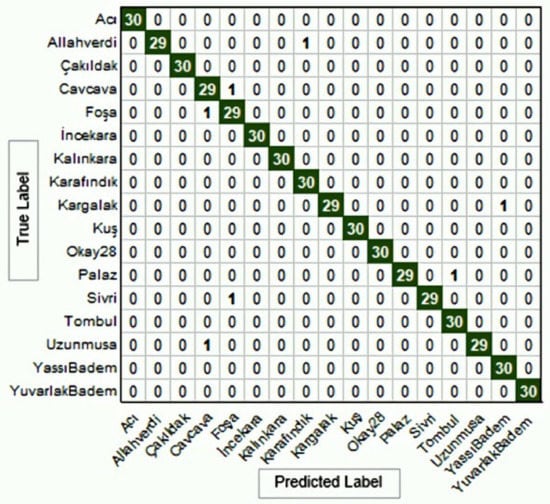
Figure 8.
Confusion matrix with the Lprtnr1 model of the test dataset.
In the test set, general classification accuracy rates of VGG16, VGG19, InceptionV3, and ResNet50 models were 73.14%, 72.14%, 61.18%, and 80.00%, respectively (Table 3). No suitable method was found for the classification of hazelnut varieties from these pre-trained models. It was found that the proposed Lprtnr1 model had sufficient potential to classify the 17 hazelnut varieties.
4. Discussion
Because this study is the first attempt to classify hazelnut variables with 17 varieties, it compared the proposed model with existing pre-trained models. Table 3 presents the accuracy, precision, recall, and F1-score results produced by the proposed model, VGG16, VGG19, InceptionV3, ResNet50, respectively. The proposed model obtained the highest accuracy, precision, recall, and F1-score values and better performance than the other models. Moreover, the table depicts that the InceptionV3 was the worst, while the ResNet50 achieved the most acceptable accuracy results compared to other models except the proposed model. The results described in Table 3 illustrate that the proposed model is superior to the other models considered in this research work regarding precision, recall, and F1-score. In addition, the results demonstrate that InceptionV3 was the worst in terms of precision, recall, and F1-score. In [53], Gulzar et al. obtained similar results for the proposed model.
“Own” models are widely used in fruit classification studies [42,55,56,57]. In these models, approximately 99% classification success was achieved as in our “own” proposed model.
Classification accuracy of the pre-trained models in the study was found to be low in general. In the researchers’ models, 66.7% of the CNN approaches made for fruit classification in the literature were much more successful [36]. In addition, it is thought that the absence of hazelnut images in the data set in which pre-trained models were used may have caused a negative effect on classification accuracy. Including hazelnut images in the existing data sets will increase accuracy in future studies. Another possible solution could be increasing training data or using more data-increasing techniques.
It should not be considered that pre-trained models are inaccurate. It would be more suitable to evaluate that these models are suitable for more complex tasks and data [53].
Pre-trained models give better results than training networks from scratch [58]. However, it was not supported by the results of this study. It was found that further studies are needed to examine this situation in more detail. Future work will also focus on improvement of the model with complex hazelnut variety images.
5. Conclusions
This article proposed an effective model to classify hazelnut varieties. The proposed model was trained on a data set that included the images of 17 hazelnut varieties. This model was compared with four pre-trained models, only the last layer of which were changed. The model was fine tuned to improve the classification performance of each model. The models were optimized and validated to increase the rate of accuracy and decrease the rate of error. The accuracy of the proposed model was found as 98.63%.
The results showed that pre-trained models could not meet the requirement for the classification of hazelnuts. Therefore, a new CNN architecture was proposed and used in this study.
The classification performance of data sets regarding other nuts can be improved by adapting the CNN model proposed in this study. Because it is not easy to obtain appropriate advice from agriculturists for manual determination and classification of varieties, this practice will help individuals with limited information about hazelnut varieties. At the same time, it will provide an opportunity for highly accurate, fast, and reliable classification. In the future, we aim to increase the amount of data and the number of varieties and to further develop this research study by using different deep learning methods.
Supplementary Materials
The following are available online at https://www.mdpi.com/article/10.3390/su13126527/s1, Codes and Mathematical Expressions.
Author Contributions
Conceptualization, A.T. and Y.B.Ö.; methodology, A.T.; software, A.T.; validation, A.T., Y.B.Ö. and H.D.; formal analysis, A.T.; investigation, Y.B.Ö.; resources, H.D.; data curation, H.D.; writing-original draft preparation, A.T. and Y.B.Ö.; writing-review and editing, A.T., Y.B.Ö. and H.D.; visualization, H.D. All authors have read and agreed to the published version of the manuscript.
Funding
This research received no external funding.
Institutional Review Board Statement
Not applicable.
Informed Consent Statement
Not applicable.
Data Availability Statement
Not applicable.
Conflicts of Interest
The authors declare no conflict of interest.
References
- FAOSTAT. Food and Agriculture Organization of the United Nations Classifications and Standards. 2019. Available online: http://www.fao.org/faostat/en/#data (accessed on 28 December 2019).
- Cristofori, V.; Ferramondo, S.; Bertazza, G.; Bignami, C. Nut and kernel traits and chemical composition of hazelnut (Corylus avellana L.) cultivars. J. Sci. Food Agric. 2008, 88, 1091–1098. [Google Scholar] [CrossRef]
- Köksal, İ.A. Ankara University Faculty of Agriculture Department of Horticulture; Turkish Hazelnut Cultivars: Ankara, Turkey, 2018; ISBN 978-975-8991-37-2. [Google Scholar]
- Giraudo, A.; Calvini, R.; Orlandi, G.; Ulrici, A.; Geobaldo, F.; Savorani, F. Development of an automated method for the identification of defective hazelnuts based on RGB image analysis and colour grams. Food Control 2018, 94, 233–240. [Google Scholar] [CrossRef]
- Solak, S.; Altınısık, U. Detection and classification of hazelnut fruit by using image processing techniques and clustering methods. Sak. Univ. J. Sci. 2018, 22, 56–65. [Google Scholar]
- Menesatti, P.; Costa, C.; Paglia, G.; Pallottino, F.; D’Andrea, S.; Rimatori, V.; Aguzzi, J. Shape-based methodology for multivariate discrimination among Italian hazelnut cultivars. Biosyst. Eng. 2008, 101, 417–424. [Google Scholar] [CrossRef]
- Güvenc, S.A.; Senel, F.A.; Cetisli, B. Classification of processed hazelnuts with computer vision. In Proceedings of the 23th Signal Processing and Communications Applications Conference, Malatya, Turkey, 16–19 May 2015; pp. 1362–1365. [Google Scholar]
- Koc, C.; Gerdan, D.; Eminoglu, M.B.; Yegül, U.; KOC, B.; Vatandas, M. Classification of hazelnut cultivars: Comparison of DL4J and ensemble learning algorithms. Not. Bot. Horti Agrobot. Cluj Napoca 2020, 48, 2316–2327. [Google Scholar] [CrossRef]
- Gokirmak, T.; Mehlenbacher, S.A.; Bassil, N.V. Characterization of European hazelnut (Corylus avellana) cultivars using SSR markers. Genet. Resour. Crop. Evol. 2009, 56, 147–172. [Google Scholar] [CrossRef]
- Ciarmiello, L.F.; Pontecorvo, G.; Piccirillo, P.; De Luca, A.; Carillo, P.; Kafantaris, I.; Woodrow, P. Use of nuclear and mitochondrial single nucleotide polymorphisms to characterize English walnut (Juglans regia L.) genotypes. Plant Mol. Biol. Rep. 2013, 31, 1116–1130. [Google Scholar] [CrossRef]
- Goodfellow, I.; Bengio, Y.; Courville, A. Deep Learning; MIT Press: Cambridge, MA, USA, 2016. [Google Scholar]
- Coppin, B. Artificial Intelligence Illuminated; Jones & Bartlett Learning: Burlington, MA, USA, 2004. [Google Scholar]
- Jordan, M.I.; Mitchell, T.M. Machine learning: Trends, perspectives, and prospects. Science 2015, 349, 255–260. [Google Scholar] [CrossRef]
- LeCun, Y.; Bengio, Y.; Hinton, G. Deep Learning. Nature 2015, 521, 436–444. [Google Scholar] [CrossRef]
- Wang, W.; Siau, K. Artificial intelligence, machine learning, automation, robotics, future of work and future of humanity: A review and research agenda. J. Database Manag. 2019, 30, 61–79. [Google Scholar] [CrossRef]
- Samuel, A.L. Some studies in machine learning using the game of checkers. IBM J. Res. Dev. 2000, 44, 206–226. [Google Scholar] [CrossRef]
- Liu, W.; Wang, Z.; Liu, X.; Zeng, N.; Liu, Y.; Alsaadi, F.E. A survey of deep neural network architectures and their applications. Neurocomputing 2017, 234, 11–26. [Google Scholar] [CrossRef]
- Gewali, U.B.; Monteiro, S.T.; Saber, E. Machine learning based hyperspectral image analysis: A survey. arXiv 2018, arXiv:1802.08701. [Google Scholar]
- Femling, F.; Olsson, A.; Alonso-Fernandez, F. Fruit and Vegetable Identification Using Machine Learningfor Retail Applications. In Proceedings of the IEEE 2018 14th International Conference on Signal-ImageTechnology & Internet-Based Systems (SITIS), Las Palmas de Gran Canaria, Spain, 26–29 November 2018; pp. 9–15. [Google Scholar]
- Singh, R.; Balasundaram, S. Application of extreme learning machine method for time series analysis. Int. J. Intell. Technol. 2007, 2, 256–262. [Google Scholar]
- Qiu, Z.; Jian, C.; Zhao, Y.; Zhu, S.; Yong, H.; Chu, Z. Variety Identification of Single Rice Seed Using Hyperspectral Imaging Combined with Convolutional Neural Network. Appl. Sci. 2018, 8, 212. [Google Scholar] [CrossRef]
- Acquarelli, J.; van Laarhoven, T.; Gerretzen, J.; Tran, T.N.; Buydens, L.M.C.; Marchiori, E. Convolutional neural networks for vibrational spectroscopic data analysis. Anal. Chim. Acta 2017, 954, 22–31. [Google Scholar] [CrossRef]
- Zhang, X.; Lin, T.; Xu, J.; Luo, X.; Ying, Y. DeepSpectra: An end-to-end deep learning approach for quantitative spectral analysis. Anal. Chim. Acta 2019, 1058, 48–57. [Google Scholar] [CrossRef]
- Yang, X.; Ye, Y.; Li, X.; Lau, R.Y.K.; Zhang, X.; Huang, X. Hyperspectral Image Classification with Deep Learning Models. IEEE Trans. Geosci. Remote Sens. 2018, 56, 5408–5423. [Google Scholar] [CrossRef]
- Yu, X.; Tang, L.; Wu, X.; Lu, H. Nondestructive Freshness Discriminating of Shrimp Using Visible/Near-Infrared Hyperspectral Imaging Technique and Deep Learning Algorithm. Food Anal. Methods 2018, 11, 768–780. [Google Scholar] [CrossRef]
- Yue, J.; Mao, S.; Li, M. A deep learning framework for hyperspectral image classification using spatial pyramid pooling. Remote Sens. Lett. 2016, 7, 875–884. [Google Scholar] [CrossRef]
- Signoroni, A.; Savardi, M.; Baronio, A.; Benini, S. Deep Learning Meets Hyperspectral Image Analysis: A Multidisciplinary Review. J. Imaging 2019, 5, 52. [Google Scholar] [CrossRef]
- LeCun, Y.; Bottou, L.; Bengio, Y.; Haffner, P. Gradient-based learning applied to document recognition. Proc. IEEE 1998, 86, 2278–2324. [Google Scholar] [CrossRef]
- Fan, S.; Li, J.; Zhang, Y.; Tian, X.; Wang, Q.; He, X.; Zhang, C.; Huang, W. On line detection of defective apples using computer vision system combined with deep learning methods. J. Food Eng. 2020, 286, 110102. [Google Scholar] [CrossRef]
- Koirala, A.; Walsh, K.B.; Wang, Z.; Anderson, N. Deep Learning for Mango (Mangifera indica) Panicle Stage Classification. Agronomy 2020, 10, 143. [Google Scholar] [CrossRef]
- Ghazi, M.; Yanikoglu, B.; Aptoula, E. Plant identification using deep neural networks via optimization of transfer learning parameters. Neurocomputing 2017, 235, 228–235. [Google Scholar] [CrossRef]
- Pourdarbani, R.; Sabzi, S.; García-Amicis, V.M.; García-Mateos, G.; Molina-Martínez, J.M.; Ruiz-Canales, A. Automatic Classification of Chickpea Varieties Using Computer Vision Techniques. Agronomy 2019, 9, 672. [Google Scholar] [CrossRef]
- Knoll, F.J.; Czymmek, V.; Harders, L.O.; Hussmann, S. Real-time classification of weeds in organic carrot production using deep learning algorithms. Comput. Electron. Agric. 2019, 167, 105097. [Google Scholar] [CrossRef]
- Przybylak, A.; Kozłowski, R.; Osuch, E.; Osuch, A.; Rybacki, P.; Przygodzi’ nski, P. Quality Evaluation of Potato Tubers Using Neural Image Analysis Method. Agriculture 2020, 10, 112. [Google Scholar] [CrossRef]
- Xie, C.; Wang, R.; Zhang, J.; Chen, P.; Dong, W.; Li, R.; Chen, H. Multi-level learning features for automatic classification of field crop pests. Comput. Electron. Agric. 2018, 152, 233–241. [Google Scholar] [CrossRef]
- Torres, J.N.; Mora, M.; Hernández-García, R.; Barrientos, R.J.; Fredes, C.; Valenzuela, A. A Review of Convolutional Neural Network Applied to Fruit Image Processing. Appl. Sci. 2020, 10, 3443. [Google Scholar] [CrossRef]
- Sakib, S.; Ashrafi, Z.; Siddique, M.A.B. Implementation of Fruits Recognition Classifier using Convolutional Neural Network Algorithm for Observation of Accuracies for Various Hidden Layers. arXiv 2019, arXiv:1904.00783. [Google Scholar]
- Oltean, M. Fruits 360 Dataset. Mendeley Data, 2018. Available online: https://data.mendeley.com/datasets/rp73yg93n8/1 (accessed on 1 June 2021).
- Mureşan, H.; Oltean, M. Fruit recognition from images using deep learning. Acta Univ. Sapientiae Inform. 2018, 10, 26–42. [Google Scholar] [CrossRef]
- Wang, S.H.; Chen, Y. Fruit category classification via an eight-layer convolutional neural network with parametric rectified linear unit and dropout technique. Multim. Tools Appl. 2018, 79, 1–17. [Google Scholar] [CrossRef]
- Zhu, L.; Li, Z.; Li, C.; Wu, J.; Yue, J. High performance vegetable classification from images based on alexnet deep learning model. Int. J. Agric. Biol. Eng. 2018, 11, 217–223. [Google Scholar] [CrossRef]
- Lu, S.; Lu, Z.; Aok, S.; Graham, L. Fruit classification based on six layer convolutional neural network. In Proceedings of the 2018 IEEE 23rd International Conference on Digital Signal Processing (DSP), Shanghai, China, 19–21 November 2018; pp. 1–5. [Google Scholar]
- Zeng, G. Fruit and vegetables classification system using image saliency and convolutional neural network. In Proceedings of the 2017 IEEE 3rd Information Technology and Mechatronics Engineering Conference (ITOEC), Chongquing, China, 3–5 October 2017; pp. 613–617. [Google Scholar]
- Sa, I.; Ge, Z.; Dayoub, F.; Upcroft, B.; Perez, T.; McCool, C. Deepfruits: A fruit detection system using deep neural networks. Sensors 2016, 16, 1222. [Google Scholar] [CrossRef] [PubMed]
- Li, Y.; Chao, X. ANN-Based Continual Classification in Agriculture. Agriculture 2020, 10, 178. [Google Scholar] [CrossRef]
- Gu, J.; Wang, Z.; Kuen, J.; Ma, L.; Shahroudy, A.; Shuai, B.; Liu, T.; Wang, X.; Wang, G.; Cai, J.; et al. Recent advances in convolutional neural networks. Pattern Recognit. 2018, 77, 354–377. [Google Scholar] [CrossRef]
- Lee, C.Y.; Gallagher, P.W.; Tu, Z. Generalizing pooling functions in convolutional neural networks: Mixed, gated, and tree. Artif. Intell. Stat. 2016, 464–472. [Google Scholar]
- Scherer, D.; Müller, A.; Behnke, S. Evaluation of pooling operations in convolutional architectures for object recognition. In International Conference on Artificial Neural Networks; Springer: Berlin/Heidelberg, Germany, 2010; pp. 92–101. [Google Scholar]
- Simonyan, K.; Zisserman, A. Very deep convolutional networks for large-scale image recognition. arXiv 2014, arXiv:1409.1556. [Google Scholar]
- He, K.; Zhang, X.; Ren, S.; Sun, J. Deep residual learning for image recognition. arXiv 2015, arXiv:1512.03385. [Google Scholar]
- Chollet, F. Xception: Deep Learning with Depthwise Separable Convolutions. arXiv 2017, arXiv:1610.02357. [Google Scholar]
- Chicco, D.; Jurman, G. The advantages of the Matthews correlation coefficient (MCC) over F1-score and accuracy in binary classification evaluation. Chicco Jurman BMC Genom. 2020, 21, 1–13. [Google Scholar] [CrossRef]
- Gulzar, Y.; Hamid, Y.; Soomro, A.B.; Alwan, A.A.; Journaux, l. A Convolution Neural Network-Based Seed Classification System. Symmetry 2020, 12, 2018. [Google Scholar] [CrossRef]
- Abdipour, M.; Younessi-Hmazekhanlu, M.; RezaRamazani, S.H.; Omidi, A.H. Artificial neural networks and multiple linear regression as potential methods for modeling seed yield of safflower (Carthamus tinctorius L.). Ind. Crop. Prod. 2019, 127, 185–194. [Google Scholar] [CrossRef]
- Lu, Y. Food image recognition by using convolutional neural networks (CNNs). arXiv 2019, arXiv:1612.00983. [Google Scholar]
- Zhang, Y.D.; Dong, Z.; Chen, X.; Jia, W.; Du, S.; Muhammad, K.; Wang, S.H. Image based fruit category classification by 13-layer deep convolutional neural network and data augmentation. Multim. Tools Appl. 2019, 78, 3613–3632. [Google Scholar] [CrossRef]
- Katarzyna, R.; Paweł, M. A Vision-Based Method Utilizing Deep Convolutional Neural Networks for Fruit Variety Classification in Uncertainty Conditions of Retail Sales. Appl. Sci. 2019, 9, 3971. [Google Scholar] [CrossRef]
- Kandel, I.; Castelli, M.; Popovic, A. Musculoskeletal Images Classification for Detection of Fractures Using Transfer Learning. J. Imaging 2020, 6, 127. [Google Scholar] [CrossRef]


Publisher’s Note: MDPI stays neutral with regard to jurisdictional claims in published maps and institutional affiliations. |
© 2021 by the authors. Licensee MDPI, Basel, Switzerland. This article is an open access article distributed under the terms and conditions of the Creative Commons Attribution (CC BY) license (https://creativecommons.org/licenses/by/4.0/).