Abstract
Alternative energy resources have a significant function in the performance and decarbonization of power engendering schemes in the building application domain. Additionally, “green buildings” play a special role in reducing energy consumption and minimizing CO2 emissions in the building sector. This research article analyzes the performance of alternative primary energy sources (sun and hydrogen) integrated into a hybrid photovoltaic panel/fuel cell system, and their optimal synergy to provide green energy for a green building. The study addresses the future hydrogen-based economy, which involves the supply of hydrogen as the fuel needed to provide fuel cell energy through a power distribution infrastructure. The objective of this research is to use fuel cells in this field and to investigate their use as a green building energy supply through a hybrid electricity generation system, which also uses photovoltaic panels to convert solar energy. The fuel cell hydrogen is supplied through a distribution network in which hydrogen production is outsourced and independent of the power generation system. The case study creates virtual operating conditions for this type of hybrid energy system and simulates its operation over a one-year period. The goal is to demonstrate the role and utility of fuel cells in virtual conditions by analyzing energy and economic performance indicators, as well as carbon dioxide emissions. The case study analyzes the optimal synergy between photovoltaic panels and fuel cells for the power supply of a green building. In the simulation, an optimally configured hybrid system supplies 100% of the energy to the green building while generating carbon dioxide emissions equal to 11.72% of the average value calculated for a conventional energy system providing similar energy to a standard residential building. Photovoltaic panels account for 32% of the required annual electricity production, and the fuel cells generate 68% of the total annual energy output of the system.
1. Introduction
The implementation of energy efficiency sustainability elements in the construction domain is the goal of numerous international organizations engaged in this field. The use of alternative energy sources, alone or in hybrid configurations, to provide power to buildings is recommended more and more often, and will become mandatory in the near future. The implementation of hydrogen energy in various practical applications has been a growing concern for the community of researchers in the field, and, during 2020, hydrogen energy was in the spotlight as a major part of the world’s energy strategies.
Chaouki Ghenai et al. [1] considered an off-grid system composed of photovoltaic panels (PV)/fuel cells (FCs), located in a desert region from the economic perspective. They described conditions in which the system was placed because of its extreme characteristics. Considering dust accumulation and the operating temperature of the panels, they built models and simulated the system to optimize its functionality and increase its performance. Hongbo Ren et al. [2], considering environmental and economic objectives, analyzed a system composed of a PV/FC/battery (B). They highlighted the performance, cost, and size of the equipment. This model was filtered and analyzed through numerical examples. The strategy for the application was selected from several perspectives to improve and demonstrate the environmental performance of the system. Ishaq and Dincer [3] presented a novel system in which hydrogen was added to natural gas for combustion. The hybrid system included wind and solar sources. In order to increase efficiency and decrease emissions, they added 0 to 20% hydrogen gas. They observed that carbon dioxide (CO2) emissions decreased with inverse proportionality to hydrogen addition, and the combustion energy efficiency grew by 10%. In [4], Al-Hamed and Dincer envisioned a clean locomotive with an integrated solid oxide fuel cell (SOFC) system. To optimize the system they assessed its effectiveness, fuel costs, and carbon emissions. The results showed that compared to diesel, natural gas has a better impact on the environment, reducing costs and emissions.
Ishaq and Dincer [5] comprehensively considered hydrogen’s role in the transition to 100% renewable energy. They described the implementation of this process, highlighting three elements: hybrid hydrogen production, renewable energy sources, and applications and services that could use hydrogen. The paper presents classifications, methods, systems, and a case of study.
Jamshidi and Askarzadeh [6] studied a PV/FC/diesel generator system from a multiobjective optimization perspective, with the purpose of optimizing size, operating emissions, and investigating uncertainties and reservations. The Crow search algorithm was introduced to solve the sizing problem, and the system proved efficient. Bukar and Tan [7] described energy management strategies (EMS) for the system to find the most cost-effective one and analyzed and compared multiple cases from the literature.
Siddiquio and Dincer [8] proposed a multigeneration system with a novel recovery technique for waste heat. They conducted a dynamic investigation with analyses on exergetic and energetic efficiency to evaluate the system over the period of a full year. Several tests were conducted to prove the system’s efficiency. Luta and Raji [9] proposed an algorithm for energy management strategies to balance the load between supply and demand for a fuel cell system. This solution proved also to be effective in the reduction of power losses. Gharibi and Askarzadeh [10] discussed on-grid diesel/PV/FC system optimization. They introduced purchase and selling coefficients in the optimization of its size. Their multiple objectives were renewability, loss of power supply probability (LPSP), and leveled cost of energy.
In [11], Bizon proposed a 2D function to optimize fuel cell fuel consumption. Dynamic power was defined by power profiles and loads or energy sources. Variable mitigation in load and renewable energy was ensured and control of power flow ensured a charge sustaining mode. Therefore, fuel economy increased for this strategy. Krishan and Suhag [12] provided an assessment from technical and financial points of view for two hybrid energy storage systems with configurations technically compared using Mathlab/Simulink models. Configuration feasibility was checked with a real-time hardware in-loop simulator. Samy et al. [13] investigated the technical and financial aspects of a combined renewable energy system (CRES) using simulation, mathematical modeling, and optimization approaches. The project was located in Egypt and contained a small-scale PV/FC/wind turbine (WT). Multiple combinations were developed and presented for optimization. Temiz and Javeni [14] used hydrogen as a medium to store energy for a floating system formed of integrated photovoltaic cells and hydrogen. The main objective was to increase efficiency and avoid occupying the land. This application provides the cost of electricity per unit. Kamel et al. [15] used the conventional proportional integrated (PI) control strategy as an energy management strategy in a PV/FC/batteries/supercapacitor (SC) system. This system was built to supply the demand power for a dump load. Using high-frequency decoupling and fuzzy logic, the system proved to be efficient as a microgrid system. To provide environmental protection, Ellahi et al. [16] built a database that addressed further hybrid systems and their applicability. They provided an analysis using forecasting techniques, predicted renewable energy sources (RES) availability, and extracted information. Rezk et al. [17] analyzed a hybrid PV/FC/B system built in Neom, Saudi Arabia, where the solar irradiance reaches high levels. The technical–financial and feasibility evaluation covered 500 kWh. To measure the size of the system, the net existing costs and energy costs were calculated. The system proved to be viable when compared to a diesel generation system. In [18], Bizon and Thounthong provided two hybrid power system topologies based on RESs and FC. RESs power flow consisted of modeled wind turbines and photovoltaic arrays. Efficiency in the fuel consumption was observed, as well as the total fuel consumption. Bizon, Stan, and Cormos [19] compared seven control topologies to obtain the optimal strategy in operational aspects such as fuel economy, best operating model for loading, or most appropriate strategy for switching. They found a strategy that ensured a reduction in fuel consumption by 15%.
Balencia, Benavides, and Cardenas [20] conducted an analysis in order to optimize the electricity production in a non-interconnected area in the Colombian Caribbean region. Using the meteorological history of the zone, they ran a comparative analysis on a WT/FC/electrolyzer/SP/regulator. The optimization through the Pareto diagram obtained minimization in CO2 emissions and in energy costs. Kosmadakis et al. [21] assessed the economic feasibility of a system consisting of PV and lead–acid batteries. Calculations of costs per kWh were variable depending on the conditions. This system was optimized to reduce costs and improve functioning. Dawood, Shafiullah, and Anda [22] analyzed a stand-alone energy-based system installed in rural and urban locations. Multiple scenarios were simulated in order to identify the optimal one from the perspective of technical and financial feasibility. The study by Shakti et al. [23] provided an environmentally friendly and cost-effective system. This project was made to supply the demand in India, in a central community. The system used an electrolyzer, hydrogen storage tank, and fuel cell. Mathematical modeling and operational algorithm were used to optimize the costs. The Homer software proved the effectiveness of the system.
Cheng and Lin [24] aimed to enhance the performance of a green building with the purpose to improve its characteristics and optimize its processes. This building used wind turbines, solar cells, proton exchange membrane fuel cells (PEMFCs), batteries, power electronic devices, and electrolyzers. In conclusion, this system proved reliable, improving costs and performance. In [25], Jena and Kumar Kar projected a system that covers the demand for commercial, residential, and domestic sectors using noncarbonaceous resources. They used the approximation method to estimate the lifespan of the electrolyzer. This system was validated through modeling and simulation in MATLAB/Simulink. Arnaout et al. [26] found a new solution using building-integrated photovoltaics (BIPV) for the façade of the buildings. The value of this solution is its reliability and cleanliness of the solution. The location chosen for the system is in Malaysia, a tropical region, and on the roof surface, to provide the potential for maximum energy levels, and different functional scenarios were analyzed. The main purpose was to preserve energy, satisfy BIPV rules, and capitalize the space on the roof. Hosseini et al. [27] analyzed a system with PV and FC for a residential area, and they investigated the monthly performance of the building. They compared electricity unit cost considering the lifetime of the system through exergonic and financial analysis. The results have shown that the system is not rentable for the winter months due to its low efficiency and costs. In [28], Sedaghati and Shakarami proposed a multiple phase control strategy using fuel cell, battery systems, and photovoltaic panels to establish certain parameters and conditions. The control strategy shows lower steady-state error and faster response. Alam et al. [29] designed a system of 110V DC for fuel cell and photovoltaic generators to operate on loads such as laptops, fans, mobile phones, and LED lights in a microgrid DC. The system proved to be applicable on stable applications, and it was used for railways. Amirkhalili and Zahedi [30] studied wind power with backup power from a storage system. The system contained a fuel cell, a hydrogen storage tank, an electrolyzer, and a wind turbine. Located in Kouhin, Qazvin, this system proved to be efficient when three wind turbines are used, and the fuel cell provides the energy. Yoichi and Masao [31] used PEMFCs to provide for household cogeneration. This system was chosen because of its high efficiency and to improve the performance of the system.
Ou et al. [32] built a hybrid system for household application with a battery/fuel cell and studied its efficiency and robustness. Using dynamic programming, fuzzy logic control, and state machine control, they simulated the system. This system proved to have a longer life and easier operability. Tai et al. [33] analyses aimed to improve the development of the fuel cells and to save time on the demand for manufacturability and flexibility. This article reviewed the applications and advantages of additive manufacturing in fuel cells. In [34], Doi et al. conceived a system using high purity hydrogen as fuel. They needed to obtain better power that was continuously generated and provided stability and reliability.
The European Green Deal strongly recommends the widespread use of green energy, and clean hydrogen vector energy is gaining special importance in all energy strategies across the globe. Research articles, literature reviews, and scientific initiatives in the field of integrating hydrogen fuel cell technologies into practical applications [35] successfully demonstrate the sustainability of hydrogen energy in serving as power supplies for stationary applications, in general, and green buildings, in particular [36,37]. This study addresses the future of a hydrogen-based economy, which involves the supply of hydrogen as the fuel needed for fuel cells in the distribution infrastructure. The practical application of the system is in the “green building” sector, a concept that defines this type of construction as a building that supplies its energy directly from solar energy, with a low energy demand that can be satisfied exclusively by alternative resources [38,39]. This research paper shows the results of a case study on the analysis of the performance of alternative primary energy sources (solar and hydrogen), integrated into a hybrid photovoltaic panel/fuel cell system, and their optimal synergy to provide green energy for a green building. The highlights of this study can be summarized as follows:
- The optimal sizing of solar units implemented in the design, along with the optimal capacities of hydrogen technology, to fulfill the daily electricity demand of the green building in an uninterrupted manner;
- Assessing the feasibility of the proposed hybrid energy system pairing solar energy with hydrogen technologies to power a low-energy green residential building;
- Investigating the possibility of supplying 100% green energy to green residential buildings under conditions of constraints and limitations due to the stochastic nature of the building’s electricity consumption, volatile and intermittent nature of solar resources, local weather conditions specific to the building location, and space limitations for the positioning of the photovoltaic panels, as well as determining the amount of hydrogen fuel required for such a practical application as the one presented in the case study.
2. Materials and Methods
2.1. Framework
This case study is part of a complex project whose main objective was to investigate the ways of integrating fuel cells and the role of hydrogen energy in energy supply systems of energy-efficient buildings [40,41,42,43,44]. Within the project, different possible practical situations for the implementation of hydrogen energy in the domain of these types of buildings were subjected to the study. Fuel cells are suitable for the energy supply of individual residential consumers with low energy requirements, but such systems with small power capabilities have already been developed, and therefore, the new projects aimed at providing fuel cells for the energy supply of residential building complexes that include more apartments [45,46]. The energy efficiency of fuel cells is higher than that of conventional power generation systems, which operate at an efficiency of over 45%, compared to traditional ones that offer maximum efficiencies of 25–35% [37,46]. This also leads to significant reductions in CO2 emissions [47,48,49,50].
This case study involved the supply of energy to an energy-efficient building by a hybrid energy system that used the sun as the primary renewable source of energy and hydrogen as an alternative resource, delivered through a centralized distribution network in the event of a future hydrogen-based economy, shown schematically in Figure 1.
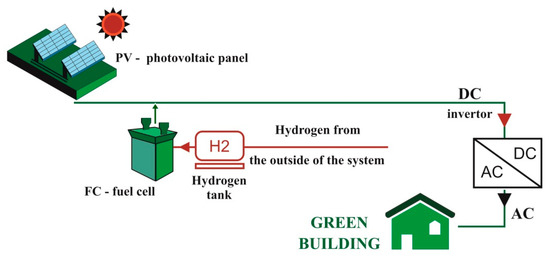
Figure 1.
PV–FC hybrid energy system; principal scheme.
The system used photovoltaic panels for the conversion of solar energy for electricity generation, and the hydrogen-powered fuel cell from the central grid supported the energy demands of consumers during periods when solar energy was not available or was inefficient in ensuring energy demand.
The case study concerned the optimal sizing of energy conversion equipment, determining the hydrogen demand as fuel for fuel cell consumption, analysis of the optimal synergy between the photovoltaic panels and the fuel cell for powering the green building, highlighting environmental performance compared to the traditional version of grid electricity and cost analysis.
2.2. Methodological Approach
The research methodology used in conducting the case study is schematically illustrated in Figure 2. Input data refers to the potential of renewable energies available at the studied location, the energy demands of the green building to be supplied with clean, sustainable energy, as well as the technical, environmental, and financial elements particular to the main energy conversion equipment: photovoltaic panels, the fuel cell, and the inverter.
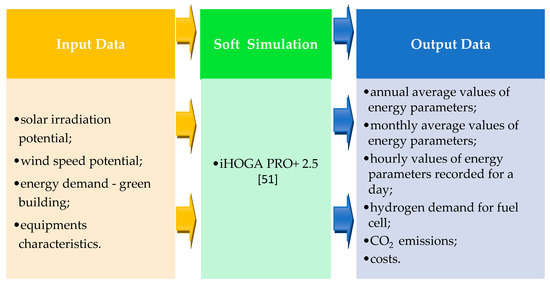
Figure 2.
Methodological approach.
The virtual simulation software of the energy system was Hybrid Optimization by Genetic Algorithms (iHOGA) PRO +2.5 version [51,52,53,54,55], and output data are presented in detail in Section 3, Results.
The power produced by the PV was computed using the following Equation (1):
where PPV is power produced by the PV (kWp), Gi is the hourly solar irradiation (kW/m2), ISC is the short-circuit current (A), Fp is the factor of loss compensation by power due to shading, and UDC is the DC voltage generated by the PV (V) [40,51,52,53,54,55,56].
The demand for hydrogen as fuel by FC is directly influenced by the nominal power and actual power generated in the system. The computation of fuel cell consumption using hydrogen as the fuel is based on the following equations [40,51,52,53,54,55,56]:
When , the fuel cell consumption is computed with the following math formula:
and when , the fuel cell consumption of fuel cell is computed with the following math formula:
where
is the fuel cell hydrogen consumption (kg/h);
is the fuel cell nominal power (kW);
is the fuel cell real power produced by the energy system (kW);
and are coefficients of consumption and efficiency curve (kg/kWh);
is consumer factor furthermore of the yield power at maximum efficiency;
is the power generated for green building at the fuel cell maximum efficiency. (kW).
2.2.1. Placement Specific Geo-Climatic Parameters
The geographical data of the location and the particularities of the external climatic parameters of the municipality of Cluj-Napoca, Romania, are summarized in Table 1, as follows:

Table 1.
Geographical and climatic particularities for Cluj-Napoca.
The values taken into account for determining the green building energy demand were in accordance with the reference documents recommended for average monthly temperatures, average daily temperatures for the months of a year, the intensity of solar irradiation, and the conventional wind calculation speed, depending on the wind area.
The conventional calculation of outdoor temperatures was considered in accordance with the climate zoning map of the Romanian territory for the winter period. Mc 001/2-2006 [57] includes this map, according to which the Romanian territory is divided into four climatic zones; the municipality of Cluj-Napoca is located in climatic zone III, with the conventional outdoor temperature of calculation θe = −18 °C.
The establishment of values of the necessary parameters for the calculation of the energy performance of the building was made based on the data measured according to the methodology established by the World Meteorological Organization and processed in accordance with the technical regulations in force [58,59].
For the geographical location of the studied climatic zone, in which the green building is located, the values of the solar irradiation are shown in Figure 3, and the values of the wind speed are presented in Figure 4. The solar energy resource has a total annual irradiation potential of 1297.6 kWh/m2/year, with an average daily solar irradiation of 3.29 kWh/m2/day [60].
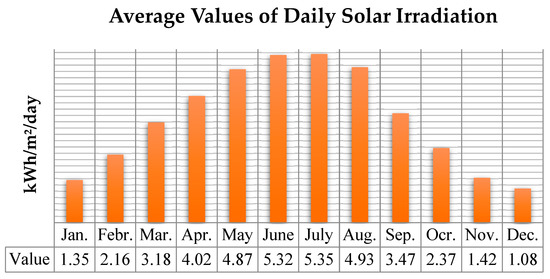
Figure 3.
Average values of daily solar irradiation [60].
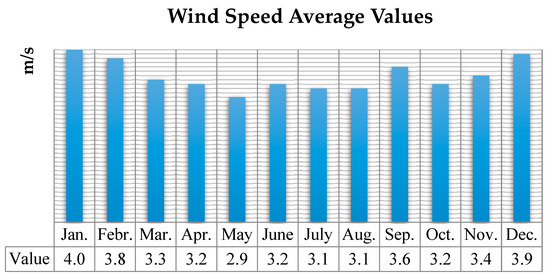
Figure 4.
Average values of wind speed [60].
The wind speed has an average of 3.39 m/s and is important in computing the green building energy demand [60].
2.2.2. Dimensional Characteristics of Green Building Envelope Elements
The building envelope consists of a series of surfaces through which heat transfer takes place. The area of the building envelope ((A); m2) representing the sum of all the areas of the perimeter constructive elements of the building through which a thermal transfer takes place is calculated as
where Ak is the area of the building element that forms part of the building envelope.
The dimensional characteristics of the constructive elements for the studied building are presented in Table 2.
Table 2.
Area of the constructive elements of the envelope.
The envelope area was calculated taking into account exclusively the interior surfaces of the perimeter construction elements, ignoring the existence of the interior construction elements (structural and nonstructural interior walls, as well as the intermediate floors).
The volume of the building ((V); m3) represents the volume delimited by the perimeter surfaces that make up the building envelope, which is, in fact, the heated volume of the building, comprising both directly heated rooms (with heating elements) and indirectly heated rooms (without heating elements but ones in which heat penetrates through adjacent walls, devoid of significant thermal insulation). The volume of the studied building is equal to 400.00 (m3).
As a general principle, the surfaces of the perimeter construction elements that together make up the building envelope are delimited from the external environments by the inner faces of the construction elements. In this sense, the following elements are involved in performing the calculations regarding the whole building: the free height of the rooms, which is equal to 2.50 (m), and the developed usable area, which is equal to 160.00 (m2).
The lengths of the thermal bridges (l) are measured according to their actual lengths existing within the areas (A) determined above; consequently, they are delimited at the extremities by the contour of the respective surfaces. In terms of values, l—the lengths of the thermal bridges in contact with the external environment were equal to 116.86 (m), and the lengths of the thermal bridges in contact with the ground were equal to 11.35 (m).
2.2.3. Green Building—Energy Demands
The energy demand established by the computational and mathematical calculations in accordance with the design norms, standards, and the legislation in force [57] for the green building studied, along with the values of the main consumers, are illustrated in Figure 5, and the hourly distribution of the energy demand is shown in Figure 6.
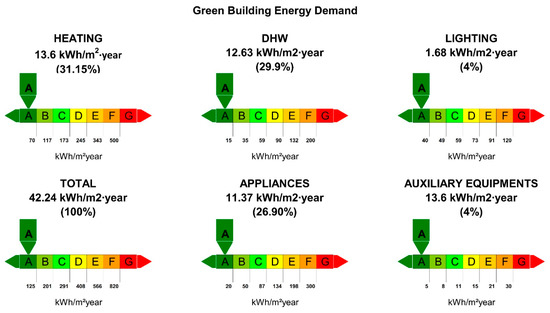
Figure 5.
Green building energy demand.
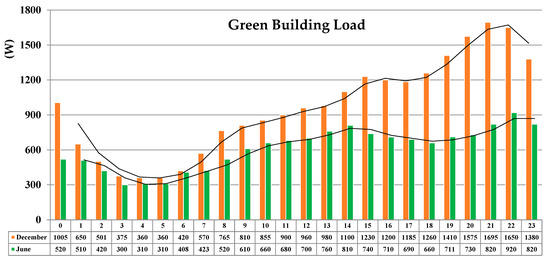
Figure 6.
Green building load.
It turned out that the energy demand of the studied building falls in the category of energy-efficient class A constructions. The energy required for heating was 2106 kWh/year, and in terms of the developed surface of the building of 160 m2, the value of 13.16 kWh/m2∙year was obtained, a value that was lower than the maximum standardized value in the field of “passive houses,” which is, respectively, 15.00 kWh/m2∙year. With reference to the total energy demands for the green building, it was also observed that the total value amounted to 6759 kWh/year, compared to the developed area of 160 m2, i.e., 42.24 kWh/m2∙year; in the context initially established, all the demands supported by electricity fell within the standards of the “passive houses,” with the total demand for primary energy being ≤120 kWh/m2∙year, respectively.
Energy demand data referred to alternating current with a lower frequency of 50 Hz, voltage by 230 V, and power factor cos φ = 0.9 [58,59].
The graph of hourly energy demand, shown in Figure 6, highlights the waveforms specific to energy consumption. The most adverse case can be noticed during December, when the hourly maximum active load was 1695 W, occurring between 9 and 11 p.m., and the hourly minimum active load was 360 W, obtained between 4 and 6 a.m.
The most advantageous case may be achieved during June when the hourly maximum active load was 920 W, occurring between 10 and 11 p.m., and the hourly minimum active load was 310 W, achieved between 4 and 6 a.m. Other months registered intermediate values to those presented as limits.
2.2.4. The Hybrid Energy System Proposed for Analysis in the Case Study
The energy conversion equipment units that were the main components in the analyzed hybrid energy system are presented in Table 3.
Table 3.
Hybrid energy system equipment.
The constituent equipment units that composed the hybrid energy system were photovoltaic panels with a total installed nominal power of 3.24 kWp, a fuel cell with a nominal power of 3 kW, and an S.Solarix 1200 × 2 type inverter with a capacity of 1800 VA.
- (a)
- PhotovoltaicPanels
Photovoltaic panels with the following characteristics were used as technologies for the conversion of solar energy into electricity [52]: 12 V—nominal voltage; 8.23 A—shortcut current; 135 Wp—nominal power; 25 years lifespan; 800 kg CO2 equiv./kWp; EUR 192—acquisition cost; 2 EUR/year—operation and maintenance cost. The azimuth of the photovoltaic panels was 0°, the ground reflectance had a value = 0.2, the compensation factor for the loss of power due to shading and dirt deposition was considered = 1.2, and the photovoltaic panels were not equipped with solar tracking systems.
- (b)
- Fuel Cell
As a technology for the conversion of hydrogen for use as a vector or secondary energy carrier in the energy system, the iHOGA simulation program database [51,52,53] has a series of fuel cells of different rated powers, from 1 to 10 kW. This type of equipment considered for the present study has low nominal powers due to the influence of the low energy consumption specific to the building under study. The fuel cell taken into account for the configuration had a power of 3 kW; 50,000 h—lifetime; EUR 15,000—acquisition cost; 0.15 EUR/h—operation and maintenance cost; the consumption and efficiency diagram are shown in Figure 7.
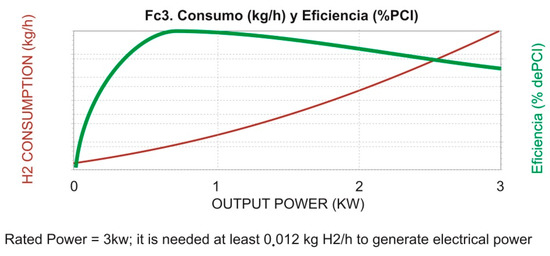
Figure 7.
Diagram of hydrogen consumption and efficiency for the 3 kW fuel cell.
- (c)
- Inverter
For the green building consumer, the primary target of the present case study, an inverter with the following features was chosen: 1800 VA—rated power; 10 years—lifetime; EUR 1200—acquisition cost; the efficiency diagram in relation to the generated power is presented in Figure 8.
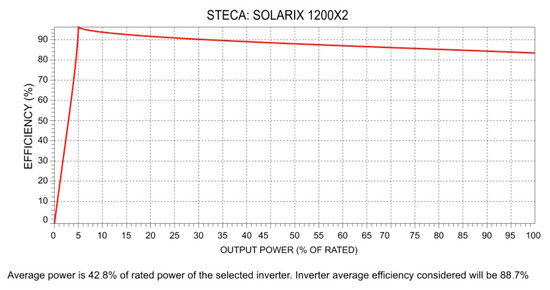
Figure 8.
Inverter efficiency diagram.
3. Results
3.1. Energy Analysis
The results obtained from the operation simulation are briefly illustrated numerically in Table 4 and represent annual average values of the parameters that characterize this type of system. From the provided data in the table, it is observed that during one year of operation, the photovoltaic panels generated 32% of the total energy production of the optimally configured system, which was directly influenced by the intermittent conditions of solar resource availability, and fuel cell provided the majority of energy in the system, with 68% of the total energy production. It should be noted that in the case of achieving an energy balance between the amount of energy generated by the system and the amount of energy consumed by the system, there was a maximum loss of 15.50% due to DC–AC and/or AC–DC conversion, depending on inverter efficiency.
Table 4.
System performance indicators.
The monthly average values of the energy parameters (consumption and production) are summarized in Figure 9.
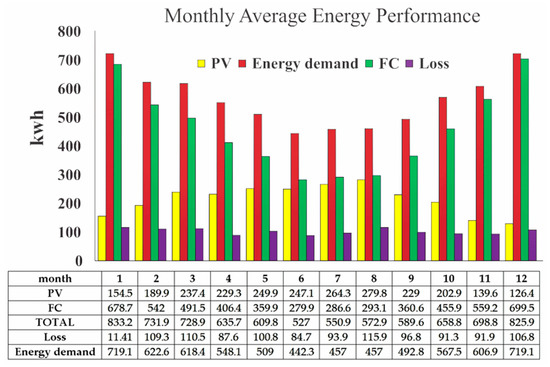
Figure 9.
Monthly average energy performance.
It is observed that the configured hybrid power generation system delivered an amount of electricity that fully covered the energy demand at the consumer level, and there were no periods with uncovered charges throughout the year. The advantage of combining the two types of alternative energies completely eliminated the deficiencies due to the intermittent availability of solar irradiation, especially that of alternating day/night, due to the fact that hydrogen is constantly delivered through the centralized network, and thus, the disadvantage of electricity production by RES disappeared, but the issue of the nonuniform nature of power generation for 24 h remains valid.
For the analyzed system, the most unfavorable situation was found during December, when it was observed that the energy demand had a maximum value and the level of solar irradiation was minimal; the most favorable situation, by contrast, occurred in June when the energy demand was minimal, and the availability of solar energy was maximum.
Table 5 shows the detailed results obtained for a day in December regarding the most unfavorable situation, and the values are graphically illustrated in Figure 10.
Table 5.
Hourly values of energy indicators recorded for one day in December.
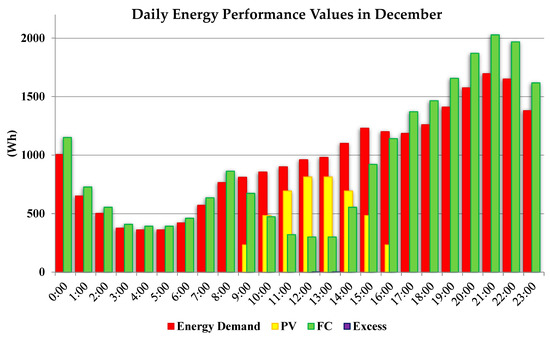
Figure 10.
Diagram of energy performance obtained for one day in December.
For this period, the solar irradiation was available between 9:00 a.m. and 5:00 p.m., during which PV manufactured electricity for the green building depending on the availability of the sun and the capacity of the equipment; from the data provided in the table, 16.65% of the demand was provided by these components, the remaining 83.35% being delivered by the fuel cell.
It was also observed that the fuel cell worked permanently throughout the day, ensuring the support of 100% energy demand, except for the time interval 9:00–17:00, described above.
At the same time, there was an extremely small amount of excess energy in the case of overlapping energy production from the two alternative sources, which can be exported to the electricity grid or used in other practical applications; the excess energy occurred between 12:00 and 2:00 p.m. when the maximum of the solar irradiation characteristic of the studied period was also registered.
Table 6 shows the detailed results obtained for one day in June regarding the most favorable situation.
Table 6.
Hourly values of energy indicators recorded for one day in June.
In a summer month, solar irradiation was available between 6:00 a.m. and 9:00 p.m., with a maximum achieved during the time interval 11:00 a.m.–5:00 p.m. period in which the photovoltaic panels generated electricity for the green building consumer. It was also observed that the fuel cell did not work during this period. During 24 h, the fuel cell operated for 19 h in this case, providing 100% of the energy demand during the night and part of the energy in the time interval 6:00–11:00 and 17:00–21:00 when solar irradiation decreased in intensity. Additionally, an amount of excess energy was observed during the day when the maximum solar irradiation was recorded, as well as in the case of overlapping energy production from the two alternative sources, but in a smaller amount, for a relatively short time of 3 h.
For a better view of the data obtained and analyzed previously, they were graphically illustrated in Figure 11.
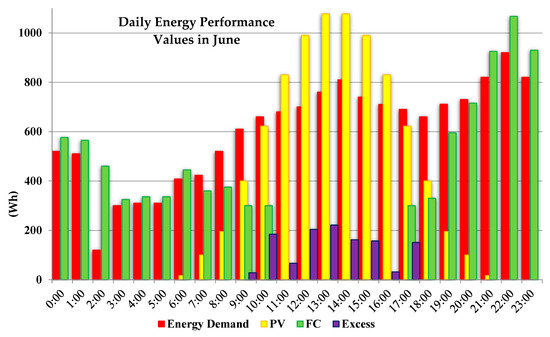
Figure 11.
Energy performance diagram obtained for one day in June.
It can be argued, in this case, that the values of energy performance indicators are directly influenced not by the degree of availability of solar irradiation during a year of operation, but by the fact that the fuel cell uses hydrogen, an alternative energy source, constantly delivered by the centralized distribution network in a future hydrogen-based economy, thus obtaining a 100% autonomous system, compared to the national electricity network. The hourly hydrogen consumption within the analyzed energy system is presented in Figure 12.
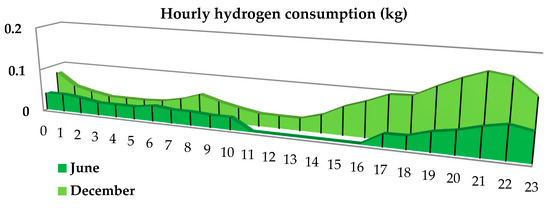
Figure 12.
Hydrogen consumption schedule in June and December.
For one day in December, 1.654 kg of hydrogen was required to ensure the energy demand of the building. For one day in June, the building needed 58.10% less hydrogen and 0.693 kg of hydrogen, respectively.
3.2. Environmental Analysis
Taking into account the fact that for a residential building in Romania, an average carbon footprint of 5.23 tons CO2/year resulting from household energy consumption was calculated [61,62], the analyzed green building supplied by the PV–FC hybrid energy system generated CO2 emissions equal to 11.72% of the average value computed for a standard residential building supplied with power by traditional electricity from the grid (Figure 13).
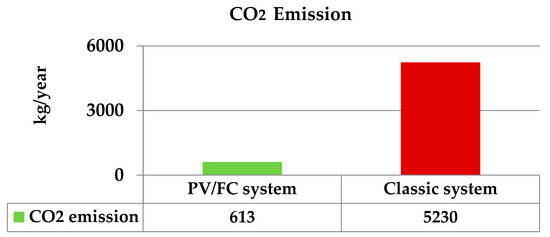
Figure 13.
CO2 performance diagram.
3.3. Economic Analysis
Table 7 summarizes information on the financial aspects that characterize this type of energy system; the centralized data are as follows: initial investment, the total cost for a life of 25 years, cost of component equipment, the unit price of energy, other costs of generating the inflation rate, the discount rate, interest rates, etc. [63]. In addition, the description of this hypothesis includes the cost of purchasing hydrogen, the fuel for the fuel cell, which is delivered to the consumer through the distribution network supposed to exist within a hydrogen infrastructure in a future hydrogen-based economy, and the tariff of the purchase price was considered 3 EUR/kg H2 purchased.
Table 7.
System costs.
The costs of the component equipment of the system, along with the costs associated with the acquisition of hydrogen, are illustrated as percentages in Figure 14. At 25 years of operation, it was found that the largest share in the cost diagram was held by the fuel cell, the equipment for converting hydrogen into electricity, which was 67.20%. This share of total expenditures was followed by the costs of purchasing hydrogen fuel necessary for electricity generation, with a value of 22.87%.
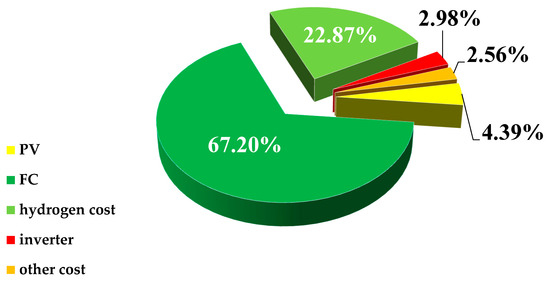
Figure 14.
Financial indicators of the system.
A relatively small share of 4.39% was obtained for photovoltaic panels—the technology for converting solar energy into electricity.
Hydrogen-based electricity generation technology, as well as hydrogen production, storage, and distribution methods, are in continuous research and development, and since a number of pilot projects currently underway in this field will be validated, it is expected that in the near future, this equipment, and hydrogen fuel, in general, will decrease costs, gaining a competitive advantage against other technologies in the field of energy production and storage.
4. Conclusions
In the hypothesis studied in this case study, the optimally configured system energetically supported 100% of the green building consumer, the subject of the study, generating carbon dioxide emissions of 11.72% of the average value calculated for a conventional energy system in a standard residential building, photovoltaic panels achieving 32% of the annual electricity production, and the fuel cell generating the remaining 68% of the total annual energy production of the system with a hydrogen consumption of 403.5 kg/year, operating 7720 h/year.
Following the computational simulations and the analysis of the results on the energy and financial performance of the electricity generation system, the hypothesis of supplying energy to the green building through a hybrid system consisting of photovoltaic panels for the conversion of solar energy and the fuel cell that consumes the delivered hydrogen was validated. Using the distribution network for electricity generation, in which hydrogen production is outsourced and independent of the power generation system, leads to the conclusion that fuel cell technology is a promising solution for supporting the energy demands of green building consumers, with high efficiency and low carbon emissions, in a future hydrogen-based economy.
The implementation and public acceptance of hydrogen technology depend largely on the development of this technology and the infrastructure necessary for safe operation as well as on the reduction of global costs of this type of alternative energy.
Quantifying the main research findings of this study, the following future research directions will be considered as topics to be addressed in future dedicated works:
- Validation of the present research findings by comparison with results obtained from virtual simulations with OPAL-RT technology that works with PC/FPGA-based real-time simulators, hardware-in-the-loop (HIL) testing equipment, and rapid control prototyping (RCP) systems to design, test, and optimize control and protection systems used in power grids;
- Economical features are extremely important in the implementation of green energy systems. While photovoltaic panels are gaining extensive practical applicability, the prices of this technology are already decreasing, whereas hydrogen fuel cell technologies have still high prices. Green Deal European Strategies encourage and influence the development of renewable energies domain and their implementation in all sectors. In this sense, an interesting future research direction to address is the impact analysis of EU directives and government incentives in supporting the hydrogen and fuel cell industry players;
- The social component, as an essential pillar of sustainability, leads imperatively to the elaboration of some studies to outline the societal perception, viability, and public acceptance of the use of new technologies, especially of hydrogen, as an alternative energy resource in the regional transition to sustainable and ecological energy generation systems based on green energies.
Author Contributions
Conceptualization, R.-A.F., I.A., and N.C.; methodology, R.-A.F. and N.C.; software, R.-A.F., A.M.B., and M.S.R.; validation, R.-A.F., N.C., A.M.B., and M.S.R.; formal analysis, R.-A.F., I.A., N.C., A.M.B., and M.S.R.; investigation, R.-A.F., N.C., A.M.B., and M.S.R.; resources, R.-A.F., I.A., N.C., A.M.B., and M.S.R.; data curation, R.-A.F., I.A., and N.C.; writing—original draft preparation, R.-A.F. and A.M.B.; writing—review and editing, N.C. and M.S.R.; visualization, R.-A.F. and I.A.; supervision, R.-A.F.; project administration, R.-A.F. All authors have read and agreed to the published version of the manuscript.
Funding
This research received no external funding.
Institutional Review Board Statement
Not applicable.
Informed Consent Statement
Not applicable.
Acknowledgments
This work was supported by a grant from the Romanian Ministry of Research and Innovation, CCCDI-UEFISCDI, project number PN-III-P1-1.2-PCCDI-2017-0776/No. 36 PCCDI/15.03.2018, within PNCDI III. Acknowledgments to the National Center for Hydrogen and Fuel Cells (CNHPC)—Installations and Special Objectives of National Interest (IOSIN).
Conflicts of Interest
The authors declare no conflict of interest.
References
- Ghenai, C.; Salameh, T.; Merabet, A. Technico-economic analysis of off grid solar PV/Fuel cell energy system for residential community in desert region. Int. J. Hydrog. Energy 2020, 45, 11460–11470. [Google Scholar] [CrossRef]
- Ren, H.; Wu, Q.; Gao, W.; Zhou, W. Optimal operation of a grid-connected hybrid PV/fuel cell/battery energy system for residential applications. Energy 2016, 113, 702–712. [Google Scholar] [CrossRef]
- Ishaq, H.; Dincer, I. Performance investigation of adding clean hydrogen to natural gas for better sustainability. J. Nat. Gas Sci. Eng. 2020, 78, 103236. [Google Scholar] [CrossRef]
- Al-Hamed, K.H.M.; Dincer, I. Natural gas as a transitional solution for railway powering systems: Environmental and economic assessment of a fuel cell based powering system. J. Nat. Gas Sci. Eng. 2020, 80, 103347. [Google Scholar] [CrossRef]
- Ishaq, H.; Dincer, I. The Role of Hydrogen in Global Transition to 100% Renewable Energy. In Accelerating the Transition to a 100% Renewable Energy Era. Lecture Notes in Energy; Uyar, T., Ed.; Springer: Cham, Switzerland, 2020; Volume 74. [Google Scholar] [CrossRef]
- Jamshidi, M.; Askarzadeh, A. Techno-economic analysis and size optimization of an off-grid hybrid photovoltaic, fuel cell and diesel generator system. Sustain. Cities Soc. 2019, 44, 310–320. [Google Scholar] [CrossRef]
- Bukar, A.L.; Tan, C.W. A review on stand-alone photovoltaic-wind energy system with fuel cell: System optimization and energy management strategy. J. Clean. Prod. 2019, 221, 73–88. [Google Scholar] [CrossRef]
- Siddiqui, O.; Dincer, I. Design and transient analyses of a new renewable energy system for multigeneration of power, heat, hydrogen and ammonia. J. Clean. Prod. 2020, 270, 122502. [Google Scholar] [CrossRef]
- Luta, D.N.; Raji, A.K. Energy management system for a remote renewable fuel cell system. In Proceedings of the 2019 International Conference on the Domestic Use of Energy (DUE), Wellington, South Africa, 25–27 March 2019; pp. 20–24. [Google Scholar]
- Gharibi, M.; Askarzadeh, A. Size and power exchange optimization of a grid-connected diesel generator-photovoltaic-fuel cell hybrid energy system considering reliability, cost and renewability. Int. J. Hydrog. Energy 2019, 44, 25428–25441. [Google Scholar] [CrossRef]
- Bizon, N. Efficient fuel economy strategies for the Fuel Cell Hybrid Power Systems under variable renewable/load power profile. Appl. Energy 2019, 251, 113400. [Google Scholar] [CrossRef]
- Krishan, O.; Suhag, S. Grid-independent PV system hybridization with fuel cell-battery/supercapacitor: Optimum sizing and comparative techno-economic analysis. Sustain. Energy Technol. Assess. 2020, 37, 100625. [Google Scholar] [CrossRef]
- Samy, M.M.; Barakat, S.; Ramadan, H.S. Techno-economic analysis for rustic electrification in Egypt using multi-source renewable energy based on PV/wind/FC. Int. J. Hydrog. Energy 2020, 45, 11471–11483. [Google Scholar] [CrossRef]
- Temiz, M.; Javani, N. Design and analysis of a combined floating photovoltaic system for electricity and hydrogen production. Int. J. Hydrog. Energy 2020, 45, 3457–3469. [Google Scholar] [CrossRef]
- Kamel, A.A.; Rezk, H.; Shehata, N.; Thomas, J. Energy Management of a DC Microgrid Composed of Photovoltaic/Fuel Cell/Battery/Supercapacitor Systems. Batteries 2019, 5, 63. [Google Scholar] [CrossRef]
- Ellahi, M.; Abbas, G.; Khan, I.; Koola, P.M.; Nasir, M.; Raza, A.; Farooq, U. Recent approaches of forecasting and optimal economic dispatch to overcome intermittency of wind and photovoltaic (PV) systems: A review. Energies 2019, 12, 4392. [Google Scholar] [CrossRef]
- Rezk, H.; Kanagaraj, N.; Al-Dhaifallah, M. Design and Sensitivity Analysis of Hybrid Photovoltaic-Fuel-Cell-Battery System to Supply a Small Community at Saudi NEOM City. Sustainability 2020, 12, 3341. [Google Scholar] [CrossRef]
- Bizon, N.; Thounthong, P. Energy efficiency and fuel economy of a fuel cell/renewable energy sources hybrid power system with the load-following control of the fueling regulators. Mathematics 2020, 8, 151. [Google Scholar] [CrossRef]
- Bizon, N.; Stan, V.A.; Cormos, A.C. Optimization of the Fuel Cell Renewable Hybrid Power System using the control mode of the required load power on the DC bus. Energies 2019, 12, 1889. [Google Scholar] [CrossRef]
- Valencia, G.; Benavides, A.; Cárdenas, Y. Economic and environmental multiobjective optimization of a wind–solar–fuel cell hybrid energy system in the colombian caribbean region. Energies 2019, 12, 2119. [Google Scholar] [CrossRef]
- Kosmadakis, I.E.; Elmasides, C.; Eleftheriou, D.; Tsagarakis, K.P. A techno-economic analysis of a pv-battery system in Greece. Energies 2019, 12, 1357. [Google Scholar] [CrossRef]
- Dawood, F.; Shafiullah, G.M.; Anda, M. Stand-alone microgrid with 100% renewable energy: A case study with hybrid solar PV-battery-hydrogen. Sustainability 2020, 12, 2047. [Google Scholar] [CrossRef]
- Singh, S.; Chauhan, P.; Aftab, M.A.; Ali, I.; Hussain, S.M.; Ustun, T.S. Cost Optimization of a Stand-Alone Hybrid Energy System with Fuel Cell and PV. Energies 2020, 13, 1295. [Google Scholar] [CrossRef]
- Wang, F.C.; Lin, K.M. Impacts of load profiles on the optimization of power management of a green building employing fuel cells. Energies 2019, 12, 57. [Google Scholar] [CrossRef]
- Jena, S.; Kar, S.K. Setting a fostered energy network by decarbonizing the grid: H ybridization, control, and future solutions upon storage. Int. J. Energy Res. 2019, 43, 455–474. [Google Scholar] [CrossRef]
- Arnaout, M.A.; Go, Y.I.; Saqaff, A. Pilot study on building-integrated PV: Technical assessment and economic analysis. Int. J. Energy Res. 2020, 44, 9538–9559. [Google Scholar] [CrossRef]
- Hosseini, M.; Dincer, I.; Rosen, M.A. Exergoeconomic analysis of a residential hybrid PV-fuel cell-battery system. Fuel Cells 2013, 13, 804–816. [Google Scholar] [CrossRef]
- Sedaghati, R.; Shakarami, M.R. Power sharing adaptive control strategy for a microgrid with multiple storage and renewable energy sources. Int. J. Adapt. Control Signal Process. 2018, 32, 1607–1628. [Google Scholar] [CrossRef]
- Alam, M.; Kumar, K.; Dutta, V. Design and analysis of fuel cell and photovoltaic based 110 V DC microgrid using hydrogen energy storage. Energy Storage 2019, 1, e60. [Google Scholar] [CrossRef]
- Amirkhalili, S.A.; Zahedi, A.R. Techno-economic analysis of a stand-alone hybrid wind/fuel cell microgrid system: A case study in Kouhin region in Qazvin. Fuel Cells 2018, 18, 551–560. [Google Scholar] [CrossRef]
- Tanaka, Y.; Fukushima, M. Optimal operation of residential fuel cell system with rapidly fluctuating energy demand. Electr. Eng. Jpn. 2011, 175, 8–17. [Google Scholar] [CrossRef]
- Ou, K.; Yuan, W.W.; Choi, M.; Kim, J.; Kim, Y.B. Development of new energy management strategy for a household fuel cell/battery hybrid system. Int. J. Energy Res. 2019, 43, 4686–4700. [Google Scholar] [CrossRef]
- Tai, X.Y.; Zhakeyev, A.; Wang, H.; Jiao, K.; Zhang, H.; Xuan, J. Accelerating fuel cell development with additive manufacturing technologies: State of the art, opportunities and challenges. Fuel Cells 2019, 19, 636–650. [Google Scholar] [CrossRef]
- Doi, Y.; Park, D.; Ishida, M.; Fujisawa, A.; Miura, S. Evaluation of Electrical Load Following Capability of Fuel Cell System Fueled by High-Purity Hydrogen. Electr. Eng. Jpn. 2014, 186, 37–47. [Google Scholar] [CrossRef]
- Darko, A.; Chan, A.P.; Huo, X.; Owusu-Manu, D.G. A scientometric analysis and visualization of global green building research. Build. Environ. 2019, 149, 501–511. [Google Scholar] [CrossRef]
- Cobîrzan, N.; Balog, A.A.; Belean, B.; Borodi, G.; Dădârlat, D.; Streza, M. Thermophysical properties of masonry units: Accurate characterization by means of photothermal techniques and relationship to porosity and mineral composition. Constr. Build. Mater. 2016, 105, 297–306. [Google Scholar] [CrossRef]
- Felseghi, R.A.; Carcadea, E.; Raboaca, M.S.; Trufin, C.N.; Filote, C. Hydrogen fuel cell technology for the sustainable future of stationary applications. Energies 2019, 12, 4593. [Google Scholar] [CrossRef]
- He, B.J.; Zhao, D.X.; Gou, Z. Integration of low-carbon eco-city, green campus and green building in China. In Green Building in Developing Countries; Springer: Cham, Switzerland, 2020; pp. 49–78. Available online: https://link.springer.com/chapter/10.1007%2F978-3-030-24650-1_4 (accessed on 25 January 2021).
- Cobîrzan, N.; Voinea, M.; Kopenetz, L.; Munteanu, C.; Balog, A.A.; Tămaş, F. Assessment of cost and embodied carbon for masonry structures located in low and high seismic zones. Procedia Eng. 2017, 181, 418–424. [Google Scholar] [CrossRef]
- Felseghi, R.A. Contributions Regarding the Application of Fuel Cells in the Passive House Domain. Ph.D. Dissertation, Technical University of Cluj-Napoca, Cluj-Napoca, Romania, 2015. [Google Scholar]
- Răboaca, M.S.; Felseghi, R.A. Energy Efficient Stationary Application Supplied with Solar-Wind Hybrid Energy. In Proceedings of the 2019 International Conference on Energy and Environment (CIEM), Timisoara, Romania, 17–18 October 2019; pp. 495–499. [Google Scholar] [CrossRef]
- Badea, G.; Felseghi, R.; Aschilean, I.; Bolboaca, A.; Muresan, D.; Soimosan, T.; Ștefanescu, I.; Raboaca, S. Energen system for power supply of passive house: Case study. In Proceedings of the 2015 Second International Conference on Mathematics and Computers in Sciences and in Industry (MCSI), Sliema, Malta, 17 August 2015; pp. 24–31. [Google Scholar] [CrossRef]
- Felseghi, R.A.; Papp, A. Considerations regarding hybrid systems of power generator from renewable energy sources. Stud. Univ. Babes-Bolyai Ambient. 2014, 59, 27–40. [Google Scholar]
- Badea, G.; Felseghi, R.A.; Răboaca, S.; Aşchilean, I.; Bolboacă, A.; Mureşan, D.; Moldovan, E.; Şoimoşan, T. Hybrid Solar and Wind Electric System for Romanian Nearly Zero Energy Buildings (nZEB)-Case Study. Appl. Mech. Mater. 2016, 841, 110–115. [Google Scholar] [CrossRef]
- Di Marcoberardino, G.; Chiarabaglio, L.; Manzolini, G.; Campanari, S. A Techno-economic comparison of micro-cogeneration systems based on polymer electrolyte membrane fuel cell for residential applications. Appl. Energy 2019, 239, 692–705. [Google Scholar] [CrossRef]
- Zhao, Y.; Jing, R.; Zhang, Z. Feasibility of solid oxide fuel cell stationary applications in China’s building sector and relevant progress. In Design and Operation of Solid Oxide Fuel Cells; Academic Press: Cambridge, MA, USA, 2020; pp. 359–393. [Google Scholar] [CrossRef]
- Energy Security Strategy and Energy Policy. Current Approaches in the European Union and Internationally. Available online: http://www.fnme.ro/ (accessed on 2 July 2020).
- European Parliament, Directive 2009/28/EC on the Promotion of the Use of Energy from Renewable Sources. Available online: https://eur-lex.europa.eu/LexUriServ/LexUriServ.do?uri=OJ:L:2009:140:0016:0062:en:PDF (accessed on 8 February 2021).
- European Environment Agency—EEA. Overview of Electricity Production and Use in Europe, Copenhagen, Denmark. 2019. Available online: https://www.eea.europa.eu/data-and-maps/indicators/overview-of-the-electricity-production-2/assessment-4 (accessed on 16 January 2021).
- Constantinescu, M.; Bucura, F.; Ionete, R.E.; Niculescu, V.C.; Ionete, E.I.; Zaharioiu, A.; Oancea, S.; Miricioiu, M.G. Comparative study on plastic materials as a new source of energy. Mater. Plast. 2019, 56, 41. [Google Scholar] [CrossRef]
- Dufo-López, R.; Bernal-Agustín, J.L. iHOGA PRO+ Software Version 2.5; Electrical Engineering Department, University of Zaragoza: Zaragoza, Spain, 2020; Available online: https://ihoga.unizar.es/ (accessed on 12 May 2020).
- Dufo-López, R. iHOGA Software Version 2.5.—User’s Manual; Electrical Engineering Department, University of Zaragoza: Zaragoza, Spain, 2020; Available online: https://ihoga.unizar.es/Desc/iHOGA%202.5%20User%20manual.pdf (accessed on 2 May 2020).
- Dufo-López, R. Dimensionado y Control Optimos de Sistemas Hibridos Aplicando Algoritmos Evolutivos. Ph.D. Thesis, Electrical Engineering Department, University of Zaragoza, Zaragoza, Spain, 2007. Available online: https://dialnet.unirioja.es/servlet/tesis?codigo=19604 (accessed on 12 May 2020).
- Bernal-Agustín, J.L.; Dufo-Lopez, R. Simulation and optimization of stand-alone hybrid renewable energy systems. Renew. Sustain. Energy Rev. 2009, 13, 2111–2118. [Google Scholar] [CrossRef]
- Dufo-López, R.; Bernal-Agustín, J.L. Multi-objective design of PV–wind–diesel–hydrogen–battery systems. Renew. Energy 2008, 33, 2559–2572. [Google Scholar] [CrossRef]
- Ruchpaul, R.S. Performance Comparison of three PV Technologies under the Effect of Partial Shading and Varying Tilt Angles. J. Electr. Eng. Electron. Control Comput. Sci. 2020, 6, 9–18. Available online: https://mail.jeeeccs.net/index.php/journal/article/view/166 (accessed on 18 February 2021).
- Methodology for Calculating the Energy Performance of Buildings—Mc 001/2-2006, Romanian Ministry of Transport, Construction and Tourism, Official Monitor, Part I-126bis. 2007. Available online: https://www.mlpda.ro/userfiles/reglementari/Domeniul_XXVII/27_11_MC_001_1_2_3_2006.pdf (accessed on 2 May 2020).
- Kom, C.H. Understanding Interphase Power Controller: A Description. J. Electr. Eng. Electron. Control Comput. Sci. 2020, 6, 19–24. Available online: https://mail.jeeeccs.net/index.php/journal/article/view/153/130 (accessed on 18 February 2021).
- Shahzad, U. Resilience in Electric Power Systems. J. Electr. Eng. Electron. Control Comput. Sci. 2020, 7, 1–6. Available online: https://mail.jeeeccs.net/index.php/journal/article/view/202 (accessed on 21 February 2021).
- NASA Surface Meteorology and Solar Energy: RETScreen Data. Available online: https://eosweb.larc.nasa.gov/sse/ (accessed on 14 December 2019).
- European Environment Agency. About Climate Change. Available online: https://www.eea.europa.eu/ro/themes/climate/about-climate-change (accessed on 2 February 2021).
- European Parliament. Greenhouse Gas Emissions by Countries and Sectors. Available online: https://www.europarl.europa.eu/news/en/headlines/society/20180301STO98928/greenhouse-gas-emissions-by-country-and-sector-infographic (accessed on 12 May 2020).
- National Regulatory Authority for Energy. Raport Anual Privind Activitatea Autorităţii Naţionale de Reglementare în Domeniul Energiei. February 2018. Available online: https://www.anre.ro/ro/despre-anre/rapoarte-anuale (accessed on 17 June 2020).
Publisher’s Note: MDPI stays neutral with regard to jurisdictional claims in published maps and institutional affiliations. |
© 2021 by the authors. Licensee MDPI, Basel, Switzerland. This article is an open access article distributed under the terms and conditions of the Creative Commons Attribution (CC BY) license (https://creativecommons.org/licenses/by/4.0/).