Article

Development of a Mosque Design for a Hot, Dry Climate Based on a Holistic Bioclimatic Vision

by
Atef Ahriz
1,
Abdelhakim Mesloub
2,
Khaled Elkhayat
2,
Mohammed A Alghaseb
2,
Mohamed Hassan Abdelhafez
2,3 and
Aritra Ghosh
4,*
1
Department of Architecture, University of Tebessa, Constantine Road, Tebessa 12000, Algeria
2
Department of Architectural Engineering, College of Engineering, University of Hail, Hail 2240, Saudi Arabia
3
Department of Architectural Engineering, Faculty of Engineering, Aswan University, Aswan 81542, Egypt
4
Colleges of Engineering, Mathematics and Physical Sciences, Renewable Energy, University of Exeter, Cornwall TR10 9FE, UK
*
Author to whom correspondence should be addressed.
Sustainability 2021, 13(11), 6254; https://doi.org/10.3390/su13116254
Submission received: 26 April 2021 / Revised: 25 May 2021 / Accepted: 28 May 2021 / Published: 1 June 2021

Abstract

:
Over 50% of the total energy consumed by buildings in a hot and dry climate goes toward the cooling regime during the harsh months. Non-residential buildings, especially houses of worship, need a tremendous amount of energy to create a comfortable environment for worshipers. Today, mosques are regarded as energy-hungry buildings, whereas in the past, they were designed according to sustainable vernacular architecture. This study was aimed at improving the energy performance of mosques in a hot and dry climate using bioclimatic principles and architectural elements. To achieve this aim, a process-based simulation approach was applied together with a generate and test technique on 86 scenarios based on 10 architectural elements, with various arithmetic transition rates organized in 9 successive steps. Starting from a simplified hypothetical model, the final model of the mosque design was arrived at based on a holistic bioclimatic vision using 10 architectural elements. The findings of this research were limited to a specific mosque size in a hot and dry climate, but the proposed holistic bioclimatic concept can be developed to take into account all mosque models in several harsh environments.

1. Introduction

Factors affecting global energy consumption in the building sector include changes in the population, area, demand for energy services (e.g., more appliances and cooling equipment), weather variations, and how buildings are built and used. From 2010 to 2018, global electricity use in buildings rose by over 19%. Globally, higher end-use energy consumption due to significantly higher electricity consumption for space cooling, appliances, and hot water leads to increased greenhouse gas emissions [1,2]. Since energy-saving challenges differ depending on the main purpose of the building, the energy consumption pattern, and operating schedules, therefore, frameworks should be considered for each category of building. One of the most iconic buildings in Islamic countries are mosques, which are religious worshipping buildings for Muslims that could also serve as multifunctional community spaces. Besides the significant role that mosques play in shaping society, mainly through religious activities, they have, as a building, a very particular energy consumption scheme and occupancy schedule [3]. The number of mosques around the world exceeded 3.6 million in 2015. This subject interested many researchers that studied different aspects of mosques, such as indoor comfort, energy consumption, and impact on sustainability [4,5].
Mosques are known by different definitions, some of which speak about their position and some of their functions, while some describe them lexically, semantically, and legitimately (SHARIA). One of the simplest definitions that is of interest to architects is the definition by Hassan [6], who says, “it is God’s house, intended for worshipping God, gathering for performances, education and guidance, and regardless of the public functions that mosques provide to the nation, their main function is prayer.”
Mosques have had various architectural forms throughout history, but their shape and composition have not deviated from the first lesson in the history of the Prophet’s Mosque in Madinah. Even if throughout history designers have mastered the various forms of mosques (their mihrab, patios, minbar, and corridors), their context has remained the same. According to Khalil [7], there are seven architectural forms of mosques, depending on their historic antiquity: Moorish, Andalusian, Egyptian, Seljuk, Indian, Safavid, and Ottoman. However, other studies by Hillenbrand, Al-Harithy, and Asfour [7,8,9,10] have classified the architecture of mosques according to their shape into Arab, Persian, and Ottoman mosques, while other classifications are variations based on geographical, climatic, and cultural conditions.
Arab Mosques: The first model of this mosque to ever appear was the Prophet’s Mosque. They are also called Baptist mosques due to their reliance on a structured system. These mosques were famous for their huge patio, with a covered prayer hall adjacent to it, and over time, several forms of domes, minarets, and covered galleries were attached to them. The mosques of the Umayyad, Abbasid, Maghreb, and Egyptian periods are considered as famous examples and witnesses of the Arab model [7,11]. Persian Mosques: The Persian model became popular in the eastern part of the Islamic world, especially during the reign of the Seljuks and Safavids. At first, the Persian mosques were a copy of the Arab mosques, but the Persians kept developing and modifying their mosques to distinguish them, such as by adding a vaulted room or dome above the mihrab, and an iwan at the entrance to the prayer hall. After that, several variations appeared, such as the use of a pair of minarets instead of one and changing the number and location of the iwan [10,11]. Ottoman Mosques: Ottoman mosques are considered a quantum leap in architectural history, either in terms of their shape or style. Unlike the mosques that preceded them, Ottoman mosques relied on a system of domes, half domes, or quarter domes in the roofing of the prayer hall, as well as on multiple tall minarets. Therefore, such mosques consisted of huge covered prayer halls with a large and harmonious number of domes [11]. Modern and Contemporary Mosques: All the mosque models and variations that have been discussed so far are those that were built before the Islamic world came into contact with the West. However, Islamic creativity was interrupted and remained dormant for about two centuries with the emergence of colonialism. In the twentieth century, and with the beginning of a wave of liberation from Western colonialism, the wheels of creativity began to turn again, but with new forms. The most famous forms came from those who extolled the glories of the past without a vision of the present or the future, those who nailed the past to the wall and called for contemporary mosque architecture, and those who fell into the trap of eclectic architecture. There were many such forms, where mosques were composed of many elements, with each one belonging to a specific style and period [12]. However, no matter what happens, the image of the mosque remains firmly rooted in domes, minarets, and patios [11,13].
In the last years, several studies were conducted in the field of improving the energy performance of buildings based on the principles of the bioclimatic architecture. Some of them return to the vernacular architecture [14], others talk about a future vision of the bioclimatic architecture based on reviews [15], while others refer to valuable old techniques and strategies [16]. Despite the bioclimatic housing design, which is the most important item in the field of bioclimatic architecture, several studies speak about the applications of the bioclimatic approach on several buildings’ types. Martinez, Duarte [17] speaks about improving the environmental quality in educational buildings, Tsala and Koronaki [18] talk about strategies of saving energy in a campus building in Athene, while Erebor, Ibem [19] takes into account the application on the energy efficiency in office buildings. Mousavi Motlagh, Sohani [20] present, in a valuable review of research, a wide review on economically feasible plans for green, comfortable, and energy-efficient buildings, touching directly on the principals of the bioclimatic architecture, where the author collects several recent works on the bounding optimization field treating several building types as well as community centers, tourist center, rest areas, university, museums, and much more. Furthermore, based on a strong review, the author divided the building optimization process into two main categories: the single-objective optimization (SOO) and multi-objective optimization (MOO). Finally, a list of the different aspects influencing the optimization process is established into nine aspect families: (a) energy consumption, containing 13 indicators, (b) thermal comfort, containing 8 indicators, (c) economic benefits, containing 9 indicators, (d) visual comfort, containing 5 indicators, (e) environmental impact, containing 5 indicators, and (f) other general aspects rarely studied and applied, including the shape, artwork preservation risk, aesthetic perception, and the water consumption, all containing 6 sub-indicators.
In the same way, several researchers have talked about the mosque and how we can apply the bioclimatic principles in the mosque’s design for improving its energy performance, where Asfour [21] talked about the effects of architectural style on the thermal performance of mosques, and the role of the general shape of mosques in providing thermal comfort to worshipers, while Cook [22] spoke in the same context about passive cooling and how it can be achieved through the shape of the mosque. Mahmoud [23] presented an extensive study on the development of the thermal performance of mosques in Saudi Arabia. The study was based on extracting the mosque elements that control thermal modifications, namely, the building materials, number of halls, ventilation system, lighting systems, and so on, and then, adopting an accurate mathematical analysis. Shohan et al. [24] studied the effects of the mosque building envelope on gains in solar energy. The same authors in another work [25] presented a detailed evaluation of the energy performance of mosque buildings by studying 20 different mosque sizes. Meanwhile, Samiuddin et al. [26] talked about comfort in high-occupancy spaces and used mosque buildings as an example.
It is an accepted fact that the major components of a mosque are the prayer hall, patios, domes, and minarets. However, this study discussed the other details and precise components that control the thermal comfort or increase the thermal performance of mosques, which are classified as in Table 1.
From this intellectual standpoint, and based on the fact that prayer demands reverence, a mosque must be designed to provide all the necessary conditions for comfort, be it sensual, psychological [27], acoustic [28,29], visual, or thermal [30,31], with the last being considered as the most important and worthwhile one to be studied since it is one of the key factors, if not the main factor, that helps people to perform their prayers and Sunnah in comfort and with reverence. This comfort, which can be easily achieved by artificial and technical means, has led mosques to be considered as energy-hungry buildings, thereby contradicting the basics of bioclimatic architecture [32,33] and the principles of sustainability, such as smart materials [34], renewable energies [35,36], control, and smart use of space [3,
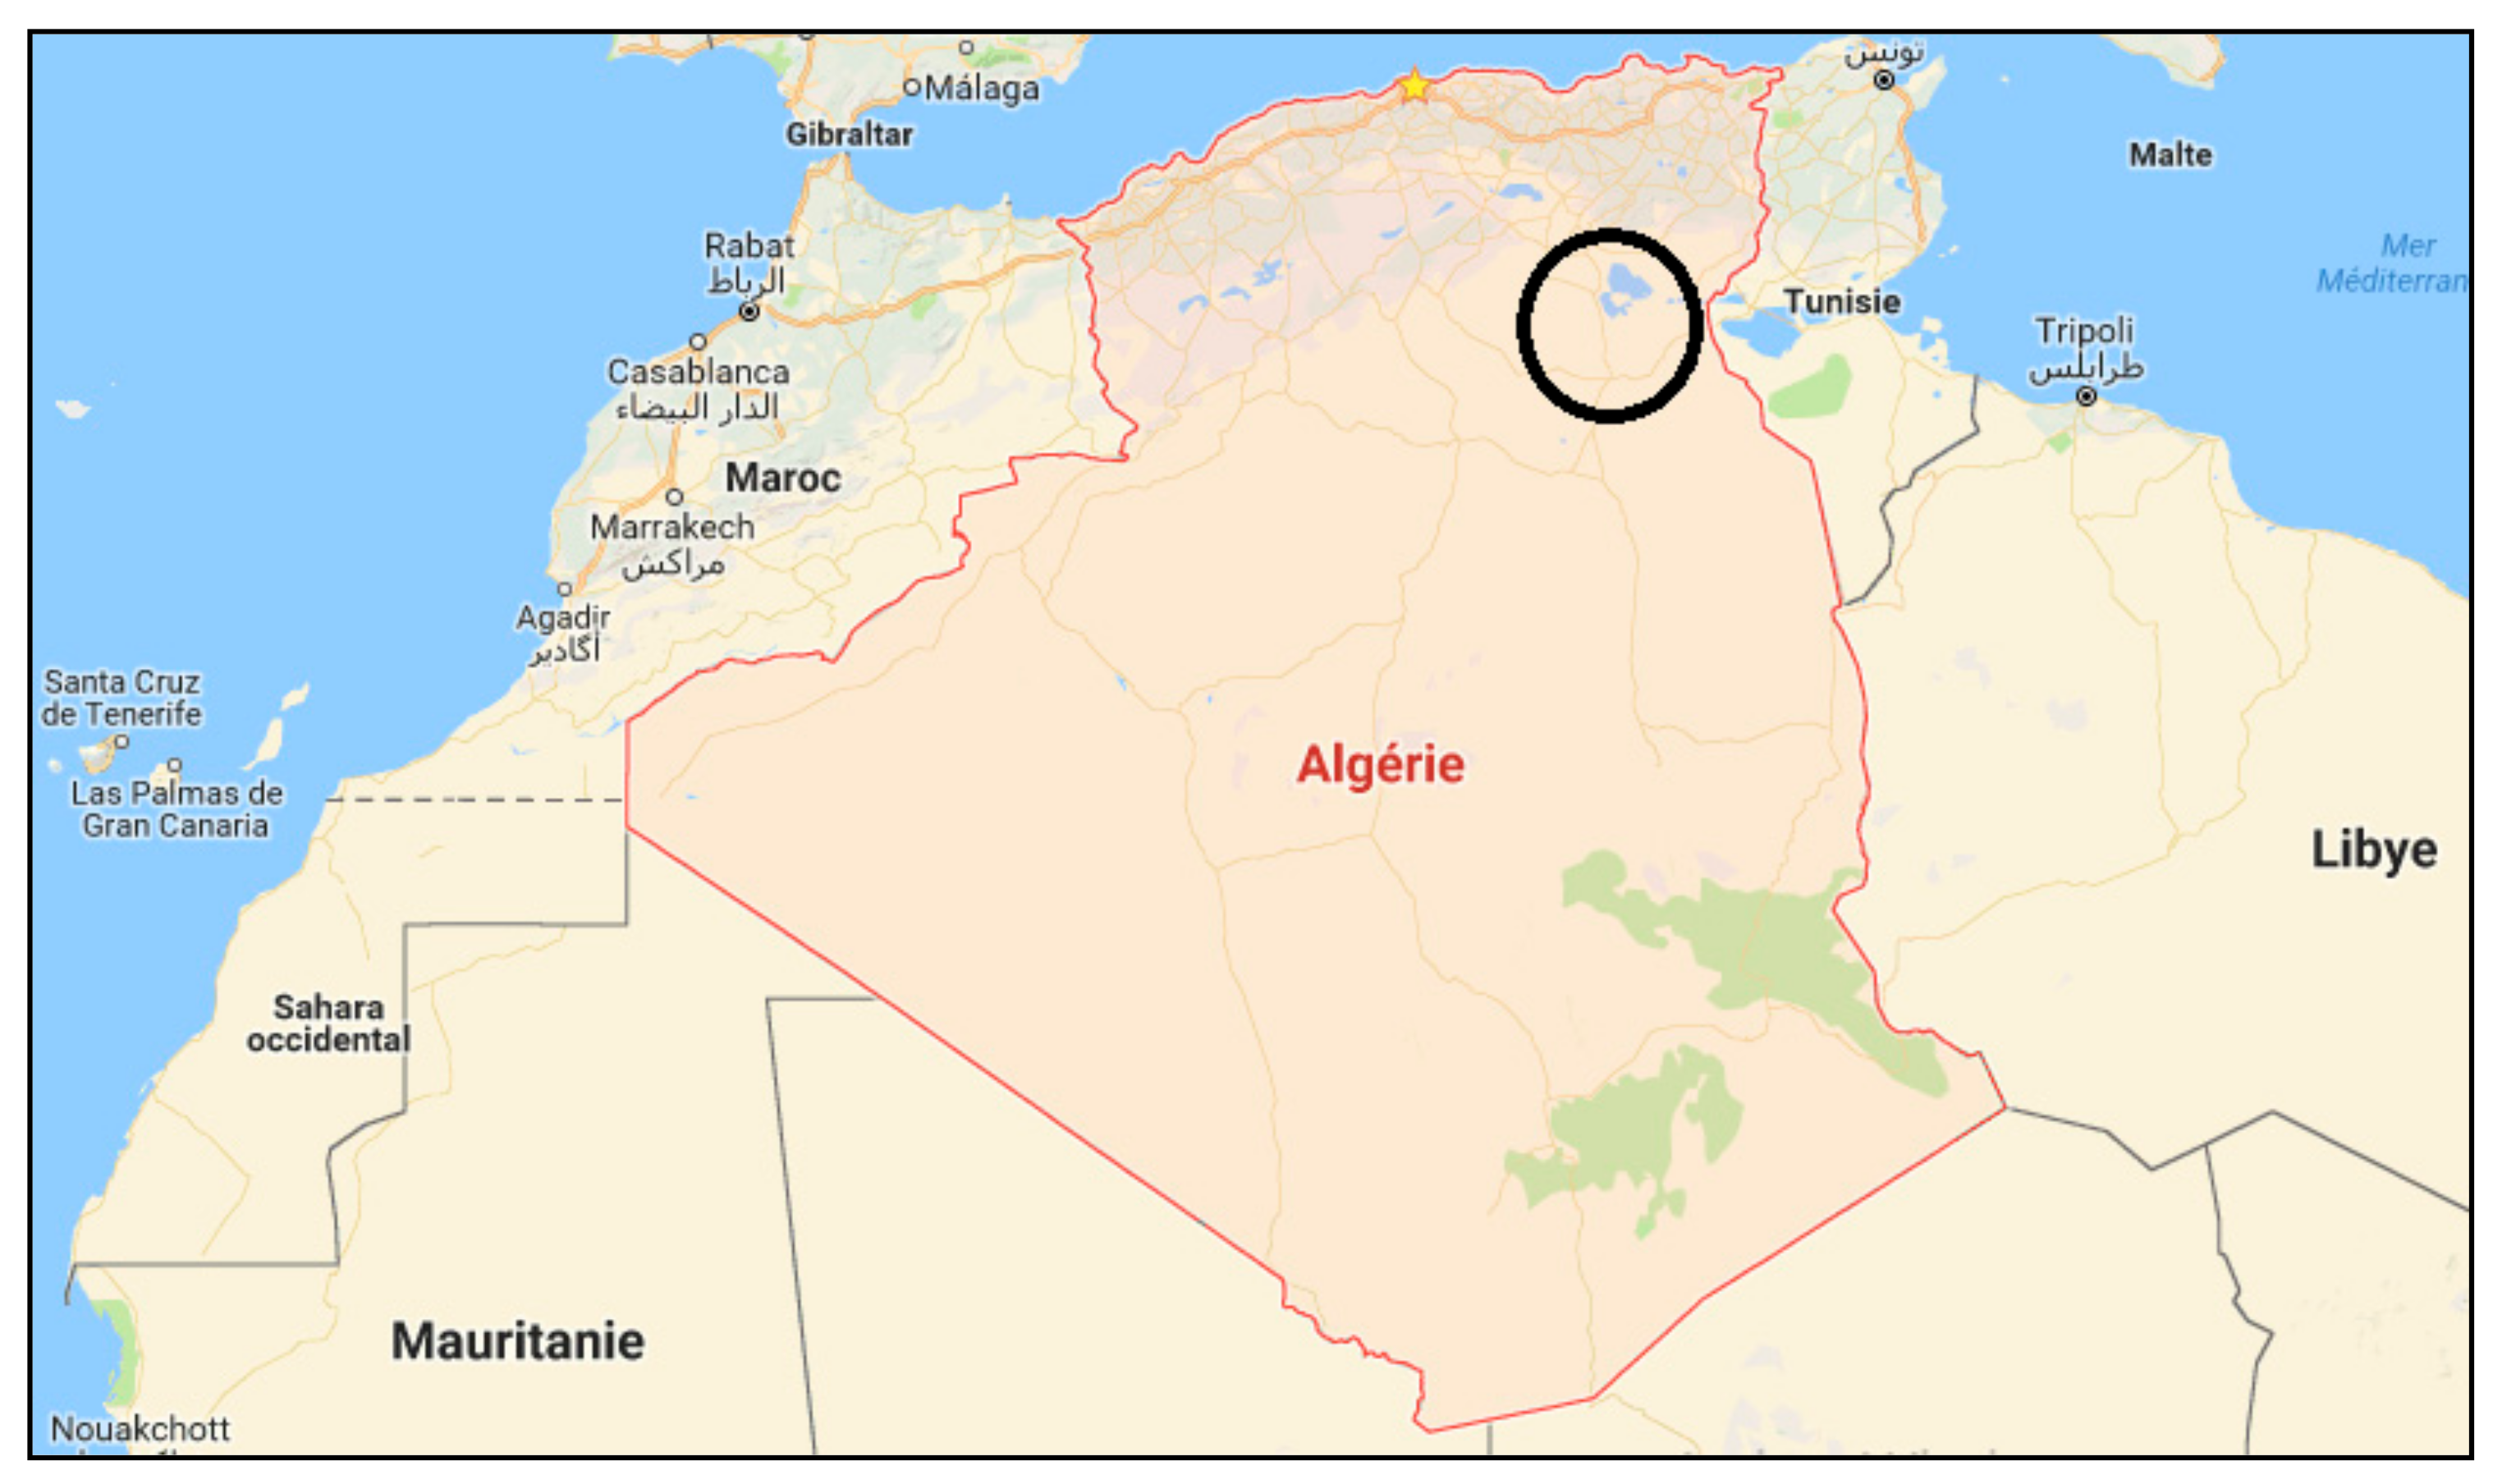
37]. Therefore, this research aimed to apply the principles of sustainability, which is considered one of the ethical messages of Islam, by trying to improve the energy performance of mosques and providing thermal comfort using conceptual methods and design solutions. Furthermore, an attempt was made to apply this study to a hot and dry climate, which is prevalent in most of the Islamic countries in general, and North Africa and the Arabian Peninsula in particular. These countries are distinguished by their harsh and hot climate, where it was noticed that the mosques there had been typically designed with only the functional, structural, and aesthetic aspects in mind, while forgetting the climatic aspect, thereby leaving the provision of thermal comfort to purely technical solutions.
Therefore, the following scientific questions were asked:
  • How far can the energy performance of mosques be improved and thermal comfort be provided inside mosques in hot and dry regions before resorting to technical solutions?
  • What are the architectural elements that constitute mosques and control their thermal comfort in a hot and dry climate?
The main aim of this research was to conduct a numerical and quantitative assessment of how far thermal comfort can be provided in mosques and their energy performance can be improved in a hot and dry climate to help designers make design decisions.

2. Research Method: The OVAT Sensitivity Analysis Method Coupled with the Process-Based Simulation

This study is based on a coupled method between two of the most valuable methods in the field of building design and simulation tools, which are the sensitivity analysis method coupled with the process-based simulation

2.1. Sensitivity Analysis

Sensitivity analysis is a valuable tool for observational studies in buildings and energy simulations to help the design decision-making for bioclimatic and climate-responsive design [38,39]. Sensitivity analysis has been largely applied to explore the parameters of building thermal performance in several applications, such as the impact of climate change on buildings [40], building stock [41], building retrofits [42], calibration of energy models [43] and building design [44].
Sensitivity analysis in building performance analysis is based on two methods, the local sensitivity analysis and the global sensitivity analysis. The local sensitivity analysis belongs to the OVAT method (One-Variable-At-a-Time) [45], which is the same method used in the process-based simulation where the sensitivity is calculated when one variable is changed and the other parameters are fixed [38]. The global sensitivity analysis is widely used in detailed energetic studies based on several methods, such as the regression method, screening-based method, variance-based method, and the meta-model-based method [38]. In this research, we will apply the local sensitivity analysis due to several points: (a) it is based on the OVAT method, which utilizes the same method for the process-based simulation and the generate and test technique, (b) due to its apparent advantages, (c) because it is very straightforward compared to the global sensitivity analysis, and (d) because it is easily applied and interpreted.
The methodology for sensitivity analysis is the same method as in the process-based simulation coupled with the generate and test technique, starting by determining input parameters’ variation, then creation of the building model, run the model simulation, collect the simulation results, run sensitivity analysis, and presentation of the sensitivity analysis [38]. All these steps are respectively applied in this research, from the selection of the method to the detailed sensitivity analysis of the discomfort index for the three periods: the hot period, cold period, and global period.

2.2. Process-Based Simulation

The experimental process of this study was dependent on the OVAT method coupled with the process-based simulation using the Autodesk Ecotect Analysis software, where the climatic behavior of a mosque was simulated from the beginning of its design until the end. At each design step, we appeal to the generate and test technique, where trials and tests were performed on several cases until the optimal state was reached, before proceeding to the next step and so on, until the final step was reached and the final model was completed (Figure 1) [46].
Three basic steps in the process were necessary to achieve this aim: the first step was the creation of the hypothetical basic model, and the underlining of all the fixed and variable parameters to be tested, the second step was the digital simulation process to achieve the results, and the last step was the interpretation and analysis of the results to create the final form and to highlight the general recommendations (Figure 2).

3. Case Study

For this research, the Righ Valley Region was chosen as a case study model of regions with a hot and dry climate. This region, which is considered as an oasis in the northeast of the Algerian Sahara, extends linearly from south to north for a distance of approximately 170 km between latitudes 32.54 °N and 34.9 °N (Figure 3) [47]. Today, the Righ Valley is divided into three large palm groves, namely, El Meghaier in the north, Djamaa in the center, and Touggourt in the south, covering an area of more than 50,000 hectares and containing more than 4,000,000 palms, making it one of the largest palm groves in the Sahara and the world.
Righ valley has a hot desert climate (Köppen climate classification BWh), with long, extremely hot summers, and short, warm winters [48]. According to the global meteorological database METEONORM [49], over the course of the year, the temperature typically varies from 5 to 41 °C and is rarely below 2 or above 45 °C, with a total annual rainfall around 69 mm and especially dry summers. The average hourly wind speeds in Righ valley experience mild seasonal variation over the course of the year, varying between 2.5 m/s in November and 4.01 m/s in May. Ahriz [46] presents a detailed climatic analysis based on valuable bioclimatic indices, where the rainfall quotient of Emberger gives a Q2 rate of about 6.57, with a desert climate with a moderate winter, Aridity index of De Martonne gives an I value of 2.14, which means a hyper-arid region, and finally, Bagnouls and Gaussen ombrothermic index (BGI) gives a BGI value of 512, which also mean a hyper-arid region (Figure 4).

4. Experimental Model and Analysis Parameters

To achieve the most accurate details and results, a set of the general variables mentioned above, such as the climate control elements, was underlined and organized from outside to inside, from general to specifics, as follows and summarized in Table 2:
(a)
Orientation: According to its astronomical position, the direction of the qibla in the region of the Righ Valley is at an angle of 12.72° east towards the south, which makes the mosque, with directions close to the geographical directions, oriented towards the direction of the qibla in the east.
(b)
The surrounding area: In this study, the independent mosque was to be designed as an urban island, thereby making it vulnerable to climatic factors.
(c)
Size: For scientific reasons, this research tried to focus on small mosques or what is known as nearby mosques, with worshipers totaling 80 to 120 individuals at a rate of 0.9 m2 per worshiper, and an arithmetical transition rate of 0.9 m2 from the initial area estimated at 72 m2 until the maximum area of 108 m2 was reached.
(d)
Geometric shape: In this paper, the thermal performance of two common shapes of mosques was studied, namely, square and rectangular mosques, while bearing in mind the geometric relationship between the length and width of the rectangle, with an arithmetical transition rate of 1/20.
(e)
Prayer hall: This study relied on a single-story mosque with a horizontal prayer hall to maintain the degree of complexity for other patterns and works in the future.
(f)
The height of the prayer hall: Scientifically, the height of the prayer hall should be at a rate of 1.5 design units, except that this research started from the lowest possible height of an internal space, which was 2.8 m, with an arithmetical transition rate of 10 cm, until the optimum height was reached.
(g)
The roof shape: This study began by examining the thermal performance of a flat roof, and then a vaulted shape or dome was inserted as an architectural element with a minimum radius of 1 m and a computational transition rate of 0.2 m, until the optimum radius was reached.
(h)
Covered galleries: In this research, the thermal performance of the covered corridors was tested at the level of each independent facade, then this was tested with a two-corridor system at the level of two facades, and finally, at the level of all the facades, with the length of the corridors and the facades being at a minimum height of 2.8 m with an arithmetical transition rate of 10 cm, and the default minimum width being 2.4 m with an arithmetical transition rate of 10 cm until the ideal thermal dimensions, shape and position were reached.
(i)
The patio: Here, the closed and the half-opened mosques were tested by proposing a patio with the same dimensions as the facade, while manipulating the opening of the patio with an arithmetical transition rate of 0.5 m, with the height of the mathematical minimum being 2.8 m with an arithmetical transition rate of 10 cm.
(j)
Openings: The ratio of the open area to the wall area of each facade was tested separately, and then the general ratio with the openings on all the facades was tested, where a minimum rate of 10% was suggested as a start, with an arithmetical transition rate of 5%, until the optimum thermal ratio was reached.
(k)
External colors: External colors play a great role in determining the amount of energy that will be reflected compared to the energy that will be absorbed by different surfaces. In this study, the surface was tested at a medium reflection rate of 0.5 and an arithmetical transition rate of 0.02, until the optimum ratio was reached.
(l)
Building materials: Four materials that were available in the area were tested: mud bricks, cement bricks, polished stones, and compacted soil, and the thermally optimum materials were selected with the suggested wall thickness.

5. Experimental Process, Steps, and Input Data

The digital simulation process was dependent on the Autodesk Ecotect Analysis software. First, the area was selected, and the climate data file was entered. Then, the default model was created for the simulation. In this research, thermal discomfort curves within the architectural space were created and extracted by the software based on the ratio of the warm period and the cold period compared to the optimum thermal level, which is considered as the thermal comfort level. This level has been the focus of many studies, such as [33,50,51,52,53], who recommended that the rate of thermal comfort for humans is within the range of 18 to 26 °C. However, in practice, it is impossible to achieve this rate by relying only on natural design solutions and without resorting to technical solutions, especially in a hot and dry climate.
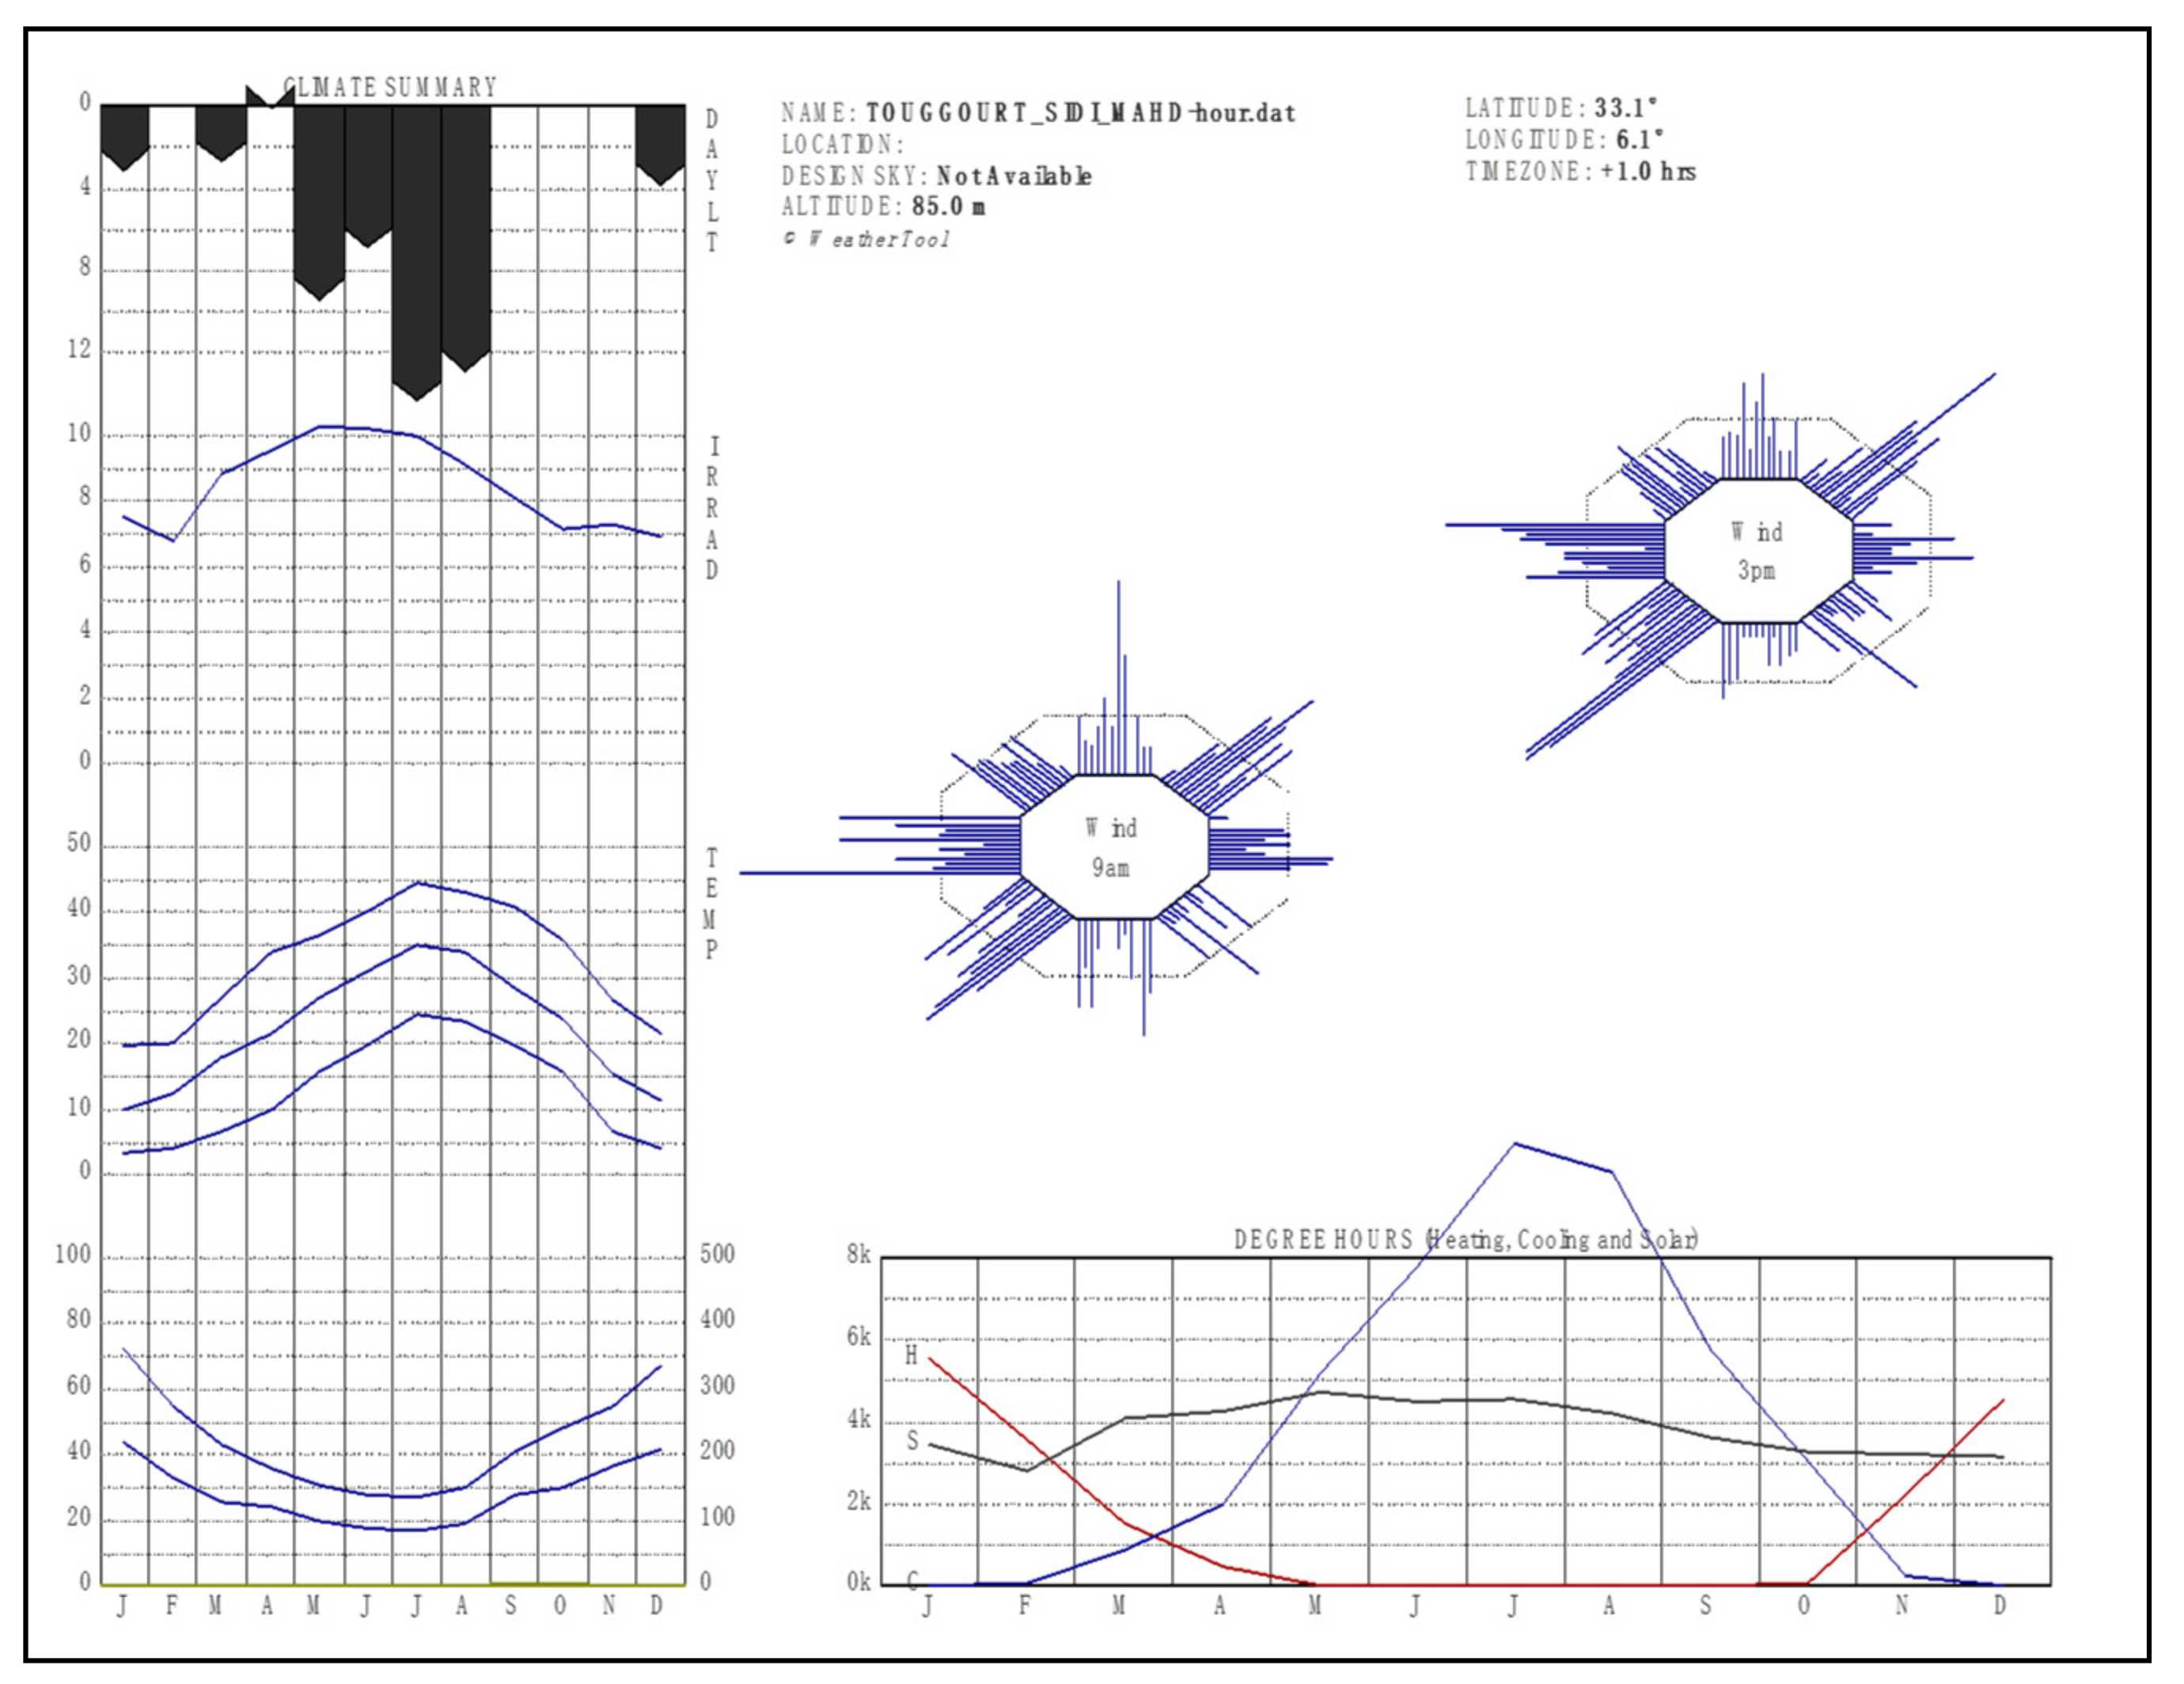
Mahoney tables were used to determine the optimum thermal comfort level that could be reached by relying on the design and natural solutions. Based on the climatic data previously mentioned for the Righ Valley Region obtained by extracting the average humidity ratio for each month to determine its humidity group, it was concluded that the humidity group for the Righ Valley Region was group 1 for the four summer months and group 2 for another seven months, which confirmed that the dryness of the area was for a period of 11 months, with the lowest humidity being 50%. Then, the annual heat rate, which was estimated to be 22 to 35 °C, was calculated using the Mahoney thermal comfort tables, where the field was extracted according to each month. It was found that the temperatures ranged from 26 to 34 °C in the summer months, and from 25 to 31 °C in the spring, autumn, and winter months, except in December, when the thermal comfort was naturally achieved within the range 23 to 26 °C.
Based on all the previously mentioned information, the climatic data, the hypothetical model that was created, and the thermal comfort ranges that were determined, a digital simulation process was carried out using the following steps:
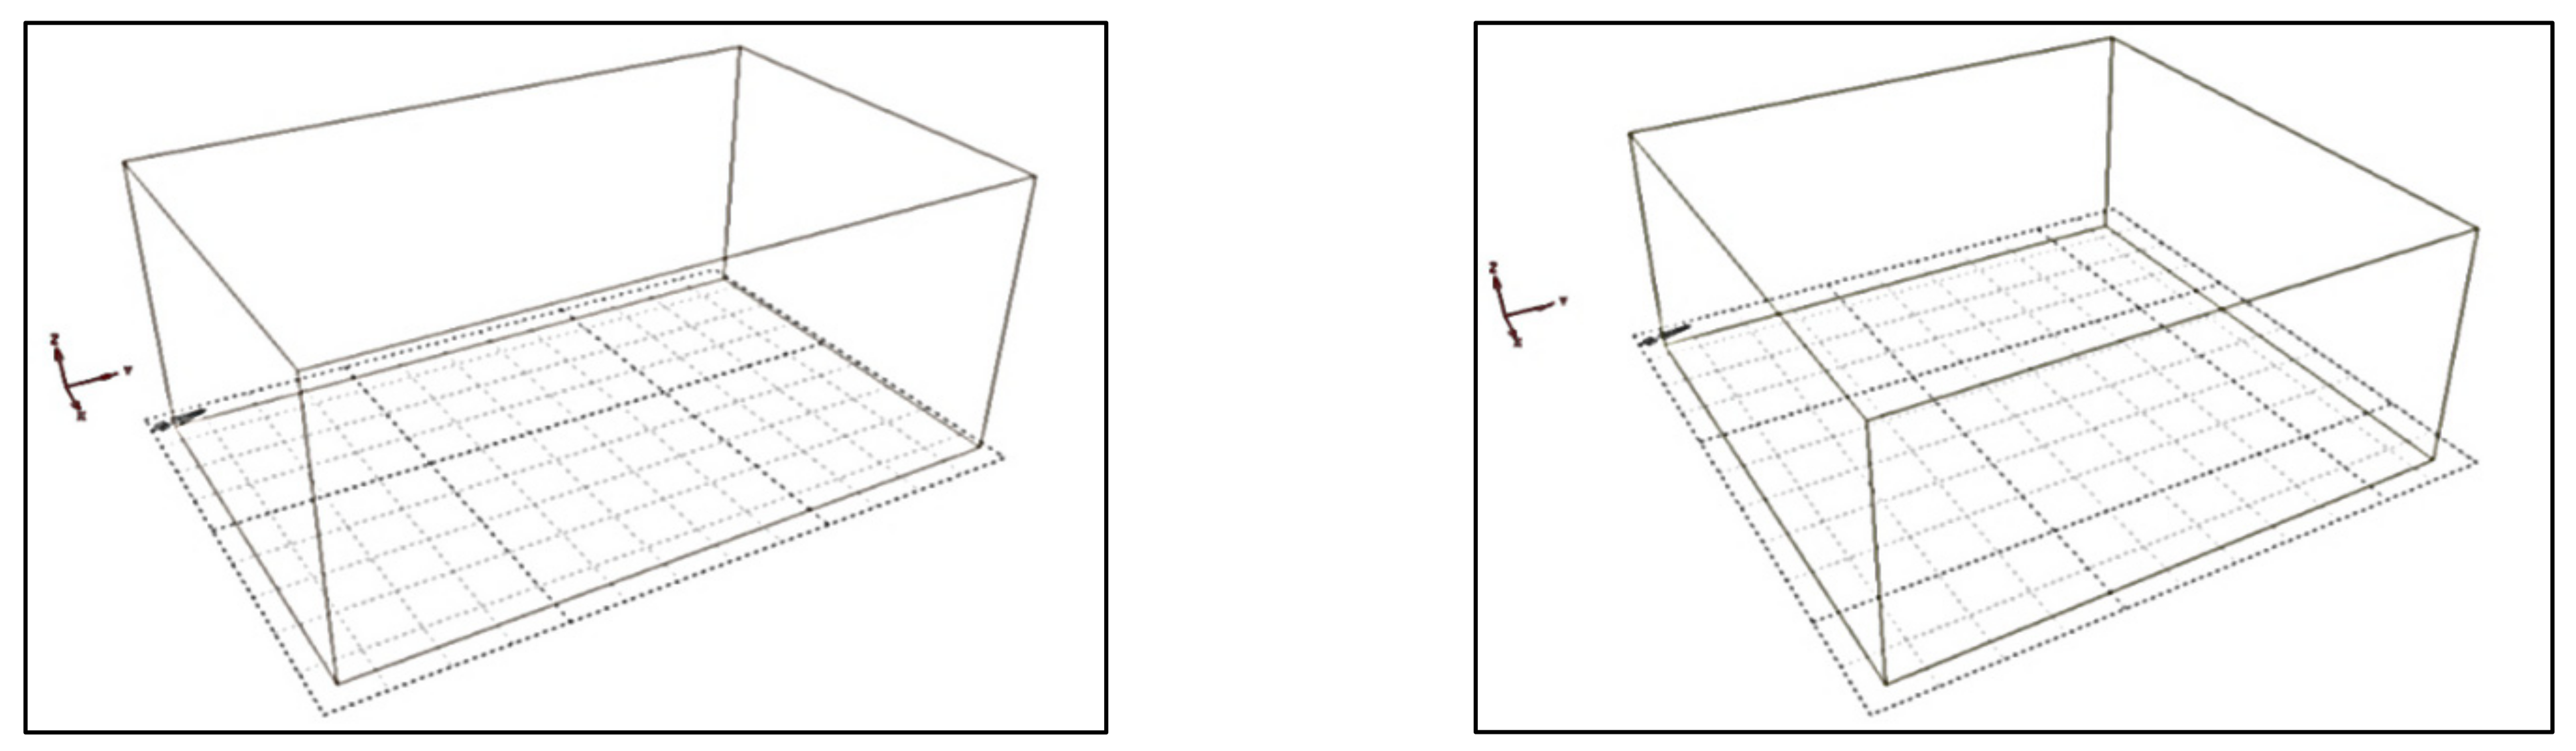
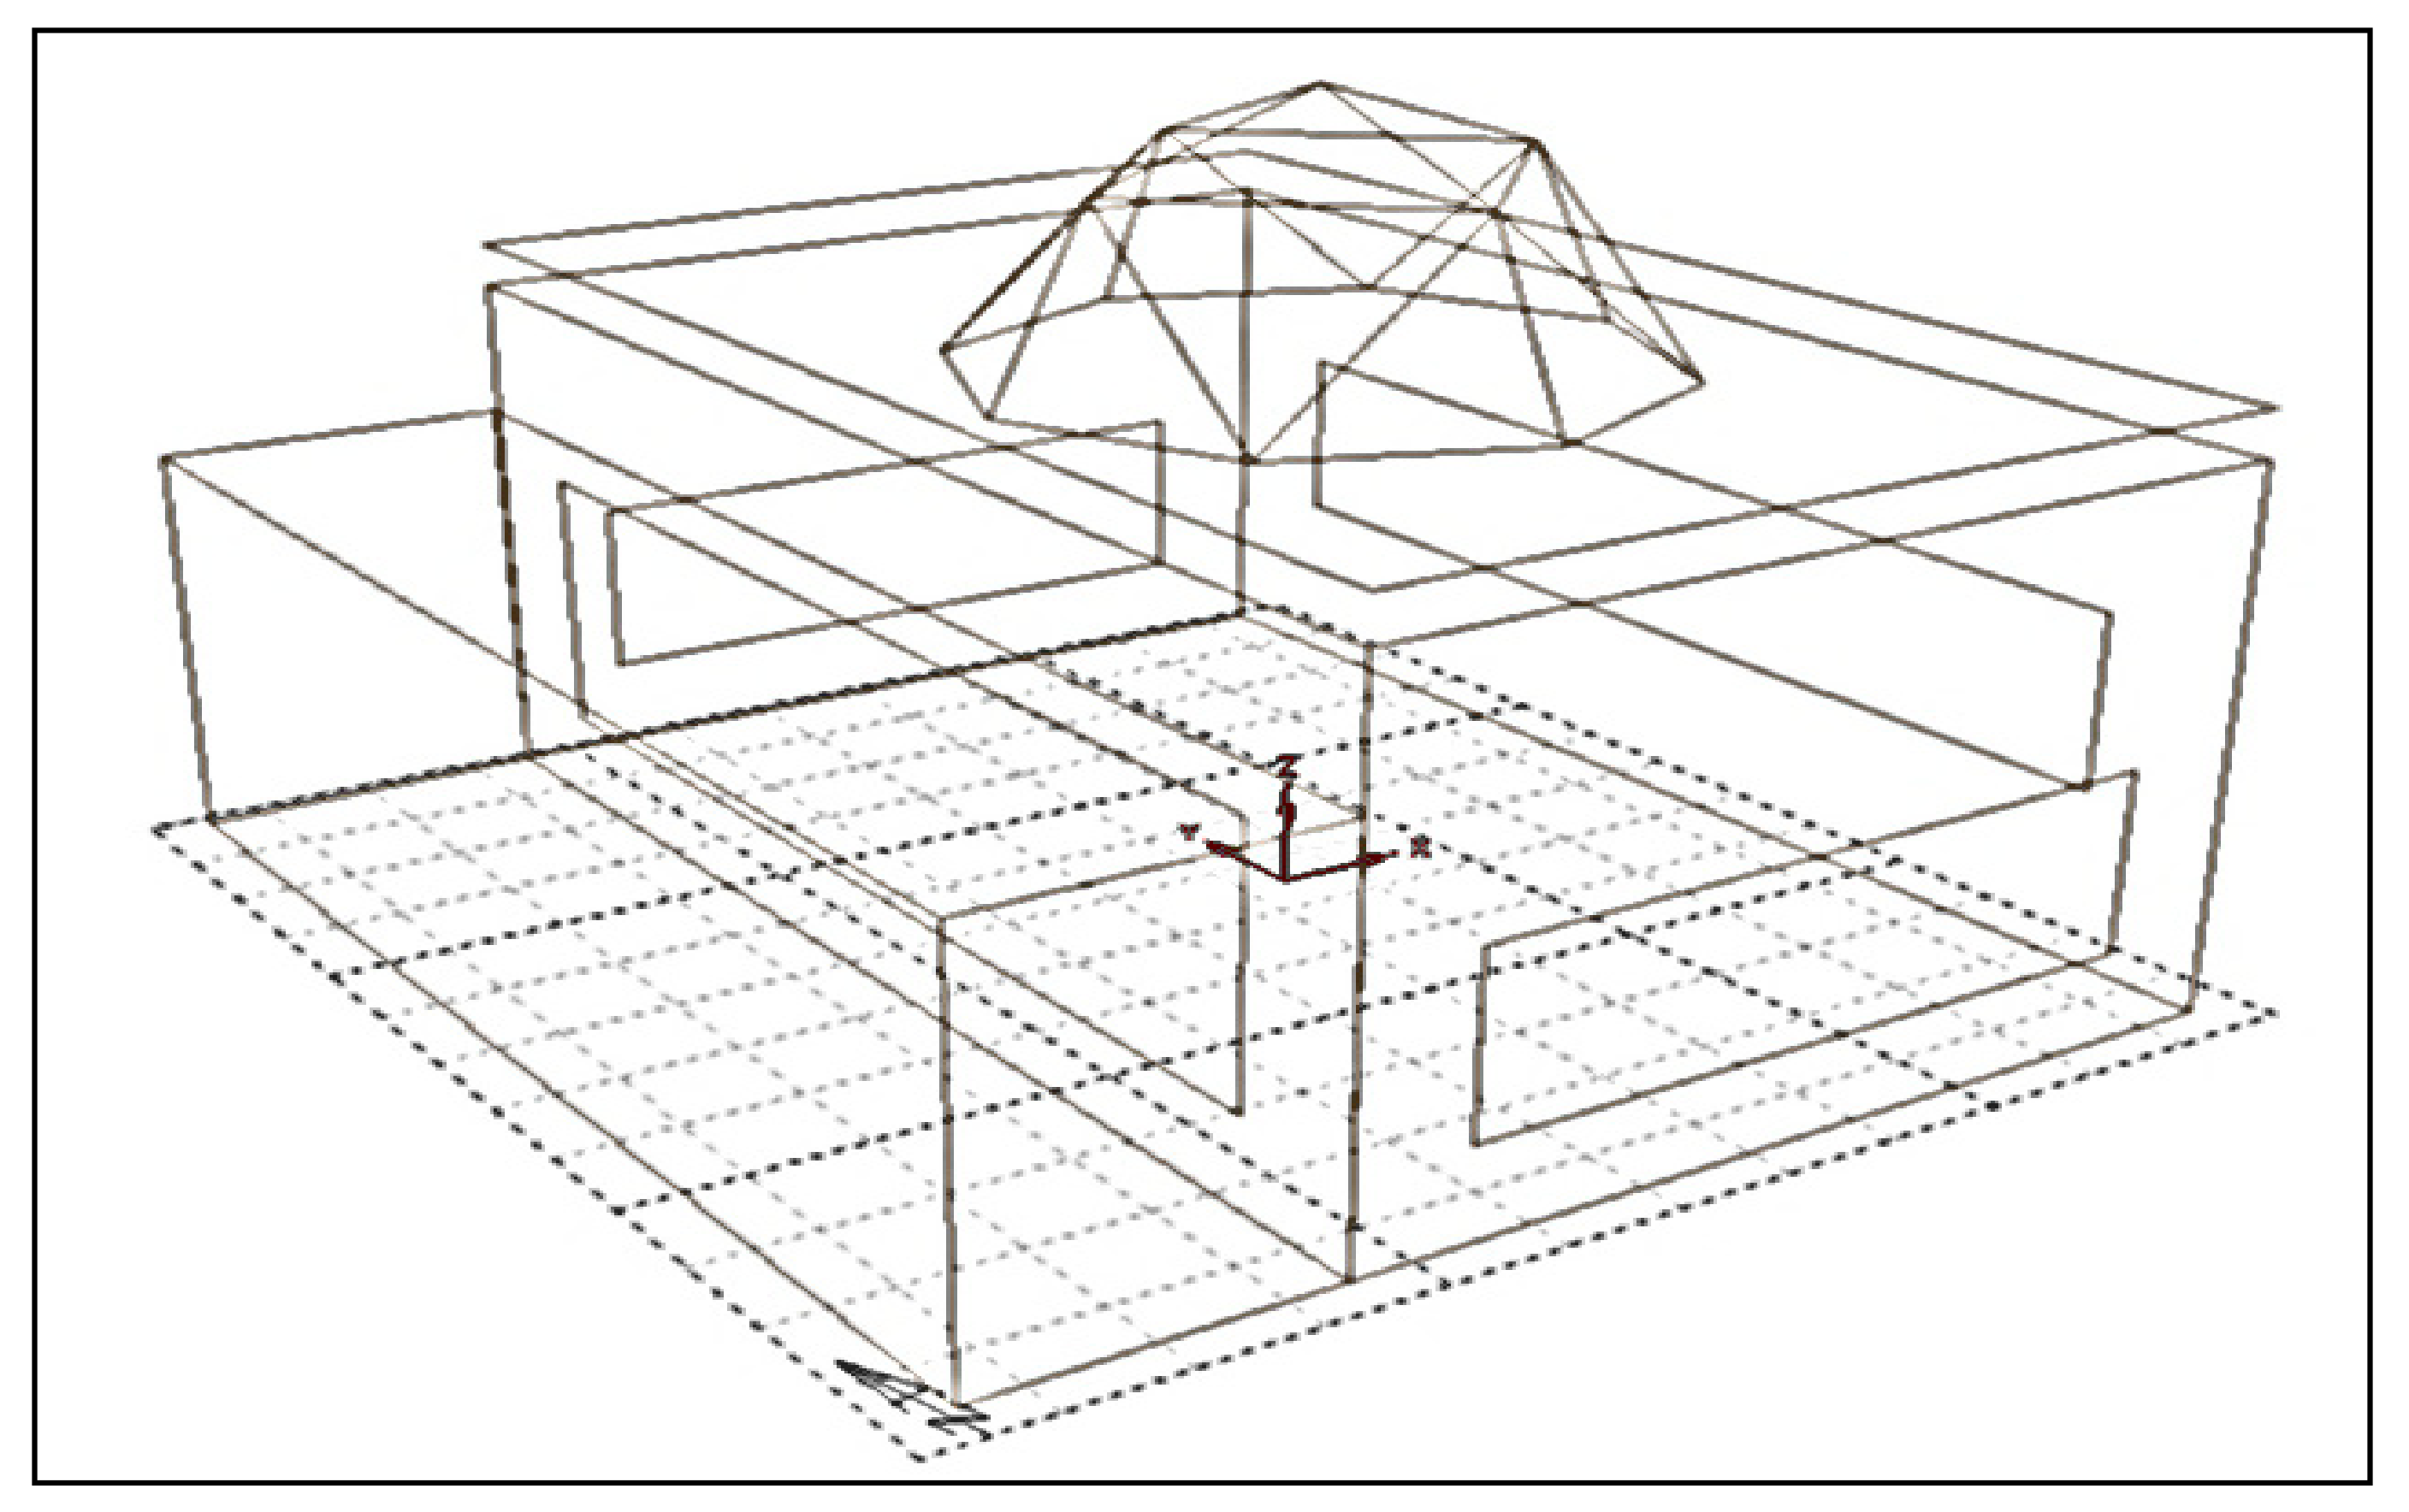
  • Step zero: This was the starting step, in which the first hypothetical model was proposed. The starting model was a cube that was 10 m in length and width, and 2.8 m in height (Figure 5).
  • First step: Testing square and rectangular shapes with a minimum area of 72 m2 up to a maximum of 102 m2 at an arithmetical transition rate of 0.9 m2, with the minimum height of the prayer hall estimated to be 2.8 m at an arithmetical transition rate of 10 cm, bearing in mind the geometric relationship between the length and width of the rectangle at an arithmetical transition rate of 1/20 (Figure 5).
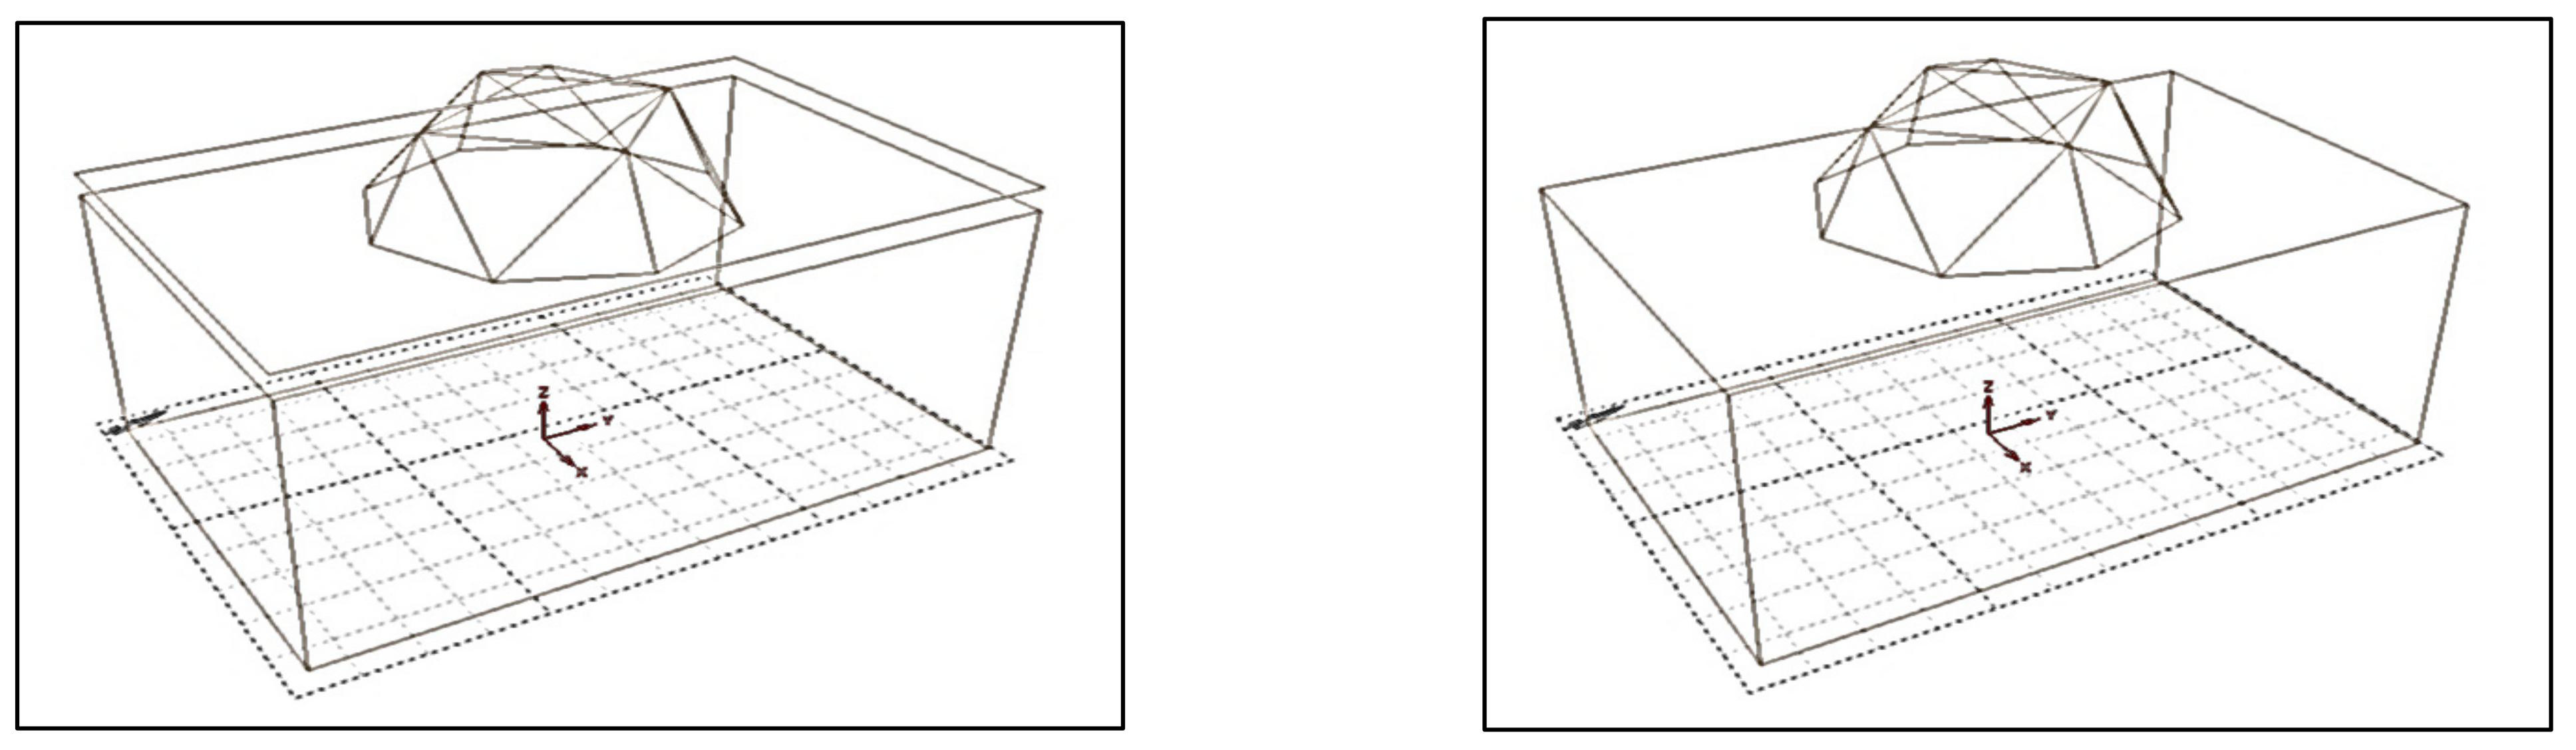
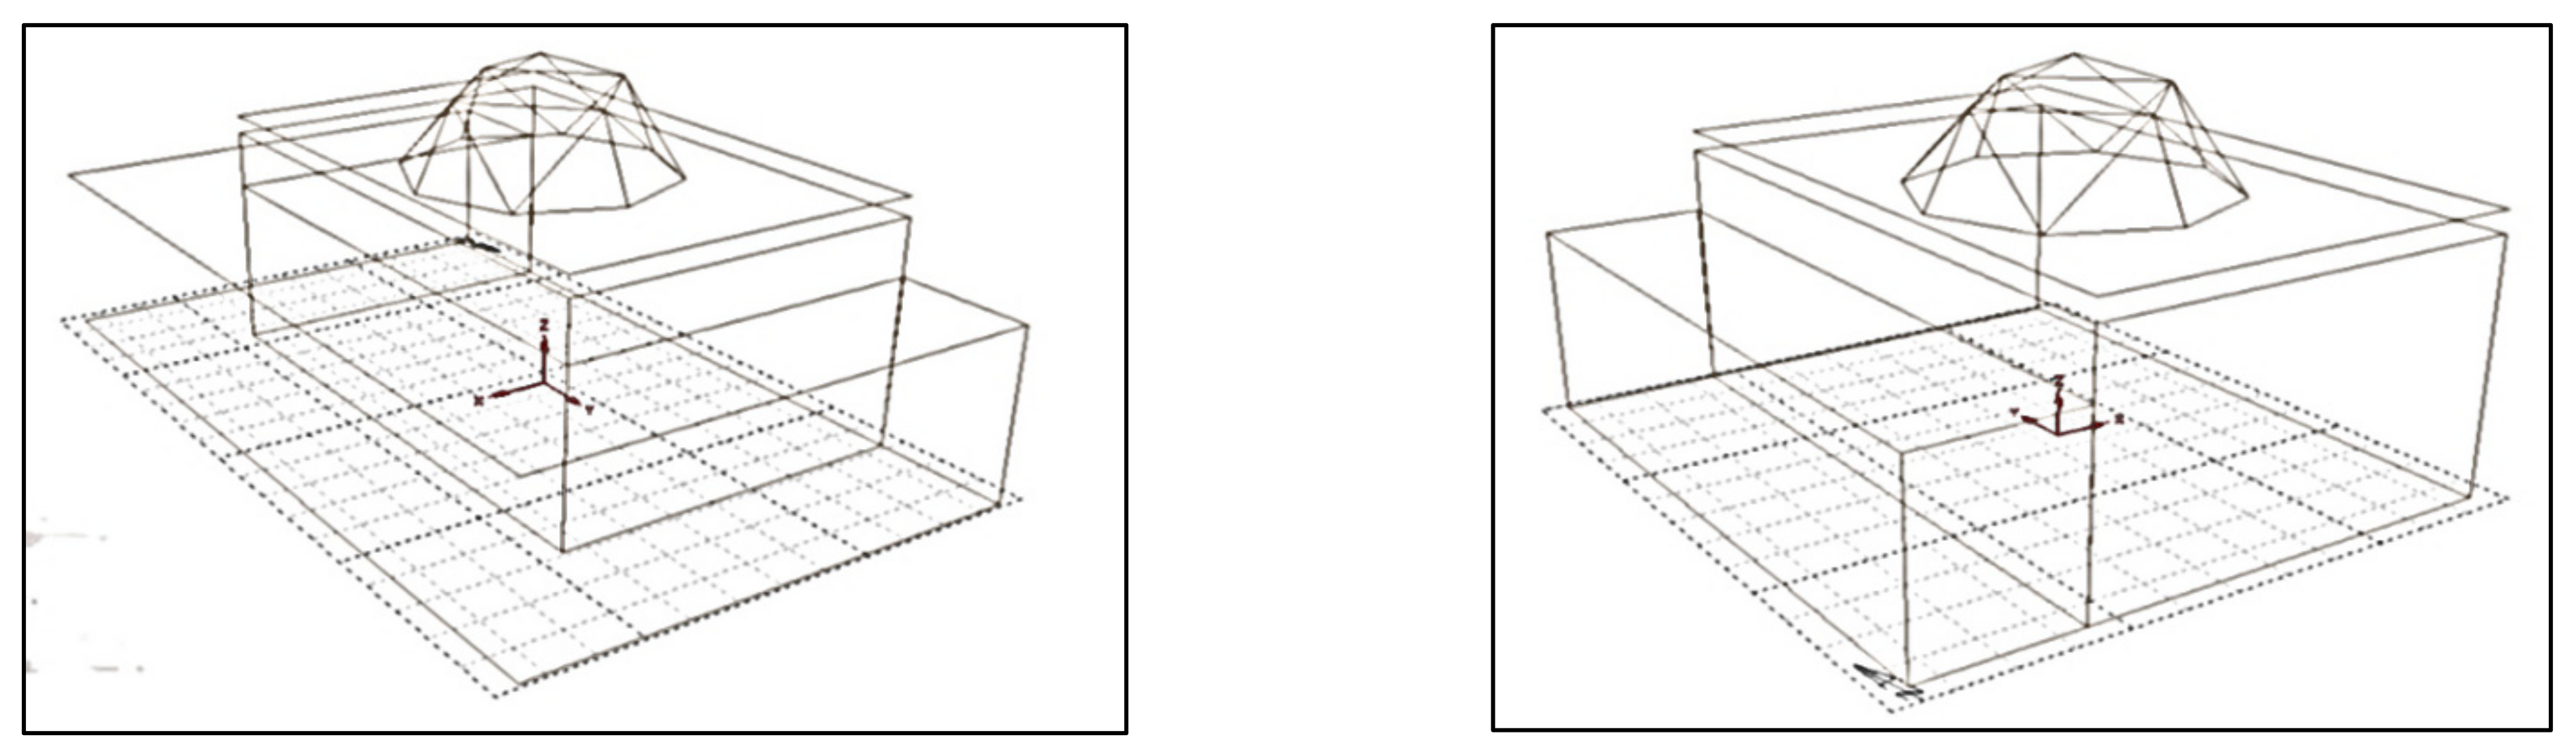
  • Second step: Testing the thermal performance of a vaulted shape by inserting a dome with a minimum radius of 1 m and at an arithmetical transition rate of 20 cm (Figure 6).
  • Third step: Testing the thermal performance of mosques using sunshades as a new technique. This was carried out by proposing a shaded layer for the roof, thereby leaving a space of less than 25 cm above the roof of the mosque for ventilation and cooling of the roof of the mosque at an arithmetical transition rate of 10 cm (Figure 6).
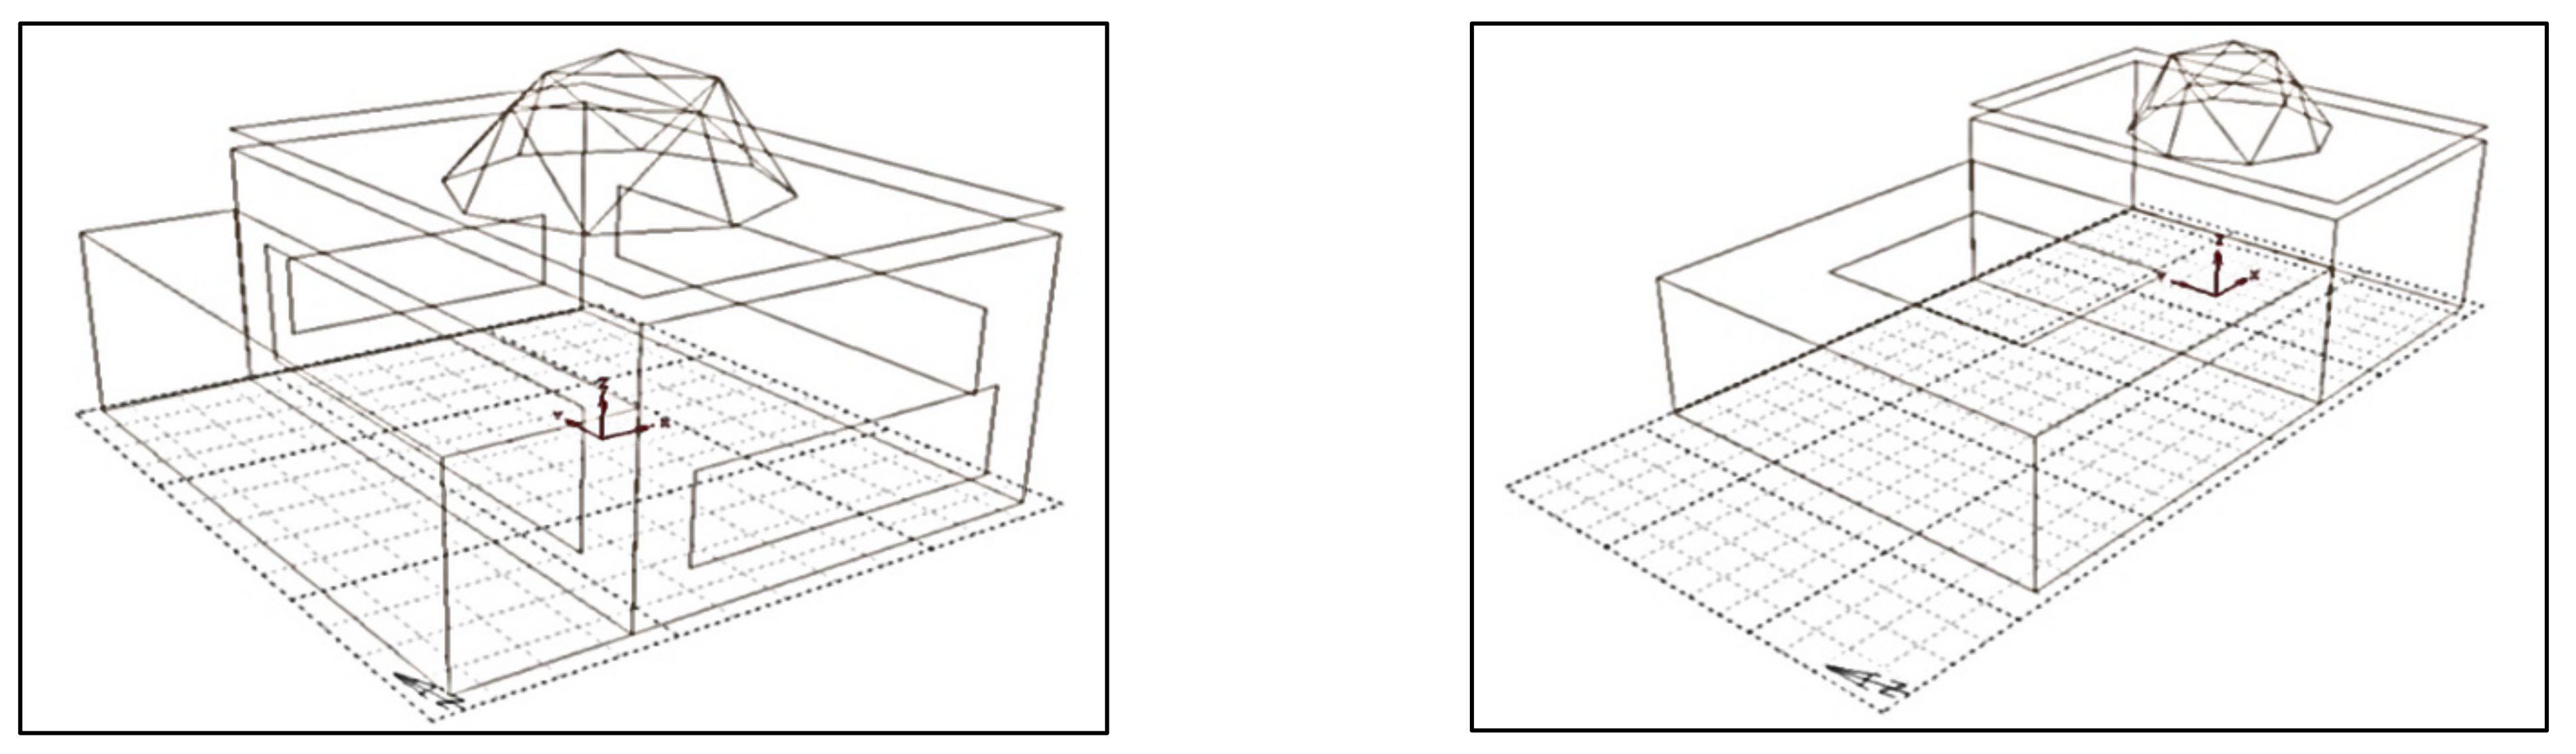
  • Fourth step: Testing the system of covered galleries by using a single corridor at the level of each facade separately with a length equivalent to the length of the facade, and a width of 2.4 m at an arithmetical transition rate of 10 cm, and a minimum height of 2.8 m at an arithmetical transition rate of 10 cm. Then, experiments were carried out on the system of covered galleries using several facades at the same time, and the thermal performance of the mosque was tested (Figure 7).
  • Fifth step: Testing the thermal performance of the mosque patio instead of the covered galleries located at the facades, and proposing patios at the western, southern, and northern facades with the same dimensions, while manipulating the opening of the patio at an arithmetical transition rate of 0.5 m, and from a minimum height of 2.8 m at an arithmetical transition rate of 10 cm (Figure 7).
  • Sixth step: Simulating the thermal performance with an open ratio of the walls by testing each facade separately, and then all the facades together, where simulations were conducted with a minimum opening of 10% at an arithmetical transition rate of 5% until the optimum temperature was reached (Figure 8).
  • Seventh step: Testing the thermal performance of the external colors of the surfaces. The test started with an average reflection rate of 0.5 and an arithmetical transition rate of 0.02 until the optimum ratio was reached.
  • Eighth step: The performance was simulated by testing four materials that were available in the region, namely, mud bricks, cement bricks, polished stones, and compacted soil.
To obtain the final model, a process-based simulation was carried out according to the cumulative method by stopping and analyzing the results at each step, selecting the optimal ones to install the solution, and testing the solutions proposed for the next step and so on, adding, in each step, an optimal solution until the ideal thermal model was achieved.

6. Results

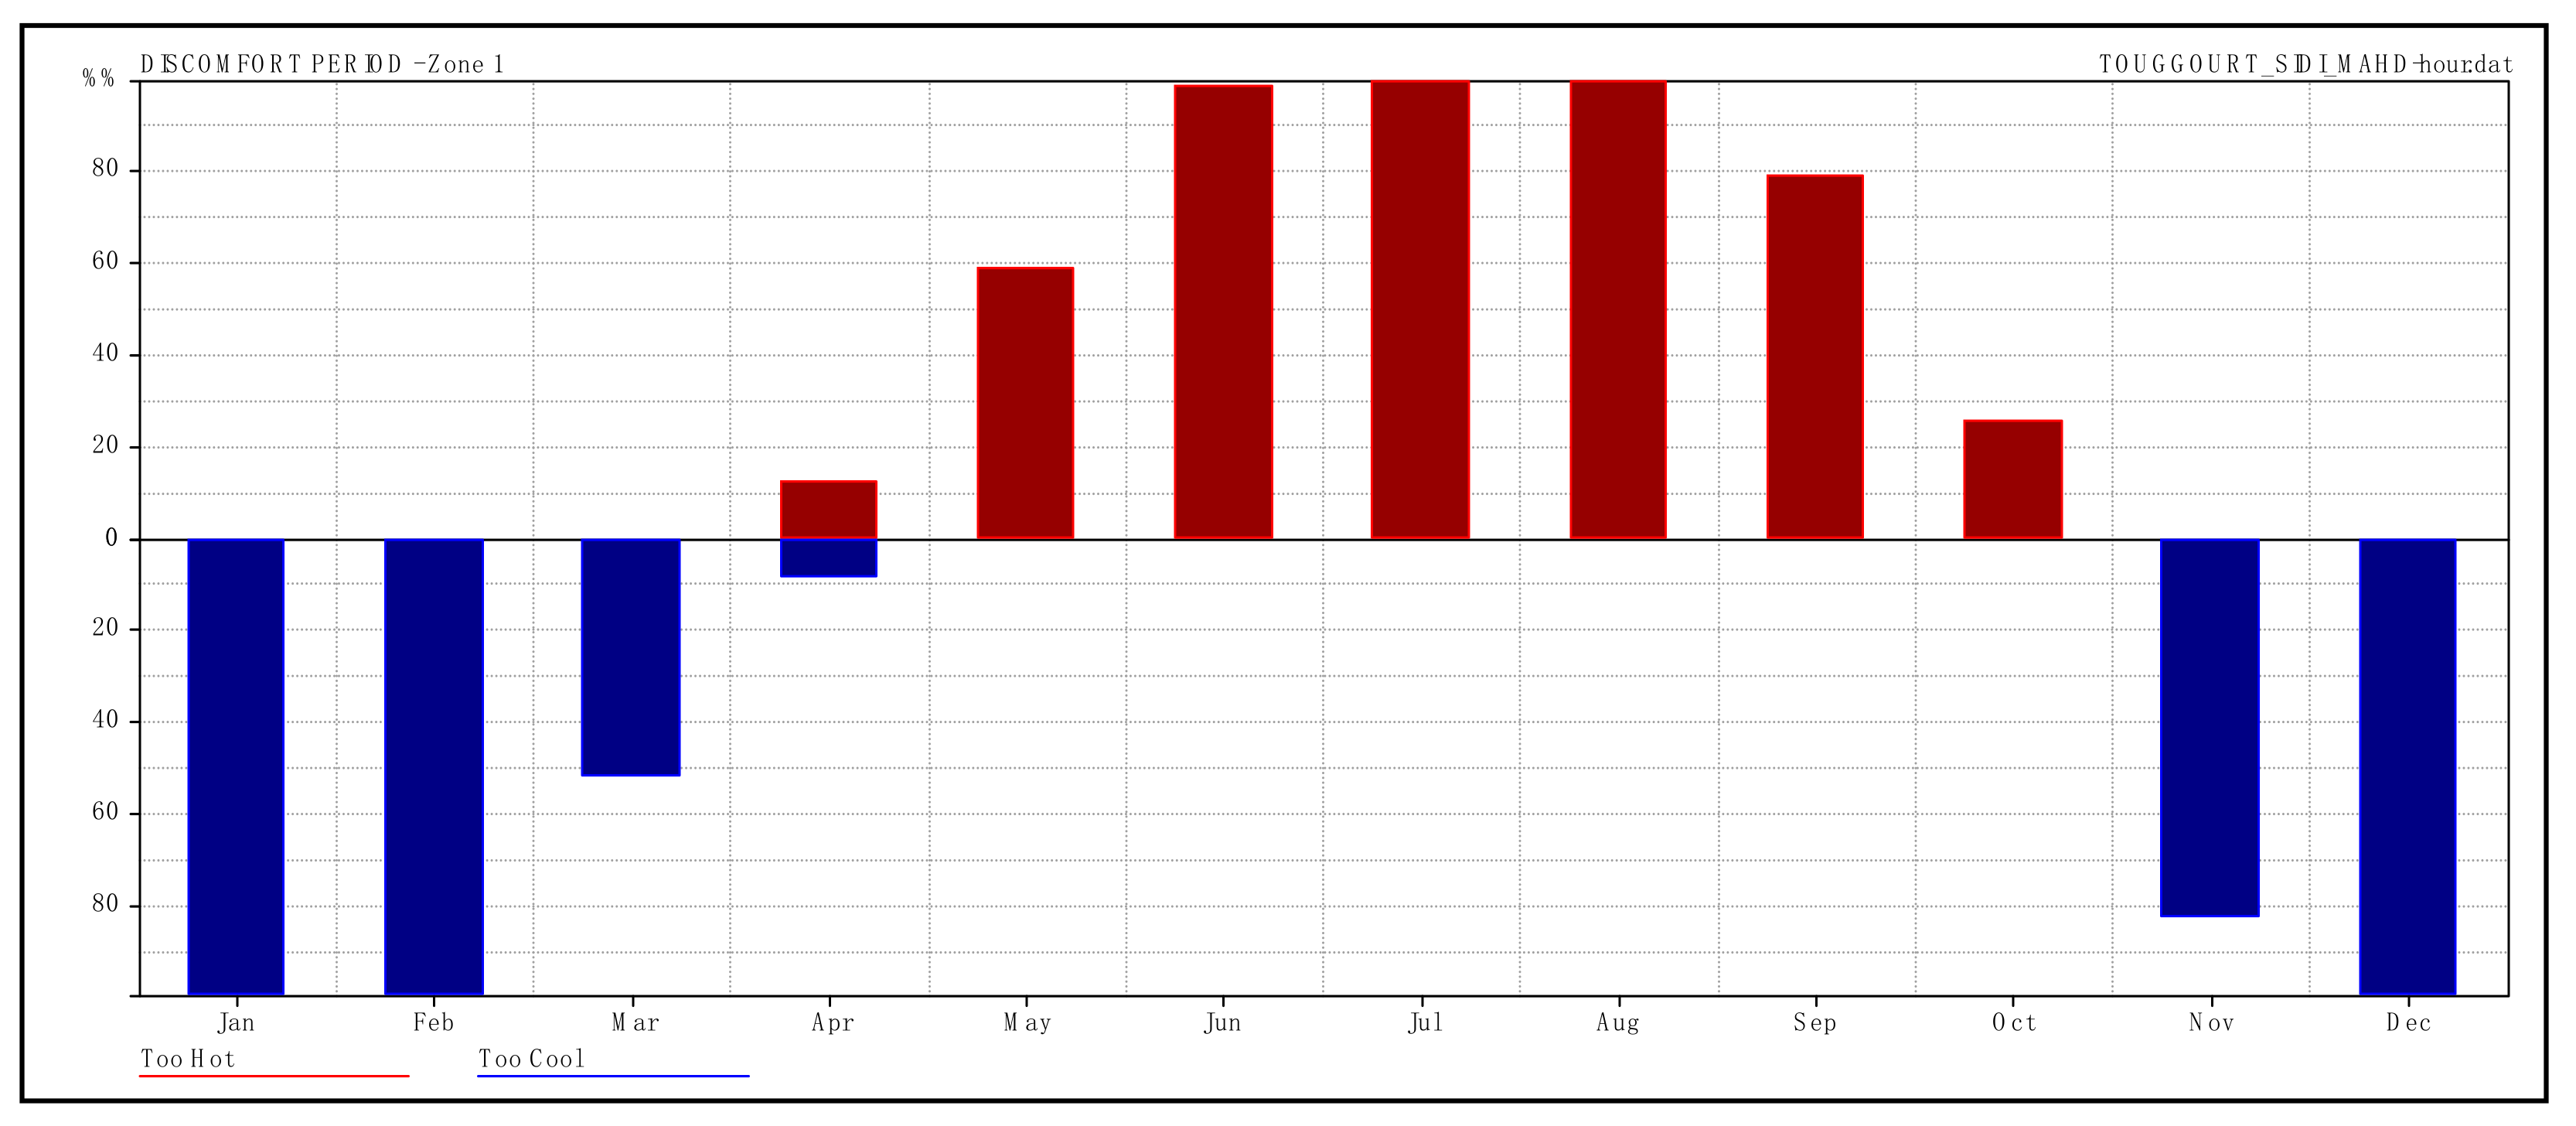
Based on the digital simulation of the hypothetical model, and all the steps mentioned previously, thermal discomfort curves were obtained according to the thermal comfort range of the Mahoney tables. The thermal discomfort curves expressed the percentage of hot and cold periods or what was above and below the presumed thermal comfort range (Figure 9).
At the end of each step, hundreds of curves were obtained, out of which the optimal ones were chosen to be converted into mathematical tables that would help explain the development of the thermal performance of the building every month.

6.1. Sensitivity Analysis

6.1.1. Setting Up the Sensitivity Analysis Main Aim

As mentioned in the introduction section, the main aim of this research was to conduct a numerical and quantitative assessment of how far thermal comfort can be provided in mosques in a hot and dry climate to help designers make design decisions. This experiment was conducted in nine different steps; first of all, a hypothetical model is proposed as a starting model, and in the next step, general geometric shapes were tested, to place and test on the best choice the vault and the sunshade systems in second and third steps. In the fourth and the fifth steps respectively, the covered galleries and the patio are recommended and tested; here, the global architectural form of the mosque is built up and there are three steps to finish it: the windows, the colors, and the building materials, in the sixth, seventh, and eighth steps, respectively. Based on the local sensitivity analysis, all variables were changed on the basis of the OVAT method (One-Variable-At-a-Time) to reach a single reading, which is the overall discomfort index.

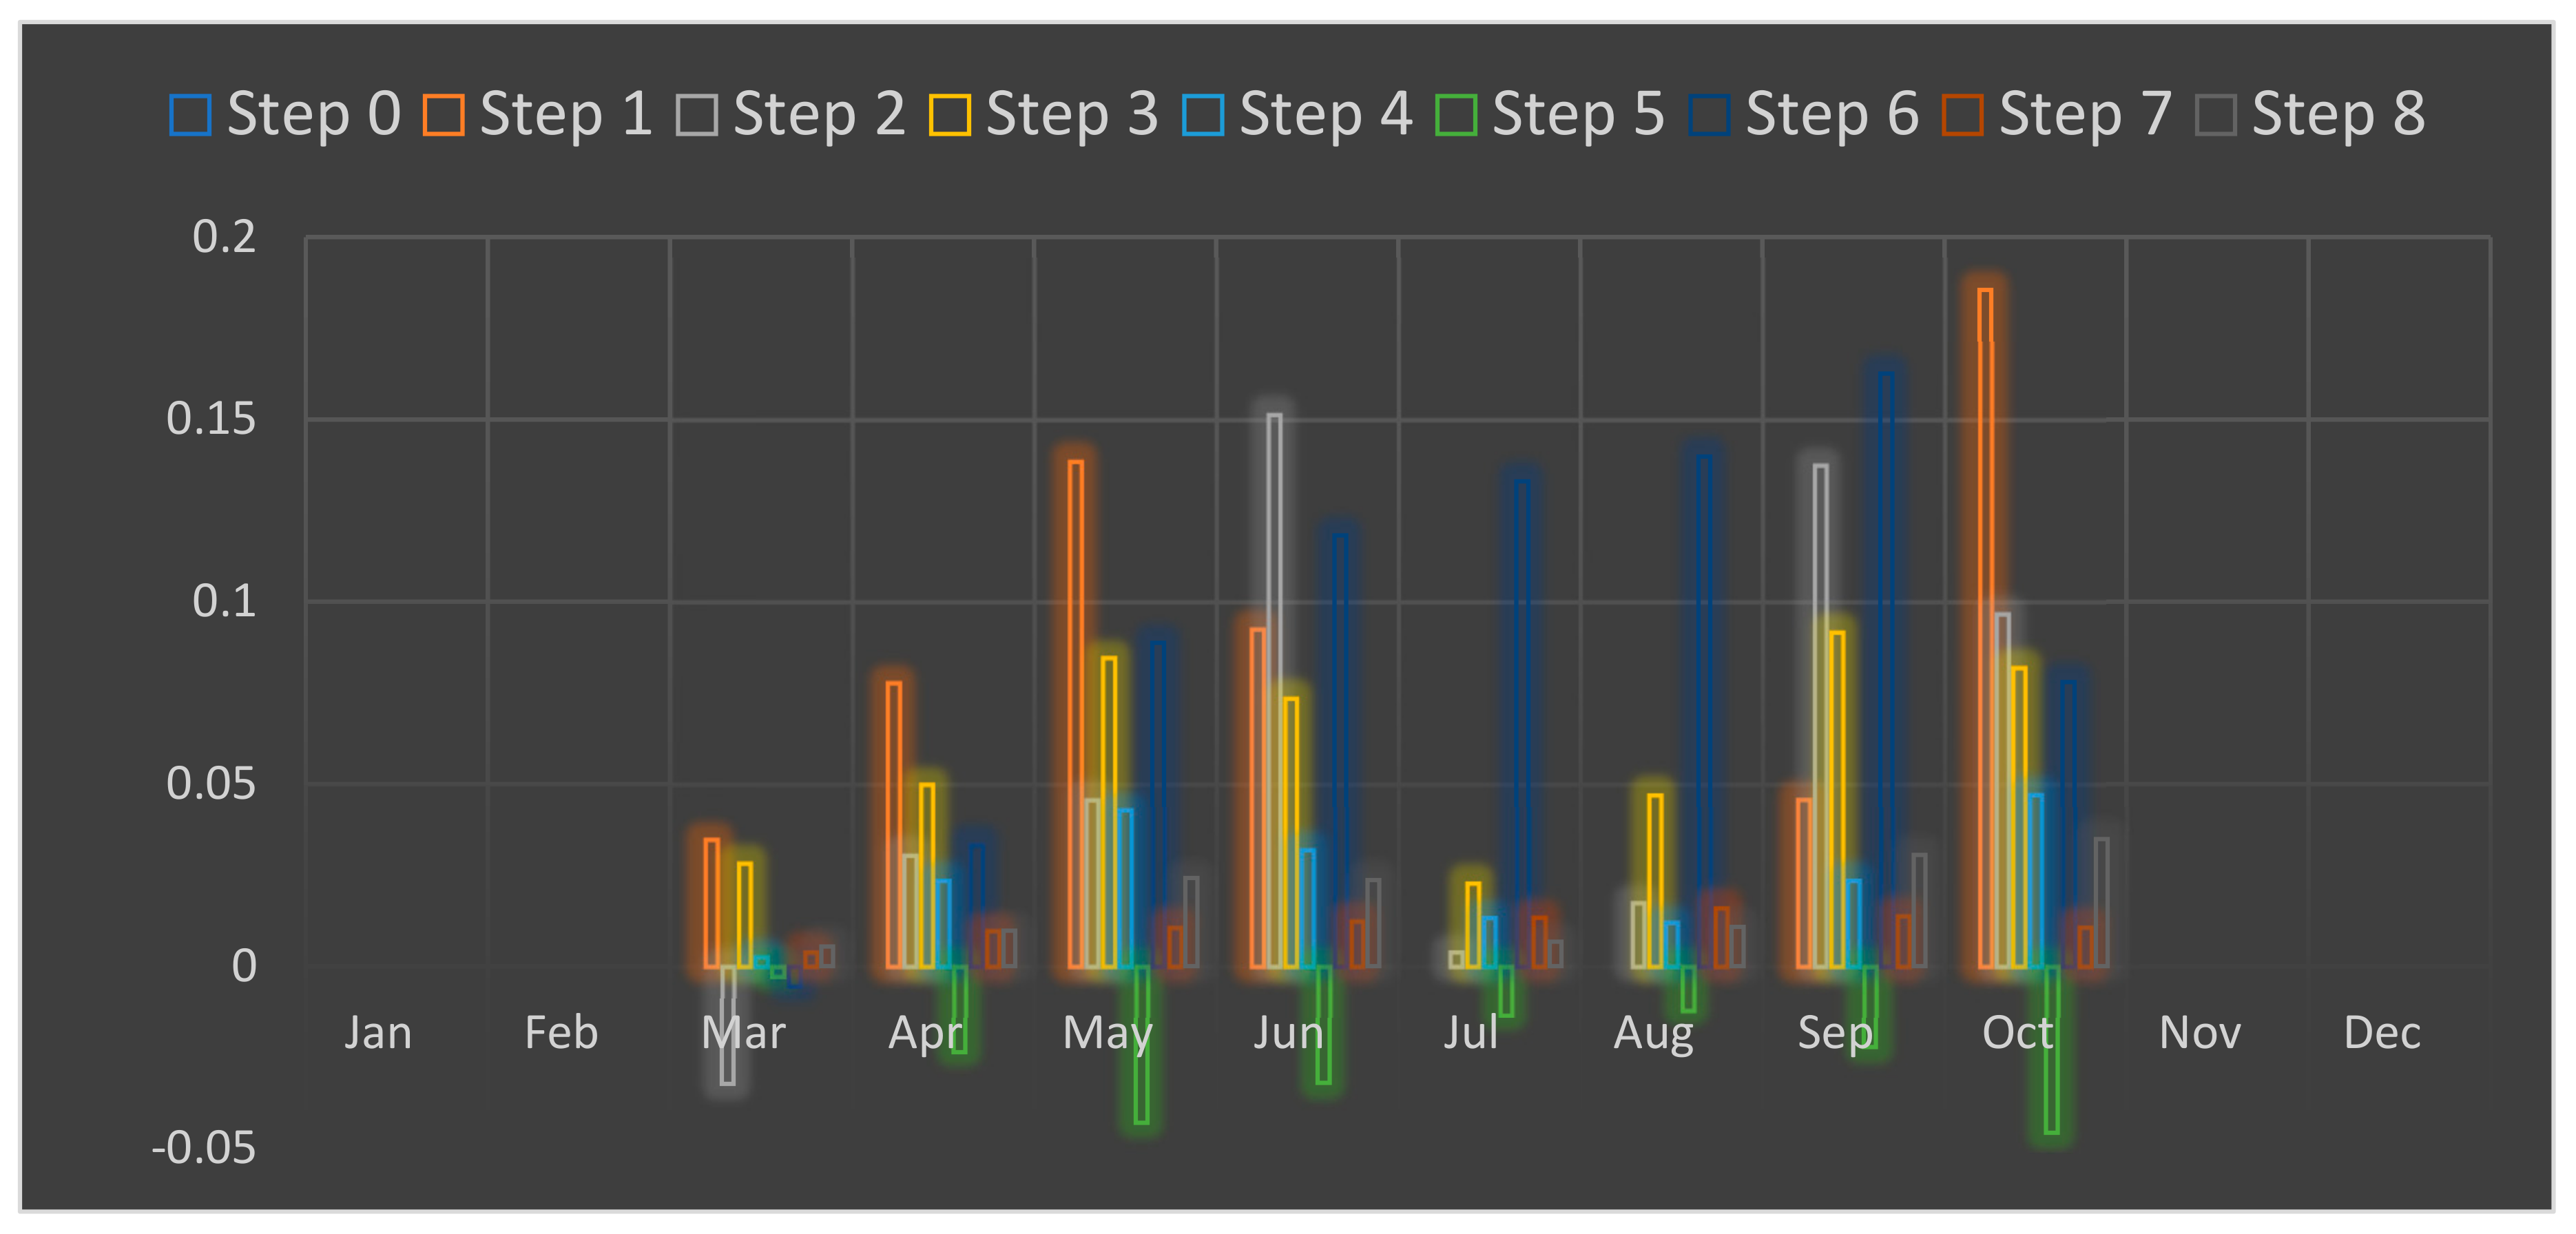
6.1.2. Run of Sensitivity Analysis

The sensitivity analysis for this study was performed using the Autodesk Ecotect Analysis software. Microsoft Excel was used to present the results based on the SRC sampling method (sample-rate conversion), and the SRC of the eight steps with all variables listed in Table 2 was determined on the basis of a single aim. The rate of each design variable in each month is presented in Figure 10 and Table 3. The illustrated rates are for the hot period because of its sensitivity in the hot and dry climate.
The results of the local sensitivity analysis in the hot seasons shows that among the eight steps, a positive global influence of the seventh parameter step, varying between 0 and 0.1855 for the influence of the geometric shape on the overall discomfort index in October, is the most influential variable, and the vault shape has a maximum influence rate reaching 0.1514 in June and a negative influence only in March, reaching −0.0323. The use of the sunshade reaches its maximum positive influence in September, with a rate of 0.0917, while the influence of the covered galleries reaches only a 0.0471 positive influence in October. Furthermore, openings, colors, and building materials present a slight influence on the overall discomfort index, reaching 0.1625 as a maximum in September for the openings, 0.0161 as a maximum in August for the colors, and 0.0349 for the building materials in October. However, the use of patio variable in the fifth step of the experiment shows a negative influence in hot months, reaching −0.0457 in October.

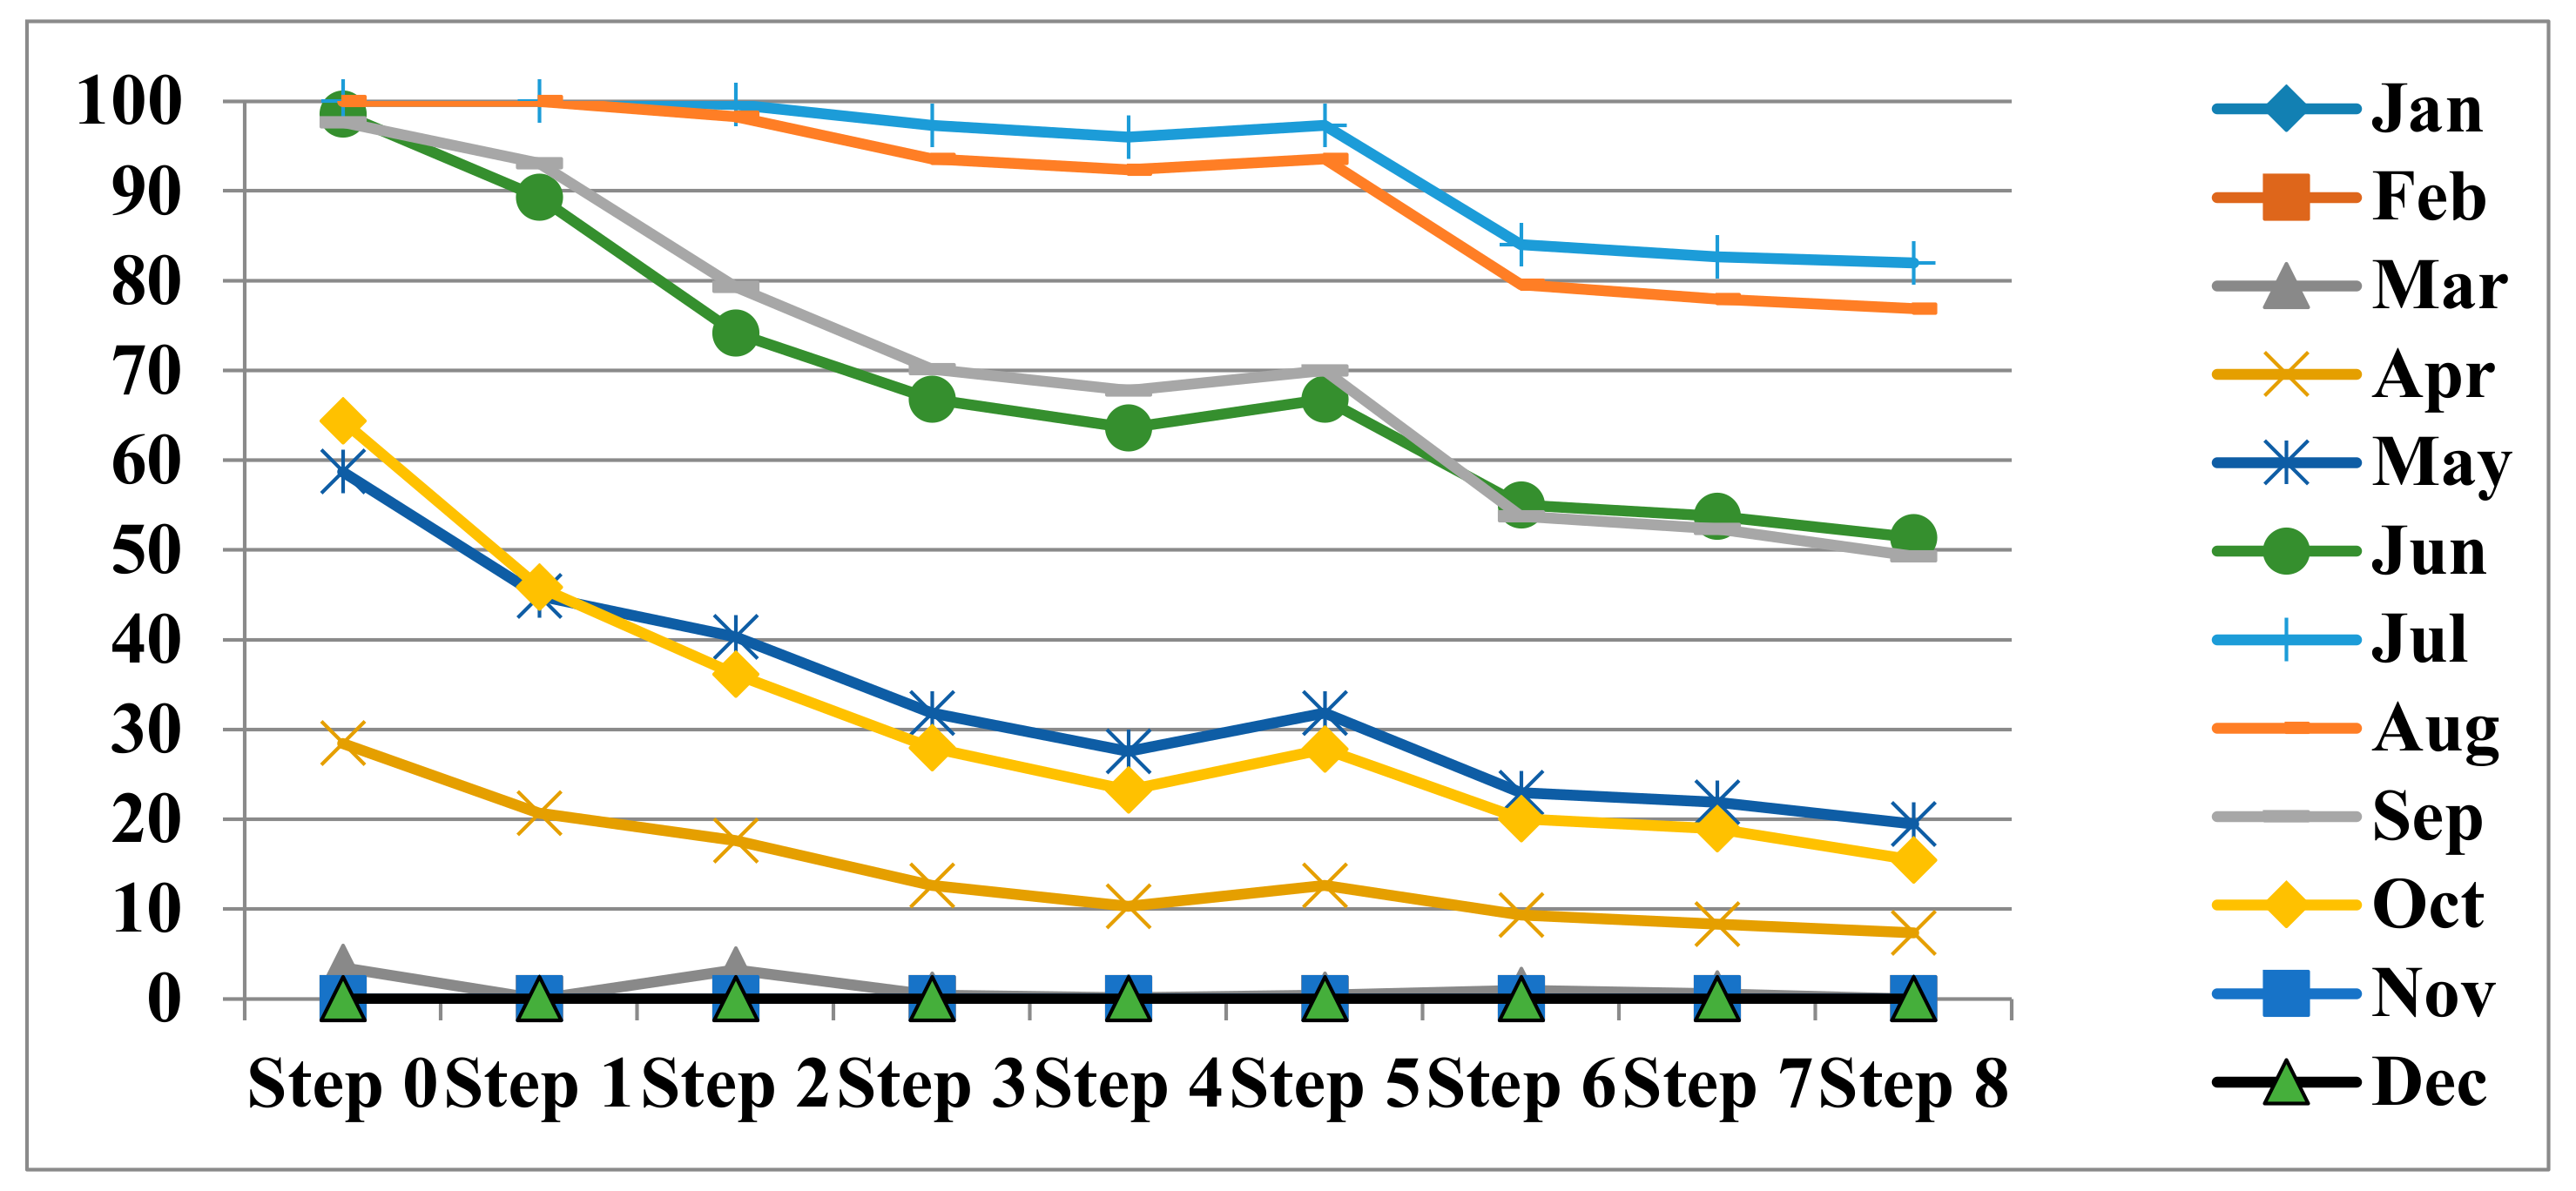
6.2. Thermal Discomfort Analysis during Hot Period

The results of the general curves of the thermal discomfort rate (Figure 11 and Table 4) were divided into 5 categories, according to the months of the year.
The first category covered the months of July and August, where the results started with a thermal discomfort rate of 100%, and all the proposed solutions failed to show any effectiveness. It was only when step 3 was reached, and the roof was covered with a sunshade, that the percentage decreased to 95%. However, an unexpected result was the high thermal discomfort rate when the patio system was followed in comparison to the covered gallery’s system. Then, a real change began in the sixth step, when a system of openings was proposed, where the natural ventilation led to an immediate gain of about 14%, thereby reducing the thermal discomfort rate to 84%. Finally, by using compacted soil with an external reflection factor of 0.84, the level of thermal discomfort was reduced to a minimum of 80%, which meant a gain of more than 20% in the thermal comfort rate in the middle of the hottest summer months.
The second category covered the months of June and September, where the discomfort rate at the beginning of the simulation was close to 100%, but the proposed solutions over all the steps gave impressive results, with a remarkable decline of about 0.8% in the discomfort rate at each step, except in step 5, where again, the patio system proved to be unsuccessful. At the end of the simulation, a discomfort level of about 50% was reached. In other words, a thermal comfort gain of 50% was achieved once the design solutions were approved.
The third category covered the months of May and October, where the discomfort rate at the beginning of the simulation was approximately 60%, but the proposed solutions over all the steps gave impressive results, with a significant decrease of 0.7% in the discomfort rate at each step, except at step 5, where again, the system of patios proved to be unsuccessful. So, at the end of the simulation, a discomfort rate of approximately 20% or a thermal comfort gain of 40% was achieved once the design solutions were approved.
The fourth category covered the month of April, where the discomfort rate was reduced from 30% at the start of the simulation to less than 10% at the end of the process, with a reduction of 4% regularly at each step, except at step 5. Finally, the last category covered the months of November, December, January, February, and March, where the thermal ratio was originally close to 0%, which means no discussion was needed about cooling in these months.

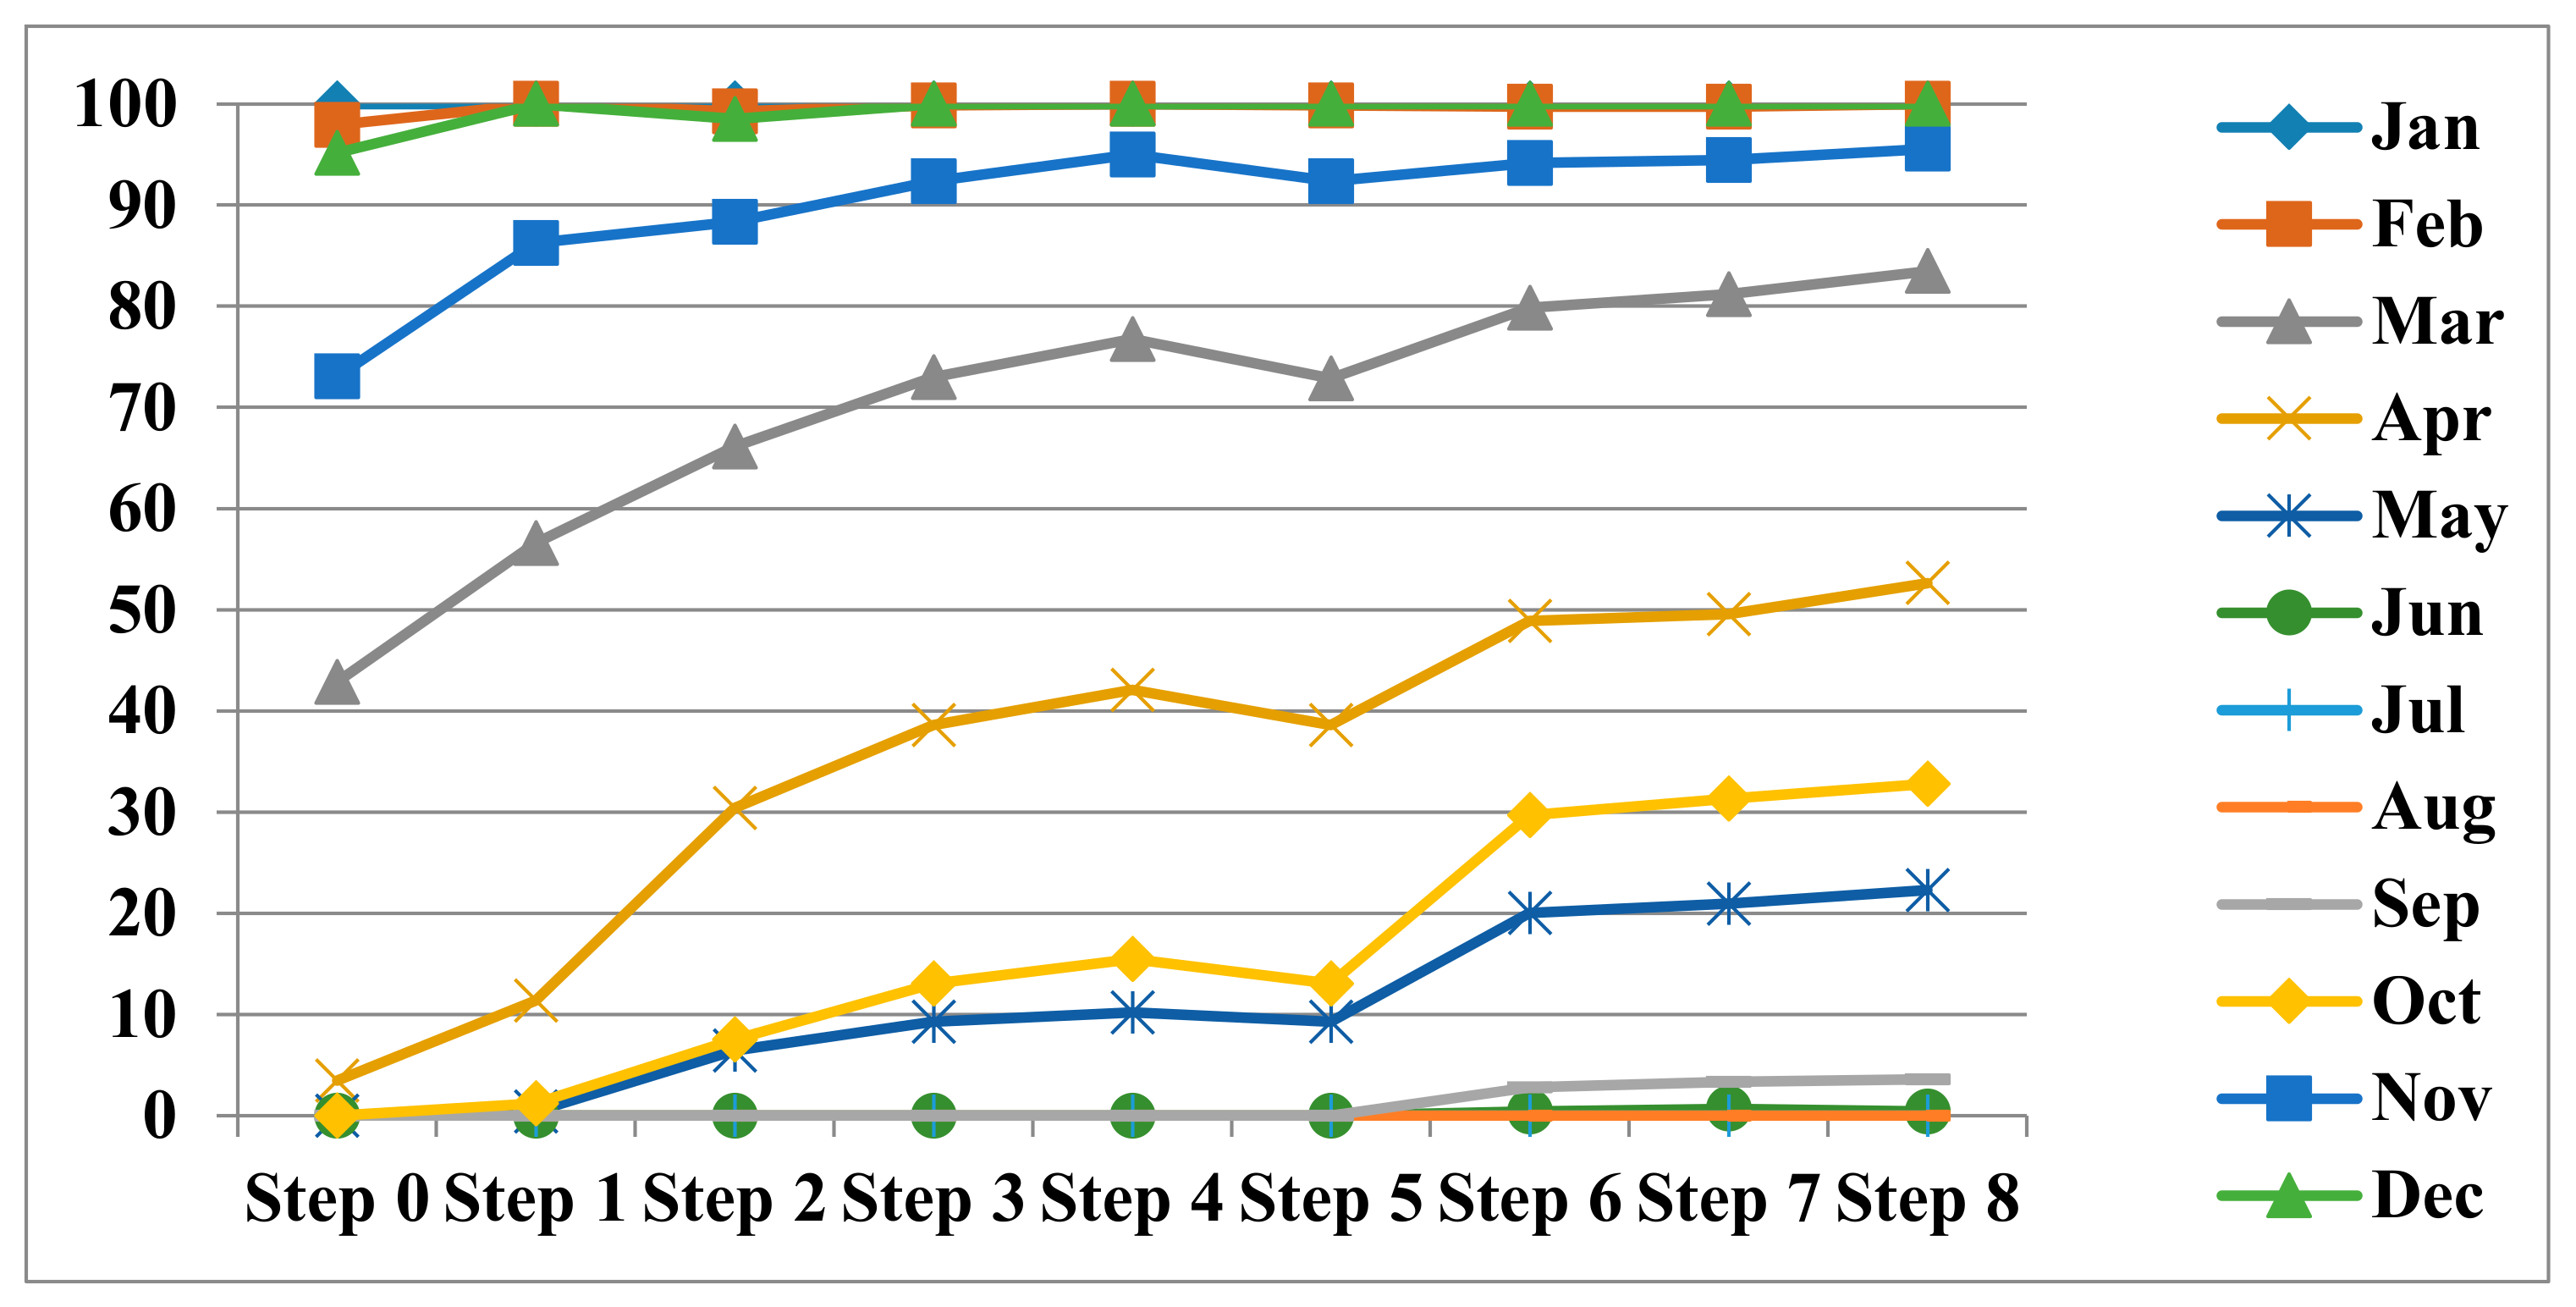
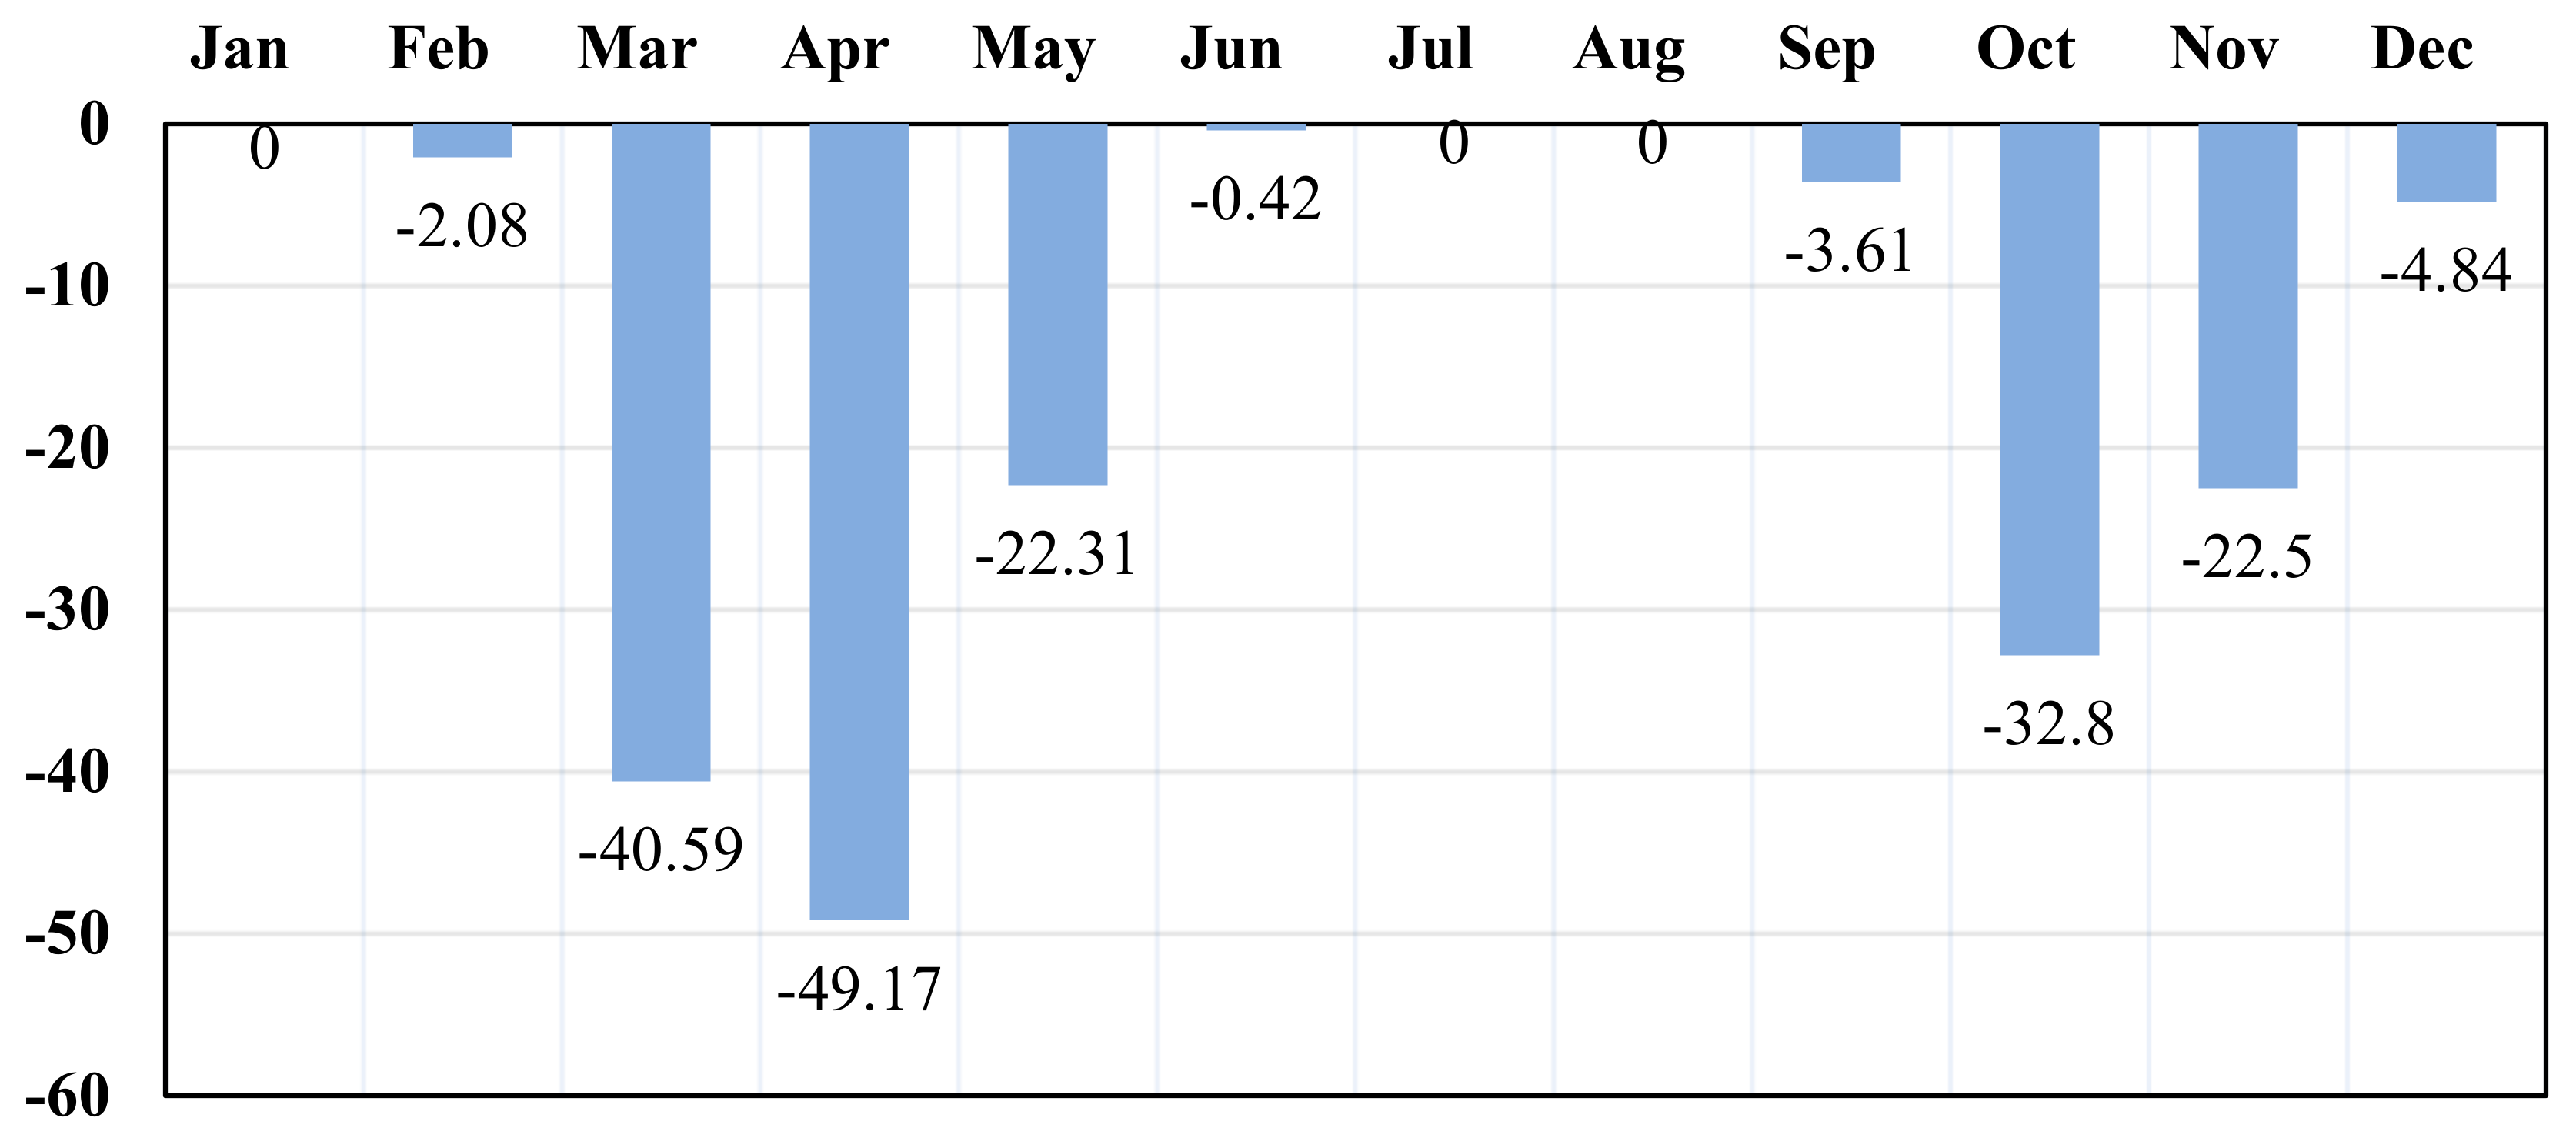
6.3. Thermal Discomfort Analysis during Cold Period

The cold discomfort rate was considered to be within the loss of comfort range. Thus, relying on the general measure of thermal comfort, which ranges from 18 to 26 °C, and based on the climatic data for the region, it was concluded that this was possible in several months of the year, except during winter. From this perspective, and based on the reading of the general curves of the percentage of cold thermal discomfort (Figure 12 and Table 5), the results were divided with the months of the year into 4 categories.
The first category covered the hot months of July, August, and September, where all the proposed solutions failed to bring about a reduction of more than 2%. The second category covered the months of May and October, where finally, there was a reduction in the percentage below the assumed level, which approached 30%, knowing that at the beginning of the simulation the rate was 0%. It is worth mentioning that the system of patios backfired again. The third category covered the months of April and March, where, despite the thermal difference at the start at 10% to 40%, there was a cooling loss of about 40% at the end of the operation for both at a regular rate of about 5%. The last category covered the cold season months of November, December, January, and February, where the rate of discomfort approached 100%, although the climatic data for the region proved that the temperature during these months was below the level of thermal comfort. Therefore, here, it was worthwhile to speak about the heating strategies rather than the cooling ones.

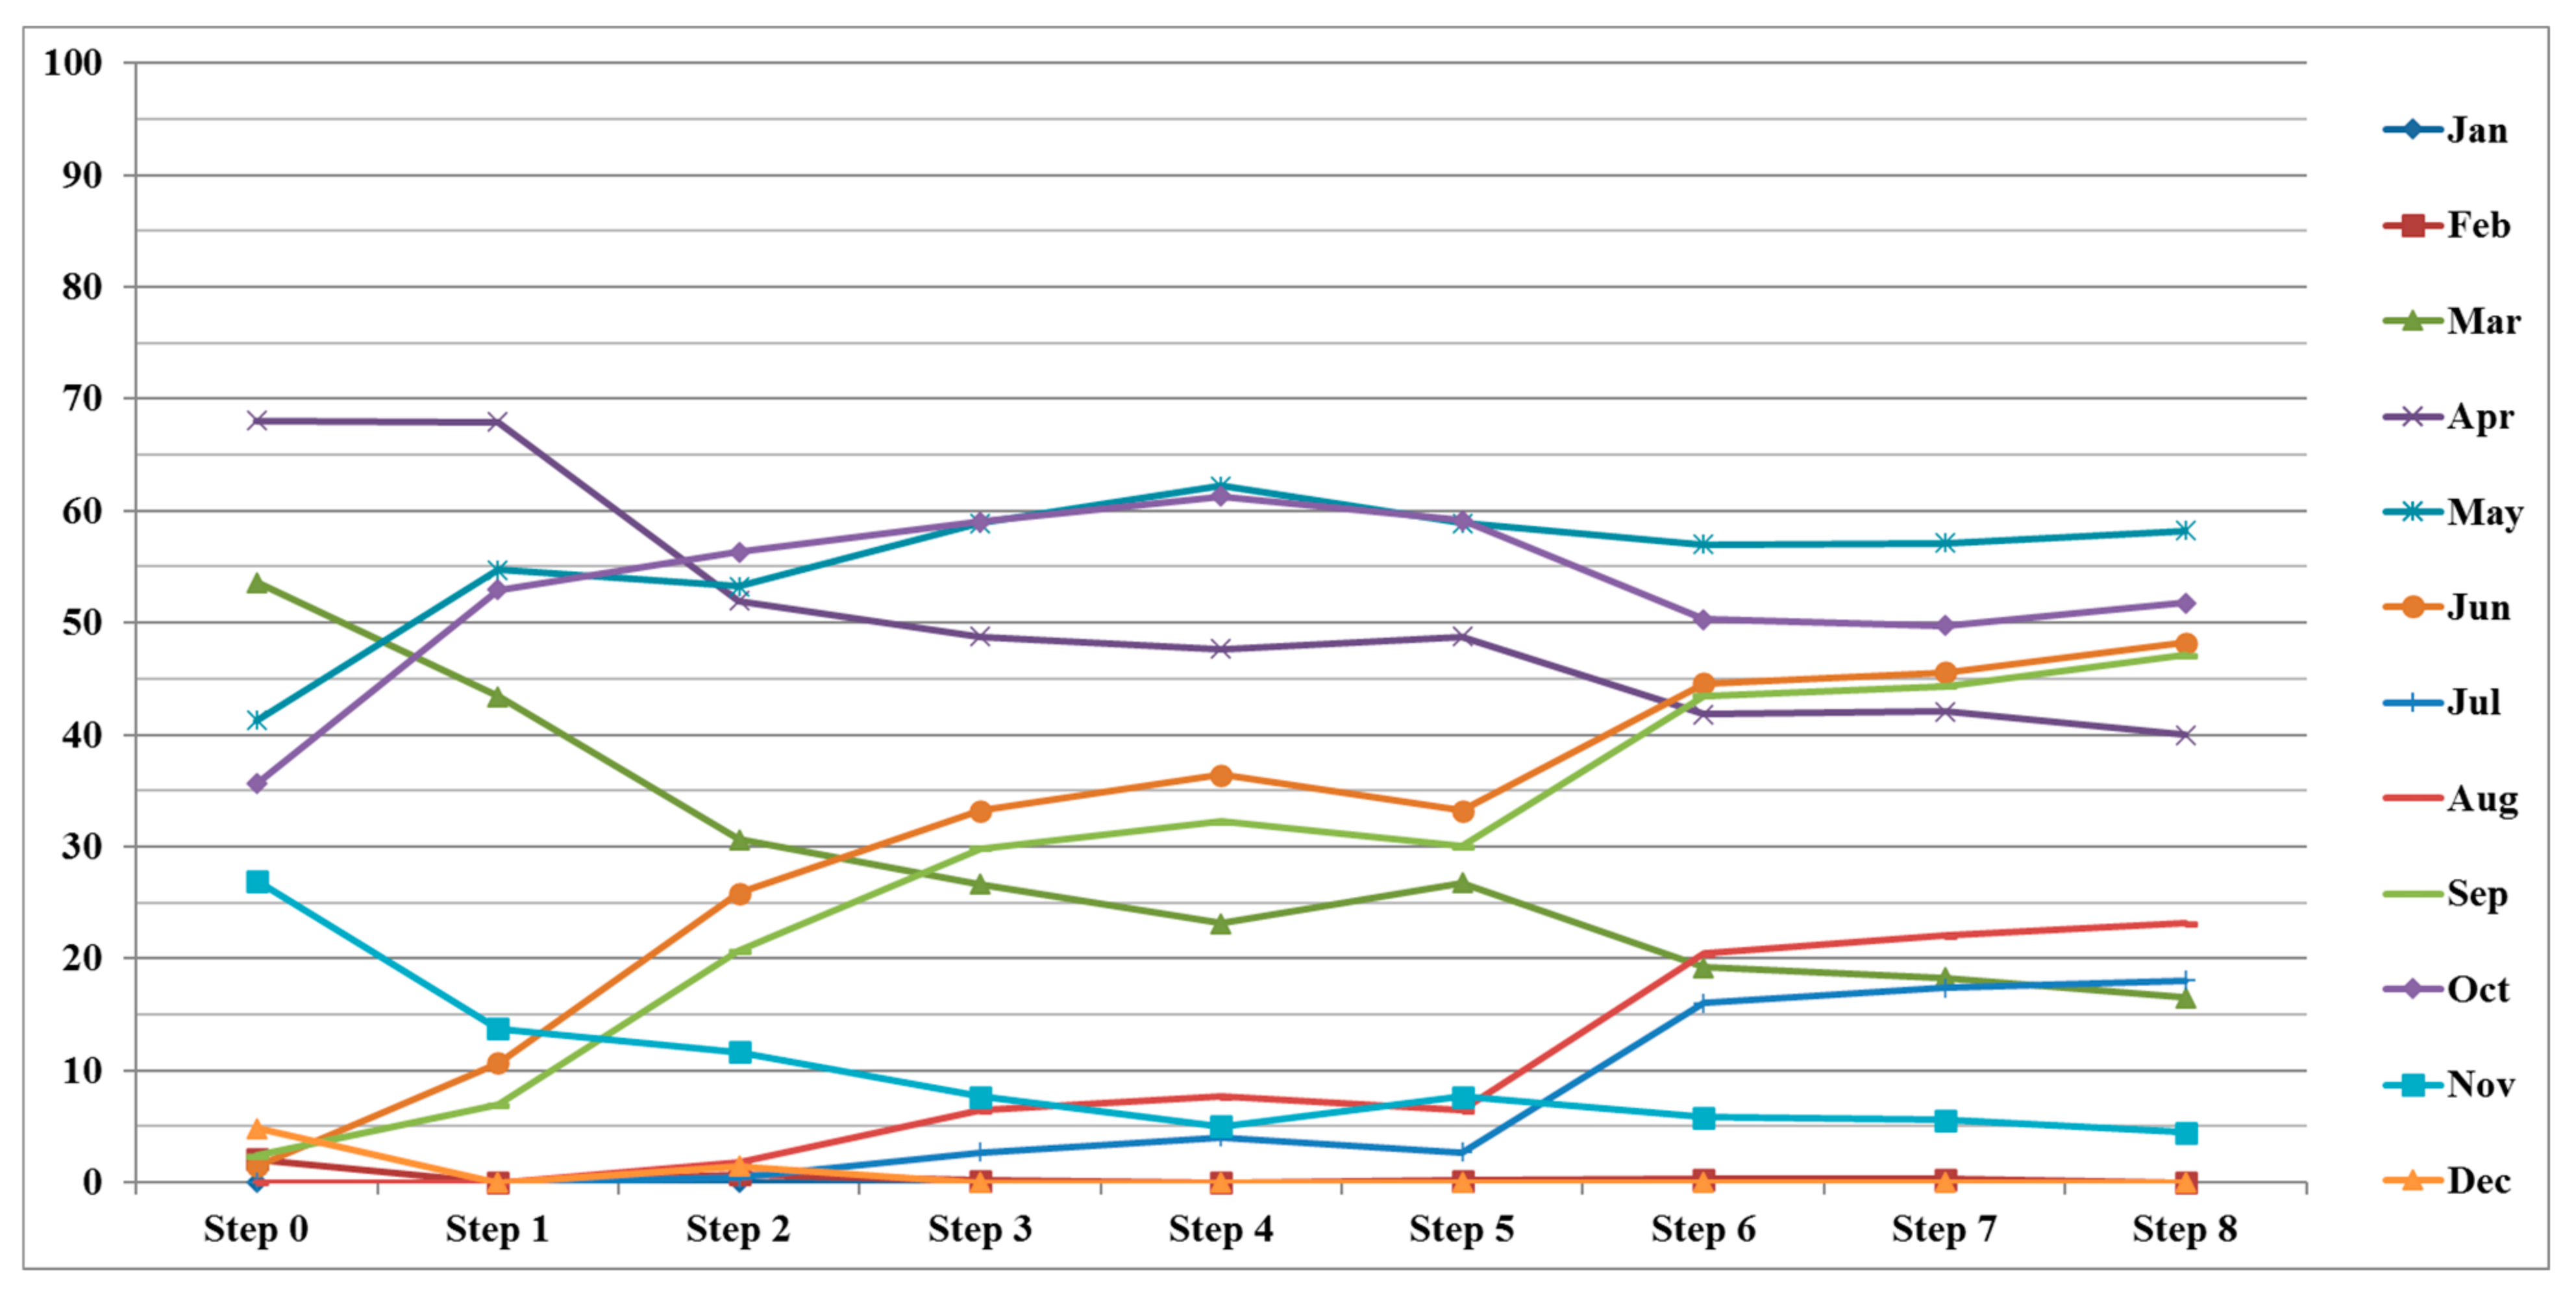
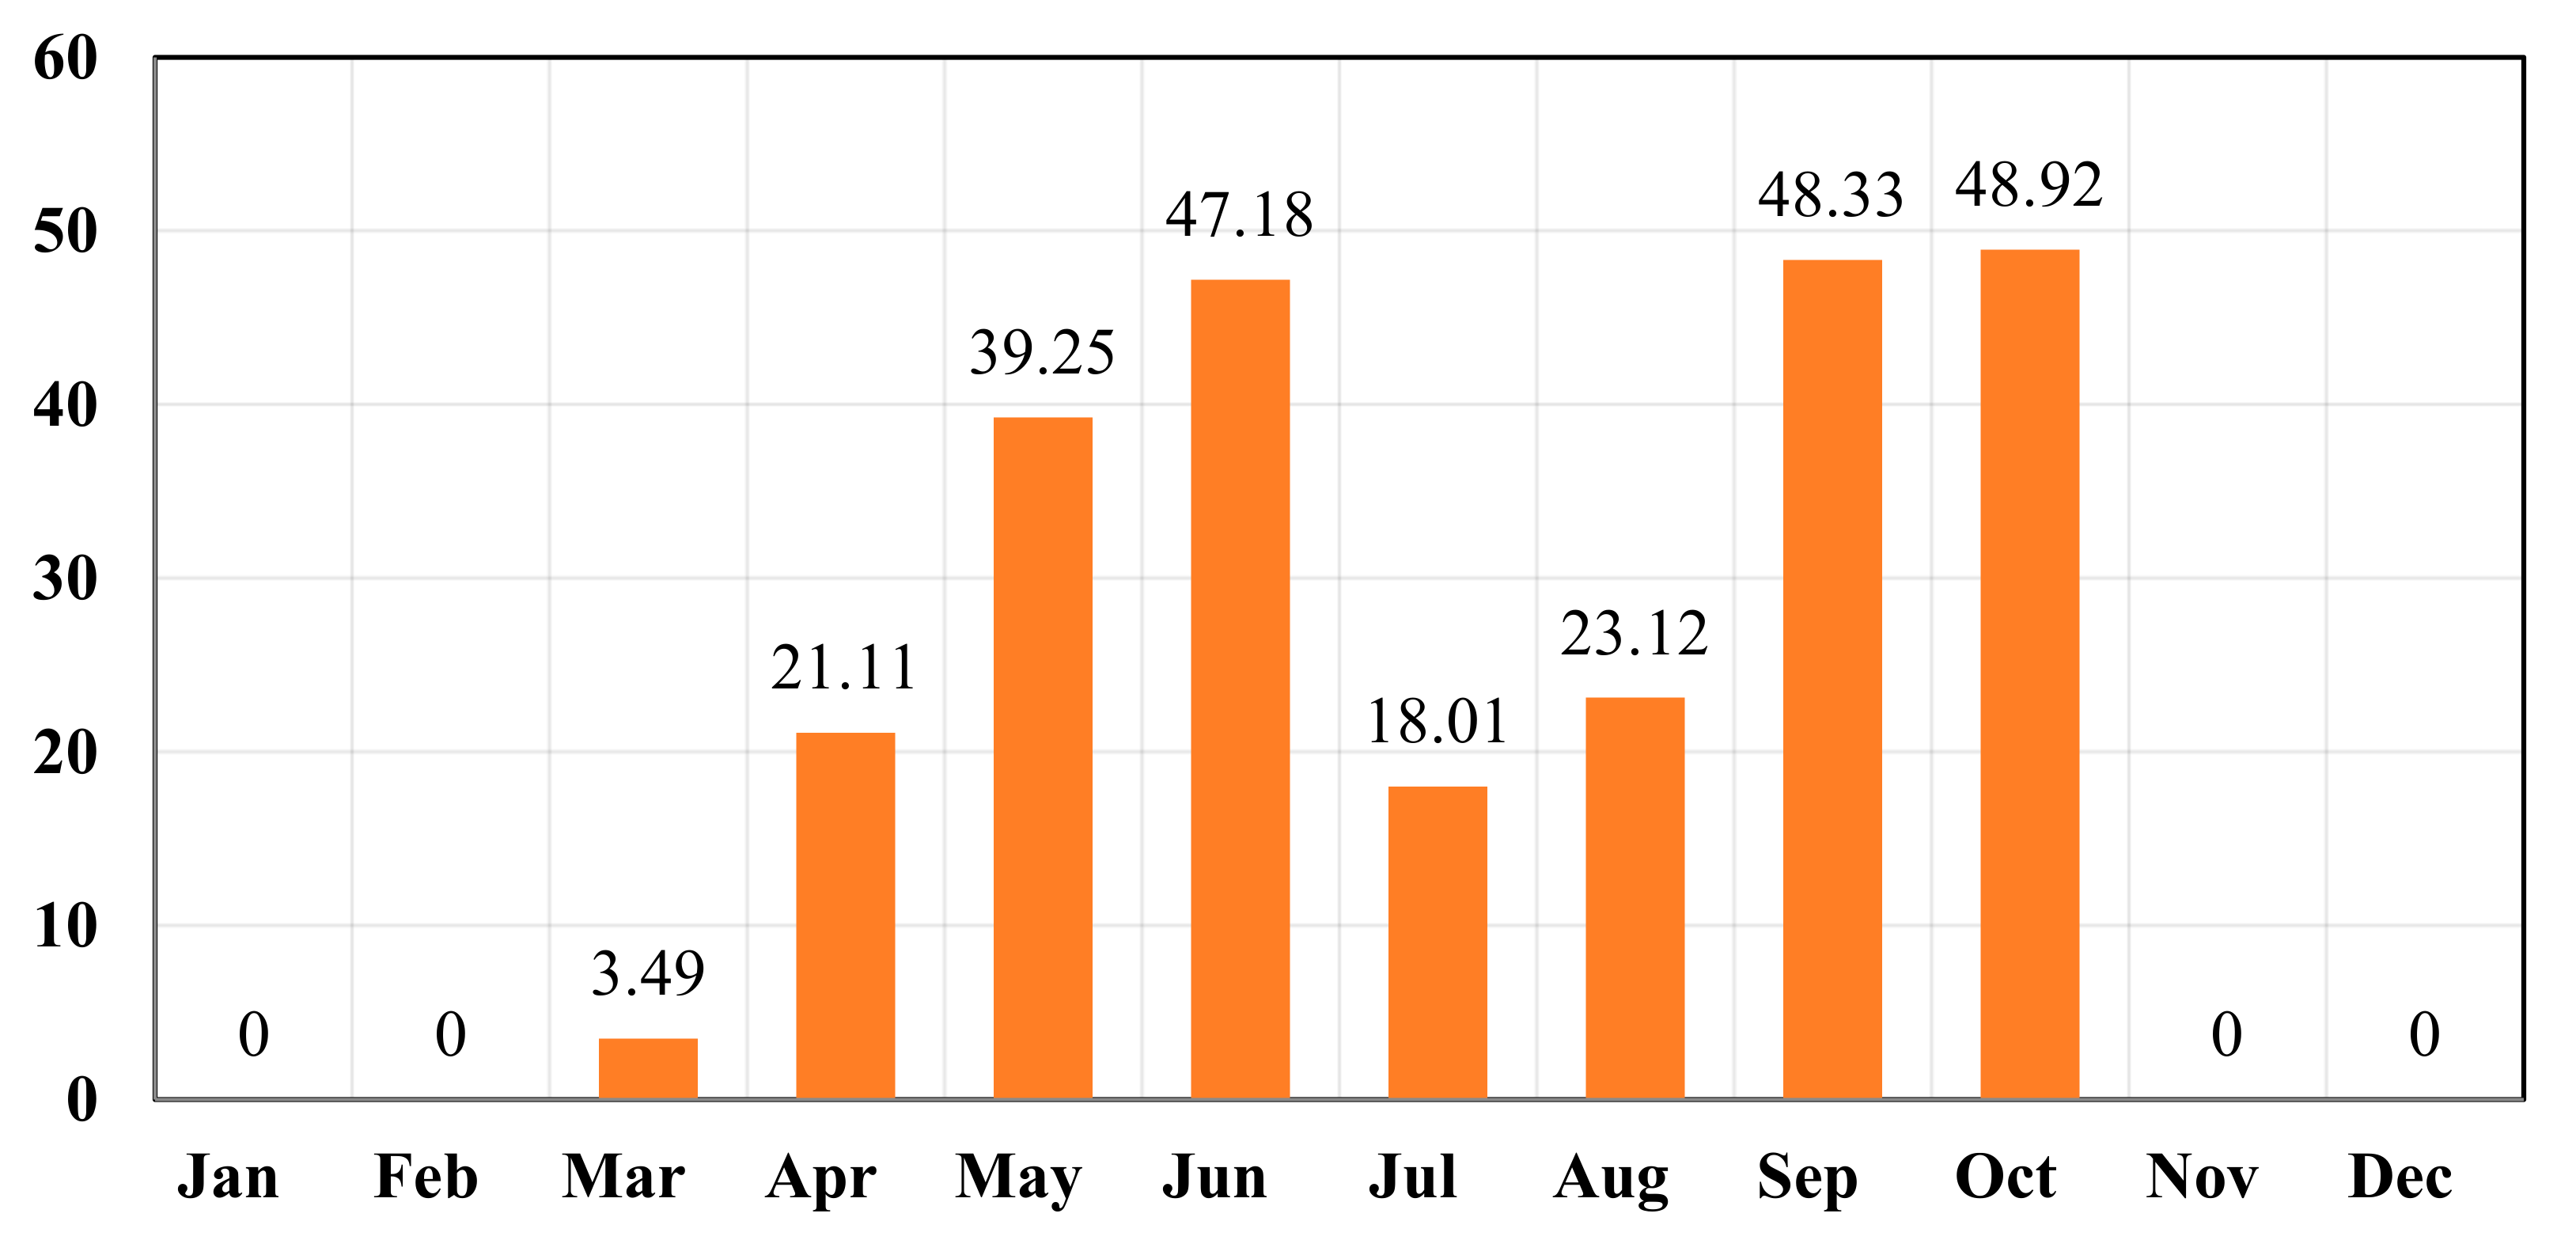
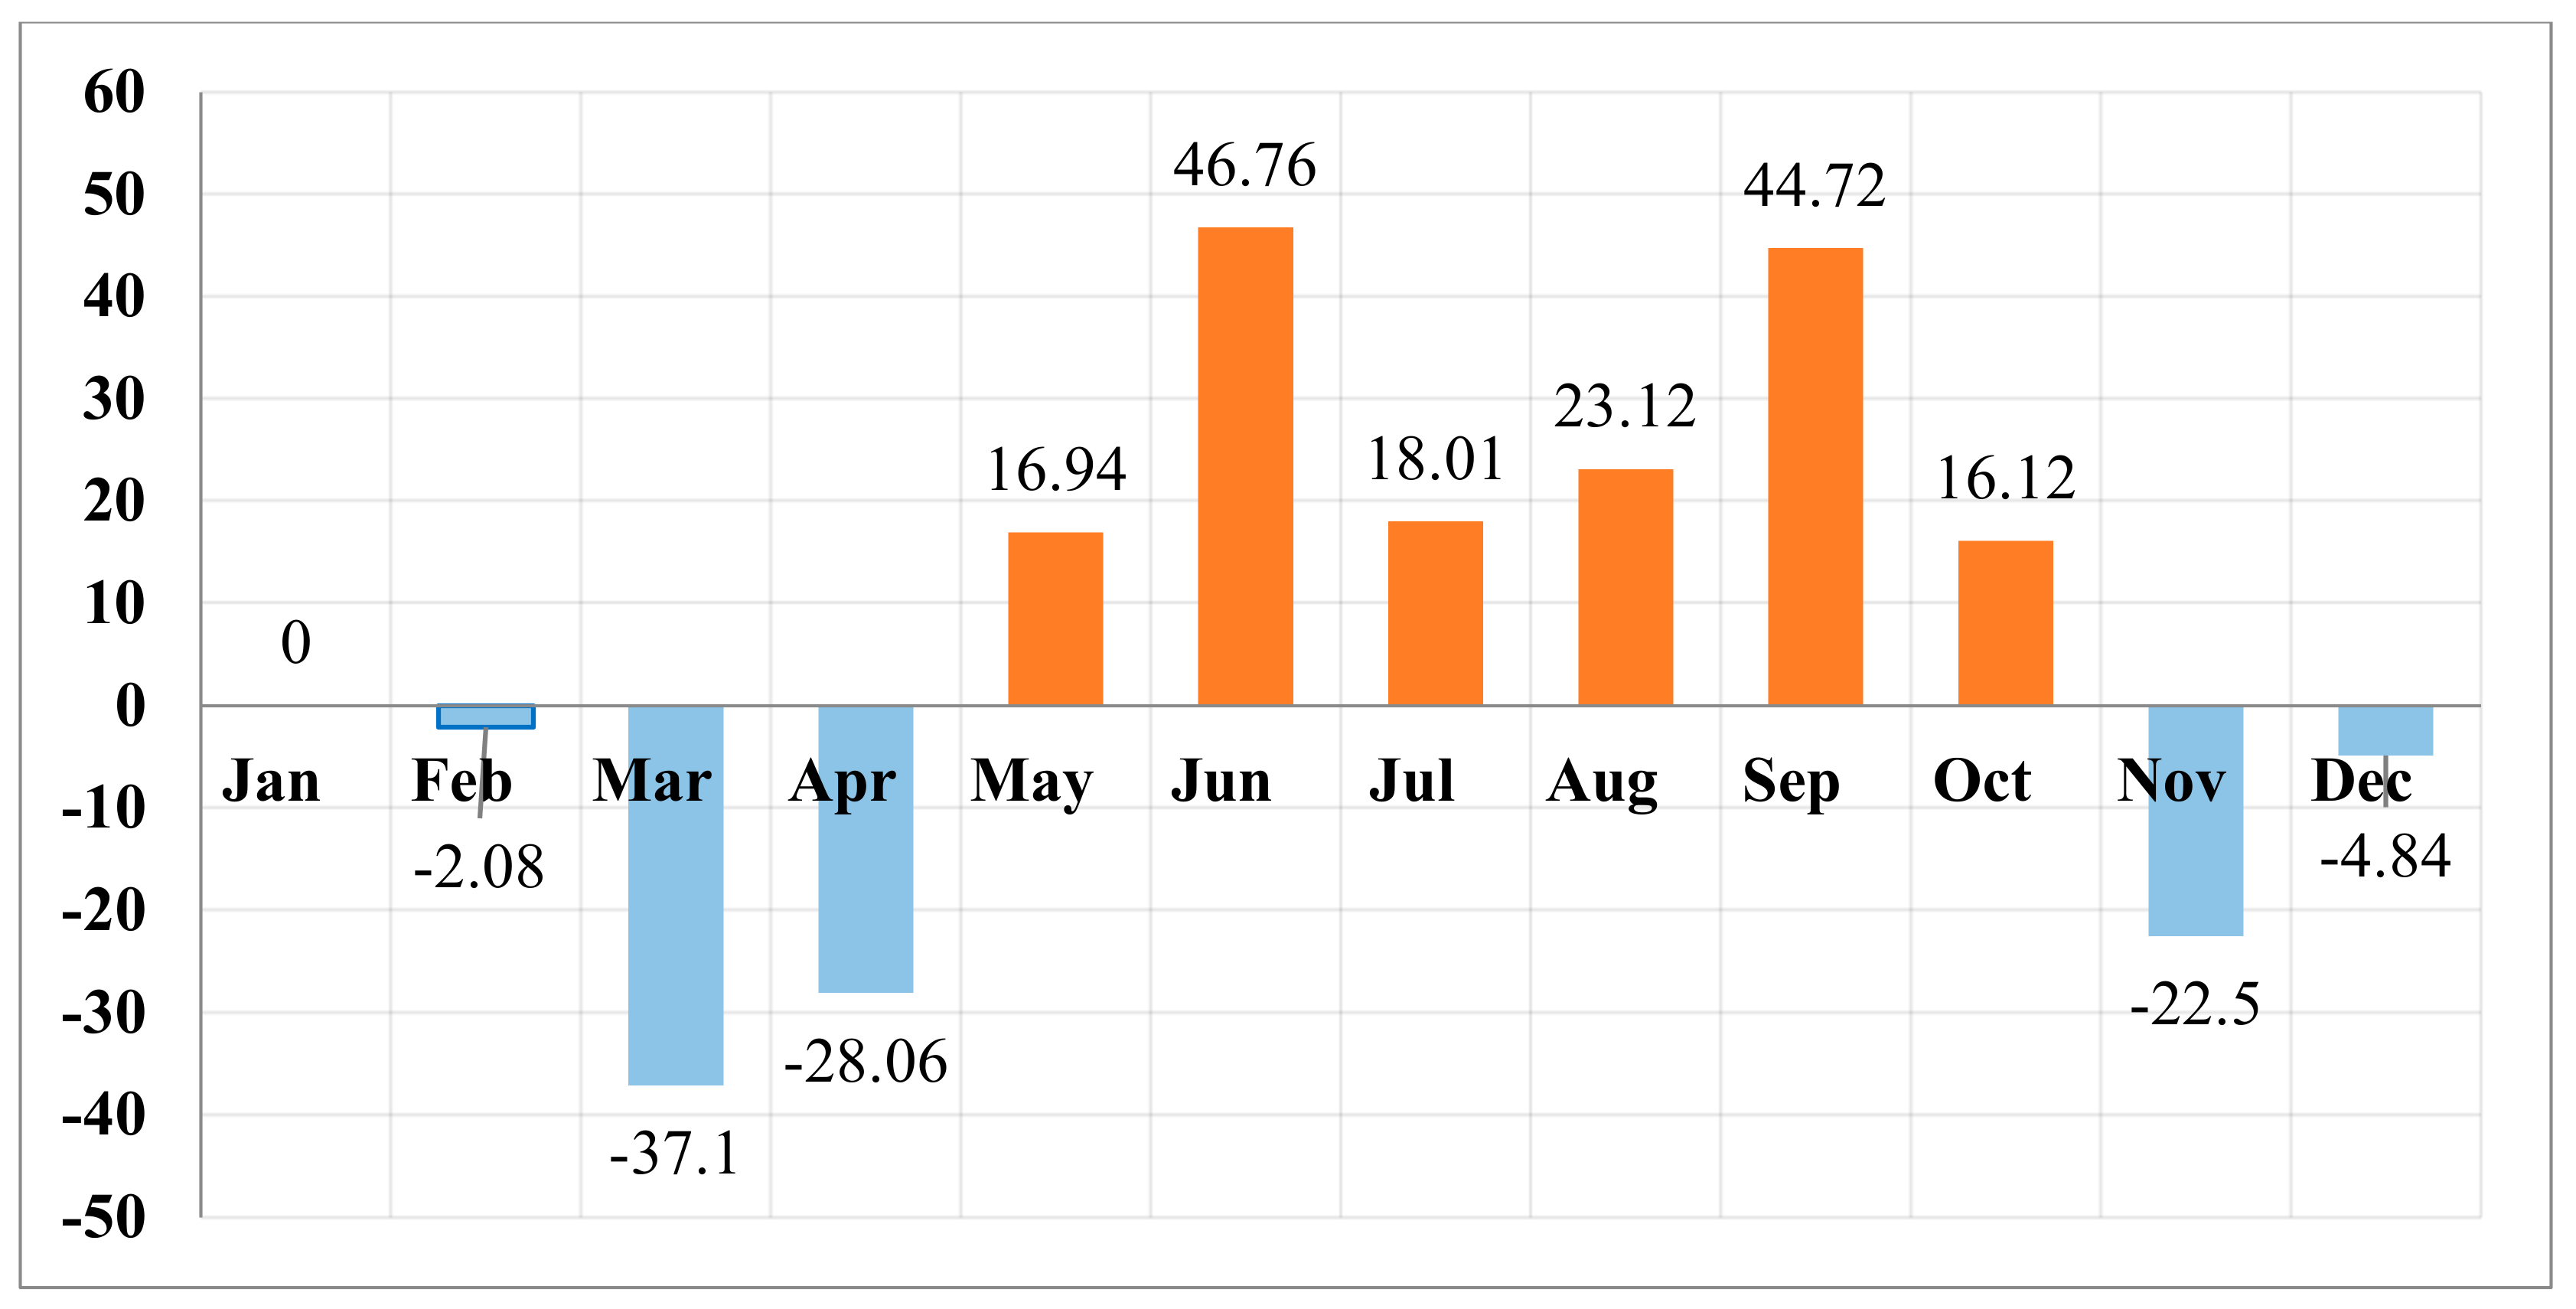
6.4. Thermal Discomfort Analysis during the Combined Period

Finally, for a holistic reading of the overall results of the thermal discomfort rate (Figure 13 and Table 6), the proposed solutions were divided according to the months of the year, into 3 main categories.
The first category concerned the month of January, where the results showed a reduction of 0% in the level of discomfort. The second category covered the hot months from May to October, where the results showed a reduction in the level of discomfort due to the use of the different solutions. A minimum gain of 16.12% was recorded in October and a maximum gain of 46.76% was recorded in June. The third category concerned the cold months from November to April, where, except for January, the results showed that there was a loss in the level of comfort due to the use of the different solutions. A minimum loss of −2.18% was recorded in February and a maximum loss of −37.1% was recorded in March.

7. Discussion

In this study, bioclimatic performance tests were carried out on several architectural elements of the design of a mosque in a hot and dry climate. Initially, simulations were conducted on a hypothetical model using 86 scenarios. The thermal performance of the selected architectural elements of the mosque design was measured at each step of a 9-step test. Next, the best solution for each architectural element was selected based on the best thermal performance using a reading of hot and cold discomfort curves. Finally, the mosque design model was elaborated based on this holistic bioclimatic vision.
An overall gain in the level of comfort was recorded for most months at each step for all the proposed solutions in the analysis parameters, with the gain in the level of comfort during the hot periods varying between 3.49% in March to 48.92% in October, which was a significant gain. Here, it was noticed that there was a decrease in the gain in July and August because of the very high temperature and radiation of the sun, where the passive solutions were unable to resist this harsh situation (Table 7 and Figure 14).
Furthermore, a loss in the level of comfort was recorded during the moderate months, varying between −2.08% in February and −49.17% in April because of the passive cooling solutions adopted. Here, two important points were noted. First, the loss in the level of comfort was detected more during the spring months than in the autumn months, and this was strongly related to the climatic conditions, where autumn is much hotter than spring in the northern Sahara. Second, the results showed that the loss and gain in the level of comfort during the moderate months were interpreted as gain during the day under sunny conditions and as a loss during the cold nights, where hot days and cold nights are characteristic of the northern Sahara during the moderate months (Table 7 and Figure 15).
Finally, the overall rate between loss and gain in the comfort level during the 12 months varied between 0% in January and a maximum overall gain of 46.76%, which was recorded in June with a hot day and a hot night, where the passive solutions were able to reduce the level of discomfort, and there was an overall loss of −37.1% in March due to cold nights, where the passive solutions aggravated the situation. As a final reading of all the results, it was decided that the passive solutions for all the selected parameters had a significant effect on reducing the level of discomfort throughout the year, especially during the hot months (Table 7 and Figure 16).

8. Conclusions

In conclusion, this research created a general model of a small mosque for a hot and dry climate in the Righ Valley, which is one of the oasis regions in the Algerian Sahara that is considered one of the harshest deserts in the world. In this model, bioclimatic principles and architectural elements were combined to provide thermal comfort, leaving the technical solutions to those fields where they are needed the most (Figure 17).
Finally, it was realized that the ideal size for a small mosque should be within the limit of providing space for 111 worshipers at a rate of 0.9 m2 per worshiper and that the general area of the prayer hall should be about 100 m2. The use of a rectangular shape instead of a square has proven to be effective, where the ratio of the length to width would be from 1.5, with the optimum length being 12.5 m, and the optimum width being within 8 m. As for the height, the best thermal solution was for it to be within 6 m using a vaulted roof, where the best diameter of the dome for the best thermal performance was within 3 m. The strategy of covering the roof to shade it was more effective, with a distance of 50 cm being between the original ceiling and the canopy sunshade. The results also proved that the patios were ineffective for mosques of this type and size in the region. In contrast, it was proven that a covered gallery was the ideal solution, where a single covered gallery was used at the level of the western facade with the same length of the facade, and with a width of 3 m and a height of 4.5 m. For the openings, the results proved that the optimum ratio of openings was estimated to be 27% for the western facade, at a minimum height of 1 m for the beginning of the openings, and 25% for the southern and northern facades at a minimum height of 1 m for the beginning of the window. The optimum ratio was 23%, with a minimum height of 2 m for the beginning of the window for the eastern facade. As for the external colors, the study proved that a reflection factor of 0.84 should be adopted, which was also the most realistic degree of reflection, and finally, compacted soil should be used for building the walls, while preserving the concrete structure (Figure 17).

Author Contributions

Conceptualization, A.A., A.M. and A.G.; Methodology, A.A.; Software, A.A. Formal analysis, A.A.; Investigation, K.E., M.A.A. and A.M.; Resources, K.E., M.A.A., M.H.A.; Data curation, A.G., A.M.; Writing—Original draft preparation, A.A.; Writing—Review and editing, A.M., A.G. and M.H.A.; Visualization, M.H.A. and A.M.; Project administration, K.E., M.A.A., M.H.A. All authors have read and agreed to the published version of the manuscript.

Funding

This research was funded by [Scientific Research Deanship at the University of Ha’il–Saudi Arabia] project number [RG-20 121].

Institutional Review Board Statement

Not applicable.

Informed Consent Statement

Not applicable.

Data Availability Statement

Data sharing not applicable.

Conflicts of Interest

The authors declare no conflict of interest.

References

  1. Abergel, T.; Dulac, J.; Hamilton, I.; Jordan, M.; Pradeep, A. Global Status Report for Buildings and Construction—Towards a Zero-Emissions, Efficient and Resilient Buildings and Construction Sector; International Energy Agency, IEA; Global Alliance for Buildings and Construction, GlobalABC; UNE: Nairobi, Kenya, 2019. [Google Scholar]
  2. Abdelhafez, M.; Touahmia, M.; Noaime, E.; Albaqawy, G.; Elkhayat, K.; Achour, B.; Boukendakdji, M. Integrating Solar Photovoltaics in Residential Buildings: Towards Zero Energy Buildings in Hail City, KSA. Sustainability 2021, 13, 1845. [Google Scholar] [CrossRef]
  3. Azmi, N.A.; Arıcı, M.; Baharun, A. A review on the factors influencing energy efficiency of mosque buildings. J. Clean. Prod. 2021, 292, 126010. [Google Scholar] [CrossRef]
  4. El Fouih, Y.; Allouhi, A.; Abdelmajid, J.; Kousksou, T.; Mourad, Y. Post Energy Audit of Two Mosques as a Case Study of Intermittent Occupancy Buildings: Toward more Sustainable Mosques. Sustainability 2020, 12, 111. [Google Scholar] [CrossRef]
  5. Al-Tamimi, N.; Qahtan, A.; Abuelzein, O. Rear zone for energy efficiency in large mosques in Saudi Arabia. Energy Build. 2020, 223, 110148. [Google Scholar] [CrossRef]
  6. Hassan, A.K. Mosque’s Courtyard and its Role in Reviving the Traditional Architecture in Contemporary Mosques. In Second International Conference on Architectural Conservation; IWAN, Ed.; IWAN Center for Architectural Heritage, Faculty of Engineering Islamic University of Gaza: Gaza, Palestine, 2010. [Google Scholar]
  7. Khalil, R. Mosques, in Faculty of Literature and Human Sciences; The Lebanese University: Beyrouth, Lebanon, 2014. [Google Scholar]
  8. Al-Harithy, H. Islamic Architecture: Form, Function, and Meaning. By Robert Hillenbrand. Columbia University Press, 2004. 645 pages. $30.00. J. Am. Acad. Relig. 2006, 74, 232–235. [Google Scholar] [CrossRef]
  9. Asfour, O.S. Bridging the Gap Between the Past and the Present: A Reconsideration of Mosque Architectural Elements. J. Islamic Archit. 2016, 4, 77–85. [Google Scholar] [CrossRef] [Green Version]
  10. Tabbaa, Y.; Hillenbrand, R. Islamic Architecture: Form, Function and Meaning. J. Am. Orient. Soc. 1997, 117, 180. [Google Scholar] [CrossRef]
  11. Tesch, N. 8 Masterpieces of Islamic Architecture Encyclopædia Britannica. 2019. Available online: https://www.britannica.com/list/art-abuse-11-vandalized-works-of-art (accessed on 28 March 2021).
  12. Ahriz, A. Postmodern Vision to Islamic Architecture, in International Forum on Islamic Architecture and Design; SAS, Ed.; University of Sharjah: Sharjah, United Arab Emirates, 2008. [Google Scholar]
  13. Rashid, M. Islamic Architecture: An Architecture of the Ephemeral. 2020. Working Paper. Available online: http://hdl.handle.net/1808/30156 (accessed on 30 March 2021).
  14. Widera, B. Comparative analysis of user comfort and thermal performance of six types of vernacular dwellings as the first step towards climate resilient, sustainable and bioclimatic architecture in western sub-Saharan Africa. Renew Sustain. Energy Rev. 2021, 140, 110736. [Google Scholar] [CrossRef]
  15. Aghimien, E.I.; Li, D.H.W.; Tsang, E.K.-W. Bioclimatic architecture and its energy-saving potentials: A review and future directions. Eng. Constr. Arch. Manag. 2021. [Google Scholar] [CrossRef]
  16. Elshafei, G. Bioclimatic Design Strategies Recommendations for Thermal Comfort Using Mahoney Tables in Hot Desert Bio-climatic Region. J. Urban Res. 2021, 39. [Google Scholar] [CrossRef]
  17. Martinez, T.; Duarte, M.; Garcia-Luna, A.C. How using smart buildings technology can improve indoor environmental quality in educational buildings. In Proceedings of the SHS Web of Conferences, Ulis, France, 3 May 2021; EDP Sciences: Ulis, France, 2021; Volume 102, p. 03003. [Google Scholar]
  18. Tsala, S.; Koronaki, I.P. Energy savings strategies in Campus Buildings of Athens—Greece. In Proceedings of the IOP Conference Series: Materials Science and Engineering, Athens, Greece, 14–15 December 2020; IOP Publishing: Bristol, UK, 2021; Volume 1037, p. 012041. [Google Scholar]
  19. Erebor, E.M.; Ibem, E.O.; Ezema, I.C.; Sholanke, A.B. Energy Efficiency Design Strategies in Office Buildings: A Literature Review. In Proceedings of the IOP Conference Series: Earth and Environmental Science, Ota, Nigeria, 23–25 June 2020; IOP Publishing: Bristol, UK, 2021; Volume 665. [Google Scholar]
  20. Motlagh, S.F.M.; Sohani, A.; Saghafi, M.D.; Sayyaadi, H.; Nastasi, B. The Road to Developing Economically Feasible Plans for Green, Comfortable and Energy Efficient Buildings. Energies 2021, 14, 636. [Google Scholar] [CrossRef]
  21. Asfour, O.S. Effect of Mosque Architectural Style on Its Thermal Performance. Islam. Univ. J. 2009, 17, 61–74. [Google Scholar]
  22. Cook, J. The Patrimony of passive cooling. In Symposium on Mosque Architecture; CAP, Ed.; King Saud University: Riyadh, Saudi Arabia, 1999; pp. 1–14. [Google Scholar]
  23. Mahmoud, M.E. Thermal design optimisation of mosques in Saudi Arabia. In Symposium on Mosque Architecture; CAP, Ed.; King Saud University: Riyadh, Saudi Arabia, 1999; pp. 5–30. [Google Scholar]
  24. Shohan, A.; Al-Khatri, H.; Bindajam, A.; Gadi, M. Solar Gain Influence on the Thermal and Energy Performance of Existing Mosque Buildings in the Hot-Arid Climate of Riyadh City. Sustainability 2021, 13, 3332. [Google Scholar] [CrossRef]
  25. Shohan, A.A.A.; Gadi, M.B. Evaluation of Thermal and Energy Performance in Mosque Buildings for Current Situation (Simulation Study) in Mountainous Climate of Abha City. Sustainability 2020, 12, 4014. [Google Scholar] [CrossRef]
  26. Samiuddin, S.; Budaiwi, I.M. Assessment of thermal comfort in high-occupancy spaces with relevance to air distribution schemes: A case study of mosques. Build. Serv. Eng. Res. Technol. 2018, 39, 572–589. [Google Scholar] [CrossRef]
  27. Azmi, N.A.; Kandar, M.Z. Factors contributing in the design of environmentally sustainable mosques. J. Build. Eng. 2019, 23, 27–37. [Google Scholar] [CrossRef]
  28. Othman, A.R.; Harith, C.M.; Ibrahim, N.; Ahmad, S.S. The Importance of Acoustic Design in the Mosques towards the Worshipers’ Comfort. Procedia Soc. Behav. Sci. 2016, 234, 45–54. [Google Scholar] [CrossRef] [Green Version]
  29. Prawirasasra, M.S.; Mubarok, S. Evaluation of acoustical comfort in mosque. In Proceedings of the IOP Conference Series: Materials Science and Engineering, 21–23 April 2017; Bangkok, Thailand; IOP Publishing: Bristol, UK, 2017; Volume 211, p. 12021. [Google Scholar]
  30. Hameed, A.N.A. Thermal Comfort Assessment to Building Envelope: A Case Study for New Mosque Design in Baghdad. Int. Trans. J. Eng. Manag. Appl. Sci. Technol. 2011, 2, 249–264. [Google Scholar]
  31. Abdullah, F.H.; Majid, N.H.A.; Othman, R. Defining Issue of Thermal Comfort Control through Urban Mosque Façade Design. Procedia Soc. Behav. Sci. 2016, 234, 416–423. [Google Scholar] [CrossRef] [Green Version]
  32. Mesloub, A.; Albaqawy, G.A.; Kandar, M.Z. The Optimum Performance of Building Integrated Photovoltaic (BIPV) Windows Under a Semi-Arid Climate in Algerian Office Buildings. Sustainability 2020, 12, 1654. [Google Scholar] [CrossRef] [Green Version]
  33. Tucci, F. Bioclimatic Approaches and Environmental Design. Strategies, Criteria and Requirements for an Evolution of Experimentations. In Bioclimatic Approaches in Urban and Building Design; Springer: Cham, Switzerland, 2021; pp. 93–109. [Google Scholar]
  34. Nundy, S.; Mesloub, A.; Alsolami, B.M.; Ghosh, A. Electrically actuated visible and near-infrared regulating switchable smart window for energy positive building: A review. J. Clean. Prod. 2021, 301, 126854. [Google Scholar] [CrossRef]
  35. Mesloub, A.; Ghosh, A. Daylighting Performance of Light Shelf Photovoltaics (LSPV) for Office Buildings in Hot Desert-Like Regions. Appl. Sci. 2020, 10, 7959. [Google Scholar] [CrossRef]
  36. Mesloub, A.; Ghosh, A.; Touahmia, M.; Albaqawy, G.A.; Noaime, E.; Alsolami, B.M. Performance Analysis of Photovoltaic Integrated Shading Devices (PVSDs) and Semi-Transparent Pho-tovoltaic (STPV) Devices Retrofitted to a Prototype Office Building in a Hot Desert Climate. Sustainability 2020, 12, 145. [Google Scholar] [CrossRef]
  37. Alhamad, I.M.; Hamdan, A.M. A Fuzzy-based smart HVAC controller for mosque buildings-A design procedure under Dubai climate. In Proceedings of the 2021 6th International Conference on Renewable Energy: Generation and Applications (ICREGA), Al Ain, United Arab Emirates, 2–4 February 2021; pp. 119–124. [Google Scholar]
  38. Tian, W. A review of sensitivity analysis methods in building energy analysis. Renew. Sustain. Energy Rev. 2013, 20, 411–419. [Google Scholar] [CrossRef]
  39. Mahar, W.A.; Verbeeck, G.; Reiter, S.; Attia, S. Sensitivity Analysis of Passive Design Strategies for Residential Buildings in Cold Semi-Arid Climates. Sustainability 2020, 12, 1091. [Google Scholar] [CrossRef] [Green Version]
  40. Tzuc, O.M.; Gamboa, O.R.; Rosel, R.A.; Poot, M.C.; Edelman, H.; Torres, M.J.; Bassam, A. Modeling of hygrothermal behavior for green facade’s concrete wall exposed to nordic climate using artificial intelligence and global sensitivity analysis. J. Build. Eng. 2021, 33, 101625. [Google Scholar] [CrossRef]
  41. Zeferina, V.; Wood, F.R.; Edwards, R.; Tian, W. Sensitivity analysis of cooling demand applied to a large office building. Energy Build. 2021, 235, 110703. [Google Scholar] [CrossRef]
  42. Rodrigues, C.; Freire, F. Environmental impacts and costs of residential building retrofits—What matters? Sustain. Cities Soc. 2021, 67, 102733. [Google Scholar] [CrossRef]
  43. Risch, S.; Remmen, P.; Müller, D. Influence of data acquisition on the Bayesian calibration of urban building energy models. Energy Build. 2021, 230, 110512. [Google Scholar] [CrossRef]
  44. Jumabekova, A.; Berger, J.; Foucquier, A. An efficient sensitivity analysis for energy performance of building envelope: A continuous derivative based approach. Build. Simul. 2021, 14, 909–930. [Google Scholar] [CrossRef]
  45. Chaudhry, A.A.; Buchwald, J.; Nagel, T. Local and global spatio-temporal sensitivity analysis of thermal consolidation around a point heat source. Int. J. Rock Mech. Min. Sci. 2021, 139, 104662. [Google Scholar] [CrossRef]
  46. Ahriz, A. Vegetation as a Climatic Component or Urban Design in Arid Lands; The Department of Architecture: Biskra, Algeria, 2018; p. 342. [Google Scholar]
  47. Google. Location of Oued Righ. (n.d.). Available online: https://www.google.com/maps/@28.1422542,1.9949428,5.25z (accessed on 30 March 2021).
  48. Kottek, M.; Grieser, J.; Beck, C.; Rudolf, B.; Rubel, F. World Map of the Köppen-Geiger climate classification updated. Meteorol. Z. 2006, 15, 259–263. [Google Scholar] [CrossRef]
  49. METEOTEST Genossenschaft. Meteonorm 80.3 (14.01.2021) Free Demo Version. In Global Meteorological Database; METEOTEST Genossenschaft: Bern, Switzerland, 2021. [Google Scholar]
  50. Jiang, J.; Wang, D.; Liu, Y.; Di, Y.; Liu, J.A. holistic approach to the evaluation of the indoor temperature based on thermal comfort and learning performance. Build. Environ. 2021, 196, 107803. [Google Scholar] [CrossRef]
  51. Khaleel, A.J.; Ahmed, A.Q.; Dakkama, H.J.; Al-Shohani, W.A. Effect of exhaust layout on the indoor thermal comfort under harsh weather conditions. J. Therm. Eng. 2020, 7, 148–160. [Google Scholar] [CrossRef]
  52. D’Ambrosio, A.; Romana, F.; Olesen, B.W.; Palella, B.I.; Pepe, D.; Riccio, G. Fifty years of PMV model: Reliability, implementation and design of software for its calculation. Atmosphere 2020, 11, 49. [Google Scholar] [CrossRef] [Green Version]
  53. Fabbri, K. Indoor Thermal Comfort Perception: A Questionnaire Approach Focusing on Children; Springer: Berlin/Heidelberg, Germany, 2015. [Google Scholar]
Figure 1. The process-based approach coupled with the generate and test technique.
Sustainability 13 06254 g001
Figure 2. Conceptual framework of the study.
Sustainability 13 06254 g002
Figure 3. Location of Oued Righ by authors from Google (n.d.) [47].
Sustainability 13 06254 g003
Figure 4. Climatic data of the case study analyzed by authors using Weather Tool from METEONORM [49].
Sustainability 13 06254 g004
Figure 5. Step 1—the square shape, and step 2—the rectangular shape.
Sustainability 13 06254 g005
Figure 6. Testing the thermal performance of the dome and the roof sunshade technique.
Sustainability 13 06254 g006
Figure 7. Testing the thermal performance of the covered hallways and the corridors.
Sustainability 13 06254 g007
Figure 8. Testing the thermal performance of the patios and the wall openings.
Sustainability 13 06254 g008
Figure 9. Sample of the thermal discomfort curves.
Sustainability 13 06254 g009
Figure 10. Sensitivity analysis rates for the hot period.
Sustainability 13 06254 g010
Figure 11. Annual summary of thermal discomfort curves during hot periods (%).
Sustainability 13 06254 g011
Figure 12. Summary of annual thermal discomfort curves during cold periods (%).
Sustainability 13 06254 g012
Figure 13. Summary of the annual thermal discomfort curves during the combined period (%).
Sustainability 13 06254 g013
Figure 14. Annual summary of the comfort level gains during hot periods (%).
Sustainability 13 06254 g014
Figure 15. Annual summary of comfort level losses during cold periods (%).
Sustainability 13 06254 g015
Figure 16. Annual summary of comfort level gains (%).
Sustainability 13 06254 g016
Figure 17. Final bioclimatic model proposed.
Sustainability 13 06254 g017
Table 1. Components of mosques that can control the thermal comfort.
FactorDetails
A.OrientationMosques are subject to the direction of the qibla, which means that each geographical area has a specific direction according to the movement of the sun, and that is why each region needs a specific climate study.
B.The surrounding areaMosques are generally considered independent structural islands, which makes them vulnerable to weather factors from all sides.
C.SizeMosques are generally divided into three different sizes, with the smallest ones being able to accommodate only 100 worshipers, the middle-sized ones up to 400 worshipers, and the largest ones more than 1000 worshipers.
D.Geometric shapeIn general, mosques are either rectangular or square shape.
E.Architectural formThis differs between closed mosques and half-opened mosques with patios.
F.Covered galleriesThey are generally found at the doorways of the prayer hall.
G.Roof shapeThe roof is either flat or vaulted.
H.Prayer hallsMosques have several types of prayer halls, with the simplest being a single-story prayer hall, and the more complex ranging from double-story to multistory prayer halls.
I.Height of the prayer hallIt should be at a value of 1.5 of the unit design of the prayer hall.
J.OpeningsOpenings are present in almost all the facades of mosques, except for the qibla wall, and if there are any, they are located above the level of vision.
K.Building materialsUsually, concrete and clay bricks are used for the structure and concrete bricks and stones for the walls and ceilings.
L.ColorsColor and texture are important factors that determine the amount of solar radiation that will be received from the walls and ceilings.
Table 2. Details of analysis parameters.
Analysis ParameterFixedVariableHypothetical ModelFirst StepSimulation RateFinal Step
OrientationX 12.72 °E/////////
The surrounding areaX independent mosque/////////
Size X80 to 120 worshipers72 m20.9 m2Best
Geometric shape Xsquare and rectanglesquare1/20 ratioBest
Prayer hallsX single-story prayer/////////
The height of the prayer hall X1.5 of design unit2.8 m0.1 cmBest
The roof shape Xflat and dome1 m diameter0.2 mBest
Covered galleries Xper 1 facadeL = facade//////
per 2 facadesH = 2.8 m0.1 mBest
per 4 facadesW = 2.40.1 mBest
The patio Xsame prayer hall area///0.5 mBest
Openings Xratio from all of walls10%5%Best
External Colors XReflection factor0.50.02Best
Building materials X04 propositionsmud bricks//////
cement bricks//////
polished stones//////
compacted soil//////
Table 3. Sensitivity analysis rates for the hot period (rates from 0 to 1).
Step 0Step 1Step 2Step 3Step 4Step 5Step 6Step 7Step 8
Jan000000000
Feb000000000
Mar00.0349−0.03230.02830.0027−0.0027−0.00540.0040.0054
Apr00.07780.03050.050.0236−0.02360.03330.00980.0097
May00.13850.04570.08470.043−0.0430.08870.01070.0242
Jun00.09260.15140.07360.032−0.0320.11810.01250.0236
Jul000.0040.02290.0134−0.01340.1330.01350.0067
Aug000.01750.0470.0121−0.01210.13980.01610.0108
Sep00.04580.13750.09170.0236−0.02220.16250.01390.0305
Oct00.18550.09670.0820.0471−0.04570.07790.01080.0349
Nov000000000
Dec000000000
Table 4. Annual summary of thermal discomfort during hot periods (%).
Step 0Step 1Step 2Step 3Step 4Step 5Step 6Step 7Step 8
Hot period thermal discomfort (%)Jan000000000
Feb000000000
Mar3.4903.230.40.130.40.940.540
Apr28.4720.6917.6412.6410.2812.649.318.337.36
May58.7444.8940.3231.8527.5531.8522.9821.9119.49
Jun98.5789.3174.1766.8163.6166.815553.7551.39
Jul10010099.697.3195.9797.3184.0182.6681.99
Aug10010098.2593.5592.3493.5579.5777.9676.88
Sep97.6493.0679.3170.1467.787053.7552.3649.31
Oct64.3845.8336.1627.9623.2527.8220.0318.9515.46
Nov000000000
Dec000000000
Table 5. Summary of annual thermal discomfort during cold periods (%).
Step 0Step 1Step 2Step 3Step 4Step 5Step 6Step 7Step 8
Cold period thermal discomfort (%)Jan100100100100100100100100100
Feb97.9210099.2699.8510099.8599.799.7100
Mar42.8856.5966.1372.9876.7572.8679.8481.1883.47
Apr3.4711.3930.4238.6142.0838.6148.8949.5852.64
May00.46.459.2710.229.2720.0320.9722.31
Jun0000000.420.690.42
Jul000000000
Aug000000000
Sep0000002.783.333.61
Oct01.217.5313.0415.4613.0429.731.3232.8
Nov73.0686.2588.3392.369592.3694.1794.4495.56
Dec95.1610098.52100100100100100100
Table 6. Summary of the annual thermal discomfort during the combined period (%).
Step 0Step 1Step 2Step 3Step 4Step 5Step 6Step 7Step 8
Combined period thermal discomfort (%)Jan000000000
Feb2.0800.740.1500.150.30.30
Mar53.6343.4130.6426.6223.1226.7419.2218.2816.53
Apr68.0667.9251.9448.7547.6448.7541.842.0940
May41.2654.7153.2358.8862.2358.8856.9957.1258.2
Jun1.4310.6925.8333.1936.3933.1944.5845.5648.19
Jul000.42.694.032.6915.9917.3418.01
Aug001.756.457.666.4520.4322.0423.12
Sep2.366.9420.6929.8632.223043.4744.3147.08
Oct35.6252.9656.315961.2959.1450.2749.7351.74
Nov26.9413.7511.677.6457.645.835.564.44
Dec4.8401.48000000
Table 7. Annual summary of the comfort level gains.
Hot Period Comfort Gains (%)Cold Period Comfort Gains (%)Combined Period Comfort Gains (%)
Jan000
Feb0−2.08−2.08
Mar3.49−40.59−37.1
Apr21.11−49.17−28.06
May39.25−22.3116.94
Jun47.18−0.4246.76
Jul18.01018.01
Aug23.12023.12
Sep48.33−3.6144.72
Oct48.92−32.816.12
Nov0−22.5−22.5
Dec0−4.84−4.84
Publisher’s Note: MDPI stays neutral with regard to jurisdictional claims in published maps and institutional affiliations.

