1. Introduction
In recent decades, business corporations have been more concerned about environmental impacts caused by their innovation. Business corporations are moving toward a suitable sustainable solution for those environmental issues. The vast sustainable technological developments initiated the fourth industrial revolution to mitigate environmental risk through different techniques. Environmentally friendly innovation is one of the sustainable techniques to control environmental risk. A study by Ryszko [
1] stated that business corporations require environmentally friendly innovations to mitigate environmental risks. However, these environmentally friendly innovation initiatives increased during the COVID-19 pandemic. Therefore, business corporations need to approach it proactively. Surprisingly, the United Nations had already initiated and supported environmentally friendly innovations through the Sustainable Development Goals (SDGs) 2030 plan. This plan indicated 17 goals on proactive initiatives relating to environmentally friendly innovations.
There is a growing body of literature that recognizes the importance of innovations relating to sustainability and circular economy. These environmentally friendly innovations are general innovation, green innovation, social innovation, open innovation, and eco-innovation. Amongst all, eco-innovation has emerged as one of the most vital innovations for sustainable businesses [
1,
2,
3,
4,
5].
The role of eco-innovation in the industry has received increased attention for several reasons during the pandemic. Environmentally friendly, sustainable business solutions, manufacturing waste reduction, pollution-free technology, and cost advantages are a few of the prime reasons behind eco-innovation acceptance in the industry. This is in line with the three pillars of sustainability such as economic, social, and environmental. Furthermore, eco-innovation is also associated with the circular economy through its proactive dimensions like product, process, and technology. It is considered that fundamental concepts of waste and pollution reduction have a link with the circular economy. Therefore, it is implied that product eco-innovation, process eco-innovation, and technological eco-innovation contribute towards a circular economy by ensuring pollution reduction in the environment and waste reduction in the business manufacturing process.
The motivation of the study is split into two. Firstly, due to the rapid boost in climate change and global warming, the whole world is experiencing a serious environmental problem. According to the [
6] Global Risk Report published by the World Economic Forum (WEF), 2.7 billion people are at risk due to climate change. It will be viewed as an alarming situation in most political and non-political forums. Therefore, it is also a startling situation for the next generation. Secondly, in the era of the Internet, artificial intelligence, and the information age, investors and consumers are aware of environmental issues. These issues make them conscious of the current business model. Currently, most of the organizations are following the traditional business model, which ended up emitting 36.83 billion tons of CO
2, 7.70 million tons of solid waste, and energy demand rose by 2.3% in the year 2018. Therefore, the current business model needs to be replaced with a proactive sustainable business model.
It was inferred from
Table A2 (summary of literature review on proactive eco-innovation) that only a limited amount of the literature has been published on the association between eco-innovation and firm financial performance. A firm’s financial performance is a part of most of the research studies in eco-innovation that have been conducted on a reactive level. There are few studies found on proactive initiatives specifically related to the environment. Thus far, very little attention has been paid to the role of proactive initiatives concerning eco-innovation and a firm’s financial performance. Hence, there is a critical need to investigate the relationship between proactive eco-innovation and a firm’s financial performance. They are linked to enormous environmental problems including the demand of the stakeholders.
Most previous studies which were conducted highlighted the reactive approach and focused on primary data. There are a few studies that focus on content analysis utilizing available secondary data. This study mitigates the existing research gap by highlighting proactive eco-innovation along with a secondary dataset. This study identified one of the most common problems that most business organizations are aware of and are concerned about—the environmental problem as well as eco-innovation. However, their approach regarding these problems is reactive rather than proactive. Therefore, the purpose of this study is to investigate the relationship between proactive eco-innovation and firm financial performance. In addition to that, it is to introduce a proactive eco-innovation index using secondary data and, furthermore, the study will also explore how proactive eco-innovation relates to the circular economy.
The rest of the study is structured as the literature review, theoretical background, and hypothesis in the following section. Then, the research methodology is introduced in
Section 3.
Section 4 presents the data analysis and results, supported by the discussion of findings. The last section is the conclusion which highlights limitations, the contribution of this study, and future research work.
Meanwhile, the following section will critically present the literature review relating to eco-innovation, proactive eco-innovation and their dimensions highlighting the theoretical background, followed by hypothesis development.
2. Literature Review, Theoretical Background and Hypotheses Development
The previous introduction section has already highlighted the eco-innovation importance in the industry from a sustainability and circular economy point of view, highlighting the proactiveness in product, process, and technology dimensions. The following paragraphs will describe more relating to firm financial performance highlighting the three dimensions (product, process and technology) of proactive eco-innovation.
2.1. Literature Review of Proactive Eco-Innovation Dimension
The term eco-innovation is derived by combining two words, Eco and Innovation. “Eco” means “environment-friendly” and “Innovation” means introducing something new. Eco-innovation was introduced in the third industrial revolution and extended in the fourth industrial revolution, which emphasized innovation and sustainability. The report Limits to Growth published by the Club of Rome and Brundtland (1987), published by the United Nations, highlighted sustainability as an imperative way to save scarce resources for economic progress and future generations. There is a need to show and discover the unique method of utilizing the limited resources effectively.
Kemp and Pearson [
7] defined eco-innovation as “the production, assimilation or exploitation of a product, production process, service or management or business method that is novel to the organization (developing or adopting it) which results, throughout its life cycle, towards reduction of environmental risk, pollution and other negative impacts of resources use (including energy use) compared to relevant alternatives.” Research organizations such as [
8], together with researchers, [
7,
9] identified three prime dimensions of eco-innovation—product, process, and technology. The following section will highlight the three dimensions of proactive eco-innovation.
Product eco-innovation incorporates both goods and services. Goods and services minimize the overall impact on the environment. This feat is achieved through their production while emphasizing the eco-design aspect [
7,
10] defined as product eco-innovation by emphasizing its potential users. According to EIO [
10] product eco-innovation is the introduction of goods or services that is new or significantly improved for their characteristics or intended uses.
According to EIO [
10], process eco-innovation is defined as the implementation of new or significantly improved production or delivery methods, which accelerate the reduction in environmental impact through significant variations in techniques, equipment, and software. A study from Kemp and Pearson [
7] identified the traits of it. According to them, a decrease in material use, lower risk, and cost savings are the predominant traits of ‘process’ eco-innovation.
Technological eco-innovation happens with investments in green equipment and the installation of unconventional green production technologies. According to Ryszko [
1], technological eco-innovations are crucial in providing information to inclusive material-saving plans and the management of credentials and statistics. They further added that the nature of technological eco-innovation is complex. A study of EIO [
10] explained that the complex nature of technological eco-innovation compels the firms to implement it by the development process or implementation through specific resources and green capabilities. It is claimed that firms require resources and capabilities for technological eco-innovation.
2.2. Proactive Eco-Innovation and Firm Financial Performance
Investors are investing their savings in a firm by investigating the present and future probable financial performance of that firm. Several studies have been conducted on a firm’s financial performance by highlighting its bottom-line performance. Therefore, a firm’s financial performance is recognized as a fundamental performance indicator in relation to eco-innovation [
11,
12,
13].
Przychodzen and Przychodzen [
12] found that eco-innovation is favorably associated with a company’s financial performance in Poland and Hungary. For the firm’s financial results, they just used accounting-based metrics like Return on Assets (ROA) and Return on Equity (ROE) (ROE). They claimed that eco-innovation expenditure resulted in a better return on assets and equity for the company. Their findings have suggested that strong financial assets are needed for the growth of eco-innovation. Although it is true that businesses will have substantial financial reserves, they cannot profit from eco-innovation if they are not constructive rather than reactive with their spending. Furthermore, Ryszko [
1] and Pacheco et al. [
14] used the same accounting metrics to make the same point about eco-innovation.
Furthermore, Santos et al. [
5] conducted a study in Brazil that found a positive link between eco-innovation and financial success, similar to [
12], and [
5], on the other hand, used market-based metrics like Tobin’s Q rather than accounting-based indicators. They argued that market-based interventions, rather than accounting-based measures, produce more efficient outcomes. They went on to illustrate the environmental and social perspectives on eco-innovation. There is a case to be made that companies will have improved financial results if they are constructive with their eco-innovation programs.
Furthermore, a study from China by [
15] confirmed that eco-innovation has positive relations to a firm’s performance. They took managerial concern as moderating variable between eco-innovation and a firm’s performance and, surprisingly, found that eco-innovation effects were largely based on a firm’s performance. They took 188 unique manufacturing firms from China. They also used both accounting-based measures and market-based measures. One may claim that managerial concerns are more important than measurement methods of a firm’s financial performance for proactive eco-innovation initiatives.
However, only a few studies have found a connection between eco-innovation and a company’s financial results [
5,
16]. The study in [
5] demonstrate that eco-innovation and financial success are adversely associated from a social standpoint. According to Rezende et al. (2019), there is no significant relationship between eco-innovations and a company’s financial success in the first year. The year of eco-innovation spending was the study’s constraint. These findings suggest that eco-innovation and a company’s financial success are related.
According to a meta-analysis that included 64 observational studies, 55 percent of the studies found a positive correlation, 30% found no impact, and 15% found a negative link between eco-innovation and a firm’s performance [
11]. Following a study of the empirical analysis, it is concluded that eco-innovation and a company’s financial success yield mixed results [
17]. The majority of eco-innovation studies have been undertaken in developing countries; according to others, Malaysia [
17,
18,
19] received insufficient coverage. Aside from these, there have been few reports on proactive eco-innovation and financial performance. As a finding, the result is therefore inconclusive and needs additional investigation.
2.3. Theoretical Background
The Resource-Based View Theory (RBV) was used to explain the association between proactive eco-innovation and firm financial performance in this study which was supported by previous researchers such as the authors of [
1,
9,
18]. The resource-based view is a management framework for governing a company’s strategic resources. Generally, a firm will use strategic resources to gain a long-term comparative edge over its competitors. In addition to that, the RBV focuses managerial attention on the firm’s internal resources in order to locate strengths, skills, and competencies that will provide the firm with a comparative edge over its competitors. Therefore, it is argued that RBV is the most relevant and strongest theory in eco-innovation and firm performance studies.
2.4. Conceptual Framework of Proactive Eco-Innovation and Hypothesis Development
The independent variable of this proposed conceptual framework consists of specifically proactive eco-innovation. It has three-dimensions, viz. product eco-innovation, process eco-innovation, technology eco-innovation. A firm’s financial performance is the dependent variable in this conceptual framework. The firm’s financial performance is measured by market-based measures such as Tobin’s Q ratios. Firm size and firm age are considered to be control variables for this study. The
Figure 1 illustrated the conceptual framework on proactive eco-innovation.
The following hypothesis can be developed based on previous literature review discussions.
Hypothesis 1 (H1). Proactive product eco-innovation will have a positive association with firm financial performance.
Hypothesis 2 (H2). Proactive process eco-innovation will have a positive association with firm financial performance.
Hypothesis 3 (H3). Proactive technology eco-innovation will have a positive association with firm financial performance.
3. Research Methodology
This study was based on secondary panel data. Moreover, this study was conducted on 31 public listed energy companies from Malaysia from 2015 to 2019. The total population purposive sampling technique was employed to choose a representative sample. The data for the study were collected from secondary sources (sustainability reports, annual reports, and company websites) which are audited verified documents [
20] and compliance with latest IFRS [
21] from firm through content analysis using an index. This was adopted from two different sources which is illustrated in
Table 1.
Studies such as Sekaran and Bougie [
22] and Hair et al. [
23] recommended a process to confirm the content validity of the index which was applied in this study. Firstly, in-depth interviews were performed with three academicians and two industry personnel who had previous expertise knowledge on eco-innovation research through a Microsoft teams meeting because of COVID-19. They presented their views regarding the issues on proactive eco-innovation and firm financial performance based on their actual and practical knowledge and experience on it. Secondly, a primary version of the index items was revised and modified based on discussions and suggestions from several expert academics and industry personnel. Finally, a pre-test was performed that delivered ensuing, fine-tuning opportunities to create an informative, clear, and well-structured index for proactive eco-innovation considering three dimensions.
This study is based on Malaysia because the same reactive condition regarding eco-innovation is also observed in this country, which also has the same environmental problems and sustainability issues. According to the International Monetary Fund (2018), Malaysia is the 3rd largest economy in Southeast Asia, and it is the 35th largest economy in the world (World Economic Outlook, October 2018). Despite these facts, the country’s innovation ranking, eco-innovation ranking, SDG performance, and environment performance ranking is decreasing. According to the Asia–Europe Meeting (ASEM) Eco-innovation index (2015), Malaysia is performing below average when compared to other countries. Malaysian economy’s biggest contribution to GDP comes from the energy sector. Therefore, this study only focuses on the energy sectors of Malaysia.
There are a total of 31 public listed energy companies in Bursa Malaysia. Data of these companies were collected using content analysis from sustainability reports, annual reports and the respective companies’ websites as this information is considered most trustable and are verified documents from companies that are distributed among the shareholders and stakeholders.
The following are brief explanations of the major constructs and control variables employed in this study. The three main constructs of proactive eco-innovation are product, process, and technology. The main constructs were measured through content analysis for secondary data by utilizing 1 to 3 categories. Where 0 = Information not found, 1= Only a plain description without implementation details, 2 = Rich details (e.g., detailed plans, and implementation process, or quantitative terms, thus indicating a firm was indeed conducting a related type of innovation), 3 = Rich details with a plan for this type of innovation.
Table A1 highlighted the index items comprising all three constructs of proactive eco-innovation.
Three econometric models were prepared based on the research objective integrating with the conceptual framework. Firstly, model-1 was based on the proactive product eco-innovation and firm financial performance. Secondly, model-2 was based on proactive process eco-innovation. Lastly, model-3 was based on proactive technology eco-innovation and firm financial performance. The dependent variable of these three models is firm financial performance which is proxy by Tobin’s Q (TQ). In addition to that, firm size and firm age are the control variables of these three models. The following
Table 2 represents the three models relating to proactive eco-innovation and firm financial performance.
4. Data Analysis and Results
After collecting the secondary data on the independent and dependent variables for this study, the data were coded according to the objectives of this research. Then, the statistical analysis and hypotheses were used to test to generalize the findings. Firstly, data were declared as panel data, and after that statistical analysis was conducted on STATA 14.2 (STATA 14.2 is a general-purpose statistical software package developed, Manufactured and Supplied by Stata corporation, Texas, USA) and Statistical Package for the Social Sciences (SPSS) 21. software (SPSS 21 is a software package developed, manufactured and supplied by IBM SPSS Statistics corporation, New York, NY, USA). The following paragraph will discuss the data analysis in further detail.
4.1. Preliminary Panel Data Test
Some preliminary data testing was conducted before moving to model and hypothesis testing. Firstly, a data reliability test was conducted on the three dimensions of proactive eco-innovation. The reliability result can be found in
Appendix A. Data reliability was ensured by conducting Cronbach’s alpha. Secondly, a Unit root test was conducted. Thirdly, six data diagnostic tests were performed. The following paragraph will discuss them further.
4.1.1. Unit Root Test
At first, the dataset was declared as panel data, after that unit root test was conducted. A unit root test quantifies whether a panel data variable is nonstationary or stationary. There are several popular unit root tests such as Levin–Lin–Chu (2002), Harris– Tzavalis (1999), Fisher (2001), and Hadri LM (2000) (Lagrange multiplier). This study considers Hardri LM’s (2002) test because it fits for a small sample size. The following
Table 3 represent that all the null hypotheses were accepted, and the alternative hypothesis was rejected for this test. Therefore, it is illustrated that all the panels have stationarity for this study.
4.1.2. Data Diagnostics Tests
Without verifying regression assumptions, the results may be misleading, biased, and non-satisfactory. Therefore, this study considered six diagnostics tests to ensure regression assumptions.
- i.
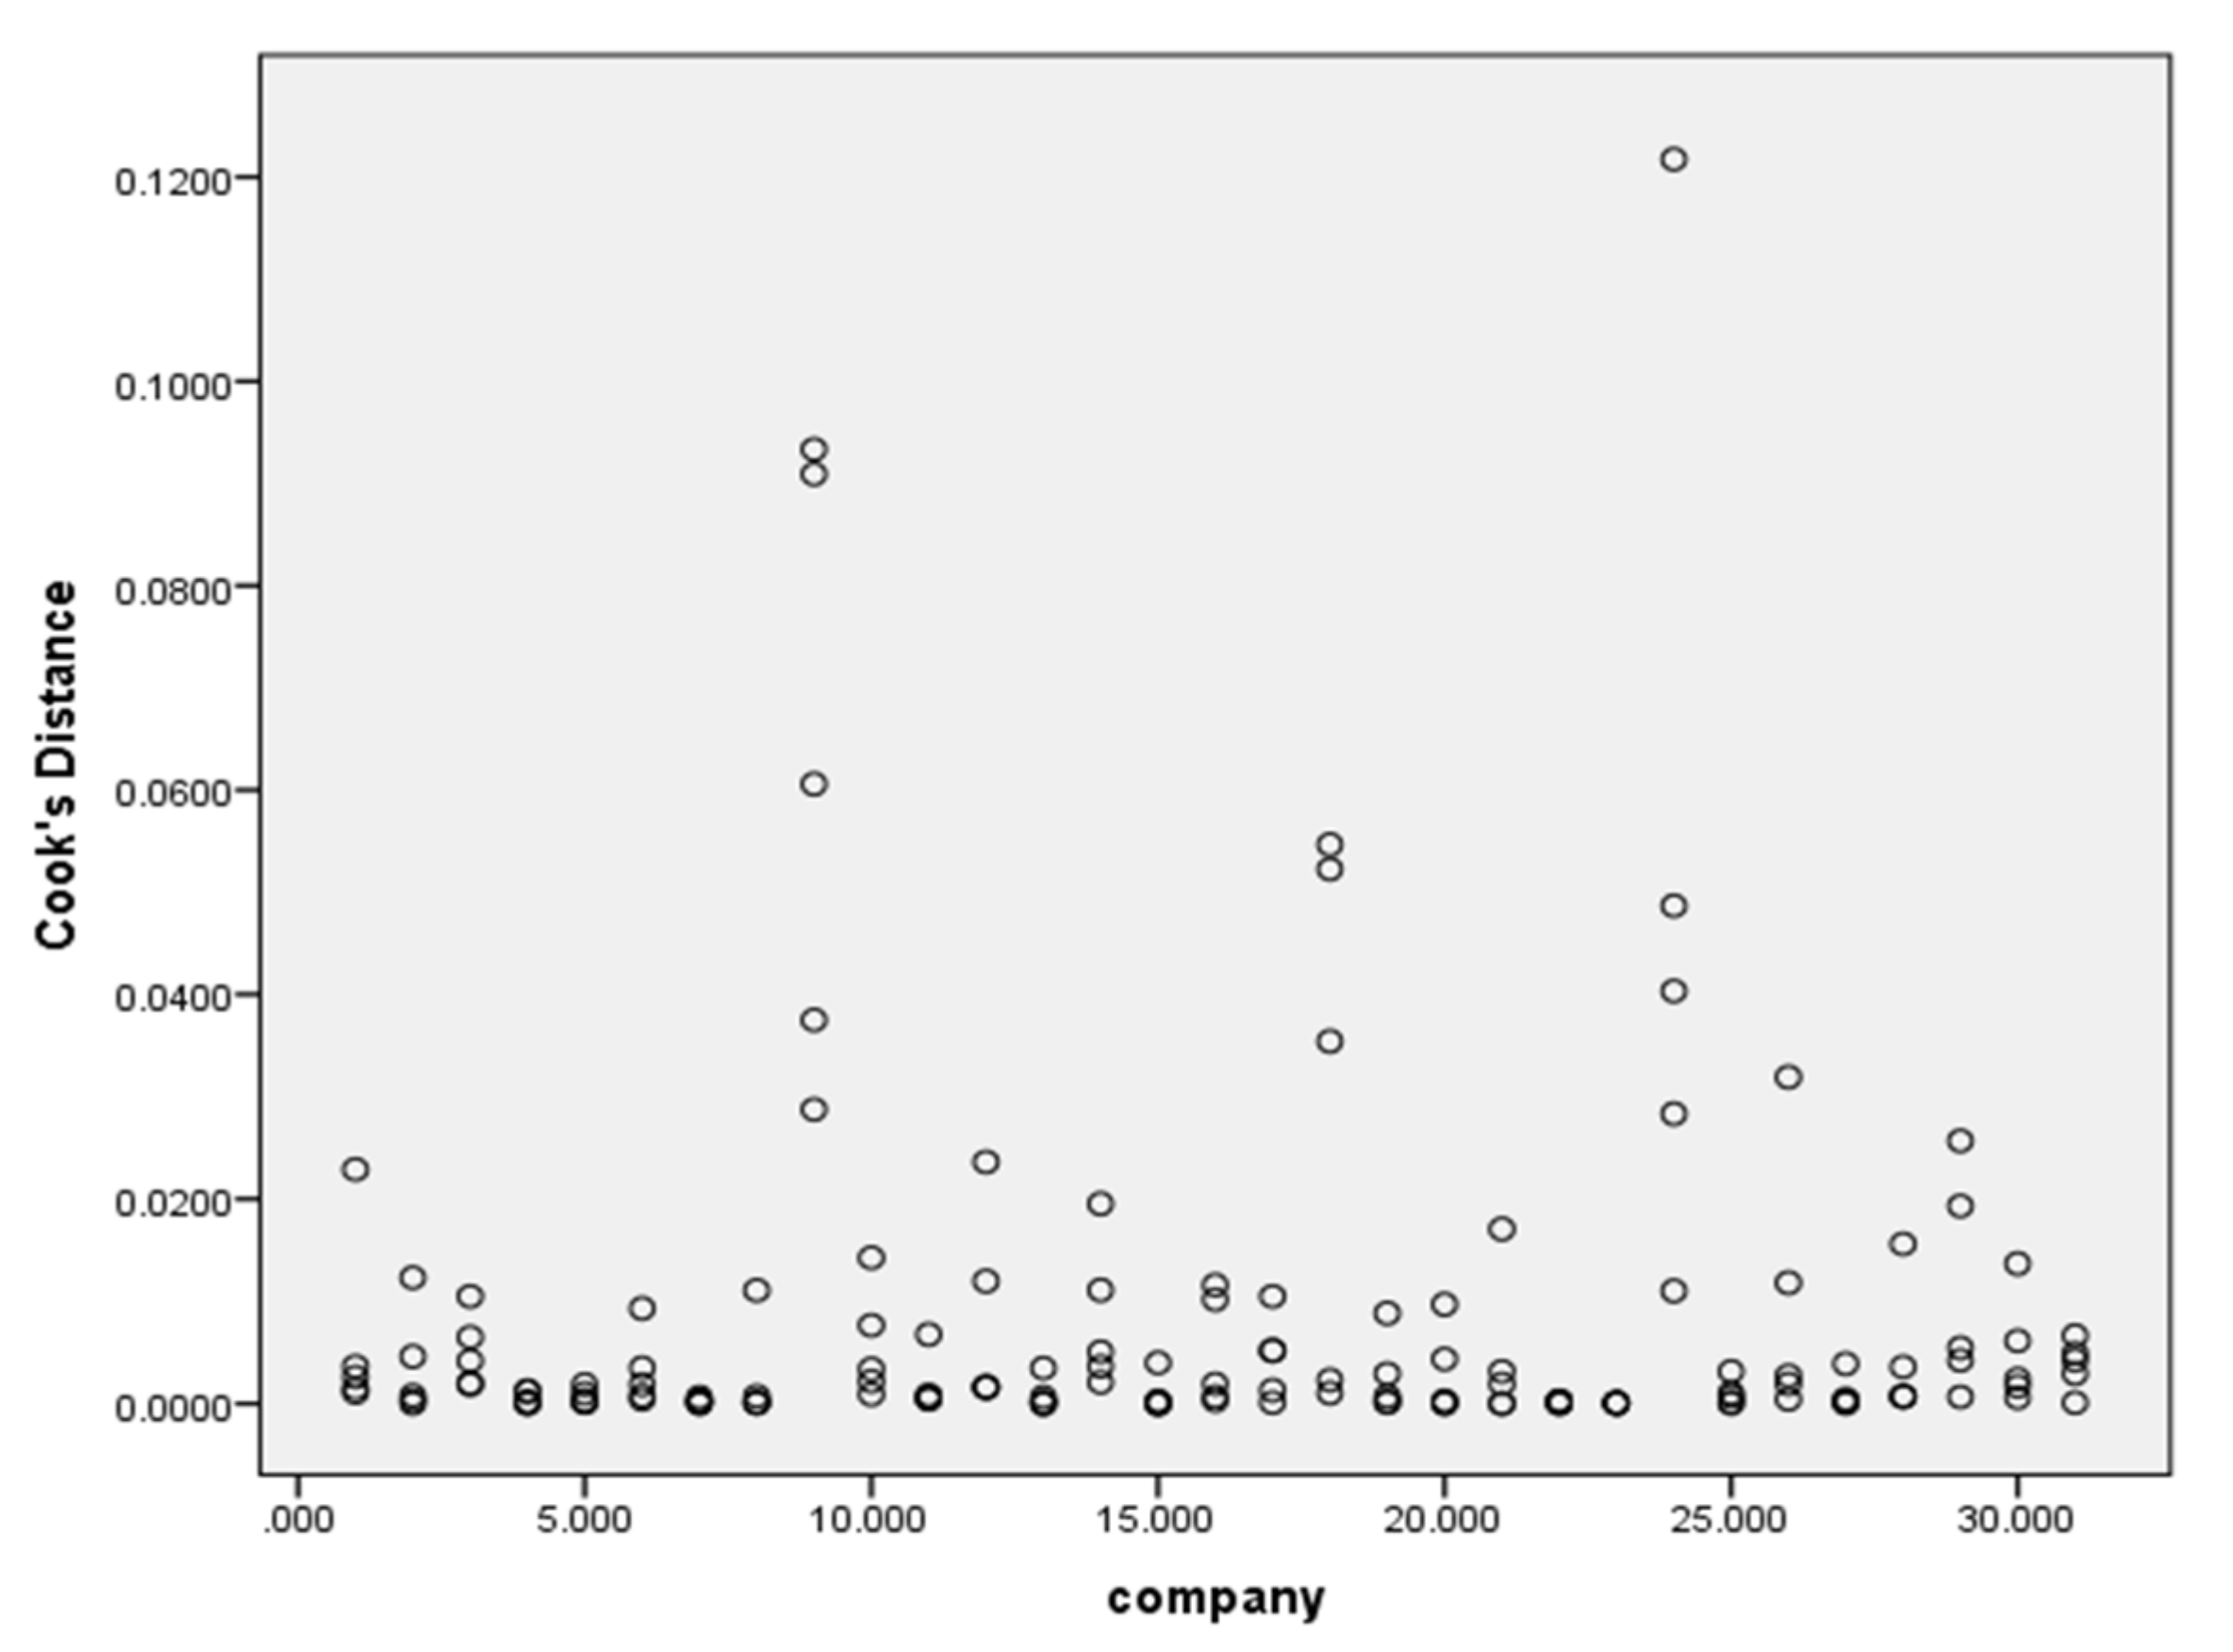
Test for outlier identification and removal
The box plot technique and Cook’s distance test analysis were considered the best methods to remove the outliers from a data set. [
22,
24]. The box plot technique assists in showing outliers, while Cook’s distance analysis illustrates a clear picture of the additional influences of outliers on the dataset. The threshold range of Cook’s Distance analysis is ±3 [
25]. The outcomes of Cook’s distance test are shown in the
Table 4, which demonstrates the residual findings for the minimum and maximum, within the border, and not beyond the threshold value of ±3. Notably, the outlier findings of the dependent variable are shown in
Figure 2.
- ii.
Test for normality
This study considered skewness and kurtosis analysis, for conforming to the assumption of normality before employing the regression model analysis [
24]. Skewness and kurtosis values should be applied to identify normality in the data. Its value range for each variable in the study should fall between ±1.96 at an alpha of 0.05 and ±2.58 at an alpha of 0.10 [
22,
24]. It is inferred from the following table that the threshold values’ ranges of skewness and kurtosis (±1.96 at alpha of 0.05 and ±2.58 at alpha of 0.10) do not violate the assumption of normality, which demonstrates (
Table 5) that data for this study are normally distributed.
- iii.
Test for multicollinearity
After normality screening from the data, the next step is to identify multicollinearity. The Variance Inflation Factor (VIF) is a method to identify the multicollinearity among the variables which was conducted through STATA 14.2 for this study [
26].
Table 6 displays that none of the models were higher than the threshold level range (mean VIF = 3.155).
- iv.
Test for heteroscedasticity
After multicollinearity analysis, the heteroscedasticity in the data is tested to ensure unbiases and significant regression model analysis. Therefore, to identify a heteroscedasticity problem from the dataset, the study applied the Breusch–Pagan test (1994). It showed from
Table 7,
Table 8 and
Table 9 that the
p-value (Prob > chi2) is less than 0.05, which illustrates that a heteroscedasticity problem exists in the panel data for this study [
22,
27] Hence, by applying the random effect robust model, the issue of the heteroscedasticity problem was removed from the panel dataset.
- v.
Test for serial correlation
To detect the problem of serial correlation, this study applied the Durbin–Watson test analysis through STATA 14.2. The following table displays the Durbin–Watson result for serial correlation for the three models of this study. According to this threshold level range, the following
Table 10 reveals that this study has no serial correlation.
- vi.
Test for endogeneity
To detect the endogeneity from the data, this study considered the study in [
27]. If the
p-value of the Hausman test (1978) result is higher than 0.05, then the data do not have an endogeneity problem and vice versa. The following
Table 11 illustrated the results of the Hausman (1978) test which specifies that the data were not affected by an endogeneity problem.
4.2. Descriptive and Correction Statistics
The descriptive analysis demonstrates that the dimensions of proactive eco-innovation (product, process, and technology) indicate average values that are positive. The mean value of product eco-innovation is 1.48 with a standard deviation of 0.77, the minimum value is 0.43 and the maximum value is 3. The mean value of process eco-innovation is 1.52 with a standard deviation of 0.70, the minimum value is 0.64 and the maximum value is 3. The mean value of technology eco-innovation is 1.39 with a standard deviation of 0.72, the minimum value is 0.5 and the maximum value is 2.88. Tobin’s Q has a mean value of 1.14 with a standard deviation of 0.60, the minimum value is 0.30 and the maximum value is 3.47. Firm size (log value of total assets) has a mean value of 6.20 with a standard deviation of 0.53, the minimum value is 5.01 and the maximum value is 7.57. The average age of Malaysian listed energy companies is approximately 25 years, whereas the minimum age is 2 years and the maximum age is 59. The following
Table 12 displays the descriptive statistics.
Results presented in the
Table 13 show the correlation of independent variables on Tobin’s Q. Findings suggest that product eco-innovation showed a positive correlation with Tobin’s Q (r = 0.2988;
p < 0.01), indicating that product eco-innovation had a positive effect on Tobin’s Q. The process eco-innovation dimension was positively correlated with Tobin’s Q (r = 0.4128;
p < 0.01), indicating that proactiveness had a strong positive effect on Tobin’s Q. Technology eco-innovation showed a positive correlation with Tobin’s Q (r = 0.2725;
p < 0.01), indicating that technology eco-innovation had a positive effect on Tobin’s Q.
4.3. Hypothesis Testing and Model Analysis
The unit root test, data diagnostics test, descriptive statistics, and correlational analysis are presented in previous sections. This section discusses the selection of the best-fitting regression models for further analysis of this study. The procedure for choosing the finest regression model is to follow two steps technique. Firstly, this study runs the Breusch–Pagan Lagrangian multiplier tests to select the best one between the pooled OLS (Ordinary least squares) regression model and the GLS (Generalized least squares) model. Secondly, this study conducts the Hausman Test for selecting a random effect or fixed effect GLS model. The following
Table 14 reveals that, for all the three models of this study, the GLS random effect model analysis fits. The following section will discuss further the individual model analysis.
4.3.1. Model-1
This study employed the random effect GLS regression to test the hypotheses of model-1 which relates to hypothesis number one. The findings of random effect (GLS) regression for model-1 of the study are illustrated in
Table 15. The regression estimator for model-1 studied the impact of the eco-innovation dimension, which is product eco-innovation on firm financial performance, which is measured by Tobin’s Q. The figures of Wald Chi2 (1) = 79.02, with Prob > Chi2 = 0.000 are revealed in
Table 15. It is inferred that there is a significant positive effect of product eco-innovation on firm financial performance. Similarly, the R-square (0.3993) in
Table 15 suggests the volume of change of the independent variable (firm financial performance) caused by independent variables (product eco-innovation) in Malaysian public listed energy companies for the years 2015–2019. The R-square (0.3993) value illustrates that almost 40% of the corresponding variance in firm financial performance can be forecasted by product eco-innovation.
Table 16 shows that there is a positive beta = 0.2673 with a
p-value = 0.000 (> 0.05) with z statistics 7.56 for model-1 (product eco-innovation and firm financial performance). Moreover, firm age from this model is insignificantly related to firm financial performance (Tobin’s Q) at the 0.05 significant level (Beta = 0.006, z = 0.92,
p = 0.357). Although, firm size is significantly connected to firm financial performance (Tobin’s Q) at the 0.05 significant level (Beta = 0.4155, z = 3.10,
p = 0.002).
4.3.2. Model-2
This study employed the random effect GLS regression to test the hypotheses of model-2 which relates to hypothesis number two. The findings of random effect (GLS) regression for model-2 of the study are illustrated in Table. The regression estimator for model-2 studied the impact of the eco-innovation dimension, which is process eco-innovation on firm financial performance, which is measured by Tobin’s Q. The figures of Wald Chi2 (1) = 91.51, with Prob > Chi2 = 0.000 are revealed in
Table 17. It is inferred that there is a significant positive effect of process eco-innovation on firm financial performance. Similarly, the R-square (0.4247) in
Table 17 suggests the volume of change independent variable (Firm financial performance) caused by independent variables (process eco-innovation) in Malaysian public listed energy companies for the years 2015–2019. The R-square (0.4247) value illustrates that almost 42% of the corresponding variance in firm financial performance can be forecasted by process eco-innovation.
Table 18 shows that there is a positive beta = 0.3099 with a
p-value = 0.000 (> 0.05) with z statistics 8.31 for model-2 (process eco-innovation and firm financial performance). Moreover, firm age from this model is insignificantly related to firm financial performance (Tobin’s Q) at the 0.05 significant level (Beta = 0.005, z = 0.78,
p = 0.434). Although, firm size is significantly connected to firm financial performance (Tobin’s Q) at the 0.05 significant level (Beta = 0.3552, z = 2.78,
p = 0.006).
4.3.3. Model 3
This study employed the random effect GLS regression to test the hypotheses of model-3 which relates to hypothesis number three. The findings of random effect (GLS) regression for model-3 of the study are illustrated in Table. The regression estimator for model-3 studied the impact of the eco-innovation dimension, which is technology eco-innovation on firm financial performance, which is measured by Tobin’s Q. The figures of Wald Chi2 (2) = 67.38, with Prob > Chi2 = 0.000 are revealed in
Table 19. It is inferred that there is a significant positive effect of technology eco-innovation on firm financial performance. Similarly, the R-square (0.3647) in
Table 19 suggests the volume of change in the independent variable (Firm financial performance) caused by independent variables (product eco-innovation) in Malaysian public listed energy companies for the years 2015-2019. The R-square (0.3647) value illustrates that almost 37% of the corresponding variance in firm financial performance can be forecasted by technology eco-innovation
.Table 20 shows that there is a positive beta = 0.2722 with a
p-value = 0.000 (>0.05) with z statistics 6.84 for model-3 (technology eco-innovation and firm financial performance). Moreover, firm age from this model is insignificantly related to firm financial performance (Tobin’s Q) at the 0.05 significant level (Beta = 0.007, z = 1.02,
p = 0.308). Although, firm size is significantly connected to firm financial performance (Tobin’s Q) at the 0.05 significant level (Beta = 0.3840, z = 2.81,
p = 0.005).
The following
Table 21 represents all the test and analysis of this study as a summary.
5. Discussion and Findings
This section represents the discussion on the three models that are designed in the methodology section relating to its conceptual framework based on the data analysis and findings. The findings are discussed highlighting circular economy concepts integrating proactive eco-innovation. The following section will discuss more on the individual models.
5.1. Model-1 Proactive Product Eco-Innovation and Firm Financial Performance
The random effect multiple GLS regression outcome described in
Table 16 displays that proactive product eco-innovation had a positive and noteworthy influence on firm financial performance. The support is grounded on the
p-value and coefficient of variation as reported in Model 1 (coefficient = 0.2484 with a
p-value = 0.000 > 0.05). It implies that the null hypothesis is accepted at the cost of the alternate hypothesis. Due to the above model discussion, the outcome in
Table 15 and
Table 16 shows that, following a unit rise in a proactive product, eco-innovation will have an incremental impact on firm financial performance. In Malaysian public listed energy companies for the years 2015–2019 saw the same result. Furthermore, the findings for product eco-innovation and firm financial performance also support earlier research such as the studies in [
9,
28,
29,
30] whereas some studies oppose the findings [
28].
The result displays the significance for policymakers as well as industry personnel to be engaged as a benchmark target for a Circular economy. This will accelerate the future SDGs, Industry 4.0, and Innovation development in Malaysia. This development can be brought to light through proactive eco-design in manufacturing systems.
Proactive product eco-innovation emphasized eco-design ideas contributing towards firm sustainability and circular economy [
30,
31]. According to the study of [
18], eco-design is a modified manufacturing approach towards a product considering the environmental, social, and economic influences of the complete product life cycle. Eco-design reduces ecological impact and emphasizes resource efficiency [
32]. Other major essentials need to be counted, such as evolving or revolutionizing the eco-product, such as dropping raw material intensity, renewable energy concentration, climate change for the product, product recyclability, and strength. These essential support firms’ products which are eco-labeled, helping them achieve a positive effect on the firm’s triple bottom line, the firm’s financial operation as well the actual application of limited resources [
29,
31,
33,
34]. This accelerates the firm’s involvement in the circular economy. It was claimed that the three pillars of sustainability named as the environment, social and economic pillar are connected with the circular economy through the proactive product eco-innovation index. It was further argued that this index will further accelerate the circular economy performance on a micro level. The following
Figure 3 illustrates the nexus between proactive product eco-innovation and circular economy concept.
5.2. Model-2 Proactive Process Eco-Innovation and Firm Financial Performance
The random effect multiple GLS regression outcome described in
Table 18 displays that proactive process eco-innovation had a positive and noteworthy influence on firm financial performance. The support is grounded on the
p-value and coefficient of variation as reported in model 2 (coefficient = 0.3099 with a
p-value = 0.000 > 0.05). It implies that the null hypothesis is accepted at the cost of the alternate hypothesis. Due to the above model discussion, the outcome in
Table 17 and
Table 18 shows that, following a unit rise in the proactive process, eco-innovation will have an incremental impact on firm financial performance in Malaysian public listed energy companies for the years 2015–2019. Furthermore, the findings for process eco-innovation and firm financial performance also support earlier research such as the studies [
35,
36,
37,
38], whereas few studies oppose the findings.
The result displays the significance for policymakers as well as industry personnel to be engaged as a benchmark target for a circular economy. This will promote future SDGs, Industry 4.0, and Innovation development in Malaysia. These developments can be brought to light through proactive practices in the cleaner production process.
Process eco-innovation demonstrated that a cleaner production process can be incorporated into the industrial manufacturing process without negotiating sustainability, societal development, and most importantly the circular economy [
39,
40,
41,
42]. Cleaner production is an approach that accumulates various production factors such as shortening the greenhouse emission force, water concentration, waste concentration, energy application, and reprocessing or recycling the materials [
38,
39,
40,
41,
43]. The other significant division can be rainwater application and growing renewable energy. Self-generated renewable resources from nature in the manufacturing process can lessen the manufacturing cost, which can accelerate the firm’s performance, and sustainability also contributes toward 17 SDGs. The firm’s involvement in 17 SDGs by adapting their manufacturing process will accelerate a firm’s involvement in a circular economy. Furthermore, it was claimed that proactive process eco-innovation is directly connected with the circular economy concept at micro level, which will promote sustainable manufacturing process [
29,
31,
33]. Furthermore, firms can gain environmental benefits and financial benefits through sustainable manufacturing processes. The following
Figure 4 displays the nexus between proactive process eco-innovation and the circular economy.
5.3. Model-3 Proactive Technology Eco-Innovation and Firm Financial Performance
The random effect multiple GLS regression outcome described in
Table 20 displays that proactive technology eco-innovation had a positive and noteworthy influence on firm financial performance. The support is grounded on the
p-value and coefficient of variation, as reported in
Table 19 and
Table 20 (coefficient = 0.2722 with a
p-value = 0.000 > 0.05). It implies that the null hypothesis is accepted at the cost of the alternate hypothesis.
Given the above model discussion, the outcome in
Table 20 shows that a unit rise proactive technology eco-innovation will have an incremental impact on the firm’s financial performance in Malaysian public listed energy companies for the years 2015–2019. Moreover, the random effect GLS regression results in
Table 19 and
Table 20 showed similar results of the Pearson correlation for this study. Furthermore, the findings for technological eco-innovation and firm financial performance also support earlier research such as the studies in [
13,
43,
44] whereas few studies oppose the findings.
The result displays the significance of policymakers as well as industry personnel to be engaged as a benchmark target for a Circular Economy. This will accelerate future SDGs, Industry 4.0, and Innovation development in Malaysia. These developments can be brought to light through proactive green technology innovation.
Technology eco-innovation denotes green technology revolution and implementation in the firm of functioning and non-functioning actions. Green technology is reducing raw material application, energy application, water usage, reducing waste, manufacturing time, and delivering a harmless working atmosphere for the personnel. Technological eco-innovation implementation will develop the manufacturing process and contribute directly to the firm’s bottom-line performance [
15,
34]. Most importantly, it will make an impact on the circular economy, which is represented through
Figure 5. In addition to that, it was argued that the circular economy is associated with sustainability through proactive technology eco-innovation the which is applicable for any industry to accelerate a firm’s growth and gain a sustainable competitive advantage. The following
Figure 5 illustrates the nexus between proactive technology eco-innovation and the circular economy.
After all the data analysis, the following
Table 22 describes the summary hypothesis result
6. Conclusions
The statistical data analysis emphasized the impact of ‘proactive’ eco-innovation activities on a firm’s financial performance in Malaysian publicly listed energy firms. A significant effect on enhancing a firm’s performance was recorded because of proactive eco-innovation through statistical empirical support. Moreover, this study displays that proactivity can be combined with eco-innovation and it inspires Malaysian energy firms to adopt proactiveness as it has been confirmed that proactive eco-innovation is indeed positively connected to firm financial performance.
Several researchers such as the authors of [
1,
19,
30,
45] indicated the need for more attention to be given to proactive eco-innovation by academia. Therefore, this research finding intends to contribute to proactive eco-innovation in several ways in the academic arena. Firstly, this research finding intends to add to the literature on proactive eco-innovation by highlighting three-dimensional roles (process, product, and technology). Lastly, this index hopes to add to the existing literature on proactive eco-innovation research which is based on content analysis.
This research intends to add a new frame towards sustainable industry in several ways. Firstly, firms will start to pay attention to pro-active eco-innovation and the firm’s financial performance aspects by considering it to be a vital force for sustainable development and a circular economy. Secondly, top-level management can promote good corporate branding to consumers so that they are proactive regarding environmental issues. Hence, this will increase their firm’s reputation. Therefore, the proposed study will allow industry players to be aware of the benefits of proactive eco-innovation practices and their impact on financial performance, sustainability, and circular economy.
This research study has theoretical contributions to academics and practical contributions to the industry. The research outcomes in this study will support the upcoming researchers from academics and industries in different geographical economies. The positive outcomes of the study have illustrated a road map to encourage the participation of policymakers and top-level strategic managers of Malaysian listed energy firms to expand their proactive policies. Their support will help government officials or regularity authorities in various departments to increase the accountability and transparency of listed energy firms. The following are the main points regarding the contribution of this study.
A complete conceptual framework was established while ‘proactiveness’ was added for the first time in the dimensions of eco-innovation. The biggest strength of this conceptual framework is that it considered proactive activities that are related to a firm’s financial value. The conceptual framework is also accompanied by sustainability, the concept of the circular economy, and SDG issues for Malaysian energy firms, which guard other investors’ concerns.
A proactive eco-innovation index was also proposed based on secondary data through content analysis. This proposed index or instrument was adapted from numerous previous instruments. The prime accomplishment regarding this proposed index is that it had been validated and modified through expert review. Interviews were completed with experts from all applicable areas such as academia, industry and government officials to adjust the index in the Malaysian context.
Most of the dimensions of proactive eco-innovation seem positively and significantly connected to firm financial performance; the outcomes of the study suggest that firms implementing proactive eco-innovation practices are more profitable for their respective potential investors and existing shareholders. Similarly, because of their sustainable proactive eco-innovation practice, they are also contributing towards the three pillars of sustainability as well as a circular economy.
This study will be the part of the Malaysian developed country’s vision 2030. To attain this vision, Malaysia needs sustainability, especially in the energy sector. As sustainability is one of the pre-drivers of a developed country, proactive eco-innovation practices can bring sustainability that accelerates the SDGs goals of Malaysia, especially in the energy sector. As previously stated, the focus of this study is on proactive eco-innovation initiatives and approaches. Therefore, if the energy sector is proactive rather than reactive, then the sector will accelerate the Malaysian green energy economy.
This study only considered five-year secondary data. In the near future, a study will be conducted on panel data for more years along with more sectors. Furthermore, this study does not consider any primary data from respondents. Moreover, this study does not consider any moderation and mediation effects in the model. Furthermore, a survey through a structured questionnaire can be conducted on proactive eco-innovation practices to highlight the actual proactive approaches and initiatives from the industry. Finally, a future study should also investigate moderation and mediation effects integrating eco-innovation.
Author Contributions
Conceptualization, S.K.J. and M.A.T.; literature review, M.A.T. and S.K.J.; research methodology, S.K.J. and M.A.T.; data analysis and discussion, S.K.J. and M.A.T. writing—original draft, M.A.T.; written—review and editing, M.A.T. and S.K.J. All authors have read and agreed to the published version of the manuscript.
Funding
This study’s funding comes from two different sources named firstly, the Yayasan-Universiti Teknologi PETRONAS Fundamental Research Grant Scheme (YUTP-FRGS) under the cost Centre 015LC0-016 and secondly, the FRGS (Fundamental Research Grand Scheme), Ministry of Higher education, Malaysia project tittle “To examine eco-innovation index for Co2 emission reduction in the Malaysian energy sectors” under the cost Centre 015 MAO-040.
Institutional Review Board Statement
Not applicable.
Informed Consent Statement
Not applicable.
Data Availability Statement
The data presented in this study are available on request from the corresponding author.
Acknowledgments
The authors would like to express gratitude to firstly, the Yayasan-Universiti Teknologi PETRONAS Fundamental Research Grant Scheme (YUTP-FRGS) under the cost Centre 015LC0-016 and secondly, the FRGS (Fundamental Research Grand Scheme), Ministry of Higher education, Malaysia project tittle “To examine eco-innovation index for CO2 emission reduction in the Malaysian energy sectors” under the cost Centre 015 MAO-040. Thirdly, the authors want to give thanks to Centre for Graduate Studies (CGS), Information Resource Centre (IRC) and department of management and humanities, Universiti Teknologi Petronas, Malaysia, for cooperating with all kinds of facilities throughout the research. Lastly, the authors would like to express a special thank all the anonymous reviewers.
Conflicts of Interest
The authors declare no conflict of interest.
Appendix A
Table A1.
Reliability Test.
Table A1.
Reliability Test.
| Constructs | Index Items | Items Code | Cronbach Alpha |
|---|
| Product Eco-innovation | - 1.1.
Eco-friendly products/services/activities
| Prod_1 | 0.701 |
- 1.2.
Recycled activities/services/inputs/materials/products
| Prod_2 |
- 1.3.
Sustainable raw materials sources
| Prod_3 |
- 1.4.
Reduce number of product/Services/Activities Components-Decommissioned sites
| Prod_4 |
- 1.5.
Eliminate dirty components—Greenhouse gas emission and Hazardous substances emissions
| Prod_5 |
- 1.6.
Product/Services/Activities with a longer life cycle less complaints
| Prod_6 |
- 1.7.
Product/services/activities ability to be recycled
| Prod_7 |
| Process Eco-innovation | - 2.1.
Reduce Hazardous and Non-Hazardous Waste-Drilling waste/Oil spills/Effluent
| Proc_1 | 0.699 |
- 2.2.
Reduce use of water
| Proc_2 |
- 2.3.
Reduce use of energy
| Proc_3 |
- 2.4.
Keep waste to a minimum
| Proc_4 |
- 2.5.
Reuse of components
| Proc_5 |
- 2.6.
Recycle waste, water or materials
| Proc_6 |
- 2.7.
Environmentally friendly technologies for waste disposal
| Proc_7 |
- 2.8.
Renewable energy/Alternative energy research
| Proc_8 |
- 2.9.
R & D
| Proc_9 |
- 2.10.
Acquisition of machinery and software
| Proc_10 |
- 2.11.
Acquisition of patents and licenses- Quality certification
| Proc_11 |
| Technology Eco-innovation | - 3.1.
Pollution control technologies
| Tech_1 | 0.710 |
- 3.2.
Cleaning technologies
| Tech_2 |
- 3.3.
Cleaner process technologies
| Tech_3 |
- 3.4.
Waste management equipment
| Tech_4 |
- 3.5.
Environmental impact monitoring and instrumentation/Biodiversity risk or marine risk/Biodiversity/Climate related risk
| Tech_5 |
- 3.6.
Green energy technologies
| Tech_6 |
- 3.7.
Water recycled or reused
| Tech_7 |
- 3.8.
Noise and vibration control technologies
| Tech_8 |
Table A2.
Summary of Literature Review on Proactive Eco-Innovation.
Table A2.
Summary of Literature Review on Proactive Eco-Innovation.
| Reference | Nature of Eco-Innovation (Proactive and Reactive) | Eco-Innovation Dimension | Theory | Methodology (Data Source) | Findings | Sectors |
|---|
| [15,46,47] | Reactive | Organization | Resource-based view | Quantitative and Primary data | Positive association | Manufacturing (SMEs) |
| [1] | Proactive | Technology | Resource-based view | Quantitative and Primary data | Positive association | All sectors in Poland |
| [9,48,49,50,51] | Reactive | Marketing | Resource-based view | Quantitative and Primary data | Negative association | Manufacturing |
| [1,35,36,37] | Reactive | Process | Resource-based view | Quantitative and Primary data | Positive association | Manufacturing |
| [28] | Reactive | Product | Resource-based view | Quantitative and Primary data | Positive Association | Manufacturing |
| [45] | Reactive | Technology | Resource-based view | Quantitative and Primary data | Positive Association | _ |
| [52] | Reactive | Overall Eco-innovation | - | Quantitative | Positive association | - |
| [18] | Reactive | Overall Eco-innovation | Resource-based view | Quantitative and Primary data | Positive association | Oil and Gas |
References
- Ryszko, A. Proactive environmental strategy, technological eco-innovation and firm performance—Case of poland. Sustainability 2016, 8, 156. [Google Scholar] [CrossRef]
- de Jesus Pacheco, D.A.; ten Caten, C.S.; Jung, C.F.; Navas, H.V.G.; Cruz-Machado, V.A.; Tonetto, L.M. State of the art on the role of the Theory of Inventive Problem Solving in Sustainable Product-Service Systems: Past, Present, and Future. J. Clean. Prod. 2019, 212, 489–504. [Google Scholar] [CrossRef]
- Khan, P.A.; Johl, S.K. Nexus of comprehensive green innovation, environmental management system-14001-2015 and firm performance. Cogent Bus. Manag. 2019, 6, 1691833. [Google Scholar] [CrossRef]
- Salim, N.; Ab Rahman, M.N.; Abd Wahab, D. A systematic literature review of internal capabilities for enhancing eco-innovation performance of manufacturing firms. J. Clean. Prod. 2019, 209, 1445–1460. [Google Scholar] [CrossRef]
- Santos, D.F.L.; Lima, M.M.D.; Basso, L.F.C.; Kimura, H.; Sobreiro, V.A. Eco-innovation and financial performance at companies established in Brazil. Int. J. Bus. Emerg. Mark. 2017, 9, 68–89. [Google Scholar] [CrossRef]
- WEF. The Global Risk Report 2018; World Economic Forum Publisher: Geneva, Switzerland, 2018. [Google Scholar]
- Kemp, R.; Pearson, P. Final Report MEI Project about Measuring Eco-Innovation; UM Merit: Maastricht, The Netherlands, 2007; Volume 10. [Google Scholar]
- OECD. Oslo Manual: Guidelines for Collecting and Interpreting Innovation Data; OECD: Paris, France, 2005; Volume 46. [Google Scholar]
- García-Granero, E.M.; Piedra-Muñoz, L.; Galdeano-Gómez, E. Eco-innovation measurement: A review of firm performance indicators. J. Clean. Prod. 2018, 191, 304–317. [Google Scholar] [CrossRef]
- EIO. The Eco-Innovation Challenge: Pathways to a Resource-Efficient Europe; Eco-Innovation Observatory: Brussels, Belgium, 2011. [Google Scholar]
- Bitencourt, C.C.; de Oliveira Santini, F.; Zanandrea, G.; Froehlich, C.; Ladeira, W.J. Empirical generalizations in eco-innovation: A meta-analytic approach. J. Clean. Prod. 2020, 245. [Google Scholar] [CrossRef]
- Przychodzen, J.; Przychodzen, W. Corporate sustainability and shareholder wealth. J. Environ. Plan. Manag. 2013, 56, 474–493. [Google Scholar] [CrossRef]
- Hojnik, J.; Ruzzier, M. What drives eco-innovation? A review of an emerging literature. Environ. Innov. Soc. Transit. 2016, 19, 31–41. [Google Scholar] [CrossRef]
- Pacheco, D.A.D.J.; ten Caten, C.S.; Jung, C.F.; Ribeiro, J.L.D.; Navas, H.V.G.; Cruz-Machado, V.A. Eco-innovation determinants in manufacturing SMEs: Systematic review and research directions. J. Clean. Prod. 2017, 142, 2277–2287. [Google Scholar] [CrossRef]
- Tseng, M.-L.; Bui, T.-D. Identifying eco-innovation in industrial symbiosis under linguistic preferences: A novel hierarchical approach. J. Clean. Prod. 2017, 140, 1376–1389. [Google Scholar] [CrossRef]
- Rodríguez-García, M.; Guijarro-García, M.; Carrilero-Castillo, A. An overview of ecopreneurship, eco-innovation, and the ecological sector. Sustainability 2019, 11, 2909. [Google Scholar] [CrossRef]
- Hizarci-Payne, A.K.; İpek, İ.; Kurt Gümüş, G. How environmental innovation influences firm performance: A meta-analytic review. Bus. Strategy Environ. 2021, 30, 1174–1190. [Google Scholar] [CrossRef]
- Munodawafa, R.T.; Johl, S.K. A systematic review of eco-innovation and performance from the resource-based and stakeholder perspectives. Sustainability 2019, 11, 6067. [Google Scholar] [CrossRef]
- Fernando, Y.; Jabbour, C.J.C.; Wah, W.-X. Pursuing green growth in technology firms through the connections between environmental innovation and sustainable business performance: Does service capability matter? Resour. Conserv. Recycl. 2019, 141, 8–20. [Google Scholar] [CrossRef]
- Toha, M.A.; Rahman, M.A.; Datta, S. The Effect of Audit Firm Size & Abnormal Audit Fees on Independent Auditor’s Opinion: Conceptual Framework (Bangladesh Perspective). Asian Soc. Sci. 2015. [Google Scholar] [CrossRef]
- Uddin, M.S.; Toha, M.A.; Faruq, M.O. International Financial Reporting Standard (Ifrs) for Smes and Its Impact on Reporting Quality. 2019. Available online: https://jnu.ac.bd/journal/assets/pdf/7_2_182.pdf (accessed on 12 April 2021).
- Sekaran, U.; Bougie, R. Research Methods for Business: A Skill Building Approach; John Wiley & Sons: Hoboken, NJ, USA, 2016. [Google Scholar]
- Hair, J.F., Jr.; Hult, G.T.M.; Ringle, C.; Sarstedt, M. A Primer on Partial Least Squares Structural Equation Modeling (PLS-SEM); Sage publications: Los Angeles, CA, USA, 2016. [Google Scholar]
- Hair, J.F.; Sarstedt, M.; Ringle, C.M.; Mena, J.A. An assessment of the use of partial least squares structural equation modeling in marketing research. J. Acad. Mark. Sci. 2012, 40, 414–433. [Google Scholar] [CrossRef]
- Chatterjee, S.; Hadi, A.S. Influential observations, high leverage points, and outliers in linear regression. Stat. Sci. 1986, 1, 379–393. [Google Scholar]
- VanVoorhis, C.W.; Morgan, B.L. Understanding power and rules of thumb for determining sample sizes. Tutor. Quant. Methods Psychol. 2007, 3, 43–50. [Google Scholar] [CrossRef]
- Hausman, J.A. Specification tests in econometrics. Econom. J. Econom. Soc. 1978, 1251–1271. [Google Scholar] [CrossRef]
- Yao, Q.; Liu, J.; Sheng, S.; Fang, H. Does eco-innovation lift firm value? The contingent role of institutions in emerging markets. J. Bus. Ind. Mark. 2019. [Google Scholar] [CrossRef]
- Ramkumar, S.J.S. Influence of Inter-Firm Network Relationships on Circular Economy Eco-Innovation Adoption. Sustainability 2020, 12, 7607. [Google Scholar] [CrossRef]
- Hu, A.H.; Matsumoto, M.; Kuo, T.C.; Smith, S. Technologies and Eco-Innovation towards Sustainability II; Springer: Berlin/Heidelberg, Germany, 2019. [Google Scholar]
- Mazzoni, F. Circular economy and eco-innovation in Italian industrial clusters. Best practices from Prato textile cluster. Insights Reg. Dev. 2020, 2, 661–676. [Google Scholar] [CrossRef]
- Ivascu, L. Measuring the Implications of Sustainable Manufacturing in the Context of Industry 4.0. Processes 2020, 8, 585. [Google Scholar] [CrossRef]
- Stankevičienė, J.; Nikanorova, M. Eco-innovation as a pillar for sustainable development of circular economy. Theory Pract. 2020, 21, 531–544. [Google Scholar] [CrossRef]
- Durán-Romero, G.; López, A.M.; Beliaeva, T.; Ferasso, M.; Garonne, C.; Jones, P.J.T.F.; Change, S. Bridging the gap between circular economy and climate change mitigation policies through eco-innovations and Quintuple Helix Model. Technol. Forecast. Soc. Chang. 2020, 160, 120246. [Google Scholar] [CrossRef]
- Aziz, N.; Wahab, D.A.; Ramli, R.; Azhari, C.H. Modelling and optimisation of upgradability in the design of multiple life cycle products: A critical review. J. Clean. Prod. 2016, 112, 282–290. [Google Scholar] [CrossRef]
- Marcon, A.; de Medeiros, J.F.; Ribeiro, J.L.D. Innovation and environmentally sustainable economy: Identifying the best practices developed by multinationals in Brazil. J. Clean. Prod. 2017, 160, 83–97. [Google Scholar] [CrossRef]
- Rodriguez, J.A.; Wiengarten, F. The role of process innovativeness in the development of environmental innovativeness capability. J. Clean. Prod. 2017, 142, 2423–2434. [Google Scholar] [CrossRef]
- Khan, H.W.; Moniruzzaman, M.; Nasef, M.M.E.; Bustam, M.A. Ionic liquid assisted cellulose aerogels for cleaning an oil spill. Mater. Today: Proc. 2020, 31, 217–220. [Google Scholar]
- Abad-Segura, E.; Morales, M.E.; Cortés-García, F.J.; Belmonte-Ureña, L.J. Industrial Processes Management for a Sustainable Society: Global Research Analysis. Processes 2020, 8, 631. [Google Scholar] [CrossRef]
- Hemmati, S.; Elnegihi, M.M.; Lee, C.H.; Chong, D.Y.L.; Foo, D.C.; How, B.S.; Yoo, C. Synthesis of Large-Scale Bio-Hydrogen Network Using Waste Gas from Landfill and Anaerobic Digestion: A P-Graph Approach. Processes 2020, 8, 505. [Google Scholar] [CrossRef]
- Khan, H.W.; Reddy, A.V.B.; Nasef, M.M.E.; Bustam, M.A.; Goto, M.; Moniruzzaman, M. Screening of ionic liquids for the extraction of biologically active compounds using emulsion liquid membrane: COSMO-RS prediction and experiments. J. Mol. Liq. 2020, 309, 113122. [Google Scholar] [CrossRef]
- Ali, R.F.; Dominic, P.; Ali, K.J.S. Organizational governance, social bonds and information security policy compliance: A perspective towards oil and gas employees. Sustainability 2020, 12, 8576. [Google Scholar] [CrossRef]
- Khan, P.A.; Johl, S.K.; Johl, S.K.J.B.S.; Environment, t. Does adoption of ISO 56002-2019 and green innovation reporting enhance the firm sustainable development goal performance? An emerging paradigm. Bus. Strategy Environ. 2021. [Google Scholar] [CrossRef]
- Liao, Y.C.; Tsai, K.H. Innovation intensity, creativity enhancement, and eco-innovation strategy: T he roles of customer demand and environmental regulation. Bus. Strategy Environ. 2019, 28, 316–326. [Google Scholar] [CrossRef]
- Kuo, T.-C.; Smith, S. A systematic review of technologies involving eco-innovation for enterprises moving towards sustainability. J. Clean. Prod. 2018, 192, 207–220. [Google Scholar] [CrossRef]
- de Jesus, A.; Antunes, P.; Santos, R.; Mendonça, S. Eco-innovation pathways to a circular economy: Envisioning priorities through a Delphi approach. J. Clean. Prod. 2019, 228, 1494–1513. [Google Scholar] [CrossRef]
- de Jesus, A.; Antunes, P.; Santos, R.; Mendonça, S. Eco-innovation in the transition to a circular economy: An analytical literature review. J. Clean. Prod. 2016, 172, 2999–3018. [Google Scholar] [CrossRef]
- Chiarvesio, M.; Marchi, V.D.; Maria, E.D. Environmental innovations and internationalization: Theory and practices. Bus. Strategy Environ. 2015, 24, 790–801. [Google Scholar] [CrossRef]
- Li, X.; Hamblin, D. Factors impacting on cleaner production: Case studies of Chinese pharmaceutical manufacturers in Tianjin, China. J. Clean. Prod. 2016, 131, 121–132. [Google Scholar] [CrossRef]
- Lindh, H.; Williams, H.; Olsson, A.; Wikström, F. Elucidating the indirect contributions of packaging to sustainable development: A terminology of packaging functions and features. Packag. Technol. Sci. 2016, 29, 225–246. [Google Scholar] [CrossRef]
- Wikström, F.; Williams, H.; Venkatesh, G. The influence of packaging attributes on recycling and food waste behaviour–an environmental comparison of two packaging alternatives. J. Clean. Prod. 2016, 137, 895–902. [Google Scholar] [CrossRef]
- Yurdakul, M.; Kazan, H. Effects of Eco-Innovation on Economic and Environmental Performance: Evidence from Turkey’s Manufacturing Companies. Sustainability 2020, 12, 3167. [Google Scholar] [CrossRef]
Figure 1.
Conceptual framework of proactive eco-innovation.
Figure 1.
Conceptual framework of proactive eco-innovation.
Figure 2.
Cook’s distance result box plot. (Source: authors’ own calculation).
Figure 2.
Cook’s distance result box plot. (Source: authors’ own calculation).
Figure 3.
The nexus between proactive product eco-innovation and circular economy (source: authors’ own explanation).
Figure 3.
The nexus between proactive product eco-innovation and circular economy (source: authors’ own explanation).
Figure 4.
The nexus between proactive process eco-innovation and the circular economy (source: authors’ own explanation).
Figure 4.
The nexus between proactive process eco-innovation and the circular economy (source: authors’ own explanation).
Figure 5.
The nexus between proactive technology eco-innovation and the circular economy (source: authors’ own explanation).
Figure 5.
The nexus between proactive technology eco-innovation and the circular economy (source: authors’ own explanation).
Table 1.
Proactive eco-innovation instruments.
Table 1.
Proactive eco-innovation instruments.
| | Dimensions | Instrument/Index | Score Technique/Content Analysis |
|---|
| Proactive Eco-innovation | Product
Eco-innovation | Measured by average of 7 indicators suggested by García-Granero et al. (2018) product eco-innovation index. | 0 = Information not found
1 = Only a plain description without implementation details
2 = Rich details (e.g., detailed plans, an implementation process, or quantitative terms, thus indicating a firm was indeed conducting a related type of innovation)
3 = Rich details with future plan for this type of innovation. |
Process
Eco-innovation | Measured by average of 11 indicators suggested by García-Granero et al. (2018) process eco-innovation index |
| Technological Eco-innovation | Measured by average of 8 indicators suggested by Arundel, A., and Kemp, R. (2009) technology eco-innovation index |
| Firm Financial Performance | Tobin’s Q | MVE+PS+DEBT
Book Value of total Assets of firm
Where:
MVE = Firm’s Share Price x Common Shares outstanding
PS = Liquidating Value of Preferred Stock
DEBT = Value of Short-Term Liabilities |
| Control variables | Firm size | Measured by Log total Assets |
| Firm age | Number of years since the operation of company in Busra Malaysia. |
Table 2.
Econometric models on proactive eco-innovation.
Table 2.
Econometric models on proactive eco-innovation.
| Model-1 (Product Eco-Innovation and Firm Financial Performance) | TQ = β0 + β1prod_eii + β2f_sizei + β3f_agei + ε |
|---|
| Model-2 (Process Eco-Innovation and Firm Financial Performance) | TQ = β0 + β1proc_eii + β2f_sizei + β3f_agei + ε |
|---|
| Model-3 (Technology Eco-Innovation and Firm Financial Performance) | TQ = β0 + β1tech_eii + β2f_sizei + β3f_agei + ε |
|---|
Note,
TQ = Tobin’s Q
MVE+PS+DEBT
TQ = ________________________________
Book Value of total Assets of firm
MVE = (Firm’s Share Price x Common Shares outstanding)
PS = Liquidating Value of Preferred Stock
DEBT = Value of Short-Term Liabilities
β = (Beta) or Drift Element
β1, 2 … k = Slope Coefficients (Coefficient of independent variables)
ε = Epsilon (Error Term)
prod_ei = Product eco-innovation;
proc_ei = Process eco-innovation;
tech_ei = Technology eco-innovation;
f_size = Firm size
f_age = Firm age |
Table 3.
Unit root test.
| Hadri LM Test |
|---|
| Ho: All panels are stationary | Number of panels | =31 |
| Ha: Some panels contain unit roots | Number of periods | =5 |
| Time trend: Not included | Asymptotics: T, N | ->Infinity |
| Heteroskedasticity: Not robust | | sequentially |
| | Statistic |
| prod_ei (proactive product eco-innovation) | z | 1.4466 |
| p-value | 0.0740 |
| proc_ei (proactive process eco-innovation) | z | −2.7194 |
| p-value | 0.9967 |
| tech_ei (Proactive technology eco-innovation) | z | −2.9169 |
| p-value | 0.9982 |
Table 4.
Cook distance for the dependent variable (Tobin’s Q).
Table 4.
Cook distance for the dependent variable (Tobin’s Q).
| | Minimum | Maximum | Mean | Std. Deviation | N |
|---|
| Cook’s Distance for TQ (Tobin’s Q) | 0.000 | 0.084 | 0.007 | 0.013 | 155 |
Table 5.
Skewness and kurtosis result.
Table 5.
Skewness and kurtosis result.
| | N | Skewness | Kurtosis | Missing |
|---|
| Prod_EI | 155 | 0.577 | −1.111 | 0 |
| Proc_EI | 155 | 0.704 | −0.889 | 0 |
| Tech_EI | 155 | 0.750 | −0.864 | 0 |
| TQ | 155 | 1.648 | 2.690 | 0 |
| F_Size | 155 | 0.256 | 0.168 | 0 |
| F_Age | 155 | 0.793 | 0.236 | 0 |
Table 6.
VIF result.
| | VIF | 1/VIF |
|---|
| Model 1 | 1.051 | 0.951474786 |
| Model 2 | 1.035 | 0.966183575 |
| Model 3 | 1.069 | 0.935453695 |
Table 7.
Model-1 heteroscedasticity test result.
Table 7.
Model-1 heteroscedasticity test result.
| Breusch and Pagan Lagrangian Multiplier Test for Random Effects |
|---|
| Tq (company,t) = Xb + u(company) + e(company,t) |
|---|
| Estimated Results: |
|---|
| | Var | sd = sqrt(Var) |
|---|
| tq | 0.366305 | 0.6052313 |
| e | 0.0825608 | 0.287334 |
| u | 0.2396043 | 0.4894939 |
| Test: Var(u) = 0 |
| chibar2(01) = 151.83 |
| Prob > chibar2 = 0.0000 |
Table 8.
Model-2 heteroscedasticity test result.
Table 8.
Model-2 heteroscedasticity test result.
| Breusch and Pagan Lagrangian Multiplier Test for Random Effects |
|---|
| Tq (company,t) = Xb + u(company) + e(company,t) |
|---|
| Estimated Results: | | |
|---|
| | Var | sd = sqrt(Var) |
|---|
| tq | 0.366305 | 0.6052313 |
| e | 0.0820641 | 0.2864682 |
| u | 0.2229383 | 0.4721634 |
| Test: Var(u) = 0 |
| chibar2(01) = 149.06 |
| Prob > chibar2 = 0.0000 |
Table 9.
Model-3 heteroscedasticity test result.
Table 9.
Model-3 heteroscedasticity test result.
| Breusch and Pagan Lagrangian Multiplier Test for Random Effects |
|---|
| Tq (company,t) = Xb + u(company) + e(company,t) |
|---|
| Estimated Results: |
|---|
| | Var | sd = sqrt(Var) |
|---|
| tq | 0.366305 | 0.6052313 |
| e | 0.0830915 | 0.288256 |
| u | 0.2348743 | 0.4846383 |
| Test: Var(u) = 0 |
| chibar2(01) = 149.06 |
| Prob > chibar2 = 0.0000 |
Table 10.
Durbin–Watson Statistics result.
Table 10.
Durbin–Watson Statistics result.
| | Durbin-Watson Statistics |
|---|
| Model 1 | 0.738 |
| Model 2 | 0.767 |
| Model 3 | 0.736 |
Table 11.
Hausman Test.
| | Hausman Test |
|---|
| | Statistics | p-Value |
|---|
| Model 1 | 1.18 | 0.120 |
| Model 2 | 1.28 | 0.163 |
| Model 3 | 2.52 | 0.340 |
Table 12.
Descriptive Statistics.
Table 12.
Descriptive Statistics.
| Variable | Observation | Mean | Std. Dev. | Min | Max |
|---|
| prod_ei | 155 | 1.478903 | 0.7736048 | 0.43 | 3 |
| proc_ei | 155 | 1.519226 | 0.7014359 | 0.64 | 3 |
| tech_ei | 155 | 1.390516 | 0.7227336 | 0.5 | 2.88 |
| tq | 155 | 1.142323 | 0.6052313 | 0.3 | 3.47 |
| f_size | 155 | 6.200968 | 0.5305887 | 5.01 | 7.57 |
| f_age | 155 | 25.29032 | 13.93443 | 2 | 59 |
Table 13.
Correlation.
| | prod_ei | proc_ei | tech_ei | tq | f_Size | f_Age |
|---|
| prod_ei | 1.0000 | | | | | |
| proc_ei | 0.6033 * | 1.0000 | | | | |
| tech_ei | 0.6497 * | 0.4861 * | 1.0000 | | | |
| tq | 0.2988 * | 0.4128 * | 0.2725 * | 1.0000 | | |
| f_size | −0.0450 | 0.0485 | 0.0141 | 0.1707 * | 1.0000 | |
| f_age | 0.2057 * | 0.1830 * | 0.2531 * | 0.1897 * | 0.1693 * | 1.0000 |
Table 14.
Selection of best model.
Table 14.
Selection of best model.
| | Breusch-Pagan LM Test | Selection Criteria
(OLS vs. GLS) | Model | Hausman Test | Selection Criteria (Fixed vs. Random Effect) | Best Model |
|---|
| chibar2(01) | Prob > chibar2 | Statistics | p-Value |
|---|
| Model 1 | 151.83 | 0.000 | If the p-value (Prob > chi2) is less than 0.05, then select GLS, otherwise select OLS | GLS model | 1.18 | 0.120 | If the p-value is higher than 0.05, then select random effect, otherwise select fixed effect | Random effect GLS |
| Model 2 | 149.06 | 0.000 | 1.28 | 0.163 |
| Model 3 | 145.75 | 0.000 | 2.52 | 0.340 |
Table 15.
Random effects GLS regression model-1.
Table 15.
Random effects GLS regression model-1.
| TQ = β0 + β1prod_eii + β2f_sizei + β3f_agei + ε |
|---|
| Random-effects GLS regression | Number of observations | 155 |
| Group variable: company | Number of groups | 31 |
| R-sq: | Observation per group: | |
| within = 0.3993 | min | 5 |
| between = 0.0391 | avg | 5.0 |
| overall = 0.1236 | max | 5 |
| | Wald chi2(3) | 79.02 |
| corr(u_i, X) = 0 (assumed) | Prob > chi2 | 0.0000 |
Table 16.
Random effects GLS regression Coefficient result for model-1.
Table 16.
Random effects GLS regression Coefficient result for model-1.
| tq | Coef. | Std. Err. | z | p > z | 95% Conf. | Interval |
|---|
| prod_ei | 0.2673707 | 0.035387 | 7.56 | 0.000 | 0.1980134 | 0.336728 |
| f_size | 0.4155314 | 0.1339941 | 3.10 | 0.002 | 0.1529077 | 0.678155 |
| f_age | 0.0063913 | 0.0069367 | 0.92 | 0.357 | −0.0072043 | 0.019987 |
| _cons | −1.991428 | 0.8363997 | −2.38 | 0.017 | −3.630742 | −0.3521152 |
| sigma_u | 0.48949394 | | | | | |
| sigma_e | 0.28733398 | | | | | |
| rho | 0.74373138 | | | | | |
Table 17.
Random effects GLS regression model-2.
Table 17.
Random effects GLS regression model-2.
| TQ = β0 + β1proc_eii + β2f_sizei + β3f_agei + ε |
|---|
| Random-effects GLS regression | Number of obs | 155 |
| Group variable: company | Number of groups | 31 |
| R-sq: | Obs per group: | |
| within = 0.4247 | min | 5 |
| between = 0.0798 | avg | 5.0 |
| overall = 0.1797 | max | 5 |
| | Wald chi2(3) | 91.51 |
| corr(u_i, X) = 0 (assumed) | Prob > chi2 | 0.0000 |
Table 18.
Random effects GLS regression Coefficient result for model-2.
Table 18.
Random effects GLS regression Coefficient result for model-2.
| tq | Coef. | Std. Err. | z | p > z | 95% Conf. | Interval |
|---|
| proc_ei | 0.309986 | 0.0372986 | 8.31 | 0.000 | 0.236882 | 0.3830899 |
| f_size | 0.3552437 | 0.127977 | 2.78 | 0.006 | 0.1044133 | 0.6060741 |
| f_age | 0.0051438 | 0.0065701 | 0.78 | 0.434 | −0.0077333 | 0.018021 |
| _cons | −1.66156 | 0.7996413 | −2.08 | 0.038 | −3.228828 | −0.0942921 |
| sigma_u | 0.47216344 | | | | | |
| sigma_e | 0.028646824 | | | | | |
| rho | 0.73093963 | | | | | |
Table 19.
Random effects GLS regression model-3.
Table 19.
Random effects GLS regression model-3.
| TQ = β0 + β1tech_eii + β2f_sizei + β3f_agei + ε |
|---|
| Random-effects GLS regression | Number of obs | 155 |
| Group variable: company | Number of groups | 31 |
| R-sq: | Obs per group: | |
| within = 0.3647 | min | 5 |
| between = 0.0348 | avg | 5.0 |
| overall = 0.1065 | max | 5 |
| | Wald chi2(3) | 67.38 |
| corr(u_i, X) = 0 (assumed) | Prob > chi2 | 0.0000 |
Table 20.
Random effects GLS regression Coefficient result for model-3.
Table 20.
Random effects GLS regression Coefficient result for model-3.
| tq | Coef. | Std. Err. | z | p > z | 95% Conf. | Interval |
|---|
| tech_ei | 0.2722954 | 0.0397979 | 6.84 | 0.000 | 0.194293 | 0.3502978 |
| f_size | 0.3840644 | 0.1364938 | 2.81 | 0.005 | 0.1165414 | 00.6515873 |
| f_age | 0.0072056 | 0.0070725 | 1.02 | 0.308 | −0.0066563 | .0210674 |
| _cons | −1.80011 | 0.8520448 | −2.11 | 0.035 | −3.470087 | −0.1301332 |
| sigma_u | 0.48463828 | | | | | |
| sigma_e | 0.28825597 | | | | | |
| rho | 0.73867783 | | | | | |
Table 21.
Summary of the statistical tests and their results.
Table 21.
Summary of the statistical tests and their results.
| Test | Check | Threshold | Remarks |
|---|
| Pearson’s correlation analysis | Collinearity | R = ±0.20 to 0.90 | Positive and negative correlation exists with no multicollinearity |
| Hadri LM | Data stationarity | p-value < 0.05 | Data has stationarity |
| Cook Distance test | Outliers | ±3 times the mean | No outliers exist |
| Skewness and Kurtosis | Normality | ±1.96 at an alpha of 0.05 and ±2.58 at an alpha of 0.10 | Normally distributed |
| Variance Inflation Factor (VIF) | Multicollinearity | VIF < 10 | Not exists |
| Durbin–Watson | Serial autocorrelation | either two (2), near or less than two (2) | Not exists |
| Breusch–Pagan test | Heteroscedasticity | p-value < 0.05 | Exists |
| Hausman test | Endogeneity | p-value > 0.05 | Not exists |
| Breusch–Pagan test | OLS vs. GLS | p-value < 0.05 | GLS selected |
| Hausman test | Random vs. Fixed | p-value > 0.05 | Random effect selected |
Table 22.
Hypothesis Result Summary.
Table 22.
Hypothesis Result Summary.
| Hypothesis | Result |
|---|
| H1 Proactive product eco-innovation will have a positive association with firm financial performance. | Supported |
| H2 Proactive process eco-innovation will have a positive association with firm financial performance. | Supported |
| H3 Proactive Technological eco-innovation will have a positive association with firm financial performance. | Supported |
| Publisher’s Note: MDPI stays neutral with regard to jurisdictional claims in published maps and institutional affiliations. |
© 2021 by the authors. Licensee MDPI, Basel, Switzerland. This article is an open access article distributed under the terms and conditions of the Creative Commons Attribution (CC BY) license (https://creativecommons.org/licenses/by/4.0/).


