Article

A Decomposition Analysis of the Korean Manufacturing Sector: Monetary vs. Physical Outputs

Department of Earth Resources and Environmental Engineering, Hanyang University, 222 Wangsimni-ro, Seongdong-gu, Seoul 04763, Korea
*
Author to whom correspondence should be addressed.
Sustainability 2021, 13(11), 6192; https://doi.org/10.3390/su13116192
Submission received: 19 March 2021 / Revised: 6 May 2021 / Accepted: 26 May 2021 / Published: 31 May 2021
(This article belongs to the Section Energy Sustainability)

Abstract

:
This study analyzes the changes in energy consumption of the Korean manufacturing sector using the index decomposition analysis (IDA) method. To capture the production effect based on actual physical activities, we applied the activity revaluation (AR) approach in the analysis. We also developed energy consumption data in terms of primary energy supply to consider conversion loss in the energy sector to avoid any distortions in the intensity effect. The analysis covers every manufacturing subsector in Korea over the period between 2006 and 2018. Combining two distinctive approaches from the previous literature, the AR approach and primary energy-based analysis gives us helpful findings for a climate policy. First, the overall activity effect estimated from the physical output indicator is lower than that from the monetary output indicator. The monetary indicator shows that the share of energy-intensive industries decreases, whereas the physical indicator shows the opposite. Second, in terms of energy efficiency, the intensity effect is estimated as an increasing factor of energy use, whereas inversed results are shown when we use the monetary indicator. Lastly, unlike the previous studies, the AR approach results indicate that Korean manufacturing sectors have been shifting toward an energy-intensive, so it is hard to anticipate positive intensity effects, which means decreasing energy consumption factor, for a while. These results support why analyzing the driving forces of energy consumption through the AR approach and primary energy base is highly recommended.

1. Introduction

Improving energy efficiency is an effective way to mitigate the climate crisis. To develop an impactful energy policy for energy efficiency, assessing the drivers of energy consumption changes, especially the intensity effect of the changes, is essential. Thus, it is quite natural that there have been continuous efforts to analyze the drivers of energy use through a decomposition analysis covering various countries, including Europe [1,2]. Korea is also one of the most energy-consuming countries and ranked ninth in global primary energy supply as of 2019 [3]. Most Korean energy consumption is concentrated in the manufacturing industry [4], and it is a country with a high proportion of energy-intensive industries. In Korea, for example, the proportion of GDP of the petrochemical and basic metal industries, which are energy-intensive industries [5], is 23% of the total GDP of manufacturing [6]. However, as with other countries, it is very important to improve energy efficiency to cope with climate change as agreed in the Paris Agreement [7]. Therefore, it is essential to examine the energy efficiency of the manufacturing industry in Korea. In this study, energy intensity effect is used to examine energy efficiency. The intensity effect in the decomposition analysis of energy consumption indicates that energy consumption changes with the change in energy intensity. It is commonly used as an energy efficiency indicator [8].
There are various methods to measure energy intensity, such as index decomposition analysis (IDA), data envelopment analysis (DEA), and structural decomposition analysis (SDA) [9]. Among these methodologies, IDA is a widely used method in studies, focusing primarily on quantifying drivers of changes in energy consumption or the aggregate energy intensity of a particular sector [10]. There are several relevant studies [11,12,13,14]. To effectively measure the energy intensity effect, this study uses the IDA method. In the IDA method, changes in energy consumption are often decomposed into three parts: activity effect, structure effect, and intensity effect. The activity effect indicates changes in overall activity level. The structure effect represents changes in energy consumption resulting from structure change, and intensity effect represents changes in energy intensity. It is a common practice that has been widely used in previous studies to decompose energy consumption and identify the intensity effect in energy efficiency analysis [8].
Until now, monetary output indicators have been used in many studies to measure energy intensity [11,15,16,17]; monetary output measures for all sectors are easy to obtain and activity effects and structure changes are easy to compute. Besides, monetary output indicator data, such as value-added, are generally provided in a country’s national accounts and are easily accessible [8]. In fact, more than 90% of the empirical studies on energy consumption in industries generally use monetary output measures in the IDA [18]. In this study, we refer to the energy intensity given by IDA as “monetary energy intensity”; this is the energy consumption divided by the monetary output indicator (GDP) [16]. Please note that the result of analysis obtained using only monetary output indicator and without considering actual production activity indicator cannot, however, reflect the impact of physical output. For instance, even if energy efficiency in actual production deteriorates, the result of monetary intensity may appear to be opposite due to an increase in commodity value.
When energy intensity is measured using physical output indicators, it has the advantage of reducing the impact of price shocks, such as price fluctuation and inflation. It is hard to understand energy efficiency in actual production using only monetary output indicators as price is determined by supply and demand. When measuring energy efficiency using physical output indicators, “physical energy intensity” is often used as an indicator of energy efficiency, which is given as the amount of energy required per unit of physical output. In this study, physical energy intensity measurements are made using the activity revaluation (AR) approach [8]. The AR approach measures energy efficiency using both monetary output and physical output indicators; this helps reduce the impact of price fluctuation.
Several studies have analyzed the Korean manufacturing industry using an index decomposition method based on an indicator of monetary output. Kim [19] conducted a decomposition analysis of energy consumption in the Korean manufacturing sector using the logarithmic mean Divisia index (LMDI) method. In addition, this paper used the additive LMDI method as well as the multiplication method to decompose energy consumption. Choi and Oh [20] applied an extended Divisia index decomposition to the energy intensity of the Korean manufacturing industry. Using the extended Divisia index decomposition, this paper decomposed the aggregate energy intensity into real energy intensity and structural change. Jeong and Kim [21] decomposed the greenhouse gas emissions in the Korean manufacturing sector using the LMDI method. This paper contributed to providing an insight into building a long-term low carbon economy using the LMDI method. Furthermore, Oh et al. [22] conducted an LMDI analysis to decompose the carbon emission of the Korean manufacturing industry. This paper investigated sectoral trends of carbon emissions, the effects of the main factors of carbon emissions in each sector and the main drivers of the changes in terms of energy policy and socio-economic characteristics.
In previous literature, energy consumption was decomposed based on monetary outputs, such as GDP, and consequently, the results could be affected by price fluctuations. Thus, it is necessary to assess the activity effect in a decomposition analysis without the price impacts. To fill this gap, we applied a physical output indicator instead of GDP. The AR approach is utilized to incorporate physical output for the decomposition. The AR approach combines monetary output and physical output to improve decomposition analysis results [23]. Through the combination, the AR approach can effectively control the price impact on a decomposition analysis. We can also observe the energy intensity at the level of physical production. Comparing the AR approach results with the conventional, economic-based method, we could find methodological implications.
In this study, energy intensity was measured based on the primary energy supply as well as the final energy consumption. In many studies so far, energy decomposition analysis has been attempted on the basis of final energy consumption. However, as the conversion efficiency of power is as low as 34%, there is a problem in that the energy intensity is measured higher in the industry that uses a lot of electricity than the industry that uses less [15]. Moreover, in the Korean manufacturing industry, as electricity consumption continues to increase year on year, a more thorough analysis is required in terms of energy intensity measurement based on primary energy supply.
This study contributes to gaining new insights by comparing the results using monetary output and physical output indicators, while also comparing the results based on final energy consumption and primary energy supply. Considering the physical output indicator and primary energy supply, we believe that the impact of the monetary output fluctuation can be eliminated. In addition, through our analysis, we would like to clarify how the results of the analysis using monetary output indicator and those of energy analysis using physical output indicators are different and what they mean.
Section 2 describes the data and methodology. The techniques applied for calculation purposes are presented as well as the data collection process. We then describe the LMDI and AR approaches used in this study. Section 3 presents the results from this study in detail. In Section 4, we discuss what these findings suggest. Finally, in Section 5, based on our results and implications, guidelines on the future direction for the Korean manufacturing industry as well as the policies the government should implement to deal with climate change are presented.

2. Data and Methodology

2.1. Data

We analyzed changes in industrial energy consumption in Korea from 2006 to 2018 using the LMDI method based on AR approach. We used a monetary output indicator (GDP) in our monetary-based LMDI analysis. We used a physical output indicator (production index) as well as a monetary output indicator in the AR approach. Decomposition analysis was performed based on the final energy consumption as well as the primary energy supply. For a more accurate analysis, primary energy supply is used to reflect generation loss and self-consumption loss. Final energy consumption dataset is obtained from the energy balance [24]. It comprises 11 categories as shown in Appendix A Table A1. Primary energy supply is calculated from energy-balanced final energy consumption by correcting distortion caused by conversion loss. GDP obtained from the Korean Statistical Information Service (KOSIS) is used as an indicator of monetary output [6]. The GDP data set consists of 13 categories (See Table A1).
Production index is obtained from the Industrial Statistics Analysis System (ISTANS) and is used as a physical output indicator [25]. It has 38 categories (Table A1). Production index is an annual economic indicator that measures the actual output of manufacturing in comparison to the base year. The advantage of using production indices is that it is easy to obtain for all manufacturing sectors.
It is shown that GDP, production index, and final energy consumption keep increasing overall in the manufacturing sector every year (Figure 1). Final energy consumption, GDP, and production index data for all subsectors for 2006 and 2018 are presented in Table 1. The manufacturing industry is categorized into eight subsectors based on the criteria for GDP provided by the KOSIS and energy balance provided by the KEEI (Korea Energy Economics Institute as shown in Table 1 [6,24].
The manufacturing sector is divided into eight subsectors in the decomposition analysis. The final energy consumption, GDP (GDP unit is billion KRW), and production index data are aggregated for the subsectors. If there are various production indices in a subsector and they need to be summed, then each production index is multiplied by weight and subsequently summed. The total supply system based on the supplier price in the input–output (I–O) table is used as the weight. The information on I–O table can be obtained from KOSIS [6]. The energy consumption data (energy unit is ktoe) are divided for each generation source and include final energy consumption, primary energy supply, and energy conversion loss. The primary energy supply corresponding to the final energy consumption is calculated by reflecting the energy conversion loss. Similarly, energy consumption data are also summed for each subsector.

2.2. Index Decomposition Analysis

Index decomposition analysis (IDA) methodology is a widely-used technique since it was first used in the late 1970s to analyze the impact of changes in industrial energy demand [26]. This study measures energy efficiency in the Korean manufacturing industry using the IDA method. Among the various IDA methods, we employ the additive logarithmic mean decomposition method, which uses Divisia index and logarithmic mean. It has the advantage of not leaving any residue upon decomposition. Ang et al. [1,26,27,28] present a review of the application of IDA and discuss the advantages of the LMDI methodology. The LMDI method is robust and convenient to use and is suitable for multiple applications. It satisfies the factor reversal test and has no residual. Additionally, Ang [28,29] provides practical guidance on the LMDI decomposition approach. This can help with the formulation process as well as some LMDI application issues.
Total energy consumption ( Δ E t o t ), over a time period (0 to T, denoted by superscripts) is decomposed into three effects in the decomposition analysis. As shown in Equation (1), the three effects are the activity effect ( Δ E a c t ), the structure effect ( Δ E s t r ), and the intensity effect ( Δ E i n t ).
Δ E t o t = E T E 0 = Δ E a c t + Δ E s t r + Δ E i n t
Expressed for the i subsectors of industry, the total energy consumption is as follows:
E = i E i = i Y Y i Y E i Y i = i Y S i I i
where Y is the monetary output indicator (GDP), subscripts represent each subsector, and a variable without subscripts denotes that it is a variable for the entire sector. E and E i represent total energy consumption in the manufacturing sector and energy consumption of industry i, respectively. S i = Y i / Y and I i = E i / Y i represent the activity share and energy intensity of a subsector, respectively. The activity effect, structure effect, and intensity effect based on LMDI method are shown in Equations (3) through (5). Equation (6) is the logarithmic mean weight function. It is a common LMDI method using monetary output indicator. Therefore, the structural formula of the additive LMDI is expressed as follows:
Δ E a c t = i L ( E i T ,   E i 0 ) ln Y T Y 0
Δ E s t r = i L ( E i T ,   E i 0 ) ln S i T S i 0
Δ E i n t = i L ( E i T ,   E i 0 ) ln I i T I i 0
L ( a ,   b ) = a b ln a ln b If   a = b ,   L ( a ,   b ) = a

2.3. Activity Revaluation Analysis

Few studies have used physical output data to analyze energy consumption, but there are a few important ones nonetheless. Farla et al. [30] compared energy efficiency improvements in the pulp and paper industries of eight countries of the Organization for Economic Co-operation and Development (OECD). They analyzed energy efficiency using physical output data. They introduced a weighting system to calculate a physical production index instead of a simple summation of all products. Production growth in the industries has resulted in an increase in the primary energy supply; besides, the effect of structural change was marginal. The increase in energy efficiency seemed to limit primary energy supply from 1973 to 1991.
Park [31] conducted a decomposition analysis of the energy consumption in Korean industry from 1992 to 1997 by using a physical production index (PPI). The overall physical energy intensity decreased significantly in the said period; however, the energy efficiency deteriorated because the increase in the value-added production was marginal. This indicates that Korean industry needs to be restructured toward a higher value-added production. This study uses the activity revaluation (AR) approach to incorporate physical output data to adjust the effect of monetary output indicator. The AR approach is a method where a physical output indicator revalues industrial activity in terms of monetary value [8]. This method has the advantage of being able to use improved measures using the physical output indicator as well as the monetary output indicator. It divulges more than a monetary-based analysis. Decomposition is possible even when monetary output data are available for all sectors and physical output data is available for some. However, the separation between intensity effect and structure effect is not meaningful when only physical output data are available, except when physical output data are possible for all subsectors [23].
Ang and Xu [8] refine the AR approach and compare the AR, the intensity refactorization (IR), and the conventional monetary-based IDA approaches. Through a case study on Canada, they found that activity growth was the main contributor to increased energy consumption. When comparing the results between the approaches, the impact of structural transition to an energy-intensive industry was underestimated by about 20% when measuring the mix of physical output in monetary value. The difference between monetary energy intensity and physical energy intensity was also revealed. For the earlier sub-period, the monetary intensity effect was greater than the physical intensity effect, while for the later period, the result was the opposite. Norman [23] compared the AR approach to the monetary-based approach in the process of analyzing the United Kingdom industry sector during the period 1997–2012. Despite the limited physical output data, the results obtained through the AR approach and the monetary-based measurement were quite different. The measurements of energy efficiency improvement were overestimated. This signifies that physical output data need to be used when measuring energy efficiency for energy policymaking purposes.
When using physical output data for each sector, it is necessary to replace monetary energy intensity with physical energy intensity, which is U C i = E i / Q i (or the unit consumption). Physical energy intensity is often referred to as specific energy consumption (SEC). The Montgomery–Vartia (MV) index Q M V is utilized when using the AR approach in the analysis, as defined by Ang and Xu [8],. The MV index is shown in Equation (7). For subsectors without physical output data (Q), the economic output (Y) can be used instead. The activity effect, the structure effect, and the intensity effect of the AR approach are shown in Equations (8) through (10). The LMDI formulae through the MV index in the AR approach are as follows:
Q M V = exp ( i L ( Y i T ,   Y i 0 )   L ( Y T ,   Y 0 )   ln Q i T Q i 0 )
Δ E a c t = i L ( E i T ,   E i 0 ) ln Q M V
Δ E s t r = i L ( E i T ,   E i 0 ) ln Q i T / Q i 0 Q M V
Δ E i n t = i L ( E i T ,   E i 0 ) ln U C i T U C i 0

3. Results

Table 2 and Table 3 depict the yearly decomposition results for final energy consumption and primary energy supply, respectively, in the Korean manufacturing sector for the period 2006–2018. When analyzing energy consumption, we have two methods of selecting a base year: the rolling base year method and the fixed base year method. The rolling base year method involves comparison with the previous year, whereas the fixed base year method involves comparison with a fixed base year. This study uses the rolling base year method to capture the driving forces behind changes in energy consumption from 2006 to 2018 over time or how energy consumption has evolved over time [32]. Looking at the total effect for 2006–2018, it can be seen that the change in final energy consumption is much higher than the change in primary energy supply. The values of the intensity effect based on final energy consumption also seem much higher than the results based on primary energy supply. We can guess that it is because the final energy consumption cannot reflect the losses due to electricity conversion. By comparing the energy consumption in Table 2 and Table 3, it can be seen that the largest contributing periods are 2009–2010, 2010–2011, and 2016–2017. In this way, an analysis based on the primary energy supply as compared to the final energy consumption can adjust the distortion caused by energy conversion. Table 2 shows that final energy consumption in 2017–2018 increased to 35,031 ktoe, as compared to 2006–2007, where it was −422. The activity effect appears to play an important role in increasing energy consumption in both the approaches. Meanwhile, the structure effect and the intensity effect seem to contribute to reducing the energy consumption.
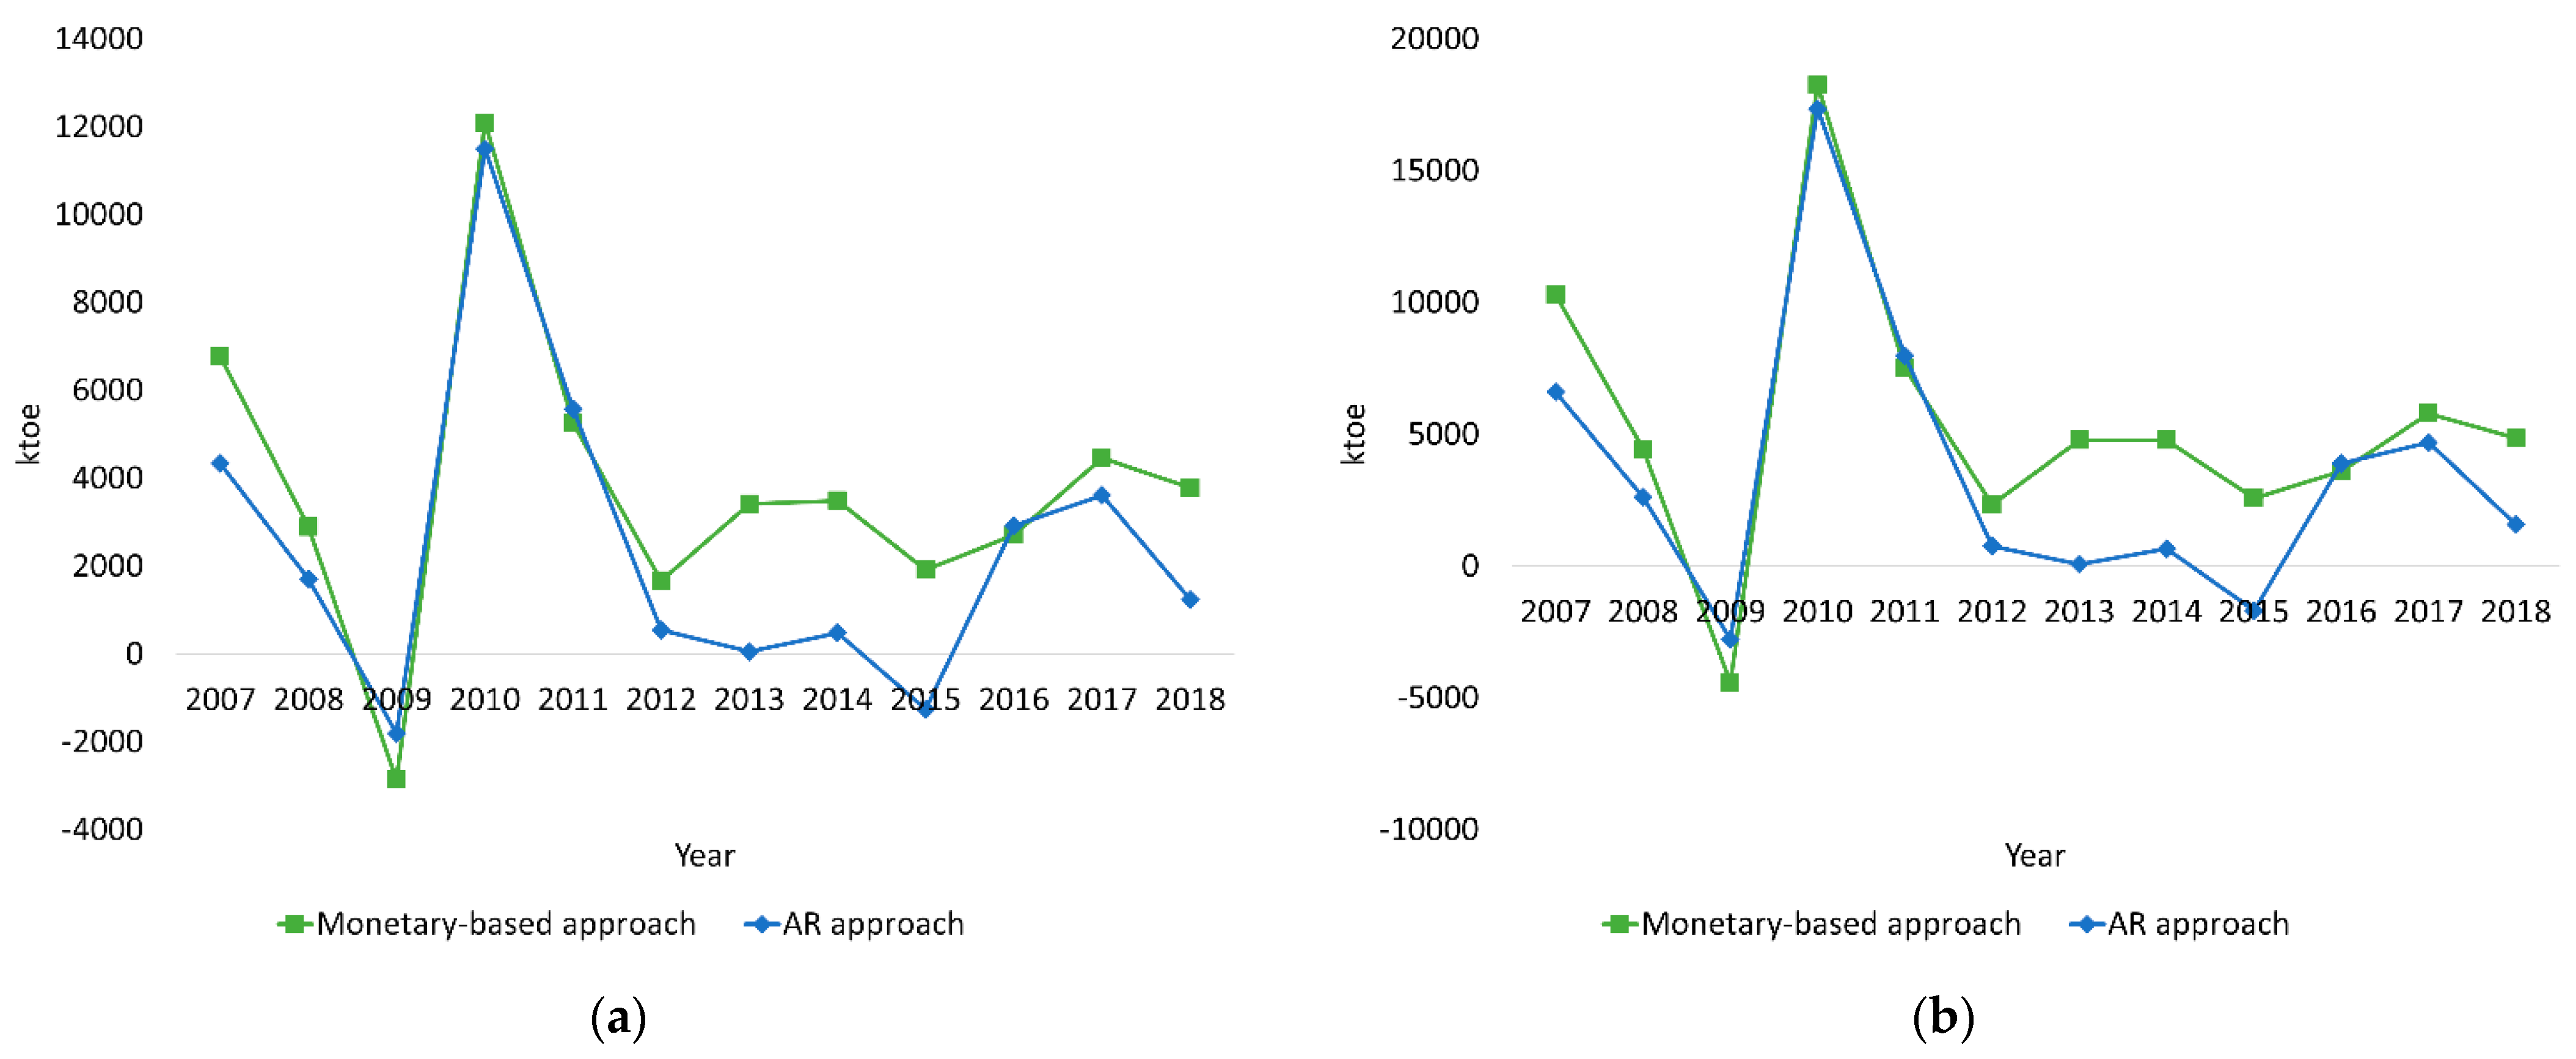
Figure 2, Figure 3 and Figure 4 show the activity effect, structure effect, and intensity effect, respectively. The results are based on both final energy consumption and primary energy supply. The overall activity effect in the AR approach seems less than that in monetary-based approach as illustrated in Figure 2. In 2015, the activity effect in the monetary-based approach is positive but it is opposite in the case of the AR approach. This shows that the activity effect can be overestimated unless the impact of price increase is eliminated. In 2009, the activity effect declined significantly due to the US financial crisis caused by the real estate bubble [
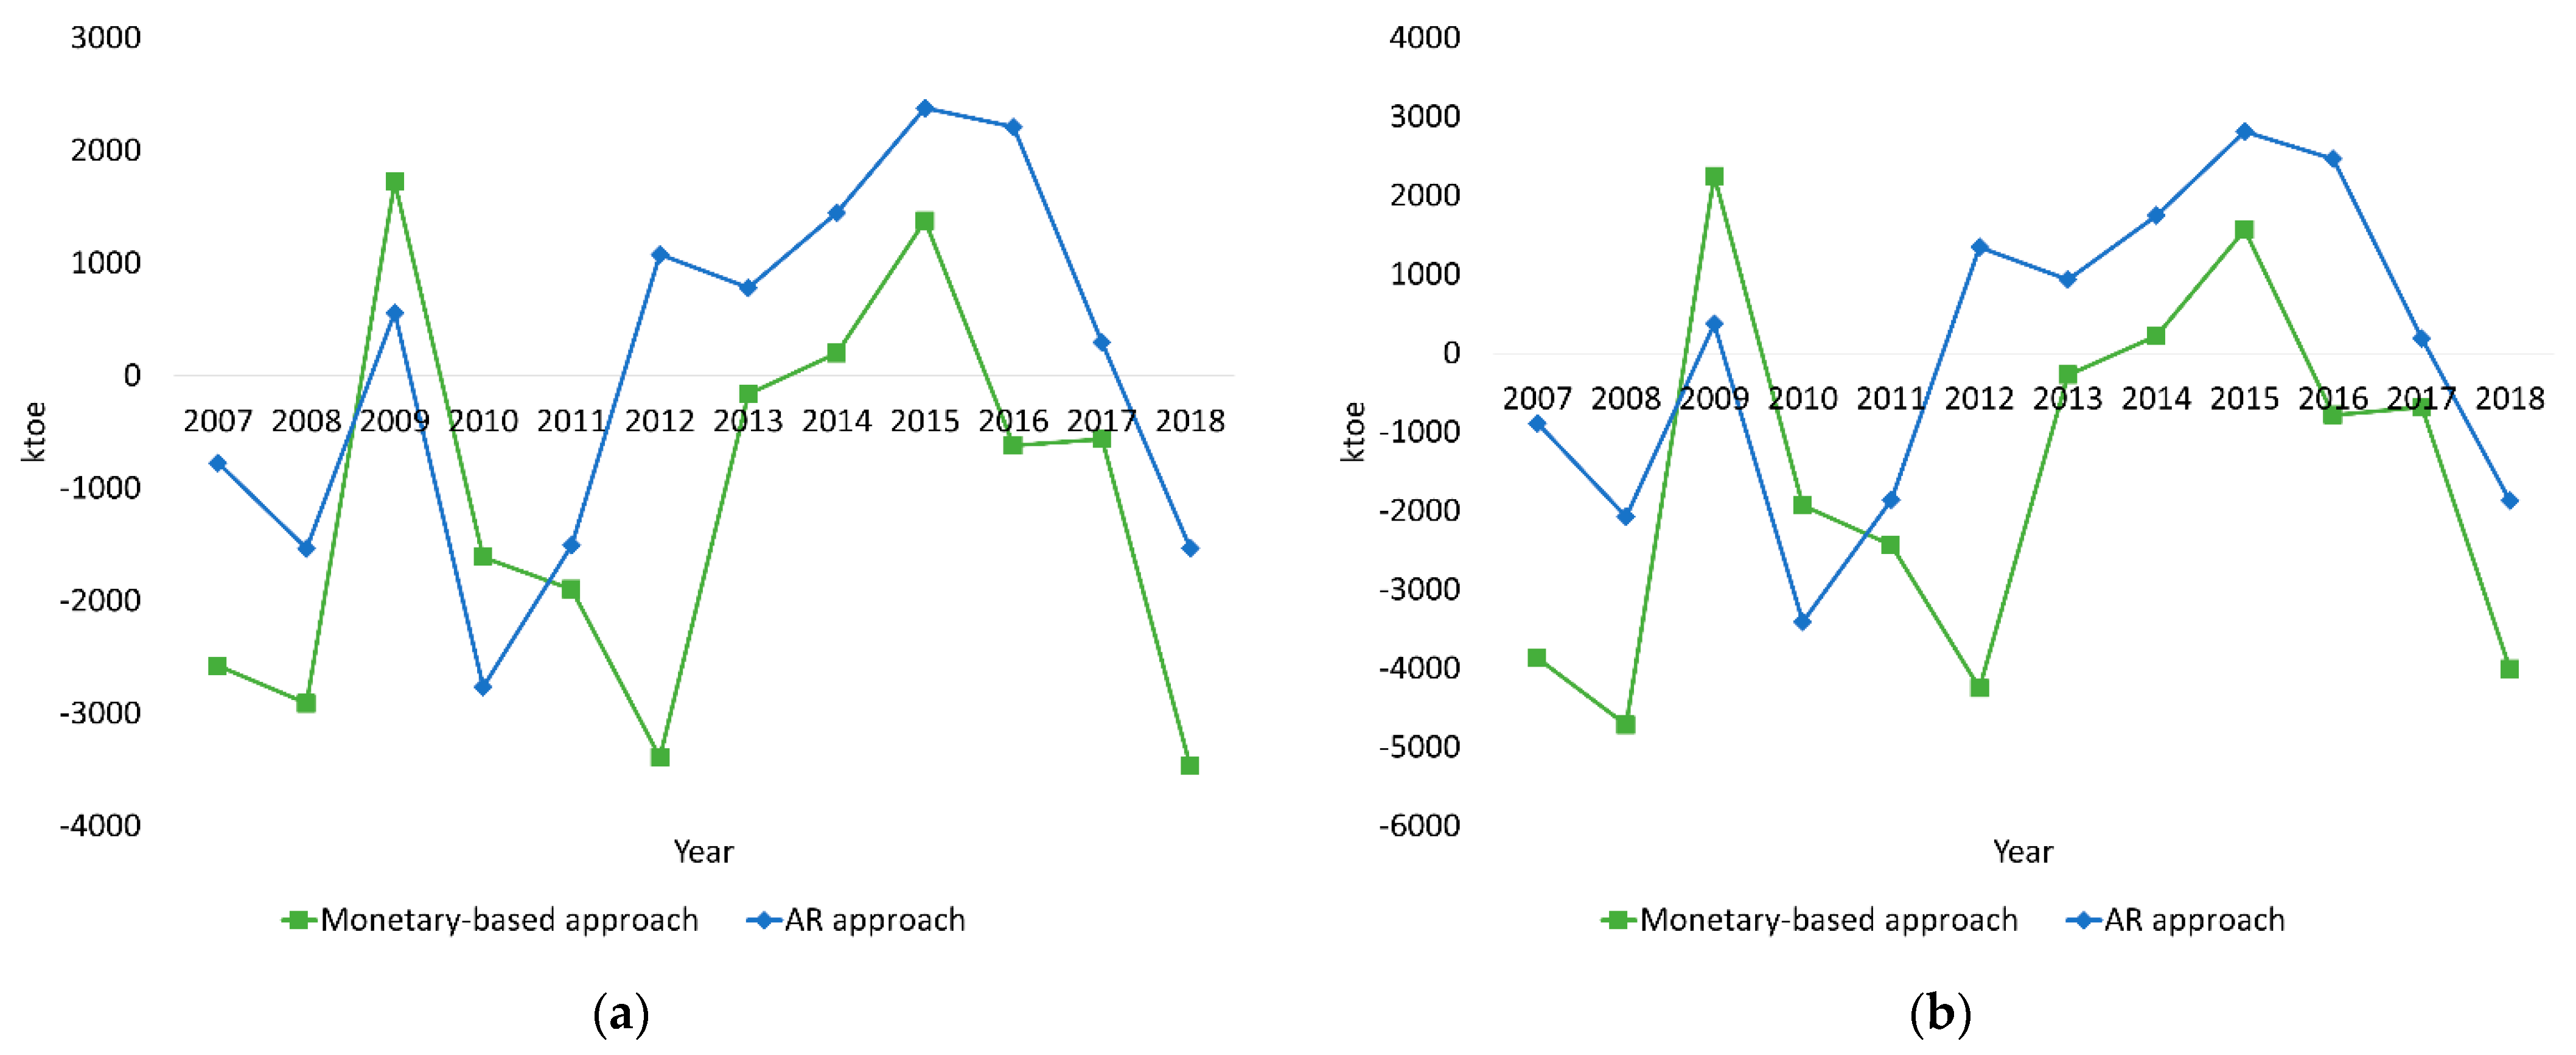
21]. The structure effect analyzed using only monetary output indicator is lower than that obtained using AR approach (see Figure 3). The structure effect seems to increase when the impact of price is eliminated.
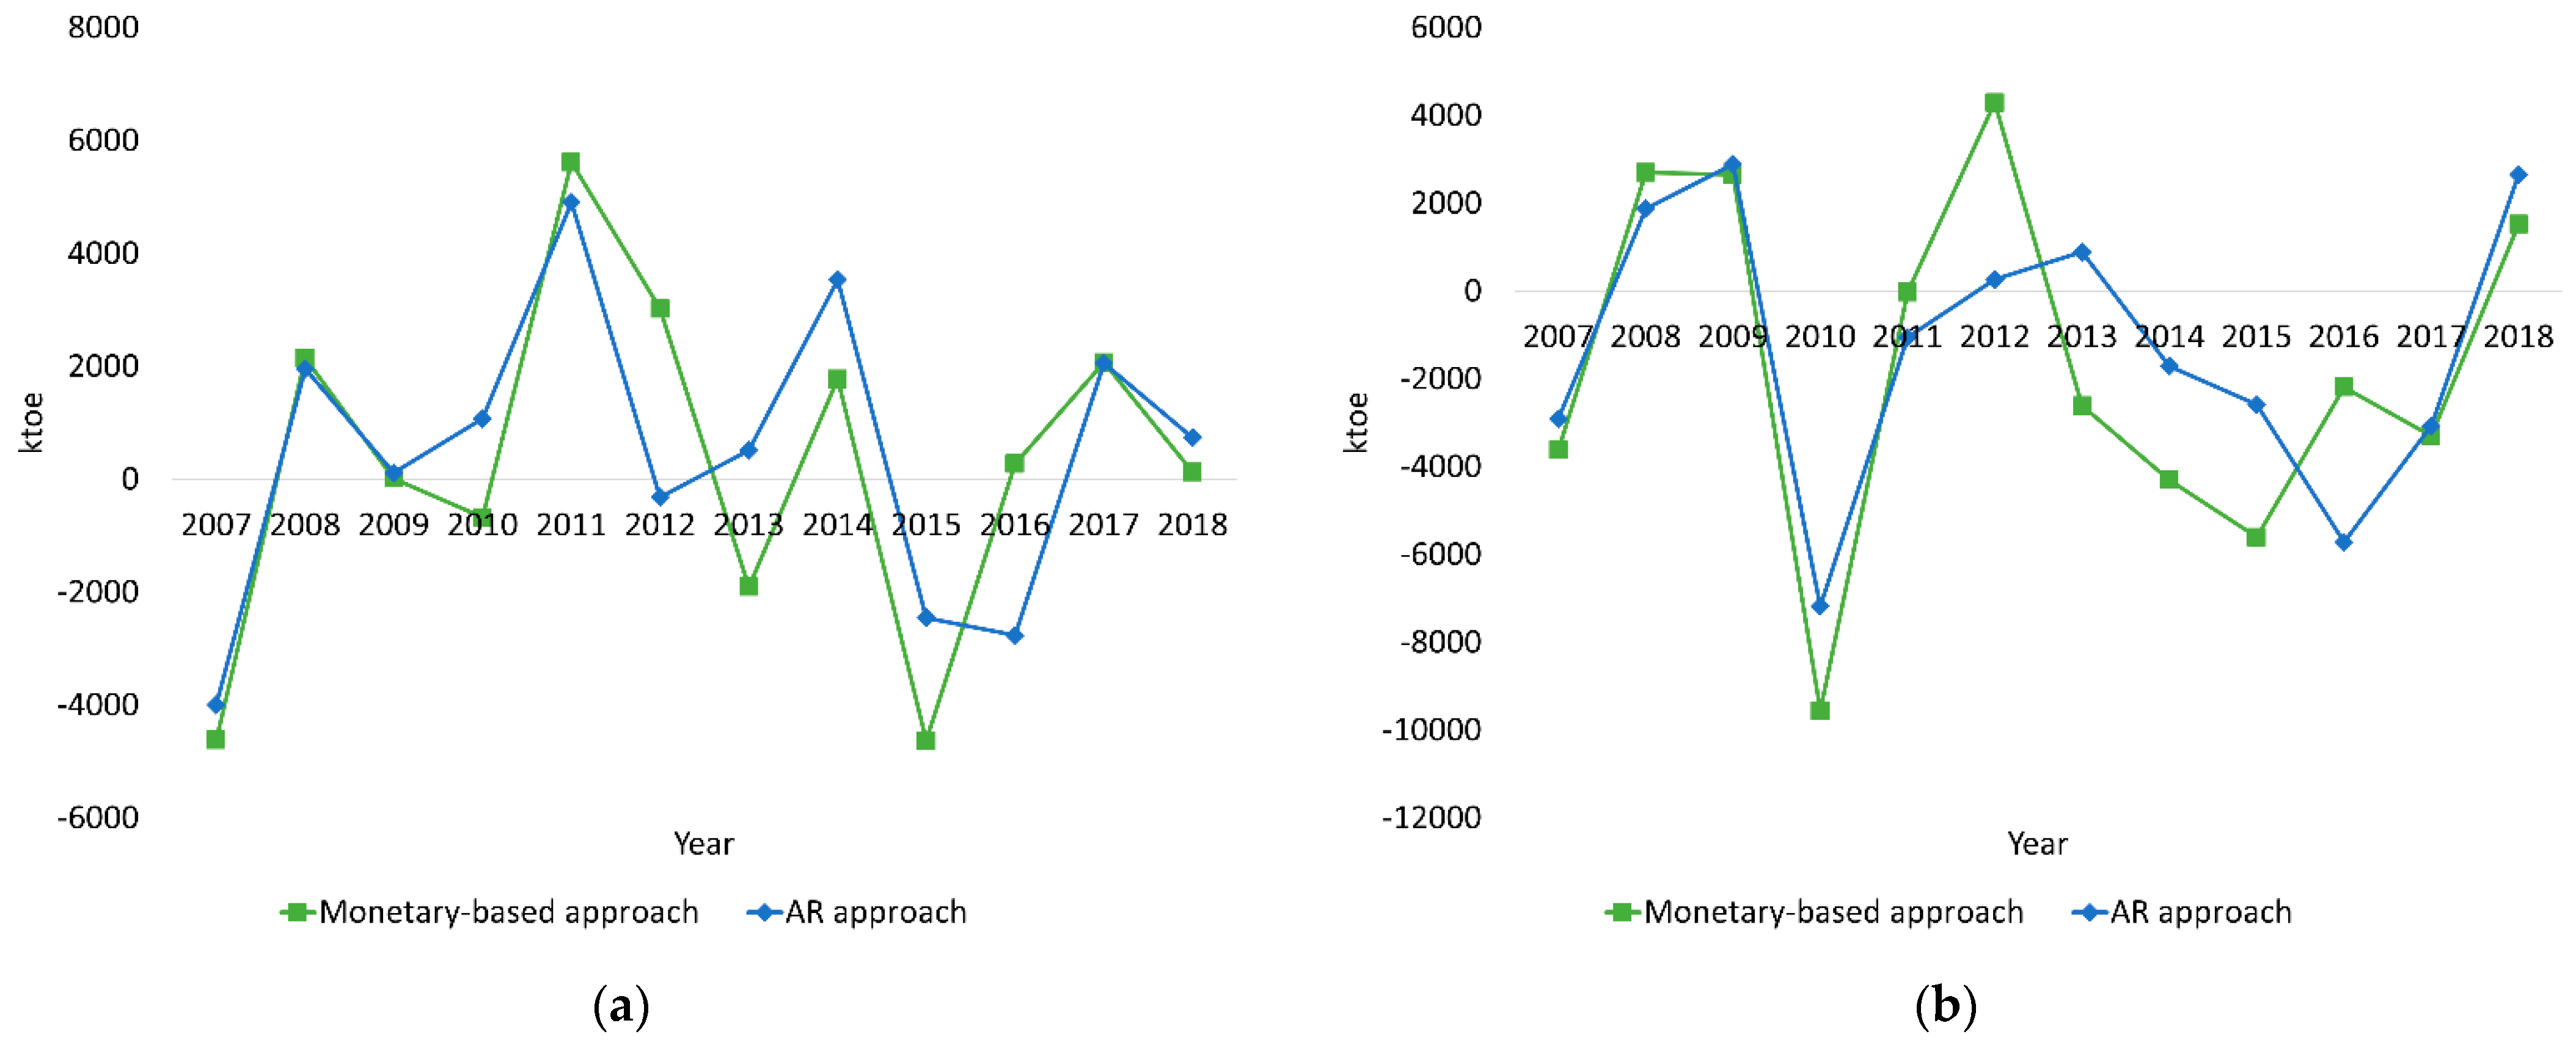
In the analysis using the monetary output indicator, the intensity effect indicates the monetary energy intensity, which is given by energy consumption per unit monetary output indicator (GDP), whereas in the analysis using the physical output indicator, it is the energy consumption per unit physical output indicator. As shown in Figure 4, the intensity effect in the AR approach is generally higher than that in the monetary-based approach, especially over the period after 2013. It indicates that even if there is no improvement in energy efficiency in physical production, an increase in price can reduce the intensity effect.
Comparing the results based on final energy consumption and primary energy supply (see Figure 4), the differences in intensity effects in 2010 and 2014 are noticeable. In the AR approach, the energy efficiency seems to be bad when analyzed based on the final energy consumption but seems to improve when analyzed based on the primary energy supply.

4. Discussion

This study analyzes the energy intensity using the AR approach to reflect physical output and compares the results from the monetary-based approach and the AR approach. Besides, it compares the results between the final energy consumption and the primary energy supply. We discuss the overestimation in the activity effect of the monetary-based approach as compared to that of the AR approach. We address different directions of the structure effects in the two approaches. We discuss different perspectives when examining the monetary intensity effect and the physical intensity effect. We discuss why the results differ based on the final energy consumption and the primary energy supply. We gain new insights through these comparisons.
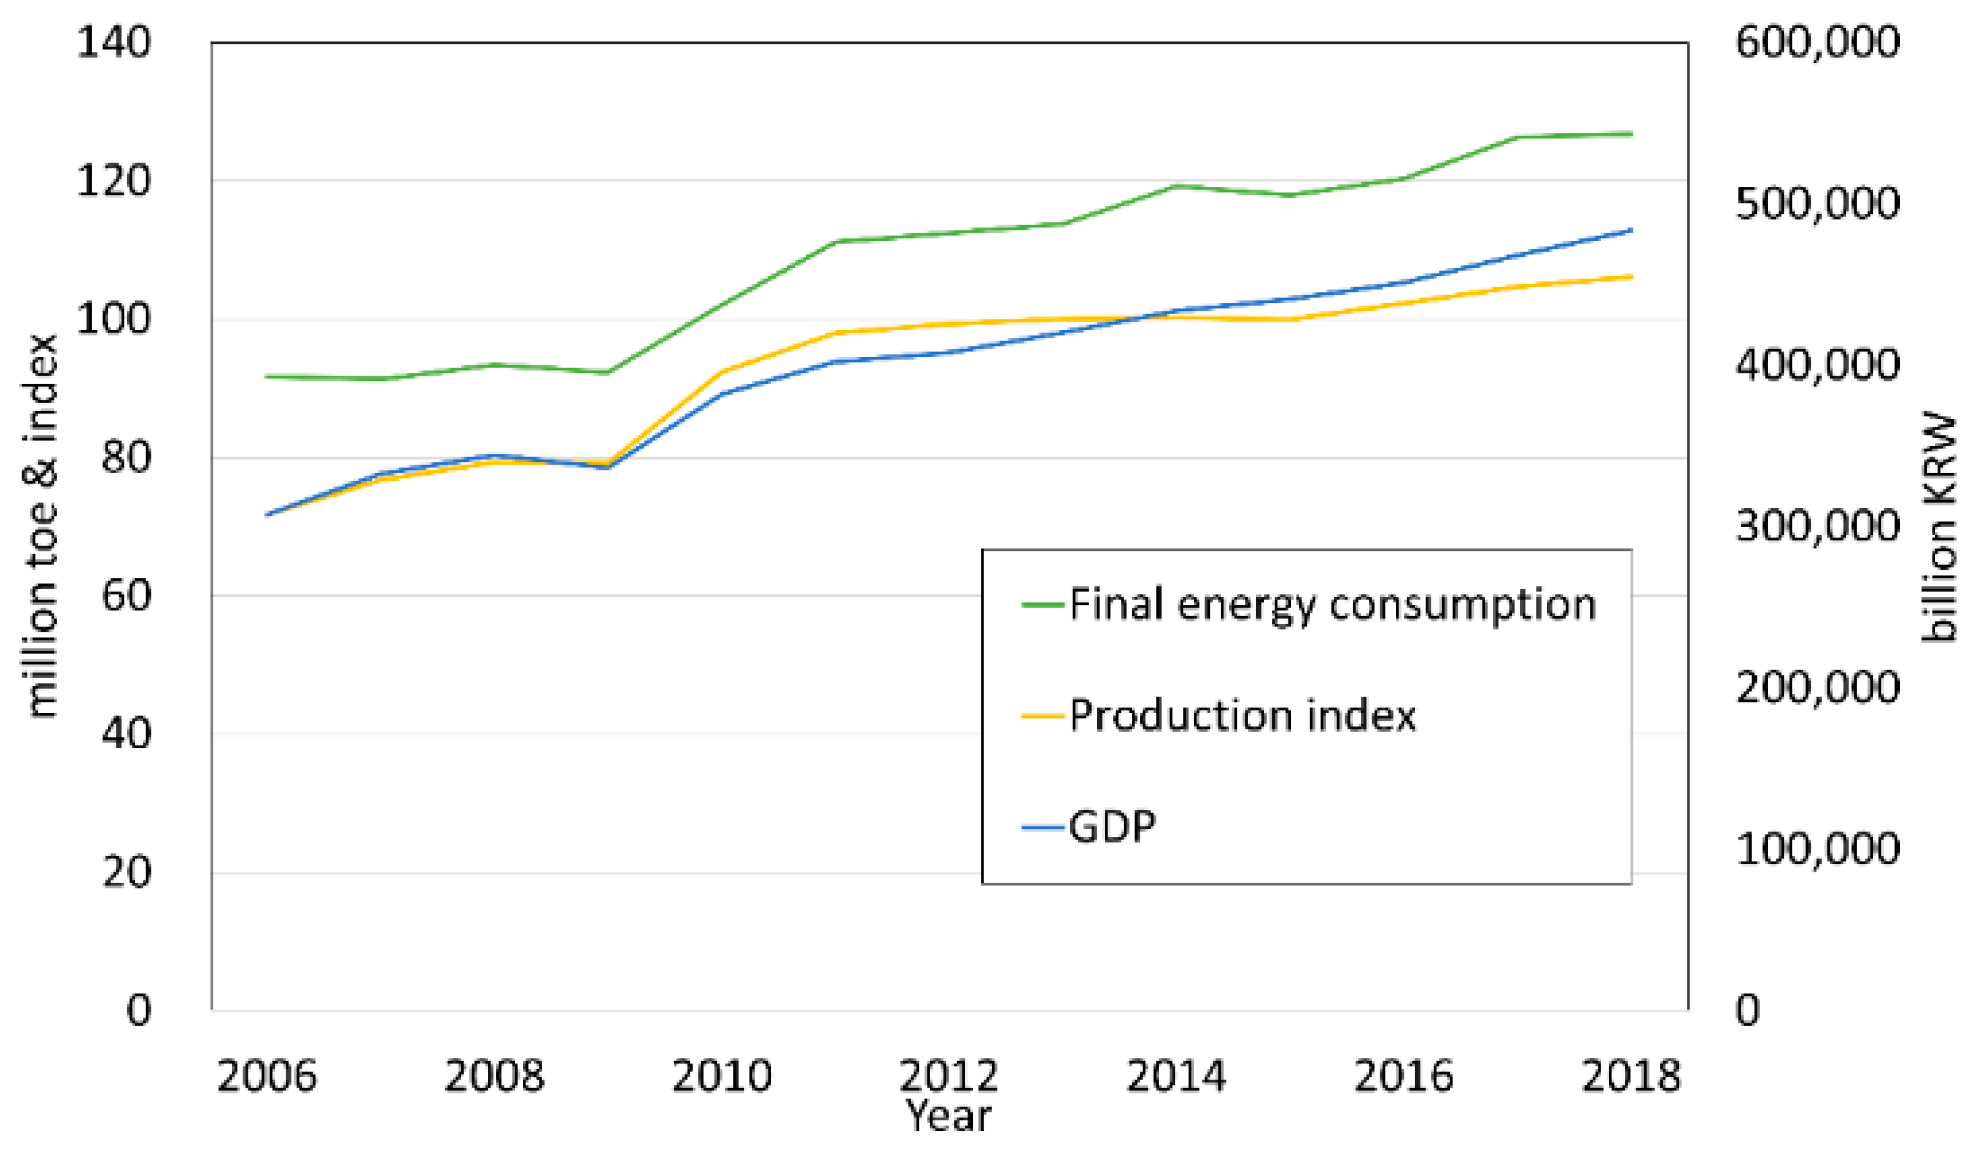
In the results based on monetary indicators from 2013 to 2018, the activity effect continues to be positive. Conversely, when analyzed using physical output indicator, the activity effect in 2013 and 2014 are marginal, whereas in 2015, it is negative. This indicates that product prices have risen or that the proportion of high value-added industries has risen, rather than the actual production output has increased considerably. In fact, if we look at the macro data, the average annual GDP growth rate of 3.91% is higher than the production index of 3.41% in the manufacturing sector from 2006 to 2018. These findings would not have been observed had they been analyzed using only the monetary output indicator. When decomposition analysis is performed using only monetary output indicator, it is not possible to determine whether a change in activity effect is due to a change in product price or a change in actual production activity. Therefore, there is a limitation in that it is difficult to reflect energy efficiency technologies related to actual production in an analysis that does not use physical output indicator. However, in the analysis using physical output indicator, it is possible to interpret whether only a change in product’s price has occurred or whether physical output has also changed. This suggests that analysis using physical output indicator is necessary to compensate for the shortcomings of the decomposition analysis method that is based on monetary output indicator.
Looking at the change in the structure effect, the result given by the monetary output indicator show negative values, excluding three years (2009, 2014, 2015), which can be considered as a structural shift toward a low energy consumption industry. However, the results of the analysis using physical output indicators show that the structural effects continued to be positive from 2012 to 2017. In the results of the AR approach, the share of energy-intensive industries appeared to increase from 2012 to 2017. It can be interpreted that the share of the energy-intensive industries’ production did not increase significantly, rather, the product prices or the share of the high value-added industries has increased more. It is necessary to increase the share of high value-added industries. However, we know that transition to low energy consumption is also necessary in terms of physical production.
Looking at the overall intensity effect from 2006 to 2018, it seems that the value of the monetary-based approach is generally greater than the value of the AR approach. It means that energy efficiency is overestimated if measured using only monetary output. It can be expected that the intensity effect based on the monetary output indicator is greater due to an increase in product prices or an increase in the share of high value-added industries. In 2013, the intensity effect given by monetary analysis is negative, but the intensity effect given by the physical output indicator is positive. This result shows that energy efficiency has not been improved in terms of physical efficiency, and it would not have been observed had it been analyzed using only monetary output indicator. From the results, it can be argued that the energy-efficient technology was inefficient in actual production. Companies need to improve energy efficiency by using energy-efficient technologies to reduce energy consumption per physical output as well as energy consumption per value-added. Transition to high value-added manufacturing and improvement of energy efficiency in actual production technology are both important tasks for the government and should not be neglected in the future.
Until now, in research on energy decomposition analysis, final energy consumption has been widely used to decompose energy consumption. When other energy sources are converted to electric power, the conversion efficiency of electric power exceeds 30%; therefore, it should be noted that it is more accurate to analyze based on primary energy supply rather than final energy consumption. Therefore, this study analyzes and compares the results using both final energy consumption and primary energy supply. When comparing the final energy consumption and the primary energy supply, the difference in intensity effect is more notable than that in the other effects. In particular, the primary energy-based intensity effects in 2010 and 2014 are much lower than the results analyzed based on the final energy consumption. It means that the primary energy supply did not increase significantly as compared to the corresponding increase in the final energy consumption. It seems to be largely influenced by the petrochemical sector and the basic metal sector. It can be speculated that this is due to the impact of fuel mix changes in the petrochemical and basic metal sectors. Although the final energy consumption has increased, energy efficiency has improved significantly in terms of primary energy supply. For the analysis based on only final energy consumption, energy efficiency does not appear to have improved, although energy efficiency seems to have improved when analyzed based on actual primary energy supply, as the analysis cannot be performed to reflect the loss of energy conversion. Therefore, for a more accurate analysis, it is advisable that energy efficiency be measured based on primary energy supply.
Comparing our results with the previous decomposition studies on Korean manufacturing can give us additional insights. For the same study period from 2006 to 2010, Kim [19] and Choi and Oh [20] show the negative values for the structure effect and intensity effect. In our results, structure effect and intensity effect values are also negatively signed. However, comparing the results between the monetary-based approach and the AR approach, we show that the absolute values of structure effect and intensity effect using the AR approach are smaller than those of the monetary-based approach. The difference between the monetary output and physical output, and this influence on the results given by the AR approach indicates that it may be valuable to use physical output indicator for the energy decomposition analysis in the future [23]. We can measure the energy efficiency with reduced price impact using the physical output indicator. This was not possible in previous literature [19,33], which used only monetary output indicator for decomposition analysis.
From the perspective of international comparison, Ang and Xu [8] and Norman [23] used the AR approach to perform decomposition analysis and compared the results of the AR approach to the monetary-based approach. The results given by the monetary-based and the AR approaches showed negative values for structure effect and intensity effect. However, the absolute values of the results given by monetary output and physical output were different. The absolute values of the structure effect using the AR approach were higher than those of the monetary-based approach, but the absolute values of the intensity effect using the AR approach were smaller than those of the monetary-based approach. It shows that analysis using physical output indicator can produce different results and provide more information.

5. Conclusions

We incorporate physical output data to adjust the effect of monetary output indicator and compare the results given by the monetary-based approach and the AR approach. We also compare the results based on final energy consumption and primary energy supply. The analysis results indicate that the overall activity effect is reduced when the impact of the price is eliminated by using a physical output indicator. The structure effects are higher when analyzed in the AR approach than in the monetary-based approach. It can be noted that the Korean manufacturing industry continues to transition toward an energy-intensive industry. The energy efficiency seems to be overestimated when analyzed without physical output indicators. The analysis results support that investigating the driving forces of energy consumption via the AR approach and primary energy base could give us a more accurate result.
We also compare the impact of replacing final energy consumption with primary energy supply. The intensity effects in the two periods (2010, 2014) are much lower when using the primary energy supply. We now know that we need to consider primary energy supply in energy consumption analysis to reflect the energy conversion loss. Consequently, a monetary- and final energy-based approach cannot appropriately reflect energy efficiency in the manufacturing sector. Physical output data should be used to eliminate the impact of price in the analysis. Therefore, we suggest measuring energy efficiency using physical output indicator. If the government collects physical output data separated into categories, which is the same as the energy consumption classification, it can be helpful in measuring physical energy intensity.
This study has a limitation in that the production indices were aggregated using averaging. This aggregation could make a biased index, but the averaging is the only way to apply if there is no useful information on sector production. Further studies using a bottom-up approach and field data could support our findings. Additionally, since the AR approach can capture the impact of physical production changes without price effects, applying it for the decomposition analysis of the other industries would be an excellent future research direction—agriculture, fishing, mining, and transport sectors could be promising.

Author Contributions

Conceptualization, J.K. and J.L.; Methodology, J.K. and J.L.; Validation, J.K.; Formal Analysis, J.L.; Investigation, J.L.; Data Curation, J.L.; Writing—Original Draft Preparation, J.L.; Writing—Review & Editing, J.K.; Supervision, J.K.; Funding Acquisition, J.K. All authors have read and agreed to the published version of the manuscript.

Funding

This work was supported by the Human Resources Development program (No. 20194010201860) of the Korea Institute of Energy Technology Evaluation and Planning (KETEP) grant funded by the Korea government Ministry of Trade, Industry and Energy.

Institutional Review Board Statement

Not applicable.

Informed Consent Statement

Not applicable.

Data Availability Statement

The data is publicly open and fully available from the Korean statistics bureau introduced in Section 2.1.

Conflicts of Interest

The authors declare no conflict of interest.

Appendix A

Table A1. Classification of subsectors used in this study.
No.Classification of Subsectors Used in This StudyEnergy Balance (KEEI)GDP (KOSIS)Production Index (ISTANS)
1Food TobaccoFood TobaccoFoodFood
Tobacco
2Textile and ApparelTextile and ApparelTextile and ApparelTextile
Leather and Shoes
Apparel
3Wood and PulpWood and Wood Pro.Wood and PulpWood
Pulp and Publications Pulp
Publications
4PetrochemicalPetrochemicalCoke and Petro.Petroleum Refining
ChemicalPetrochemical
Fine Chemistry
Rubber
Plastic
Medicine
5Non-MetallicNon-MetallicNon-MetallicNon-Metallic
6Basic MetalIron and SteelBasic MetalIron and Steel
Non-ferrous Non-ferrous
Casting
7Fabricated MetalFabricated MetalFabricated MetalFabricated Metal
Electric EquipmentElectric Equipment
MachineryGeneral Machinery
Computer and ElectronicSpecial Machinery
TransportationComputer
Semiconductor
Display
Appliances
Battery
Communication
Precision Equipment
Car
Aviation
Railway
Ship
8Other ManufacturingOther ManufacturingOther ManufacturingOther Manufacturing
Other Energy Furniture
Glass
Ceramic
Cement

References

  1. Ang, B.W. Decomposition analysis for policymaking in energy. Energy Policy 2004, 32, 1131–1139. [Google Scholar] [CrossRef]
  2. Lan, J.; Malik, A.; Lenzen, M.; McBain, D.; Kanemoto, K. A structural decomposition analysis of global energy footprints. Appl. Energy 2016, 163, 436–451. [Google Scholar] [CrossRef]
  3. The British Petroleum Company plc (BP). Statistical Review of World Energy 2020, 69th ed.; BP p.l.c.: London, UK, 2020. [Google Scholar]
  4. Yoon, Y.; Kim, Y.-K.; Kim, J. Embodied CO2 Emission Changes in Manufacturing Trade: Structural Decomposition Analysis of China, Japan, and Korea. Atmosphere 2020, 11, 597. [Google Scholar] [CrossRef]
  5. Kim, J.; Heo, E. Sources of structural change in energy use: A decomposition analysis for Korea. Energy Sources Part B Econ. Plan. Policy 2016, 11, 309–313. [Google Scholar] [CrossRef]
  6. Korean Statistical Information Service (KOSIS). Available online: https://kosis.kr/statisticsList/statisticsListIndex.do?menuId=M_01_01&vwcd=MT_ZTITLE&parmTabId=M_01_01 (accessed on 17 December 2020).
  7. Yoon, Y.; Yang, M.; Kim, J. An Analysis of CO2 Emissions from International Transport and the Driving Forces of Emissions Change. Sustainability 2018, 10, 1677. [Google Scholar] [CrossRef] [Green Version]
  8. Ang, B.W.; Xu, X.Y. Tracking industrial energy efficiency trends using index decomposition analysis. Energy Econ. 2013, 40, 1014–1021. [Google Scholar] [CrossRef]
  9. Park, S.; Kim, J. Energy efficiency in Korea: Analysis using a hybrid DEA model. Geosystem Eng. 2016, 19, 143–150. [Google Scholar] [CrossRef]
  10. Xu, X.Y.; Ang, B.W. Index decomposition analysis applied to CO2 emission studies. Ecol. Econ. 2013, 93, 313–329. [Google Scholar] [CrossRef]
  11. Kim, J.; Heo, E. Energy and economic growth: Causality analysis using decomposed energy consumption. Geosyst. Eng. 2012, 15, 171–178. [Google Scholar] [CrossRef]
  12. Dasgupta, S.; Roy, J. Analysing energy intensity trends and decoupling of growth from energy use in Indian manufacturing industries during 1973–1974 to 2011–2012. Energy Effic. 2016, 10, 925–943. [Google Scholar] [CrossRef]
  13. Fernández González, P.; Landajo, M.; Presno, M.J. Tracking European Union CO2 emissions through LMDI (logarithmic-mean Divisia index) decomposition. The activity revaluation approach. Energy 2014, 73, 741–750. [Google Scholar] [CrossRef]
  14. Baležentis, T.; Galnaitytė, A.; Kriščiukaitienė, I.; Namiotko, V.; Novickytė, L.; Streimikiene, D.; Melnikiene, R. Decomposing Dynamics in the Farm Profitability: An Application of Index Decomposition Analysis to Lithuanian FADN Sample. Sustainability 2019, 11, 2861. [Google Scholar] [CrossRef] [Green Version]
  15. Park, S.; Kim, J. A Comparison of Decomposition Analyses for Primary and Final Energy Consumption of Korea. Environ. Resour. Econ. Rev. 2014, 23, 305–330. [Google Scholar] [CrossRef] [Green Version]
  16. Chong, C.; Liu, P.; Ma, L.; Li, Z.; Ni, W.; Li, X.; Song, S. LMDI decomposition of energy consumption in Guangdong Province, China, based on an energy allocation diagram. Energy 2017, 133, 525–544. [Google Scholar] [CrossRef]
  17. Ang, B.W.; Xu, X.Y.; Su, B. Multi-country comparisons of energy performance: The index decomposition analysis approach. Energy Econ. 2015, 47, 68–76. [Google Scholar] [CrossRef]
  18. Liu, N.; Ang, B.W. Factors shaping aggregate energy intensity trend for industry: Energy intensity versus product mix. Energy Econ. 2007, 29, 609–635. [Google Scholar] [CrossRef]
  19. Kim, S. LMDI Decomposition Analysis of Energy Consumption in the Korean Manufacturing Sector. Sustainability 2017, 9, 202. [Google Scholar] [CrossRef] [Green Version]
  20. Choi, K.-H.; Oh, W. Extended Divisia index decomposition of changes in energy intensity: A case of Korean manufacturing industry. Energy Policy 2014, 65, 275–283. [Google Scholar] [CrossRef]
  21. Jeong, K.; Kim, S. LMDI decomposition analysis of greenhouse gas emissions in the Korean manufacturing sector. Energy Policy 2013, 62, 1245–1253. [Google Scholar] [CrossRef]
  22. Oh, I.; Wehrmeyer, W.; Mulugetta, Y. Decomposition analysis and mitigation strategies of CO2 emissions from energy consumption in South Korea. Energy Policy 2010, 38, 364–377. [Google Scholar] [CrossRef]
  23. Norman, J.B. Measuring improvements in industrial energy efficiency: A decomposition analysis applied to the UK. Energy 2017, 137, 1144–1151. [Google Scholar] [CrossRef]
  24. Korea Energy Economics Institute (KEEI). Energy Balance; Korea Energy Economics Institute: Ulsan, Korea, 2018. [Google Scholar]
  25. Industrial Statistics Analysis System (ISTANS). Report on Mining and Manufacturing Survey. Available online: https://istans.or.kr/mobile/suTreeList.do (accessed on 17 December 2020).
  26. Ang, B.W.; Zhang, F.Q. A survey of index decomposition analysis in energy and environmental studies. Energy 2000, 25, 1149–1176. [Google Scholar] [CrossRef]
  27. Ang, B.W.; Liu, F.L. A new energy decomposition method: Perfect in decomposition and consistent in aggregation. Energy 2001, 26, 537–548. [Google Scholar] [CrossRef]
  28. Ang, B.W. The LMDI approach to decomposition analysis: A practical guide. Energy Policy 2005, 33, 867–871. [Google Scholar] [CrossRef]
  29. Ang, B.W. LMDI decomposition approach: A guide for implementation. Energy Policy 2015, 86, 233–238. [Google Scholar] [CrossRef]
  30. Farla, J.; Blok, K.; Schipper, L. Energy efficiency developments in the pulp and paper industry. Energy Policy 1997, 25, 7–9. [Google Scholar] [CrossRef]
  31. Park, H. Energy Efficiency Improvements in the Korean Industry. Environ. Resour. Econ. Rev. 2001, 10, 135–159. [Google Scholar]
  32. Fan, J.-L.; Liao, H.; Liang, Q.-M.; Tatano, H.; Liu, C.-F.; Wei, Y.-M. Residential carbon emission evolutions in urban–rural divided China: An end-use and behavior analysis. Appl. Energy 2013, 101, 323–332. [Google Scholar] [CrossRef]
  33. Baležentis, T.; Li, T.; Chen, X. Has agricultural labor restructuring improved agricultural labor productivity in China? A decomposition approach. Socio-Econ. Plan. Sci. 2020, 10.1016/j.seps.2020.100967. [Google Scholar] [CrossRef]
Figure 1. GDP, final energy consumption, and activity effect in Korean manufacturing sector (2006–2018).
Sustainability 13 06192 g001
Figure 2. Activity effect in Korean manufacturing industry (base: previous year). (a) result based on final energy consumption; (b) result based on primary energy supply.
Sustainability 13 06192 g002
Figure 3. Structure effect in Korean manufacturing industry (base: previous year). (a) result based on final energy consumption; (b) result based on primary energy supply.
Sustainability 13 06192 g003
Figure 4. Intensity effect in Korean manufacturing industry (base: previous year). (a) result based on final energy consumption; (b) result based on primary energy supply.
Sustainability 13 06192 g004
Table 1. Final energy consumption, GDP, and production index of all subsectors for the years 2006 and 2018.
SubsectorFinal Energy ΔConsumption (ktoe)GDP (Billion KRW)Production Index (2015 = 100)
200620182006201820062018
Food and Tobacco1605192017,01121,67990.53104.89
Textile and Apparel2207124214,86914,503112.3991.34
Wood and Pulp1990135111,19813,891103.2497.76
Petrochemical44,89372,09165,38590,23377.23111.35
Non-Metallic56144323963614,190102.16110.00
Basic Metal19,86130,50224,00526,88083.27100.92
Fabricated Metal652511,430165,554289,81675.60107.06
Other Manufacturing90203885619310,97095.50105.01
Table 2. Decomposition results for final energy consumption in Korean manufacturing sector (ktoe).
Monetary-Based ApproachAR Approach
TotalActivityStructureIntensityActivityStructureIntensity
2006–2007−422 6770 −2575 −4616 4342−773−3991
2007–20082140 2898 −2910 2151 1711−15341962
2008–2009−1123 −2860 1723 14 −1802561118
2009–20109816 12,097 −1611 −671 11,501−27621077
2010–20118990 5265 −1895 5621 5583−15034911
2011–20121314 1674 −3387 3027 5511079−316
2012–20131358 3422 −159 −1905 58783517
2013–20145476 3494 201 1781 48714513538
2014–2015−1324 1925 1378 −4627 −12522379−2451
2015–20162374 2712 −617 280 29252211−2762
2016–20175978 4464 −561 2075 36202972062
2017–2018454 3786 −3464 131 1242−1530742
2006–201835,031 45,983 −13,645 2693 30,356−7675443
Table 3. Decomposition results for primary energy supply in Korean manufacturing sector (ktoe).
Monetary-Based ApproachAR Approach
TotalActivityStructureIntensityActivityStructureIntensity
2006–20072826 10,315 −3869 −3619 6616−886−2904
2007–20082430 4438 −4715 2707 2621−20731882
2008–2009499 −4401 2251 2648 −27733752897
2009–20106771 18,253 −1929 −9553 17,353−3405−7176
2010–20115077 7532 −2430 −24 7987−1857−1053
2011–20122389 2339 −4250 4301 7701349269
2012–20131916 4790 −273 −2601 81938896
2013–2014719 4789 224 −4295 6681750−1700
2014–2015−1447 2585 1568 −5601 −16812816−2582
2015–2016653 3618 −782 −2182 39032468−5717
2016–20171824 5799 −684 −3291 4702190−3067
2017–20182380 4855 −4002 1528 1593−18692657
2006–201826,037 64,226 −18,863 −19,325 42,399−716−15,646
Publisher’s Note: MDPI stays neutral with regard to jurisdictional claims in published maps and institutional affiliations.

