Abstract
Urban road tunnels are a reasonable remedy for inconvenience due to congested road traffic. However, they bring specific threats, especially those related to the possibility of fire outbreak. This work is a case study for selected urban road tunnels. Considering tunnel specificity, road traffic intensity, and structure and based on the literature data for vehicle fire probability, the chances of a fire accident were estimated for selected tunnels in Poland. It was shown that low power tunnel fires could be expected in the 10–20-year time horizon. Although such threats cannot be disregarded, tunnel systems are designed to cope with them. The chances of a disastrous fire accident were estimated as well. Such events can occur when an HGV with flammable goods or a tanker are involved. Such accidents are fortunately very rare, but, on the other hand, that is the reason why the available data are scanty and burdened with high uncertainty. Therefore, a discussion on the reliability of the obtained results is also provided.
1. Introduction
Road tunnels are an important element of the transport infrastructure, allowing drivers to overcome terrain obstacles, while at the same time, shortening distance and travel time. The location and conditions for the construction of tunnels result from difficult or even impossible passage between two significant transport nodes. The other advantages of the tunnels include insensitivity to weather conditions, which is also associated with reduction of the daily amplitude of air temperature changes.
In the case of cities, road tunnels are an effective alternative to ring roads. They run under the city centers so there is no need to plan roads around a highly urbanized city center, and the difficulties with purchasing plots of land for road construction are avoided. Urban road tunnels relieve the surface transport network and allow for more convenient arrangement of urban space. Road tunnels, which are built more and more often in strict city centers, effectively reduce the impact of harmful substances emitted by internal combustion engines. Examples of such solutions include tunnels in the Big Dig project on routes I-90 and I-93 near Boston in the United States, tunnels on the M-30 route around the center of Madrid, or the Yamate tunnel, measuring over 18 km, near Tokyo [1]. It is also worth mentioning the Tunnel of the Southern Bypass of Warsaw, which will be the longest tunnel in Poland measuring 2355 m. According to the plans, the tunnel will be put into operation later this year [2]. Although an exhaustive list of urban tunnels cannot be obviously posted here, other exemplary tunnels located in highly urbanized areas are shown in Table 1.

Table 1.
Exemplary tunnels located in highly urbanized areas.
Although the cost of building urban road tunnels is usually enormous (may exceed EUR 70 million per one kilometer [3]), the expected benefits support their construction. On the other hand, the specificity of the tunnel (limited space, difficult access) brings new threats, which in extreme cases, may lead to catastrophic events [4].
The most important risk related to the use of road tunnels is the possibility of a fire. In this case, apart from people in close vicinity of the fire incident, all tunnel users are threatened as well. This is because the main factor that threatens people is the rapidly spreading smoke. The smoke generated in a vehicle fire is toxic, and additionally, it reduces visibility and confuses people [4]. This factor can be even more dangerous in urban road tunnels due to their greater congestion with vehicles. High temperatures associated with car fires endanger people, as well as the construction of tunnels [5].
The basic parameter that determines a fire is its power. A HRR quantity, which stands for heat release rate, is commonly used for this purpose worldwide. Systems of every road tunnel must be designed to cope in case of fire outbreak of an assumed power. Therefore, a design for measuring HRR factor appears here that is the basis for safety system design. A peak HRR value describes the power of a fire that occurs after the flashover stage and before the fire can be controlled by fire suppression systems, firefighters, or simply, lack of fuel. The peak HRR value that occurs during the fire’s outbreak should not exceed the adopted design’s fire HRR value [6]. Table 2 shows the peak HRR values for different types of vehicles [7].

Table 2.
Values of HRR for different types of vehicles [7].
1.1. Historical Examples of Fires in Tunnels
The following are descriptions of several tragic fires in road tunnels based on a literature review. Most of these fires broke out as a result of road collisions, and only one of them was a result of a vehicle failure.
One of the greatest road disasters in history was the fire of a truck passing through the Mont Blanc Tunnel in March 1999. The cargo carried by the aforementioned truck was 12 tons of flour and 9 tons of margarine, which turned out to be a very calorific fuel for the spreading fire. The fire began to develop rapidly after a smoking truck stopped about halfway through a nearly 12-km tunnel on its way from France to Italy. As a result of this incident, 39 people died, most of them suffocated by thick and toxic smoke from the fire, and the tunnel itself was closed for several years for repairs and modernization [7].
Two months after the tragedy in the Mont Blanc tunnel, a road collision occurred in the 6.5 km-long Austrian Tauern Road Tunnel, in which passenger cars were pushed under a truck that was carrying paint. As a result of the collision, cars caught fire, including trucks with dangerous cargo, and traffic was blocked in both directions. The fire spread to a total of 16 trucks and 24 passenger cars. Twelve people were killed and 42 injured. As in the case of the Mont Blanc tunnel, the damage to the tunnel structure caused by many hours of fire was so serious that the tunnel was closed for repairs [7,8].
The collision was also the cause of an accident in the Swiss Gotthard Road Tunnel in 2001. An unsober driver of a truck with a semi-trailer caused the accident by driving into the opposite lane and hitting another truck head-on. Leaking fuel ignited both trucks within minutes. One of them was loaded with tires, the intense burning of which resulted in the suffocation of 11 people within several hundred meters from the accident site. The fire destroyed 230 m of the ceiling and 750 m of electrical installation [7].
In 2014, in China, in the Yanhou Tunnel, there was an unfortunate collision of two tanks carrying a flammable and, at the same time, toxic substance—methanol. The collision resulted in a leakage of methanol that led to a fire involving over 40 vehicles, including trucks carrying coal. The fire was characterized by enormous heat emission and caused serious damage to the tunnel and resulted in the death of 40 people [9].
1.2. Tunnels and Legal Regulations
In the European Union, there are three basic documents relating to road safety in tunnels. These include the Vienna Convention on Road Traffic [10], the European Agreement concerning the International Carriage of Dangerous Goods by Road (ADR) [11], and Directive 2004/54/EC of the European Parliament and of the Council on minimum safety requirements for tunnels in the Trans-European Road Network [12]. In addition, each country may have its own guidelines related to the design and construction of road tunnels and ensuring an appropriate level of safety in them.
The Vienna Convention is the basic document defining all the rules for moving on the roads. On the subject of the road tunnels themselves, one can find only a few basic pieces of information about the rules of movement in tunnels, i.e., about maintaining safe distances from the vehicles in front, as well as about the prohibition of reversing, stopping, and turning back in road tunnels [10].
More details can be found in the ADR agreement drafted in 1957. The content of the ADR agreement includes information on the classification of vehicles carrying dangerous goods, as well as the requirements for the equipment and construction of these vehicles. The vehicles themselves must be properly marked with plates informing about the type of hazard and identification numbers of the transported cargo [11,13]. According to the ADR agreement, there are five categories of tunnels. They are marked with the letters A, B, C, D, and E, where the letter A stands for tunnels with no restrictions on the transport of dangerous goods, and the letter E stands for tunnels with the most rigorous requirements. The definition of the tunnel category is based on the consideration of three main hazards—explosion, release of a toxic substance, or fire that can cause damage to people or serious damage to the tunnel. Tunnel categories may change depending on the time of day or day of the week [11].
The construction and operation of tunnels in the Trans-European Road Network (TERN) are governed by the provisions of Directive 2004/54/EC. There are a number of technical requirements that the tunnels at TERN must meet. These include, among others. ventilation, monitoring systems with detection of a road incident or fire, as well as the arrangement of emergency exits and hydrants with appropriate markings. The tunnels referred to in Directive 2004/54/EC are also subject to periodic inspections every six years, during which the inspection body checks the technical requirements for tunnels. The tunnel approval depends on the result of the inspection. Another requirement is drills with tunnel staff and emergency services every four years. It is worth noting that these regulations apply only to tunnels whose length exceeds 500 m and are part of the road belonging to TERN [12].
1.3. Fire Hazards Related to Vehicles
Motor vehicles contain many potential sources of fire. Modern materials used more and more often in vehicles are characterized by an increasingly better strength-to-weight ratio, but due to their flammability, they pose an additional fire hazard. In the 1960s, the average weight of plastics was around 10 kg per vehicle, and 30 years later it was close to 100 kg [14]. In today’s cars, this weight exceeds the value of 200 kg, and in the near future, it may even reach 350 kg [15].
In the case of a passenger car with an internal combustion engine, the most calorific source of fire is a full fuel tank, and for an electric vehicle—batteries that store electricity. Unsealing the fuel tank or electric batteries may lead to a sudden increase in the spread of fire, which may also affect other vehicles in the vicinity.
Engine oils, similarly to combustion engine fuels, are substances based on hydrocarbon compounds. Obtained from crude oil, they are flammable and calorific and emit large amounts of smoke when burned. While in the case of passenger vehicles, the amount of all lubricants in circulation ranges from a few to several liters, in the case of buses and trucks, these amounts are many times greater.
The basic component of car tires is rubber, which, during combustion, emits large amounts of thick, black, and poisonous smoke that reduces visibility. An additional risk is the possibility of an explosion in the tire with air under a pressure of several bar.
It is worth mentioning a relatively new risk, which is the R1234yf refrigerant used in the vast majority of new vehicles launched on the European market since 2017. The change of the refrigerant type was dictated by the requirements of the EU regulation reducing greenhouse gas emissions from air conditioning systems in motor vehicles of M1 and N1 categories [16]. R1234yf is characterized by a lower GWP (global warming potential) but has been classified as flammable, which was confirmed by the conducted research [17]. In the event of a leak in the air conditioning system near hot engine components, the vehicle may suddenly ignite.
1.4. Technical Condition of Vehicles in Poland
According to a report by the Supreme Audit Office, the technical condition of vehicles has a significant impact on both the probability of an accident and its potential consequences [18]. Modern technical solutions allow not only to reduce the risk of an accident but also its consequences. Since the work is focused on road tunnels in Poland, Polish data are quoted. However, as one might expect, these data indicate general trends. According to statistical data, in 2019, there were approximately 28.3 million motor vehicles registered in Poland (excluding two-wheelers), the average age of which was over 18 years. The real age of vehicles quoted by experts was slightly lower, e.g., 12–13 years, due to “ghost” vehicles that have not been deregistered, have not been subject to a compulsory technical inspection, and have not taken out a compulsory insurance policy for over 6 years. However, this does not change the fact that the statistical car owned by a Pole is old, unsafe, non-ecological, and prone to faults [17,18]. The age structure of vehicles (excluding two-wheelers) in Poland is shown in Figure 1.
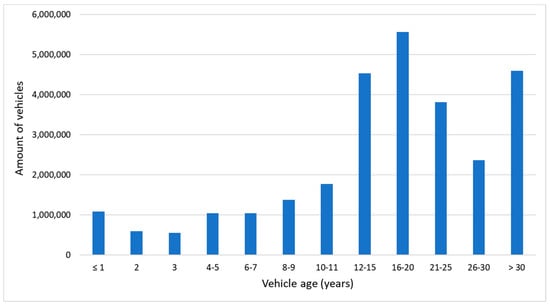
Figure 1.
Age structure of motor vehicles (excluding two-wheelers) in Poland in 2019 [19].
Against the backdrop of the European Union, Poland is also not looking its best. According to the data from 2020 collected by the European Automobile Manufacturers Association (ACEA) [20], the average age of a vehicle up to 3.5 tons for the entire European Community is 11.5 years, while in Poland, this value fluctuates around 14 years. The list does not take into account ghost vehicles. In addition, Poland has the largest fleet of both trucks (1,150,493) and buses (122,604), which makes Poland the largest carrier of passengers and goods in the European Union. Unfortunately, the average age for these two groups of vehicles is 12.2 and 15.6 years, respectively [20].
1.5. Possible Causes of Vehicle Self-Ignition
The data differ slightly depending on sources, so just two examples are quoted to illustrate the issue. Historical data [21] show that the most common cause of fires in road tunnels is auto-ignition of the vehicle as a result of a technical fault. Fires resulting from collisions constitute only a small part (much less than 20%, different sources give different data) [21,22]. Figure 2 presents the distribution of causes of fires in tunnels based on 161 accidents that occurred in China in the years 2000–2016 [21].
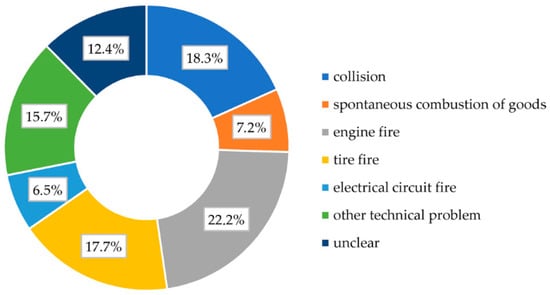
Figure 2.
Tunnel vehicle fires by causes [21].
Similar data come from the statistics of 78 accidents in tunnels in Australia in the period 1992–2016 [22]. Apart from a direct collision of vehicles, vehicle fire causes can be related also to faults in components, such as the engine, braking system, electrical system, or air conditioning system. Figure 3 shows the contributions of various cause according to the Australian report; attention should be paid to the considerable share of fires whose causes could not be identified. This suggests how difficult is to determine the exact cause of a fire when examining the remains of an accident. Therefore, the above data should be regarded as examples of supposed fire causes.
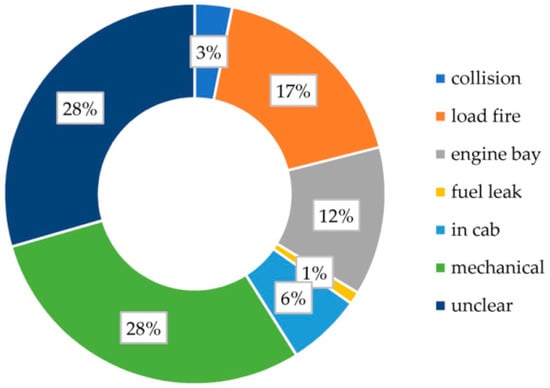
Figure 3.
Causes of vehicle fires [22].
A defective braking system may lead to an elongation of the braking distance and, consequently, a collision with the vehicle in front. A similar scenario may occur in the event of overheating of the braking system due to prolonged use of the service brake while driving downhill. The high temperature resulting from friction may lead to a reduction in the friction coefficient between the brake pad and the brake disc and to an increase in the temperature of the brake fluid, which loses its properties after boiling [23,24].
A fire in the engine compartment may arise after a collision or from contact of hot engine components with combustible materials or operating fluids. Damaged seals cause leakage of flammable substances that can spread quickly. Examples of such phenomena are oil leakage from the turbocharger or leakage of new AC refrigerant (R1234yf) [17,25]. A similar situation may occur in the case of leaks in the exhaust system, because exhaust gas temperatures in the exhaust manifold reach 1000 °C, and hot gas streams pose another fire hazard [26].
Self-ignition of tires with correctly adjusted pressure during normal rolling of the wheels on the road is impossible. The temperature of tires while driving on highways rarely exceeds 60 °C, while the ignition temperature of tires is around 400 °C [27,28]. The reason truck tires catch fire is because the wheel bearings are neglected, or the brake is stuck. As a result of driving a truck on a high-speed road with a worn-out bearing, in which there is a lack of lubricant or excessive wear of the rolling elements, increased frictional resistance arises. Driving in these conditions generates enough heat to ignite the grease, the fire of which is then transferred to the tires. The same effect will trigger when driving with a locked brake [25].
In electrical installations, short circuits can occur that can melt the insulation and ignite the plastic components. Short circuits in vehicles may be the result of unprofessional repairs and system modifications, abrasion of cable insulation, system overload, as well as cable degradation and covering of system components with electrically conductive impurities. Due to the increasing number of electrical installations, short circuit fires can occur in any part of the vehicle [25].
1.6. Human Factor
In countries with a large number of tunnels or with extremely long tunnels, there is a problem of fear or even tunnel phobia. It is strictly associated with claustrophobia where people feel fear while being exposed to enclosed spaces, especially in tight and dark rooms [29]. While this may seem harmless, it poses a serious risk if a panicked driver suddenly decides to turn back when he wants to get out of the tunnel. It, therefore, requires special preventive and educational activities (training). There are also certain technical solutions, such as the appropriate choice of lighting or the determination of places of detention with light close to natural [30].
The impact of driving under the influence of alcohol or other intoxicants on road safety cannot be ignored either. The previously mentioned accident that took place in the Gotthard Road Tunnel was caused by drunk driving [7]. According to the report of the Polish Police from 2020 [31], in 2020, traffic participants under the influence of alcohol caused 2015 accidents (8.6% of the total), in which 271 people died (10.9%), and 2167 people were injured (8.2%). Vehicle drivers were the most numerous group of perpetrators of accidents. They were responsible for 1656 accidents, in which 216 people were killed and 1847 people were injured.
1.7. The Aim of the Work
In the view of the above review, a question arises: how safe are urban road tunnels and is it possible to quantitatively assess the safety level? Road accidents, and fire incidents in particular, are rare events. Therefore, the analyzed periods must be long enough to obtain statistically significant data. This may introduce some distortions, because road traffic characteristic and volume, infrastructure conditions, driving habits, and vehicles change over time. Additionally, the data come from different countries, in which these factors are naturally different as well. However, it seems to be better to consider more data and average them than disregard some of them basing on some arbitrary criteria.
Since Poland is a rather lowland country, the number of tunnels was low until recently. Currently, due to the intense growth of urban road traffic and the development of road infrastructure, a number of urban road tunnels have been put to use, while some others are under construction or planned in the near future. That is why there are no own data on the fire hazards in urban road tunnels. The main aim of the presented work is to estimate quantitatively the risk of fire accidents in a given road tunnel. The considered above issues affect the risk, but it is difficult to point out direct relations between each of them and the risk level. Therefore, to find answers to the question posed in the paper title, the available data on tunnel fires frequency were first put together, and some averaged values were determined. Then, these values were applied to a few selected urban tunnels, and eventually, considering their specificity, the probabilities of fire accidents for different time horizons were determined. Special attention was paid to disastrous tunnel fires. Finally, the conclusions section summarizes the findings of the presented work.
2. Materials and Methods
As was aforementioned, the available data are not completely consistent, because the methodologies used in different countries and different periods vary significantly. Therefore, it is difficult to directly compare such data. On the other hand, tunnel fires are rare events, and there are only a few accidents recorded every year; therefore, each single short-term statistic could be burdened by a high uncertainty. Hence, taking into account as large a dataset as possible would give more reliable results. In the presented approach, the majority of the gathered data were generalized, and then some selected data were used to precisely adjust the results. The base for the presented analyses were data published for Australia [22], Austria [32], China [21], France [33], and Norway [34]. Despite the lack of strict coherency, thanks to the comprehensive nature of these works, it was possible to summarize these data, as is shown in Table 3.

Table 3.
Selected data on fires in road tunnels.
As the main indicator of tunnel fires frequency (TFF), the number of fires per 109 km traveled by vehicles in tunnels was adopted. However, unfortunately, it is sometimes difficult to determine the exact value of TFF, even for a given country. For instance, it varies significantly in time (as for China), or different values are given by various sources. This is because the data cover different periods or different sets of tunnels. The selected values of this indicator are presented in Figure 4.
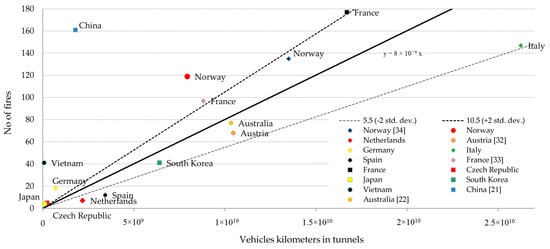
Figure 4.
The dependency of the number of fire accidents on the vehicle kilometers traveled in tunnels. Data with no source indication originate from PIARC report [35].
Apart from the data in Table 3, some values published in a concise form in the PIARC report on road tunnel fires [35] were added.
As it can be seen, the values of TFF are really scattered. Despite the majority of them forming a diagonal band, there are also some outstanding values that do not match the trend. The regression line corresponds to the value of TFF equal to 8.0. This value was adopted in the following analyses. The determination coefficient is R2 = 0.4, which indicates a moderate data consistency. The standard deviation is 1.25. Hence, lines corresponding to values twice the standard deviation (5.5 and 10.5) are shown. Most data points fall within this range. However, the adopted value of TFF cannot be applied without consideration of other factors specific for a given road tunnel (type, location, inclination, speed limits, geometry, driving culture, traffic regulations, vehicles condition) [35].
Tunnel fires are rare events and occur mutually independently, thus, their occurrence is ruled by Bernoulli distribution. A single trial corresponds to each time a vehicle passes through a tunnel; a successful outcome happens if a fire outbreak occurs. If the number of trials (n) tends to infinity and the probability of single success (p) tends to zero in such a way that their product is constant, the distribution can be approximated by Poisson distribution. In practice it is valid for n > 20 and p < 0.2. Hence the number k successes in a series of n trials can be expressed as follows:
If the length of a given tunnel equals to L km, the probability of a single success (fire outbreak) is p = L*TFF/109; the number of trials depends on the traffic intensity determined for this tunnel and on the period under consideration.
In the case of a typical 3-lane urban road tunnel of a length of 1 km with daily traffic intensity of 50,000 vehicles, assuming the above value of TFF, probability distributions of the number of fire accidents for this tunnel in some selected periods were determined (Figure 5). Additionally, the expected value (EV = np) of the number of fire accidents in a period was calculated. As it can be observed, the most probable situation for the period of 1 year is no fire accident at all. Then, as the period length increases, the expected number of fires grows. The expected value for the period of 7 years is 1.02, which can roughly be interpreted that a single accident is expected every 7 years.
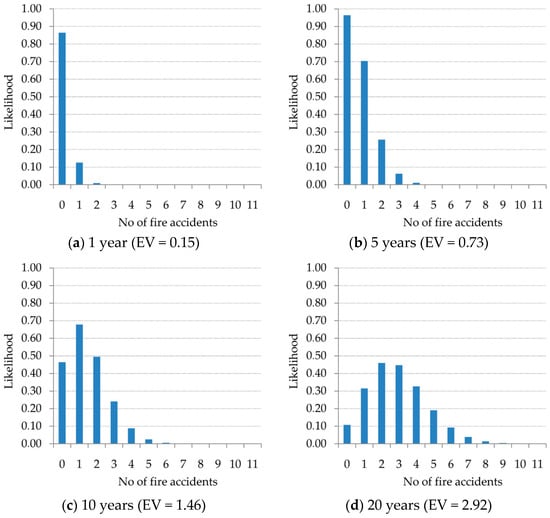
Figure 5.
Probability distributions of the number of fire accidents for a sample tunnel in different periods. (a) 1 year (EV = 0.15); (b) 5 years (EV = 0.73); (c) 10 years (EV = 1.46); (d) 20 years (EV = 2.92).
For large values of np product, the Poisson distribution tends to the normal distribution with both mean and variation equal to np. This can be seen already for the distribution for the period of 20 years (np = 2.92).
Since the value of TFF strongly depends on the vehicle type, for reliable analyses, PCs and HGVs should be distinguished. According to Table 3, only the data for Austria contain this information directly; the other statistics give just the percentage of different vehicle types in fire accidents without any information on their percentages in traffic in general.
According to the report on fires in road tunnels in France [33], a tunnel type also strongly influences the values of TFF. This is shown in Table 4. Thus, this factor should also be used to modify the values of TFF when developing predictions for a given tunnel. In the same work, the influence of the tunnel inclination was also mentioned, unfortunately, only in a qualitative form: the greater upward inclination of a tunnel, the higher the fire rate is.

Table 4.
The impact of a tunnel type on TFF [33].
3. Results and Discussion
The consequences of a tunnel fire depend on fire power. An incident of a low power fire (about 4 MW, for instance, a fire of a single passenger car or a quickly extinguished fire) is not expected to pose a very significant threat for both people and material goods [7]. Tunnel safety systems should cope successfully with such fires. However, it may happen that a number of people will be exposed temporarily to toxic smoke [36]. In contrast to this, a high or very high power fire (much higher than 20 MW) could lead to many casualties, many vehicles burned, and even significant damage of a tunnel structure [37].
Because it is difficult to accurately determine the fire power when a real fire accident happens, these data are mainly just estimations. Figure 6 and Figure 7 present an attempt to merge the data on fire severity from different countries, which were included in the PIARC report on road tunnel fires [35]. As fire power strongly depends on vehicle type, the cumulative probability distributions are shown for non-HGV and HGV separately.
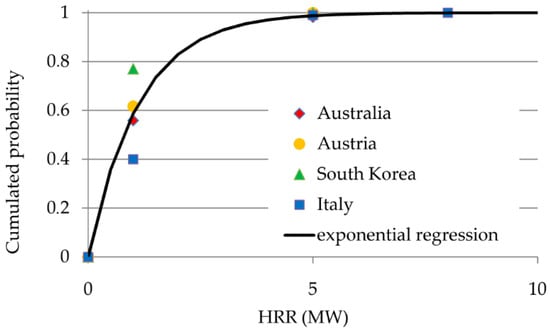
Figure 6.
Cumulative probability of fire power for non-HGV.
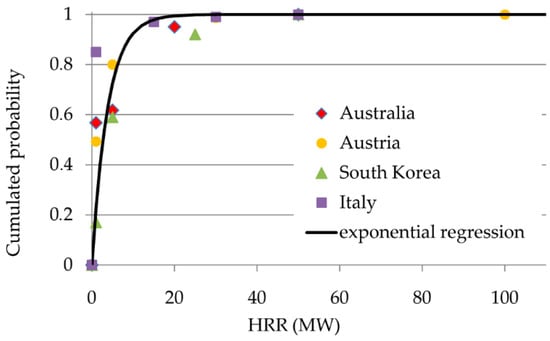
Figure 7.
Cumulative probability of fire power for HGV.
Since low power fires are much more likely than those of higher power and very high power fires are really exceptional, it is assumed that the probability distribution of the power of tunnel fires is of the exponential nature. Therefore, the exponential regressionis applied to fit the data. The cumulative probability for this distribution is expressed by the following formula (λ denotes the mean):
For exponential distribution, both the standard deviation and the mean are of an equal value. The mean for non-HGV was determined as 1.13 MW and 3.86 for HGV. The gathered historical data suggest that disastrous tunnel fires are rather unlikely; however, the probability of their occurrence is still nonzero. The needed probability values can be easily calculated using the distribution parameters obtained here. This issue will be discussed in depth later in this section.
Three road tunnels in Poland were selected as subjects of the following analysis. The longest one is located in Gdańsk, in the north of Poland. It allows for easy travelling under the Martwa Wisła river, which crosses the city. The other two were built along the urban motorway that passes the central part of Upper Silesia region in southern Poland. They allow the motorway to pass under the city centers of Katowice and Gliwice. Table 5 contains the detailed description of these tunnels.

Table 5.
Description of the selected tunnel [38,39,40].
The basic average value of TFF of 8.0, which was determined earlier, has to be modified accounting for tunnel type. Since all considered tunnels were urban unidirectional ones, this value was corrected using data provided in Table 4:
The value for the relevant tunnel type = 9.0 and the average for France = 11.0 were taken into account here. In such a way, the value of TFFUU = 6.5 was obtained and then adopted for the further calculations.
First, the overall probabilities of any fire accidents were calculated for the selected tunnels. Despite slightly different generic structures of the traffic for these tunnels, the same average value of TFFUU was applied without regard to vehicle types. The probability distributions were calculated using Equation (1). The results for different time periods are shown in Figure 8. The np product was calculated using the following formula:

Figure 8.
Probability distributions of any fire accident for different time periods. (a) Katowice; (b) Gliwice; (c) Gdańsk.
In this formula, LT denotes a tunnel length, TI denotes an average hourly traffic intensity (as in Table 5), y denotes the length of the considered period (in years).
As can be seen for periods no longer than 10 years, no fire accident at all is the most probable situation. This is valid also for the tunnel in Gdańsk, which is the longest. If a 20 year period is considered, a single accident is most likely, except for the tunnel in Gliwice, which is the shortest. For longer periods, the probability of the occurrence of more fire accidents slowly increases.
Additionally, the expected values of the number of fire accidents for all cases were calculated. They are presented in Table 6.

Table 6.
Expected values of the number of fire accidents for different time periods.
It is clearly visible that a single fire accident of an undetermined fire power can be expected in the time horizon between 10 and 20 years. Accounting for probability distribution of fire power it will be a rather low power fire, but one should have in mind that even such an accident may pose a serious danger for people in a congested urban tunnel. This is mainly due to rapid movement of smoke.
It should be taken into account that, due to the development and modernization of cities, the number of tunnels in the world will gradually increase. Furthermore, over the course of several years, both the number of vehicles passing through a given tunnel and the generic structure of traffic may change. Such a situation is possible due to the development of urban areas (construction of new housing estates) or the development of industry (establishment of new factories) in the transport network in close proximity to the expressway. Another element affecting the safety of the tunnel may be a larger number of electric vehicles, whose characteristics and potential for fire vary greatly from vehicles with conventional drive.
Therefore, the conclusion that can be drawn is the need to implement periodic repetition of road traffic measurements in tunnels. The analysis presented in the article could then be part of an audit procedure repeated regularly every few years.
Next, an attempt was made to estimate the chances of disastrous fire accidents in the selected road tunnels. In light of the data review, it is possible only if a HGV is involved. If so, one must have in mind that the frequency of HGV fires is much greater, and the value of TFF must be determined separately for this vehicle class. Hence, this value (TFFUU,HGV) was adjusted using the data for Austria ( = 6.5, = 25.0, Table 3):
As a result, the value of TFFUU,HGV = 25.0 was obtained. Then, an assumption was adopted that only fire powers over 20 MW were considered (this meant the fire could be regarded as serious). The likelihood of such fire accidents was calculated using Equation (2), where the mean value (λ) of 3.96 MW (Figure 7) was inserted. Finally, the value of np product was determined using the following formula (xHGV denotes the share of HGV, according to Table 5):
The results are shown in Figure 9. The values for 0 (no accidents) are omitted due to higher readability.

Figure 9.
Probability distributions of a disastrous fire accident for different time periods. (a) Katowice; (b) Gliwice; (c) Gdańsk.
The probability value for a given tunnel is really low, even for extraordinary long periods. Realistically, at most, a single fire accident of very high power can be expected, even with a very long perspective. However, one should have in mind that, in general, such accidents should not happen at all. The highest probability values were determined for the Tunnel under Martwa Wisła river in Gdańsk, because this tunnel is the longest one and the share of HGV is the highest there. This tunnel is also inclined, which increases the risk, but available data do not allow for expressing this quantitatively. In the reasonable time horizon of 20 years, the probability of a disastrous fire accident for all considered tunnels fits the range 0.3–1.2%. The expected values of the number of disastrous fire accidents, which are shown in Table 7, supplement the above information.

Table 7.
Expected values of the number of disastrous fire accidents for different time periods.
The very low values of both the probability and the expected value suggest that a disastrous fire accident is rather unlikely for a given tunnel, and common tunnel users do not need to be afraid for their safety. However, the threat exists and authorities managing a large number of road tunnels must be aware of it, especially in long-term perspectives.
At the last stage of the study, a sensitivity analysis was carried out to check in what degree the results depended on the input data. The crucial variable, on which the research was based, was the tunnel fires frequency (TFF). Thus, having the value of its standard deviation, diagrams showing the impact of the TFF variation on the expected number of fire accidents were prepared (Figure 10).
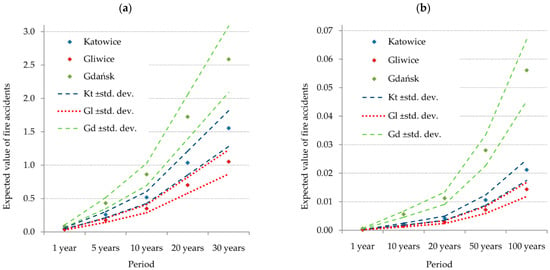
Figure 10.
Sensitivity analysis: (a) all fire accidents, (b) disastrous fire accidents.
As it can be seen, despite the values of the expected number of tunnel fires being affected to some degree, the results remain the same in general. The practical conclusions are also unchanged. Obviously, other data used in the presented work were burdened with uncertainties as well. Unfortunately, the sources did not provide any measure of possible data spread.
4. Conclusions
Some considerations on the frequency of tunnel fires and their causes based on the available literature data were presented in the paper. Since these data came from different sources and were prepared using different methodologies, efforts were made to make them uniform and to determine average values that were useful to develop predictions on the probability of fire accidents in the selected road tunnels. Every available premise was used to make the predictions more reliable. It required a reasonable merging of the information from different origins. Despite this, the results fit the reported ranges and are in accordance with qualitative and quantitative observations. In such a way, the presented approach makes it possible to obtain the quantitative predictions on the probability of fire accidents of different severities for a given road tunnel. This is a novel contribution to be applied for risk analysis, which is the basis when designing safety systems of a tunnel.
As was mentioned in the introduction section, there are no data from the considered tunnels. They are relatively new facilities, and no fire accidents have occurred so far. It is, in some way, a confirmation of the obtained results, because, according to them, no fire accident in the time period shorter than 10 years is the most likely case. As was shown, a single fire accident can be expected in a longer time horizon in every tunnel being considered. It would be expected to be a rather low power fire with non-disastrous consequences. This is because low power fires are much more likely than those of higher powers. In such circumstances, a tunnel safety system should cope with this threat. However, one cannot exclude a significantly worse scenario at all. A disastrous fire could happen as well but with much lower likelihood. This has been estimated at around 1% over a 20–30-year time horizon. Such disastrous accidents almost always happen as a consequence of the coincidence of many factors, and each of these factors are of low likelihood themselves. There is no clear way to protect against such factors because of their nature, which makes us unable to predict all possible coincidences.
However, since low power fire incidents seems to be unavoidable, first, they should be taken into account when designing tunnel safety systems and procedures. From the practical point of view, a risk analysis should lead to a reasonable trade-off between costs and expected consequences of a fire accident. Hence, it remains for us to keep high safety standards and strictly follow regulations. The safety standards and law regulations should be updated according to the development of science and technology and analyses of successive fire accidents. However, sometimes it can be too little—Switzerland’s Gotthard tunnel was considered the safest road tunnel in Europe and, additionally, just passed highly demanding audits, and yet in 2001, it fell prey to terrific disaster.
Moreover, in common life, disasters may seem simply impossible, so standards just cease to be kept strictly, and in such a way, the safety level imperceptibly lowers. This process, called entropy in the systems theory, can appear everywhere, and its intensity depends on local habits and practices. Authorities should be aware of it and constantly implement preventive actions.
In the introduction section, many possible premises that foster the occurrence of a fire accident were described. However, there are no data that, in a direct way, link them with the frequency of fire accidents in road tunnels. Therefore, the authors would like to deepen the presented issues in the future and will focus their efforts on an attempt to build a model that would allow for expressing numerically the probability of a fire accident in the given urban road tunnel accounting directly for its quantitative parameters and reports on vehicles conditions.
Author Contributions
Conceptualization, A.K., K.S., and M.K.; methodology, K.S., A.K., and M.K.; investigation, K.S., A.K., and M.K.; data curation, K.S., A.K., and M.K.; writing—original draft preparation, K.S. and A.K.; visualization, A.K. and K.S. All authors have read and agreed to the published version of the manuscript.
Funding
This research received no external funding.
Institutional Review Board Statement
Not applicable.
Informed Consent Statement
Not applicable.
Data Availability Statement
Not applicable.
Conflicts of Interest
The authors declare no conflict of interests.
References
- Knørrskov, M.; Olsen, T. Sustainable Urban Development Requires Traffic Solutions—Both Underground and Above Ground 2018. Available online: https://www.cowi.com/insights/tunnels-and-urban-development (accessed on 15 March 2021).
- General Director for National Roads and Motorways. Coraz Bliżej Zakończenia Budowy Południowej Obwodnicy Warszawy. Available online: https://www.gddkia.gov.pl/pl/a/41105/Coraz-blizej-zakonczenia-budowy-Poludniowej-Obwodnicy-Warszawy (accessed on 1 May 2021). (in Polish)
- Rostami, J.; Sepehrmanesh, M.; Gharahbagh, E.A.; Mojtabai, N. Planning level tunnel cost estimation based on statistical analysis of historical data. Tunn. Undergr. Space Technol. 2013, 33, 22–33. [Google Scholar] [CrossRef]
- Beard, A.; Carvel, R. The Handbook of Tunnel Fire Safety; Thomas Telford Ltd.: London, UK, 2005. [Google Scholar]
- Hua, N.; Tessari, A.; Khorasani, N.E. Characterizing damage to a concrete liner during a tunnel fire. Tunn. Undergr. Space Technol. 2021, 109. [Google Scholar] [CrossRef]
- Bwalya, A. An Overview of Design Fires for Building Compartments. Fire Technol. 2008, 44, 167–184. [Google Scholar] [CrossRef]
- PIARC, Technical Committee 3.3 Road Tunnel Operation. Design Fire Characteristics for Road Tunnels; World Road Association: Paris, France, 2017. [Google Scholar]
- Leitner, A. The fire catastrophe in the Tauern Tunnel: Experience and conclusions for the Austrian guidelines. Tunn. Undergr. Space Technol. 2001, 16, 217–223. [Google Scholar] [CrossRef]
- Yao, Y. Fire Behaviors and smoke transportation law of tunnel fires under confined portal boundaries. In RISE Rapport; RISE Research Institutes of Sweden: Gothenburg, Sweden, 2019; Volume 58. [Google Scholar] [CrossRef]
- Road Traffic and Road Signs and Signals Agreements and Conventions. Available online: https://unece.org/road-traffic-and-road-signs-and-signals-agreements-and-conventions (accessed on 15 March 2021).
- Inland Transport Commitee, Economic Commission for Europe. European Agreement Concerning the International Carriage of Dangerous Goods by Road (ADR); United Nations: New York, NY, USA, 2018. [Google Scholar]
- Directive 2004/54/EC of the European Parliament and of the Council of 29 April 2004 on minimum safety requirements for tunnels in the Trans-European Road Network. Off. J. Eur. Union 2004, 51, L319.
- About the ADR. Available online: https://unece.org/about-adr (accessed on 15 March 2021).
- Hirschler, M. Improving the Fire Safety of Road Vehicles. In Advances in Fire Retardant Materials; Horrocks, A.R., Price, D., Eds.; Woodhead Publishing: Cambridge, UK, 2008; pp. 443–446. [Google Scholar] [CrossRef]
- Plastics Use in Vehicles to Grow 75% by 2020, Says Industry Watcher. Available online: https://www.plasticstoday.com/automotive-and-mobility/plastics-use-vehicles-grow-75-2020-says-industry-watcher (accessed on 18 March 2021).
- Directive 2006/40/EC of the European Parliament and of the Council of 17 May 2006 relating to emissions from air-conditioning systems in motor vehicles and amending Council Directive 70/156/EEC. Off. J. Eur. Union 2006, 12, L161.
- European Comission, Directorate-Generaljoint Research Centre, Directorate F—Institute for Energy and Transport, Sustainable Transport. JRC Technical and Scientific Support to the Research on Safety Aspects of the Use of Refrigerant R1234yf on MAC Systems; European Commission: Ispra, Italy, 2014. [Google Scholar]
- Supreme Audit Office in Poland. Bezpieczeństwo Ruchu Drogowego, Informacja o Wynikach Kontroli; Najwyższa Izba Kontroli: Warsaw, Poland, 2014. (In Polish) [Google Scholar]
- Transport—Activity Results in 2019. Statistics Poland. Available online: https://stat.gov.pl/en/topics/transport-and-communications/transport/ (accessed on 20 March 2021).
- ACEA Report. Vehicles in Use Europe; European Automobile Manufacturers Association: Brussels, Belgium, 2021.
- Ren, R.; Zhou, H.; Hu, Z.; He, S.; Wang, X. Statistical analysis of fire accidents in Chinese highway tunnels 2000–2016. Tunn. Undergr. Space Technol. 2019, 83. [Google Scholar] [CrossRef]
- Casey, N. Fire incident data for Australian road tunnels. Fire Saf. J. 2020, 111. [Google Scholar] [CrossRef]
- Balotin, J.; Neis, P.; Ferreira, N. Analysis of the influence of temperature on the friction coefficient of friction materials. In ABCM Symposium Series in Mechatronics; De Negri, V., Perondi, E., Barbosa Cunha, M., Horikawa, O., Eds.; ABCM: Rio De Janeiro, Brasil, 2010; Volume 4, pp. 898–906. [Google Scholar]
- Barabas, I.; Todoruț, A.; Nicolae, C. Estimation of Boiling Points of Brake Fluids. In CONAT 2016 International Congress of Automotive and Transport Engineering; Chiru, A., Ispas, N., Eds.; Springer: Cham, Switzerland, 2017; pp. 209–216. [Google Scholar] [CrossRef]
- Hart, P. Why Heavy Vehicles Catch Fire; Hartwood Consulting Pty Ltd.: Melbourne, Australia, 2016. [Google Scholar]
- Salehnejad, M.A.; Mohammadi, A.; Rezaeia, M.; Ahangaric, H. Cracking failure analysis of an engine exhaust manifold at high temperatures based on critical fracture toughness and FE simulation approach. In Engineering Fracture Mechanics; Feng, X.Q., Kuna, M., Sutton, M., Eds.; Elsevier: Amsterdam, The Netherlands, 2019; Volume 211, pp. 125–136. [Google Scholar] [CrossRef]
- Army Tank-Automotive Command; Wilburn, D. A Temperature Study of Pneumatic Tires during Highway Operation; U. S. Department of Commerce, National Technical Information Service: Springfield, VA, USA, 1972.
- FM Global Property Loss Prevention Data Sheets. In Rubber Tire Storage; Factory Mutual Insurance Company: Johnston, RI, USA, 2009.
- Wiederhold, B.; Bouchard, S. Claustrophobia: Efficacy and Treatment Protocols. In Advances in Virtual Reality and Anxiety Disorders; Series in Anxiety and Related Disorders; Springer: New York, NY, USA, 2014; pp. 145–162. [Google Scholar] [CrossRef]
- Tunelowe Ryzyko (Tunnels Risks). Available online: https://www.ppoz.pl/index.php/rozpoznawanie-zagrozen/1445-tunelowe-ryzyko (accessed on 20 February 2021). (In Polish).
- Biuro Ruchu Drogowego, Komenda Główna Policji. Wypadki Drogowe w Polsce w 2020 Roku; Wydział Opiniodawczo-Analityczny Biura Ruchu Drogowego Komendy Głównej Policji: Warsaw, Poland, 2021. (In Polish) [Google Scholar]
- Rattei, G.; Lentz, A.; Kohl, B. How frequent are fires in tunnels—Analysis from Austrian tunnel incident statistics. In Proceedings of the 7th International Conference Tunnel Safety and Ventilation, Graz, Austria, 12–13 May 2014. [Google Scholar]
- Willman, C.; Defert, R. Statistical Analyses of Breakdowns, Accidents and Fires in Road Tunnels in France. In Proceedings of the 7th International Symposium on Tunnel Safety and Security, Montreal, Canada, 16–18 March 2016; pp. 407–418. [Google Scholar]
- Nævestad, T.; Meyer, S.F. Vehicle Fires in Norwegian Road Tunnels 2008–2011; Report no 1205/2012; The Norwegian Public Roads Administration: Oslo, Norway, 2012. [Google Scholar]
- PIARC. Experience with Significant Incidents in Road Tunnels; Kohl, B., Ed.; World Road Association: Paris, France, 2016. [Google Scholar]
- Król, A.; Król, M. Numerical investigation on fire accident and evacuation in a urban tunnel for different traffic conditions. Tunn. Undergr. Space Technol. 2021, 109, 103751. [Google Scholar] [CrossRef]
- Sýkora, J.; Jaruskova, D.; Sejnoha, M.; Sejnoha, J. Fire risk analysis focused on damage of the tunnel lining. Fire Saf. J. 2018, 95, 51–65. [Google Scholar] [CrossRef]
- Ochmański, M.; Salamak, M.; Waniek, G. Konstrukcja i technologia wykonania tunelu DTŚ w Gliwicach. In Mosty; Elamed Media Group: Katowice, Poland, 2017; Volume 1, pp. 64–69. (In Polish) [Google Scholar]
- Ile Samochodów Przejeżdża Codziennie Tunelem DTŚ w Gliwicach? (How Many Vehicles Do Pass Daily the Tunnel in Gli-wice?). Available online: https://infogliwice.pl/ile-samochodow-przejezdza-codziennie-tunelem-dts-w-gliwicach (accessed on 20 March 2021). (In Polish).
- Król, A.; Król, M. Estimation of the Number of Threatened People in a Case of Fire in Road Tunnels. In Directions of Development of Transport Networks and Traffic Engineering; Macioszek, E., Sierpiński, G., Eds.; Springer: Cham, Switzerland, 2019; pp. 27–40. [Google Scholar] [CrossRef]
Publisher’s Note: MDPI stays neutral with regard to jurisdictional claims in published maps and institutional affiliations. |
© 2021 by the authors. Licensee MDPI, Basel, Switzerland. This article is an open access article distributed under the terms and conditions of the Creative Commons Attribution (CC BY) license (https://creativecommons.org/licenses/by/4.0/).