Article

An Innovative Approach to Assess the Ecotoxicological Risks of Soil Exposed to Solid Waste

by
Despina-Maria Bordean
1,†,
Luminita Pirvulescu
2,*,
Mariana-Atena Poiana
1,†,
Ersilia Alexa
1,†,
Antoanela Cozma
3,
Diana Nicoleta Raba
2,
Aurica Breica Borozan
4,
Corina Dana Misca
1,
Adriana Morar
5,
Diana Obistioiu
5 and
Ioan Ladislau Caba
6,7
1
Faculty of Food Engineering, Banat’s University of Agricultural Sciences and Veterinary Medicine “King Michael I of Romania” from Timisoara, Calea Aradului No. 119, 300645 Timisoara, Romania
2
Faculty of Management and Rural Tourism, Banat’s University of Agricultural Sciences and Veterinary Medicine “King Michael I of Romania” from Timisoara, Calea Aradului No. 119, 300645 Timisoara, Romania
3
Faculty of Agriculture, Banat’s University of Agricultural Sciences and Veterinary Medicine “King Michael I of Romania” from Timisoara, Calea Aradului No. 119, 300645 Timisoara, Romania
4
Faculty of Horticulture and Forestry, Banat’s University of Agricultural Sciences and Veterinary Medicine “King Michael I of Romania” from Timisoara, Calea Aradului No. 119, 300645 Timisoara, Romania
5
Faculty of Veterinary Medicine, Banat’s University of Agricultural Sciences and Veterinary Medicine “King Michael I of Romania” from Timisoara, Calea Aradului No. 119, 300645 Timisoara, Romania
6
Branch of Agricultural Mechanical Engineers in Romania—BAMER Timisoara, 1989 Revolution Avenue 15A, 300034 Timisoara, Romania
7
The National Institute of Research-Development for Machines and Installations Designed to Agriculture and Food Industry—INMA Bucharest, 6 Ion Ionescu de la Brad Street, 013813 Bucharest, Romania
*
Author to whom correspondence should be addressed.
These authors contributed equally to this work.
Sustainability 2021, 13(11), 6141; https://doi.org/10.3390/su13116141
Submission received: 6 April 2021 / Revised: 20 May 2021 / Accepted: 22 May 2021 / Published: 29 May 2021
(This article belongs to the Special Issue Resources Policy and Sustainable Development)

Abstract

:
The adoption of sustainable waste management strategies is a challenge faced by most European countries, mainly due to the need to generate less waste and replace landfills with new methods of waste treatment, associated with increases in the separate collection of waste and recycling rates. This paper highlights the significance of environmental legislation regarding waste removal to protect ecosystems. The aim was to predict ecological responses to heavy metals in soil exposed to hazardous waste and to identify environmental hazards in landfills, small illegal waste dumps, and litter, in addition to identifying if heavy metal accumulation in the investigated soil samples showed a single or cumulative risk. This is an innovative method to predict the ecological risk generated by hazardous waste landfills. The assessment of ecological risks was based on the evaluation of a heavy metal soil contamination factor, pollution index of soil loadings, a geo-accumulation index for heavy metals, and potential ecological risk. The current study is also the first to attempt to identify the dimension of risk based on the type of waste deposit (landfill, small illegal waste dump, and litter) and to identify potential patterns. The geological index corresponding to cadmium Igeo(Cd) showed heavy contamination in the soil samples from the landfill and moderate contamination for those from the illegal waste dumps. These findings indicate that soil contamination is influenced by contamination time, anthropogenic processes, and a history of industrial activity, and not only by waste composition and storage. The present study shows that cadmium might be considered a latent fingerprint for waste disposal, which is correlated to the industrialization level and rehabilitation procedures.

Graphical Abstract

1. Introduction

In accordance with Directive 75/442 C.E. (15 July 1975) [1], any substance or object for which there is an intention or obligation to be discarded is considered waste. In the last stage of decomposition, this “product” remains the final waste. Waste that can no longer be further processed under current technical and economic conditions, including that resulting from treatment methods, particularly by extracting useful parts or by reducing harmful characteristics, is considered the final waste [2].
Regarding the collection of waste from cities, for aesthetic reasons and as a task for public bodies, recognition of the influence of harmful substances on living organisms and adoption of improved analysis techniques emerged in the early 1980s. Urban waste has begun to be considered as an indefinite mixture of substances, more or less chemically harmful, but which, through internal chemical and biological reactions, can lead to other, more harmful substances. In formal considerations, landfills have come to be called “reactor landfills”, and scientists have begun to pay attention to the reactive potential of waste and its harmful emissions [3].
It is now well known that the spread of epidemics can be accelerated due to contact with waste from private households or, for example, medical treatment sites. As a result, social security solutions are being sought. Currently, EU legislation aims to establish a legal framework for waste storage, both for the construction, operation, monitoring, closure, and post-closure of new landfills, and for the operation, closure, and post-closure of existing landfills, under conditions of environment protection and public health. The regulation of this activity aims to prevent or reduce negative effects on the environment. These effects include the pollution of surface water, groundwater, soil, and air, including the greenhouse effect, in addition to any risk to public health, throughout the operation of the landfill, even after its expiration.
Issues related to the presence of toxic substances in the environment are an area of interest in global policies, and constitute a special chapter of the European Union’s policies to ensure human health and maintain an unaltered ecological environment. Due to the negative effects of uncontrolled waste disposal, current legislative trends are oriented towards the prohibition of landfilling in the form of unprocessed waste, regardless of the origin and type of landfill.
In economically developed countries, legislative and administrative measures have been taken to reduce environmental pollution and prevent the negative effects of environmental exposure to pollutants. Thus, to limit undesirable effects on the environment and the health of the population, in addition to encouraging the sustainable use of natural resources, preventing and mitigating waste production is regulated by European Union standards and established in national waste management strategies [2,4,5].
Waste disposal sites and heavy metals pose a serious risk to the nearest ecosystems. Throughout history, people have disposed of unwanted materials on streets, roadsides, small local dumps, or regularly in isolated locations. Many countries have laws that require that industrial and household hazardous waste be deposited in special locations rather than be sent to landfills. Illegal waste disposal and littering in urban or rural areas, close to roads, and at locations that are easy to reach but difficult to monitor, are some of the problems affecting ecosystems in many countries. According to a study by the Dutch organization VROM, 80% of people claim that “everybody leaves behind a piece of paper, tin or something, on the street” [6].
All hazardous waste (waste that has substantial or potential threats to public health or the environment) and non-hazardous waste must be disposed of properly [7].
Waste is considered hazardous if it shows evidence of any one of these four characteristics: toxicity, ignitability, corrosivity, or reactivity. Among wastes, heavy metals are considered to be the most hazardous due to their toxicity [8].
In the European Union and the US, landfilling or burial are the main forms of waste disposal (70% in Europe, 60% in the US, and 38% in Japan). However, trends are focused on promotion of recovery-recycling, physico-chemical treatment, composting, and incineration of waste. These measures are intended both for the protection of environmental factors, and as a rational and efficient economic exploitation of this activity [9].
According to the Waste Framework Directive (2008/98/EC) [10], a common EU target regarding the management of waste deposition seeks: (i) to reduce landfill to a maximum of 10% of municipal waste by 2030; (ii) recycling of 65% of municipal waste by 2030; and (iii) recycling of 75% of packaging waste by 2030.
A target quality landfill based on recycling–composting methods involves advanced waste sorting and recovery methods in several categories, according to the diagram presented in Figure 1. This model is currently implemented in the waste management strategy in western Romania [11].
To minimize the negative effects of waste, a complex and unitary approach at the European level is required in terms of waste management, which should take into account the optimal processing method in relation to costs.
Waste management involves varying costs depending on the applied technology. Biodegradable waste (in addition to other types of waste) is collected from both urban and rural areas in a “residual waste” bin, and will be used either for storage or composting, or Mechanical Biological Treatment (MBT).
The composting methods used for green waste are semi-open composting, and closed and anaerobic composting. Semi-open composting, which applies only to green waste (gardens, parks, and markets), is based on the natural fermentation of vegetable waste. The costs of these methods are estimated to be 2–5 EUR/t. Closed composting stations eliminate biogas during the fermentation process, especially during the intensive composting phase (in the first 4 weeks), and is applicable for solid biodegradable waste (green, household, market, and canteen waste). The costs are estimated to be 40–60 EUR/t. Anaerobic fermentation is the biological treatment process that can be used to recover both composted waste and the energy found in biodegradable waste. This process generates biogas with a high methane content (between 55–70%), a liquid fraction with a high fertilizer content, and a fibrous fraction. The technology is applicable for solid and liquid biodegradable waste (household, market, and canteen waste), but not green waste, and is estimated to cost 70–100 EUR/t [11].
Residual waste must be treated intensively through specific procedures that involve different costs depending on the applied method. The most commonly used method to treat the waste is MBT. This method is composed of different stages of mechanical and biological treatment, and can be modified and combined according to the national and local regulations. In general, there are four different types of MBT, each with or without manual sorting for recyclable materials: (i) MBT before storage (low operating costs); (ii) MBT with the separation of residual waste in the recovery of materials with high calorific value (refuse-derived fuel, RDF) and treating the biodegradable fraction before being deposited (average costs compared to other MBT methods); (iii) recovery of materials with high calorific value, with the separation of metallic waste from inert waste to be stored (involves high cost compared to other MBT methods); and (iv) pre-treatment before incineration (very high costs).
For the biological treatment component of a MBT station, treatment processes used can be both aerobic and anaerobic, to avoid the requirement of storage of the biodegradable fraction of the municipal waste. For economic reasons related to operating costs and investment, most stations are built as composting stations. However, from an environmental perspective, anaerobic fermentation should be used because it uses the energy content of biodegradable waste [11].
Heavy metals (HMs) or their compounds are also included in the category of pollutants/contaminants when they exceed limits for which concentrations are considered to be toxic to the consumer.
The European Union has attempted to develop strategies to minimize the effects of heavy metals in waste and to reduce the content of heavy metals in products, with the aim to reduce the environmental and human exposure to these elements [12].
According to the Environmental Protection Agency (EPA), Table 1 includes the metal type and the allowable limit in hazardous waste.
The effects of soil contamination with HMs are diverse. Once contaminated, soil functions may be impaired, and food quality, human health, and the ecology may suffer multiple impacts. A modern and rapidly developing approach to deal with metal-contaminated sites is to identify the risk and prevent the spread of pollution.
The United States Environmental Protection Agency (USEPA) defined the ecological risk assessment (1998) as a process that determines the likelihood of certain adverse ecological effects [13].
When assessing the risks, it is important to understand that metals are neither created nor destroyed by biological or chemical processes, and they are only transformed from one chemical form to another. As HMs are naturally occurring in the environment, being present in an ample mixture of physical and chemical forms that can coexist in a certain media, many organisms have evolved mechanisms to cope with the accumulation of heavy metals [12].
Ecological risk assessment “evaluates the likelihood that adverse ecological effects may occur or are occurring as a result of exposure to one or more stressors. It provides a significant element for environmental decision making by giving risk managers an approach for considering available scientific information along with the other factors they need to consider (e.g., social, legal, political, or economic) in selecting a course of action” [14].
In formulating the problem, any assessment may start with a study of endpoints, stressors, and ecological effects. The problem presentation is usually interactive: In the analysis phase, it is necessary to describe exposure results and the complex interaction, in this case, that of waste–soil–plants (environment)–humans. Most of the models present the analysis and risk characterization as separate phases. However, some models merge “the analysis of exposure and effects data with the integration of the data, that occurs in risk characterization” [14].
Regardless of the rapidly growing quantity of information, numerous unresolved questions and challenging issues remain [13].
The objective of the present study is to provide the information necessary for determining or predicting ecological responses to heavy metals in soil exposed to hazardous waste and to offer answers regarding two main questions: (Q1) “What is the environmental hazard of concern in the case of landfills, small illegal waste dumps, and litter?”; and (Q2) “Do heavy metals show a single or multiple/cumulative risk?” These questions were examined using a study of soil samples collected from different areas in the western part of Romania.
The novelty of this study is the possibility of forecasting the environmental hazard generated by waste disposal sites as a result of soil contamination with heavy metals based on soil pollution indices. These data can be used as working tools in developing local, national, or European strategies to reduce the human exposure to these elements. To our knowledge, this is the first study that considers the soil contamination factor (CF), the pollution index of soil loadings (PIL), and the geo-accumulation index (Igeo), based on metal content and waste dumps in western Romania, to predict the risk of contamination with heavy metals. In addition, it is the first study that attempts to identify the dimension of risk based on the type of waste deposit (landfill, small illegal waste dump, and litter) and to identify the potential patterns.

2. Materials and Methods

The current study was divided into two sections. The first (A-Study) was based on information provided by multiple research papers regarding heavy metal contamination of soil due to waste dumps and/or waste landfills. The second (B-Study) was based on heavy metal (HM) analysis of multiple soil samples collected from 11 locations in western Romania.

2.1. A-Study

Development of the A–Study comprised analysis of over 100 scientific papers and online resources in the field of HMs, soil chemistry, and environmental contamination due to waste dumps and landfills. The aim was to create a complex database for assessment of ecological risks of HMs and to identify the potential patterns.

2.2. B-Study

This study assessed the ecological risks of HMs by collecting and analyzing soil samples from different areas close to main roads, illegal waste dumps, or litter, in addition to the closed Sag-Parta landfill (Timis County Romania). The Sag-Parta landfill ceased its activities on 31 December 2008. The closure route consists of the formation of a supporting layer with a thickness of 50–100 cm created from minerals and similar waste, such as building and demolition waste, inert waste from street cleaning, sand, and dehydrated sludge, with a granule size smaller than 10 cm. According to the landfill operator (Retim Ecologic Service SA Timisoara), to be used in the supporting layer, approximately 196,000 t of inert waste was transported to the Sag-Parta landfill between 1 January 2009 and 31 October 2012 [15].

2.2.1. Data about Soil Collection Areas

Soil samples were collected from areas considered to have maximum impact on the environment at different times. A total of 16 samples distributed around the old waste deposit were collected from the landfill.
Data regarding soil collection areas and soil samples (i.e., GPS coordinates, soil sample code, year of sampling, and area description) are shown in Table 2.
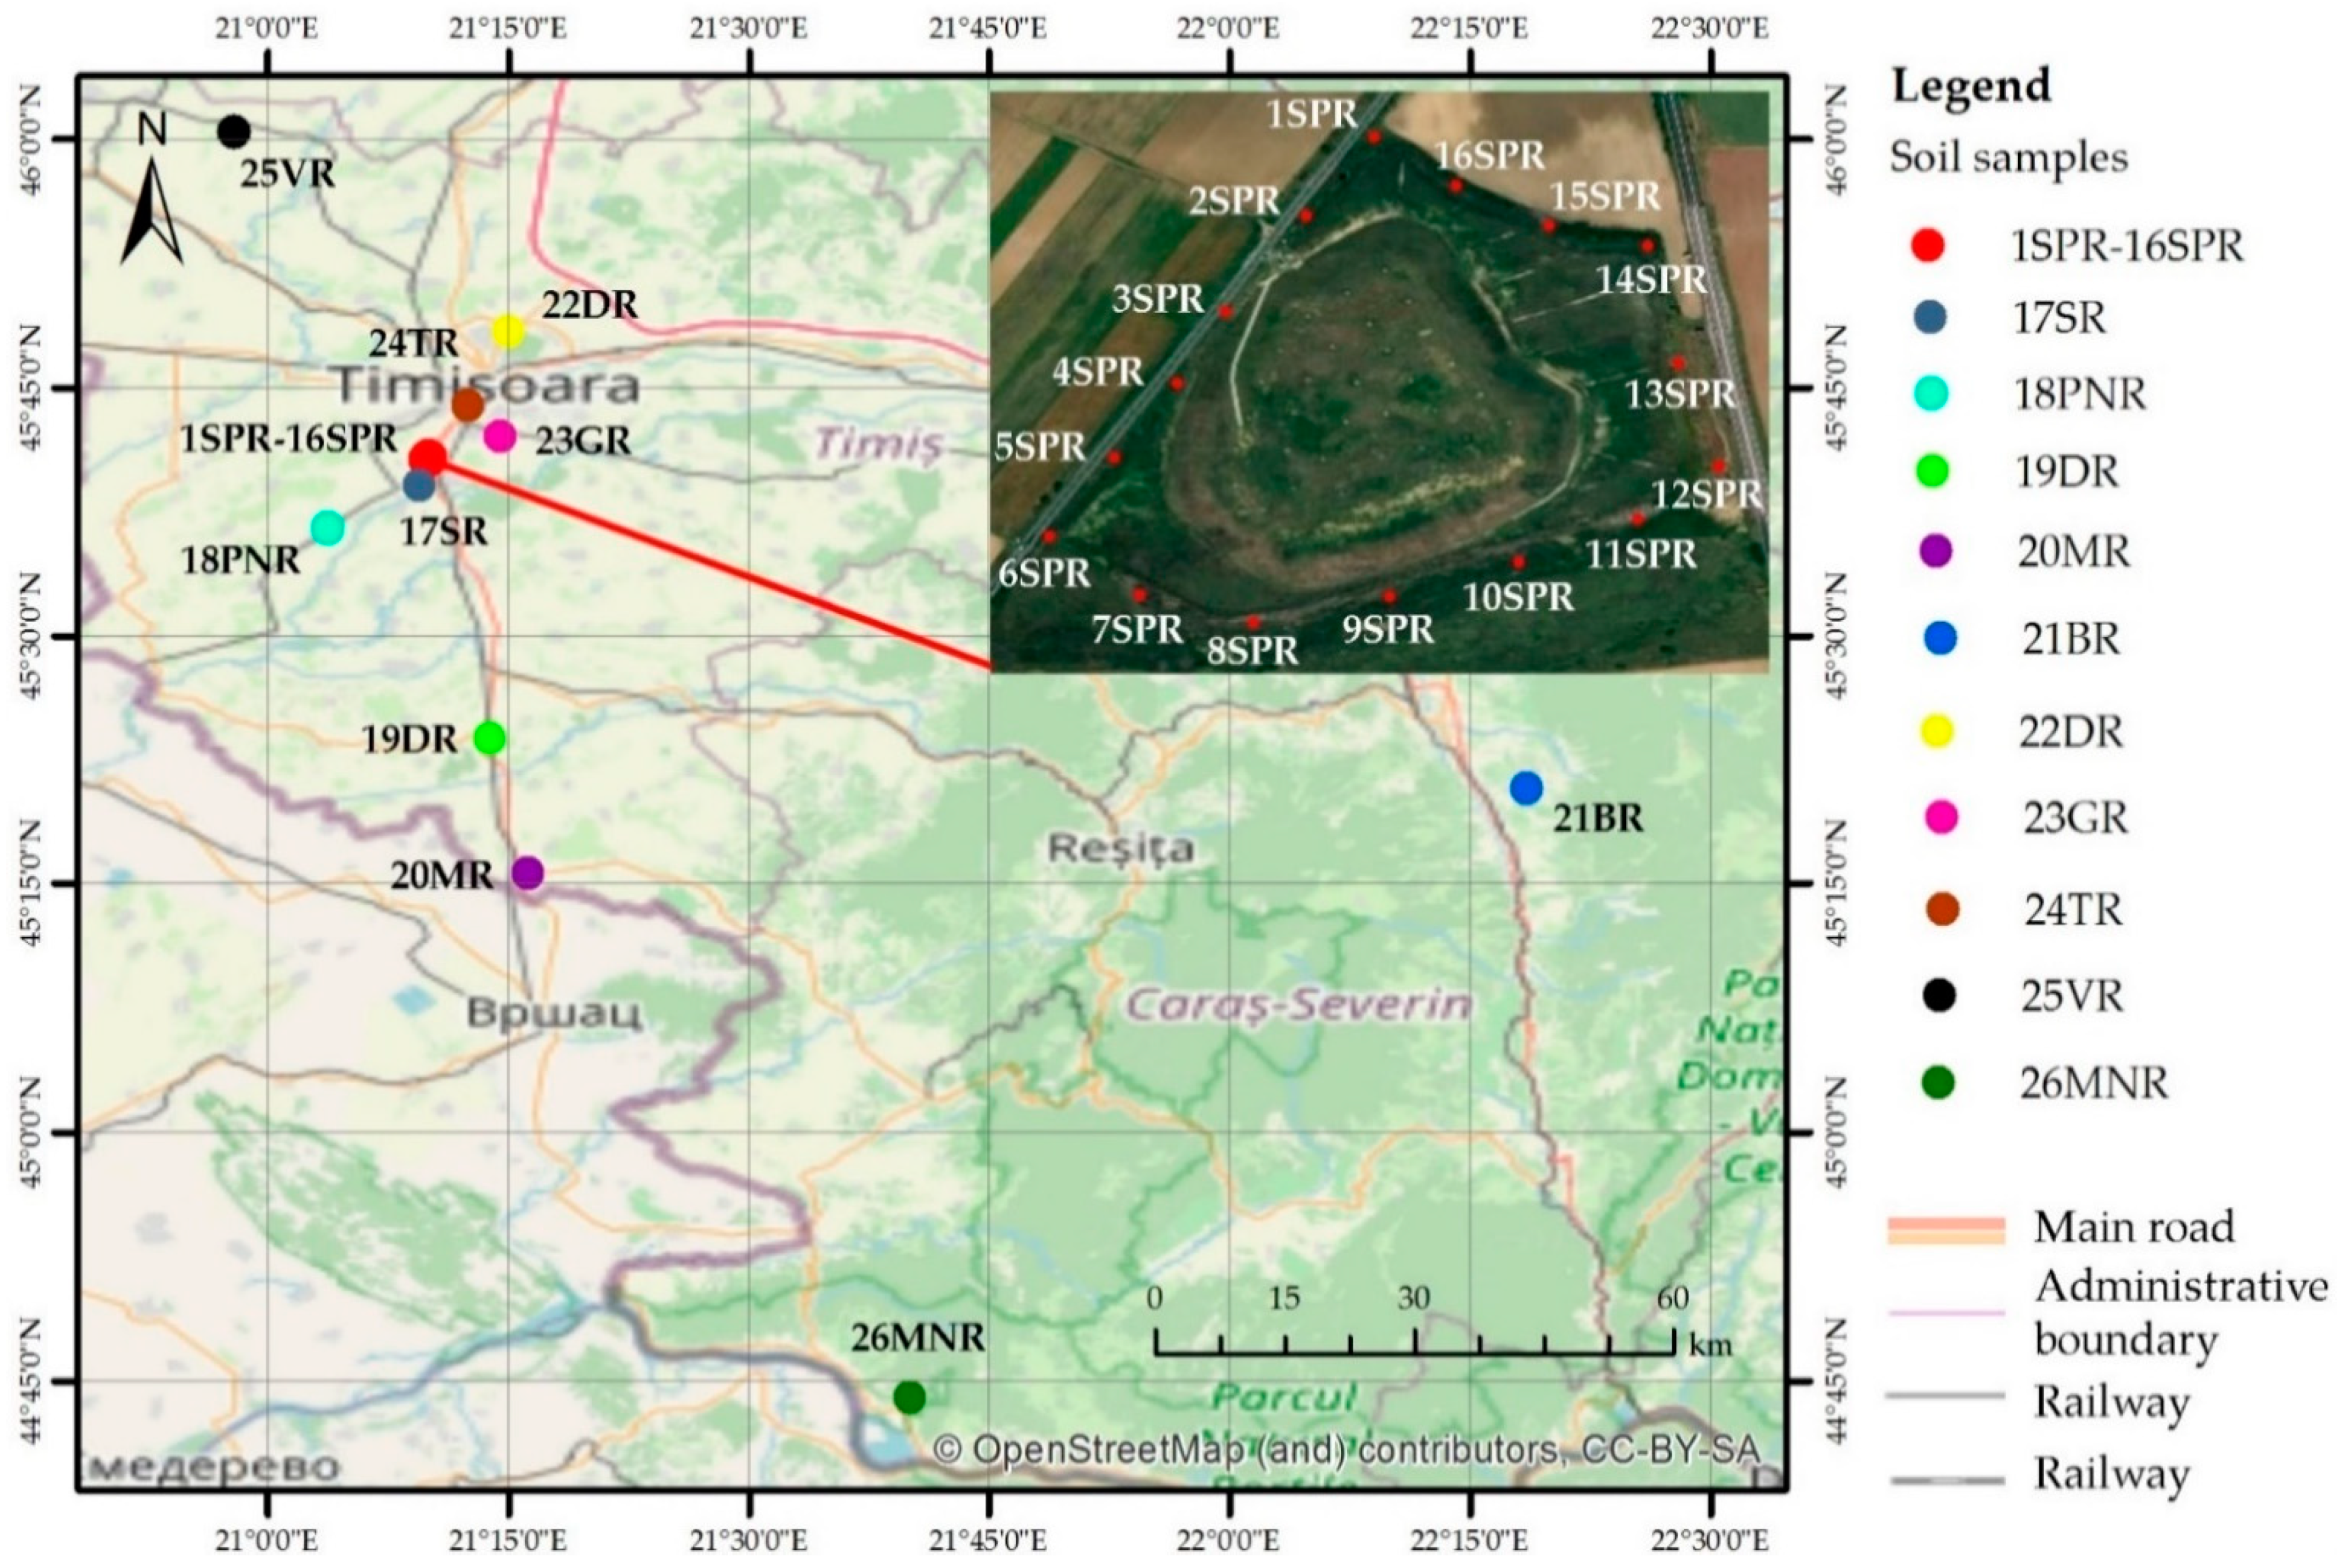
A map of the study sites is shown in Figure 2.

2.2.2. Sampling and Soil Samples Preparation

For each location, the soil samples were collected (50 g/sample in triplicate) from topsoil at depths of 0–20 cm using a soil auger. From each site, five soil samples were randomly collected and pooled to obtain a composite sample. The fresh soil samples were hand-sorted to remove grass, roots, and litter, and then dried at room temperature (T = 20 °C) for 7 d. Finally, the samples were ground with a porcelain mortar and pestle and homogenized, before being sieved to 2 mm (soil metal concentration analysis) with a non-metallic sieve to avoid contamination. The samples were then stored in clean polythene bags at ambient temperature (T = 20 °C) for further analysis.
The glassware and polyethylene containers for analysis were washed with tap water, then soaked overnight in 5% (v/v) HNO3 solution and rinsed several times with double distilled water.
For soil analysis, about 5 g of air-dried, ground, and sieved soil per sample was weighed into a Teflon container. Metals were passed from soil to solution using the wet extraction method; therefore, each sample was treated for 24 h with nitric acid (HNO3 0.5 N) at 1:10 soil/nitric acid solution ratio. Each sample was digested in triplicate. Then, the samples were centrifuged at 1500 rpm for 15 min., and for each sample, 20 mL of supernatant was transferred in a sterile polyethylene tube (Thermo Scientific Nunc, 30 × 115 mm, 50 mL) using a calibrated pipette of 25 mL. Finally, each sample volume was increased to 50 mL with HNO3 0.5 N, and labeled and retained for metal analysis.

2.2.3. Elemental Analysis

The elemental analysis of the soil samples was performed by flame atomic absorption spectrophotometry with a high-resolution continuum source (Model ContrAA 300, Analytik Jena, Germany) following the methodology described by Nica et al. [20]. The analysis was carried out in accordance with the equipment’s procedure while calibration was performed using a mix standard solution (1000 mg/L) of Cu, Zn, Cd, Ni, Cr, and Pb—ICP Multielement Standard solution IV CertiPUR, purchased from Merck (Merck KGaA, Darmstadt, Germany). Solutions of different concentrations were prepared for all metals by diluting appropriate volumes of standard solutions.
For the preparation of reagents and standards, spectroscopic pure water was used. All chemicals were trace metal grade (Suprapur). For quality control purposes, all blanks and duplicate samples were analyzed during the procedure. Blank samples were analyzed after seven samples. All analyses were replicated three times. NCS Certified Reference Material-DC 85104a and 85105a (China National Analysis Center for Iron & Steel) was analyzed for quality assurance.

2.2.4. Ecological Risk Assessment

The assessment of ecological risks of HMs in the investigated soil samples was performed using the following indices: soil contamination factor (CF), pollution index of soil loadings (PIL), geo-accumulation index for heavy metals (Igeo), the potential ecological risk index of a single HM ( E r i ), and the potential ecological risk (RI).

Soil Contamination Factor (CF)

The level of contamination of soil by metal was expressed in terms of a contamination factor (CF), calculated according to the relationship displayed in Equation (1):
C F i = C 0 1 i C n i
where: C 0 1 i represents the mean content of metals from at least five sampling sites and C n i is the concentration of the individual metal before depositing waste or pre-industrialization, based on the formula [21].
As reference values for the pre-industrial metal concentrations, the concentrations of elements in the upper Earth crust were used, as shown in Table 3 [22].
The classification of contamination level based on CF value was performed according to the data presented in Table 4 [23].

Pollution Index of Soil Loadings (PIL)

For further assessment of the contamination levels of the metals in the studied regions, the pollution index of soil loadings (PIL) developed by Tomlinson et al. [24] was calculated, as presented in Equation (2):
P I L = ( C F 1 C F 2 C F n ) 1 / n
where n is the number of studied metals (six in this study) and CF is the contamination factor calculated as described in Equation (1).
The PIL value provides a comparative means for assessing a site’s quality, where a value of PIL < 1 indicates no contamination with the studied metals; when PIL = 1, the baseline levels of pollutants are present; whereas a value of PIL > 1 indicates that, on average, the element concentrations are above the permissible levels, and a deterioration of the site quality is registered, as shown in Table 5 [24,25].
The geo-accumulation index (Igeo) of a sample site was calculated according to the relation shown in the Equation (3) [20,21,26,27]:
I geo = l o g 2 c n i k c r e f i = l o g 2 c n i 1.5 c r e f i
where: Igeo represents the geo-accumulation index of a sample site; c n i represents the measured concentration of heavy metal i in the soil, expressed in mg/kg; c r e f i is the background value of heavy metal i, expressed in mg/kg; and the constant k, having the value of 1.5, is a correction coefficient that determines the influence of natural fluctuations and the influence of anthropic sources.
In this study, the concentrations of elements in the Earth’s crust were used as the soil background values of HMs (i.e., reference values for the pre-industrial concentration) [22].
The classifications of contamination level based on Igeo are presented in Table 6.
The potential ecological risk index ( E r i ) of a single HMi at sample site r was calculated according to Equation (4) [28]:
E r i = T r i C r i
where: T r i represents the toxic response factor of a substance given by Hakanson [23], and C r i is the concentration of the metal i in the sample from the site r, calculated as displayed in Equation (5):
C F r i = C n i C r e f i
where C r e f i represents the background value of the HM (normal value for the specific country/Earth’s crust) and C n i is the metal content in the soil.
Hakanson’s toxic response factor of a specific HM is given in Table 7 [23].

Potential Ecological Risk Assessment (RI)

To evaluate the level of ecological risks, the potential ecological risk index (RI) was used, in accordance with the distinctiveness of the HMs and their ecological behavior [29].
The RI is associated with the individual pollution coefficient, the response coefficient of HM (heavy metal) toxicity, and the response of the environment. The value of RI was calculated according to the relationship presented in Equation (6):
RI = i = 1 n E r i
where: E r i represents the monomial potential ecological risk factor (the potential ecological risk index of a single HM).
The classification conditions of potential ecological risks are shown in Table 8 [30].

2.2.5. Mathematical Analysis and Modelling

The experimental data obtained regarding HMs and ecological indices were processed mathematically and statistically with Excel 2007, MVSP Version 3.22 for principal component analysis (PCA) and cluster analysis (CA), and Statistica 13.5.0.17 Tibco Software Inc. for descriptive statistics. All marked correlations were considered significant at p < 0.05.
For data modeling, PCA was selected due to its ability to reduce the number of variables of a data set while maintaining all possible information; CA was selected to identify clusters. For PCA, all data before analysis were transposed, square—root transformed, and standardized. PCA graphics were illustrated using Euclidean biplot representation to overlay the score plot and loadings plot in a single graph.

3. Results and Discussion

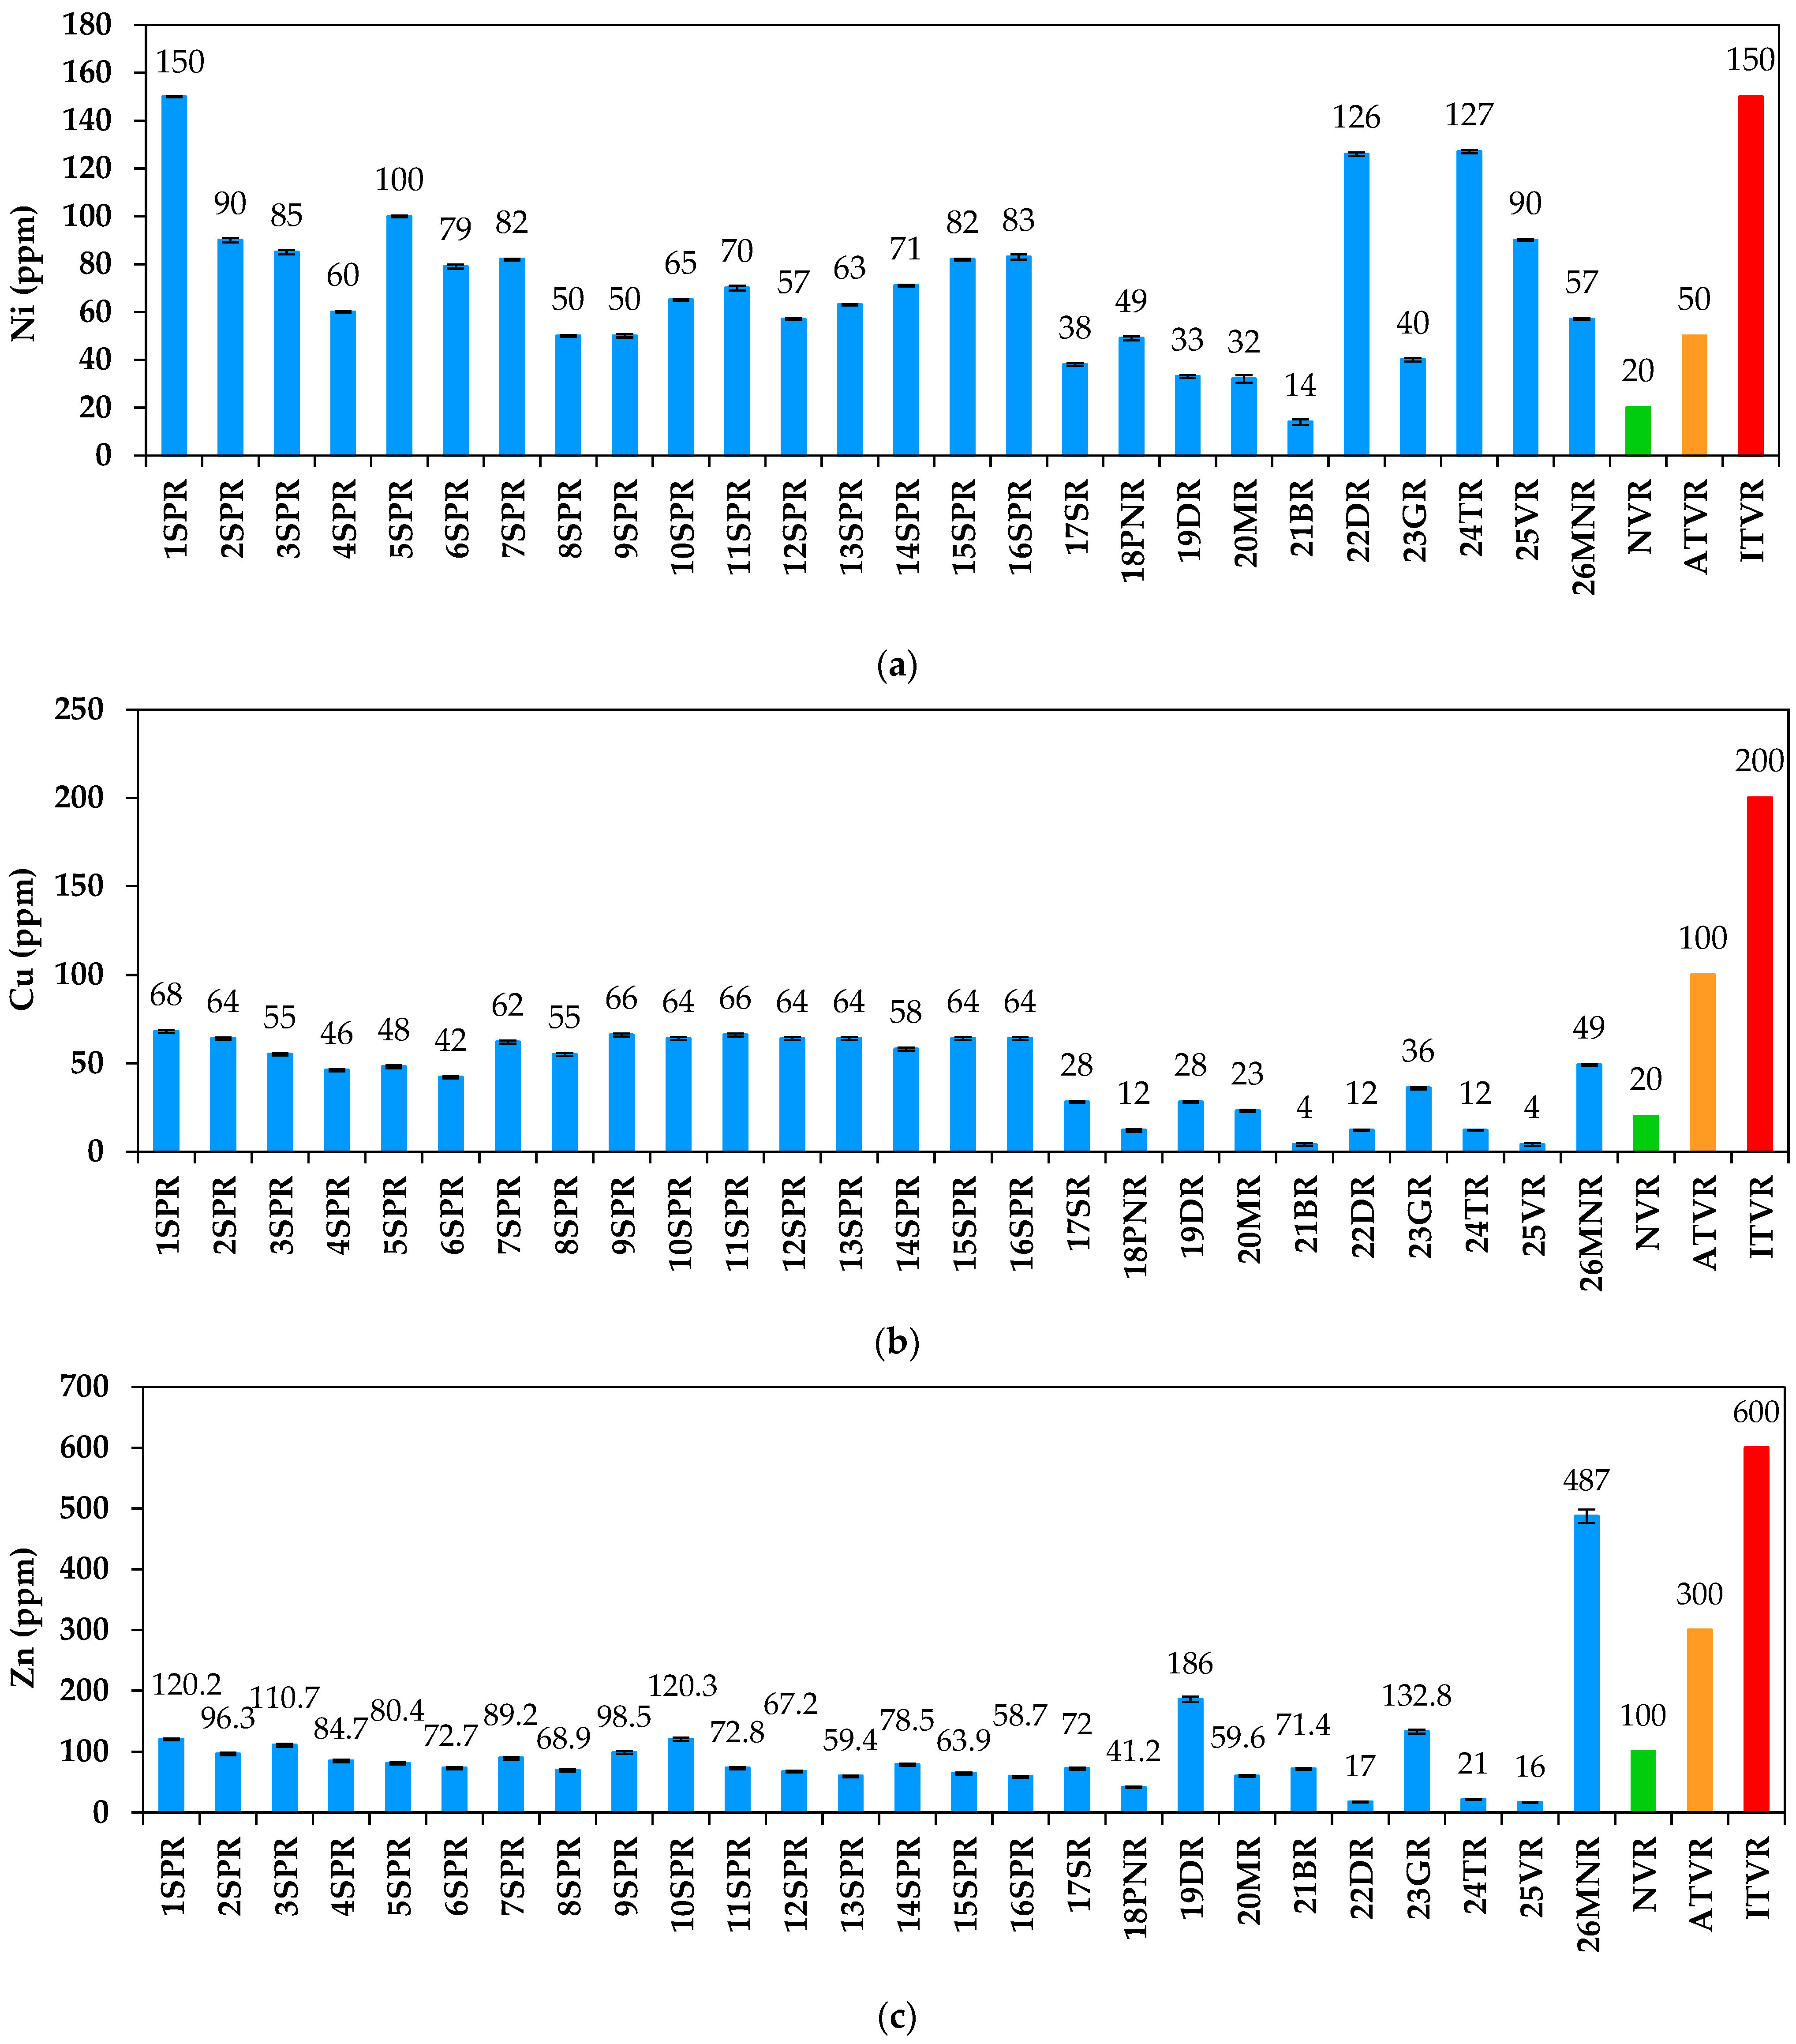
The results of the analyzed soil samples, presented in Figure 3; Figure 4, are discussed in accordance with the specific values presented in Table 9.
It can be seen that none of the soil samples exhibit contamination with lead, with all investigated soil samples presenting values under the alert threshold (50 ppm). Only the soil samples collected from areas close to roads show higher lead content (21–36 ppm) compared to the normal lead concentration (20 ppm) specific to Romanian soils.
The soil samples collected from Sag-Parta landfill show contamination with cadmium, presenting values higher than the alert threshold (3 ppm), whereas all of the other sampling sites show cadmium content under the alert threshold.
All samples collected from areas close to the roads show contamination with chromium, with some presenting values higher than the alert threshold (100 ppm), but under the intervention threshold (300 ppm). The samples collected from the old waste landfill in 2007 (closed in 2008) show no chromium contamination. Contamination with nickel is present in many of the investigated areas, showing values that are higher than the alert threshold (50–75 ppm). The increased content of nickel detected in studied soils can be explained not only by anthropogenic pollution due to the contamination of soil during waste deposit [31] and the influence of some old mining activities, but also by a distribution pattern and the presence of ultramafic and mafic parent rocks, specific to the Banat area [32].
None of the collected samples reveals high copper content, with the values being comparable with copper content in soils specific to other European countries [35].
The highest copper concentrations are present in the soil samples collected from the old Sag-Parta landfill (42–64 ppm).
High content of zinc is visible in the areas where waste was present, as an old waste landfill (zinc content in soil between 58.7–120.3 ppm), or under the form of new illegal waste dumps (132 ppm zinc in Giroc).
Only one area (the samples collected from Moldova Noua) show high contamination with zinc (487 ppm), which can be explained by the cumulative effect of two major contamination sources: the illegal deposit of waste directly on the soil (occurring recently, perhaps during the past 1–2 y); and an older contamination source, namely, the mining industry, which was for a long time the main economic activity of the Moldova Noua area.
The past metalliferous industry of this area (zinc extraction) explains the high zinc content of soil samples [36].
Table 10 presents other specific values for the studied HMs according to the Dutch legislation: Pro PECC 1994 for the old list of HM values and the New Dutch list (Ministry of Housing, Spatial Planning and Environment, 2011 [37]).
Many developing countries use the old and new Dutch guidelines as a reference because the Dutch were pioneers in soil protection, and their guidelines are acknowledged in Asia and Europe.
The NVN values show the levels of decontamination, whereas the IRN values indicate the levels of pollution and recommend that further investigations are required.
The CRN values reveal significant pollution levels and also recommend cleanup, preferably back to NVN values.
NVN, IRN, and CRN values correspond to the old Dutch list of HM legislation published in 1983, as part of the Interim Soil Remediation Act. For the Netherlands, the lowest level (target value) defines the quality of unpolluted soils, whereas the highest level (intervention value) defines when remediation becomes necessary [33].
By comparing the legislation of Romania and the Netherlands, we can observe that the values differ slightly, with the Romanian legislation being stricter.
By applying principal component analysis, as shown in Figure 5, the soil sample 21BR shows the lowest concentration of heavy metals, whereas 26MNR shows the highest contamination with HMs.
The soil sample 21BR comes from Bolvasnita, a village where the main economic activities are animal husbandry, fruit growing, agriculture, and wood exploitation. The base of the region is characterized by the old crystalline formations, which are metamorphosed and pierced by granitic massifs [16].
The soil sample 26MNR corresponds to an area with a long history of mining activities, which started in 1728 and reduced significantly after 1990 [19].
Figure 5 shows the distribution of the samples collected from the Sag-Parta landfill (pink circle) in the area of the vectors corresponding to Ca, Ni, and Cu, indicating that this area presents a cumulative environmental risk, although individually the contamination is high only for cadmium.
The soil samples distributed in the green circle do not present cumulative contamination risk, with the exception of the samples corresponding to the Moldova Noua area, which are represented on the graphic as being the closest to the alert threshold values for Zn, Cr, and Pb.
The cluster analysis using the paired group algorithm and Euclidian distance similarity measure shows a correlation coefficient of 0.887, as presented in Figure 6.
Three main clusters can be observed: cluster (I), corresponding to the Sag-Parta landfill; cluster (II), corresponding to other investigated areas close to the NVR (II); and cluster (III), including the Romanian alert and intervention thresholds for heavy metals in soil, in addition to the sample 26MNR, which shows high HM contamination.
By comparing the soil contamination factor (CF) values calculated for the investigated Romanian soil samples, in addition to using the data from different scientific references, it can be noted that only CF(Ni) is higher in Romania compared to the values corresponding to other countries, whereas all of the other transfer factors show a comparable lower degree of contamination in Table 11.
As can be seen, the CF(Pb) value is 19 times higher in the Ibadan landfill, whereas the CF(Ni) value is two-fold lower in the Ibadan landfill compared to the Sag-Parta landfill.
Compared to the Ibadan landfill (Nigeria) and Madurai landfill (India), a similar trend of contamination factor values for Cd, Cr, and Ni can be observed. Higher CF(Ni) values suggest a higher industrialization level, whereas a low CF(Pb) value suggests more strict environmental legislation [42].
According to the European Commission Document “Impact Assessment of the Thematic Strategy on Soil Protection”, Commission of the European Communities, Brussels [43], even if “soil contamination is a problem across all Europe”, there are insufficiently available data for assessing different parameters, mostly because the data collected by each Member State are not comparable.
It was estimated that there are approximately 3.5 million potentially contaminated sites in Europe, of which 0.5 million were found to be contaminated and need to be restored [44].
The new European Directive 2018/851, which became law in EU countries on 5 July 2020, amended the Directive 2008/98/EC [10], and set high targets regarding waste management, which will decrease the heavy metal contamination due to waste deposits. The main target of the new Directive is that by 2025, at least 55% of the municipal waste, by weight, will have to be recycled. This target will increase to 60% by 2030 and to 65% by 2035 [45].
Although Europe has set stringent rules to reduce pollution, other countries suffer various environmental problems [45]. According to Prieto et al. [44], in Africa, pollution, including soil contamination, occurs not only due to lack of legislation, but also because transnational corporations operate under a double standard. These companies use clean and sustainable activities in their countries of origin or other developed countries, but use the cheapest and dirtiest processes in developing countries, which are desperate for investment of foreign capital.
The values of environmental HM contamination indices, such as the pollution index of soil loadings (PIL), the geo-accumulation index (Igeo), the potential ecological risk index ( E r i ), and the potential ecological risk assessment (RI) were calculated using the average values of the HM contents, as reported in Table 12.
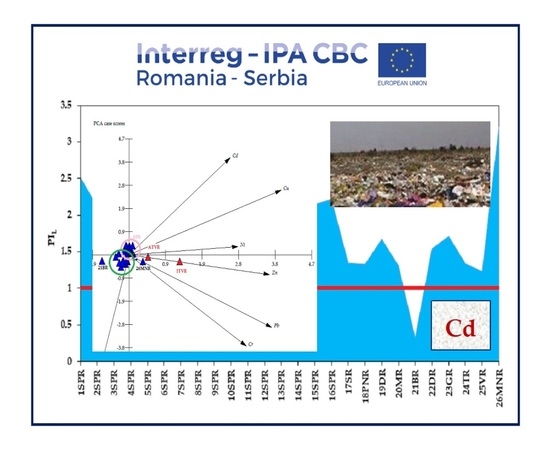
The pollution index of soil loadings (PIL) was calculated because it provides a comparative means for assessing the quality of a site. According to the PIL values displayed in Table 12, the soil samples taken from Bolvasnita village (21BR) show no contamination with heavy metals (PIL < 1).
Values of PIL > 1 indicate that, on average, the elemental concentrations are above the permissible level [24,25]. Thus, the results show that all investigated sites, with the exception of the 21BR soil sample, are influenced by HM pollution, thereby revealing a deterioration in the sites’ quality, as is shown in Figure 7.
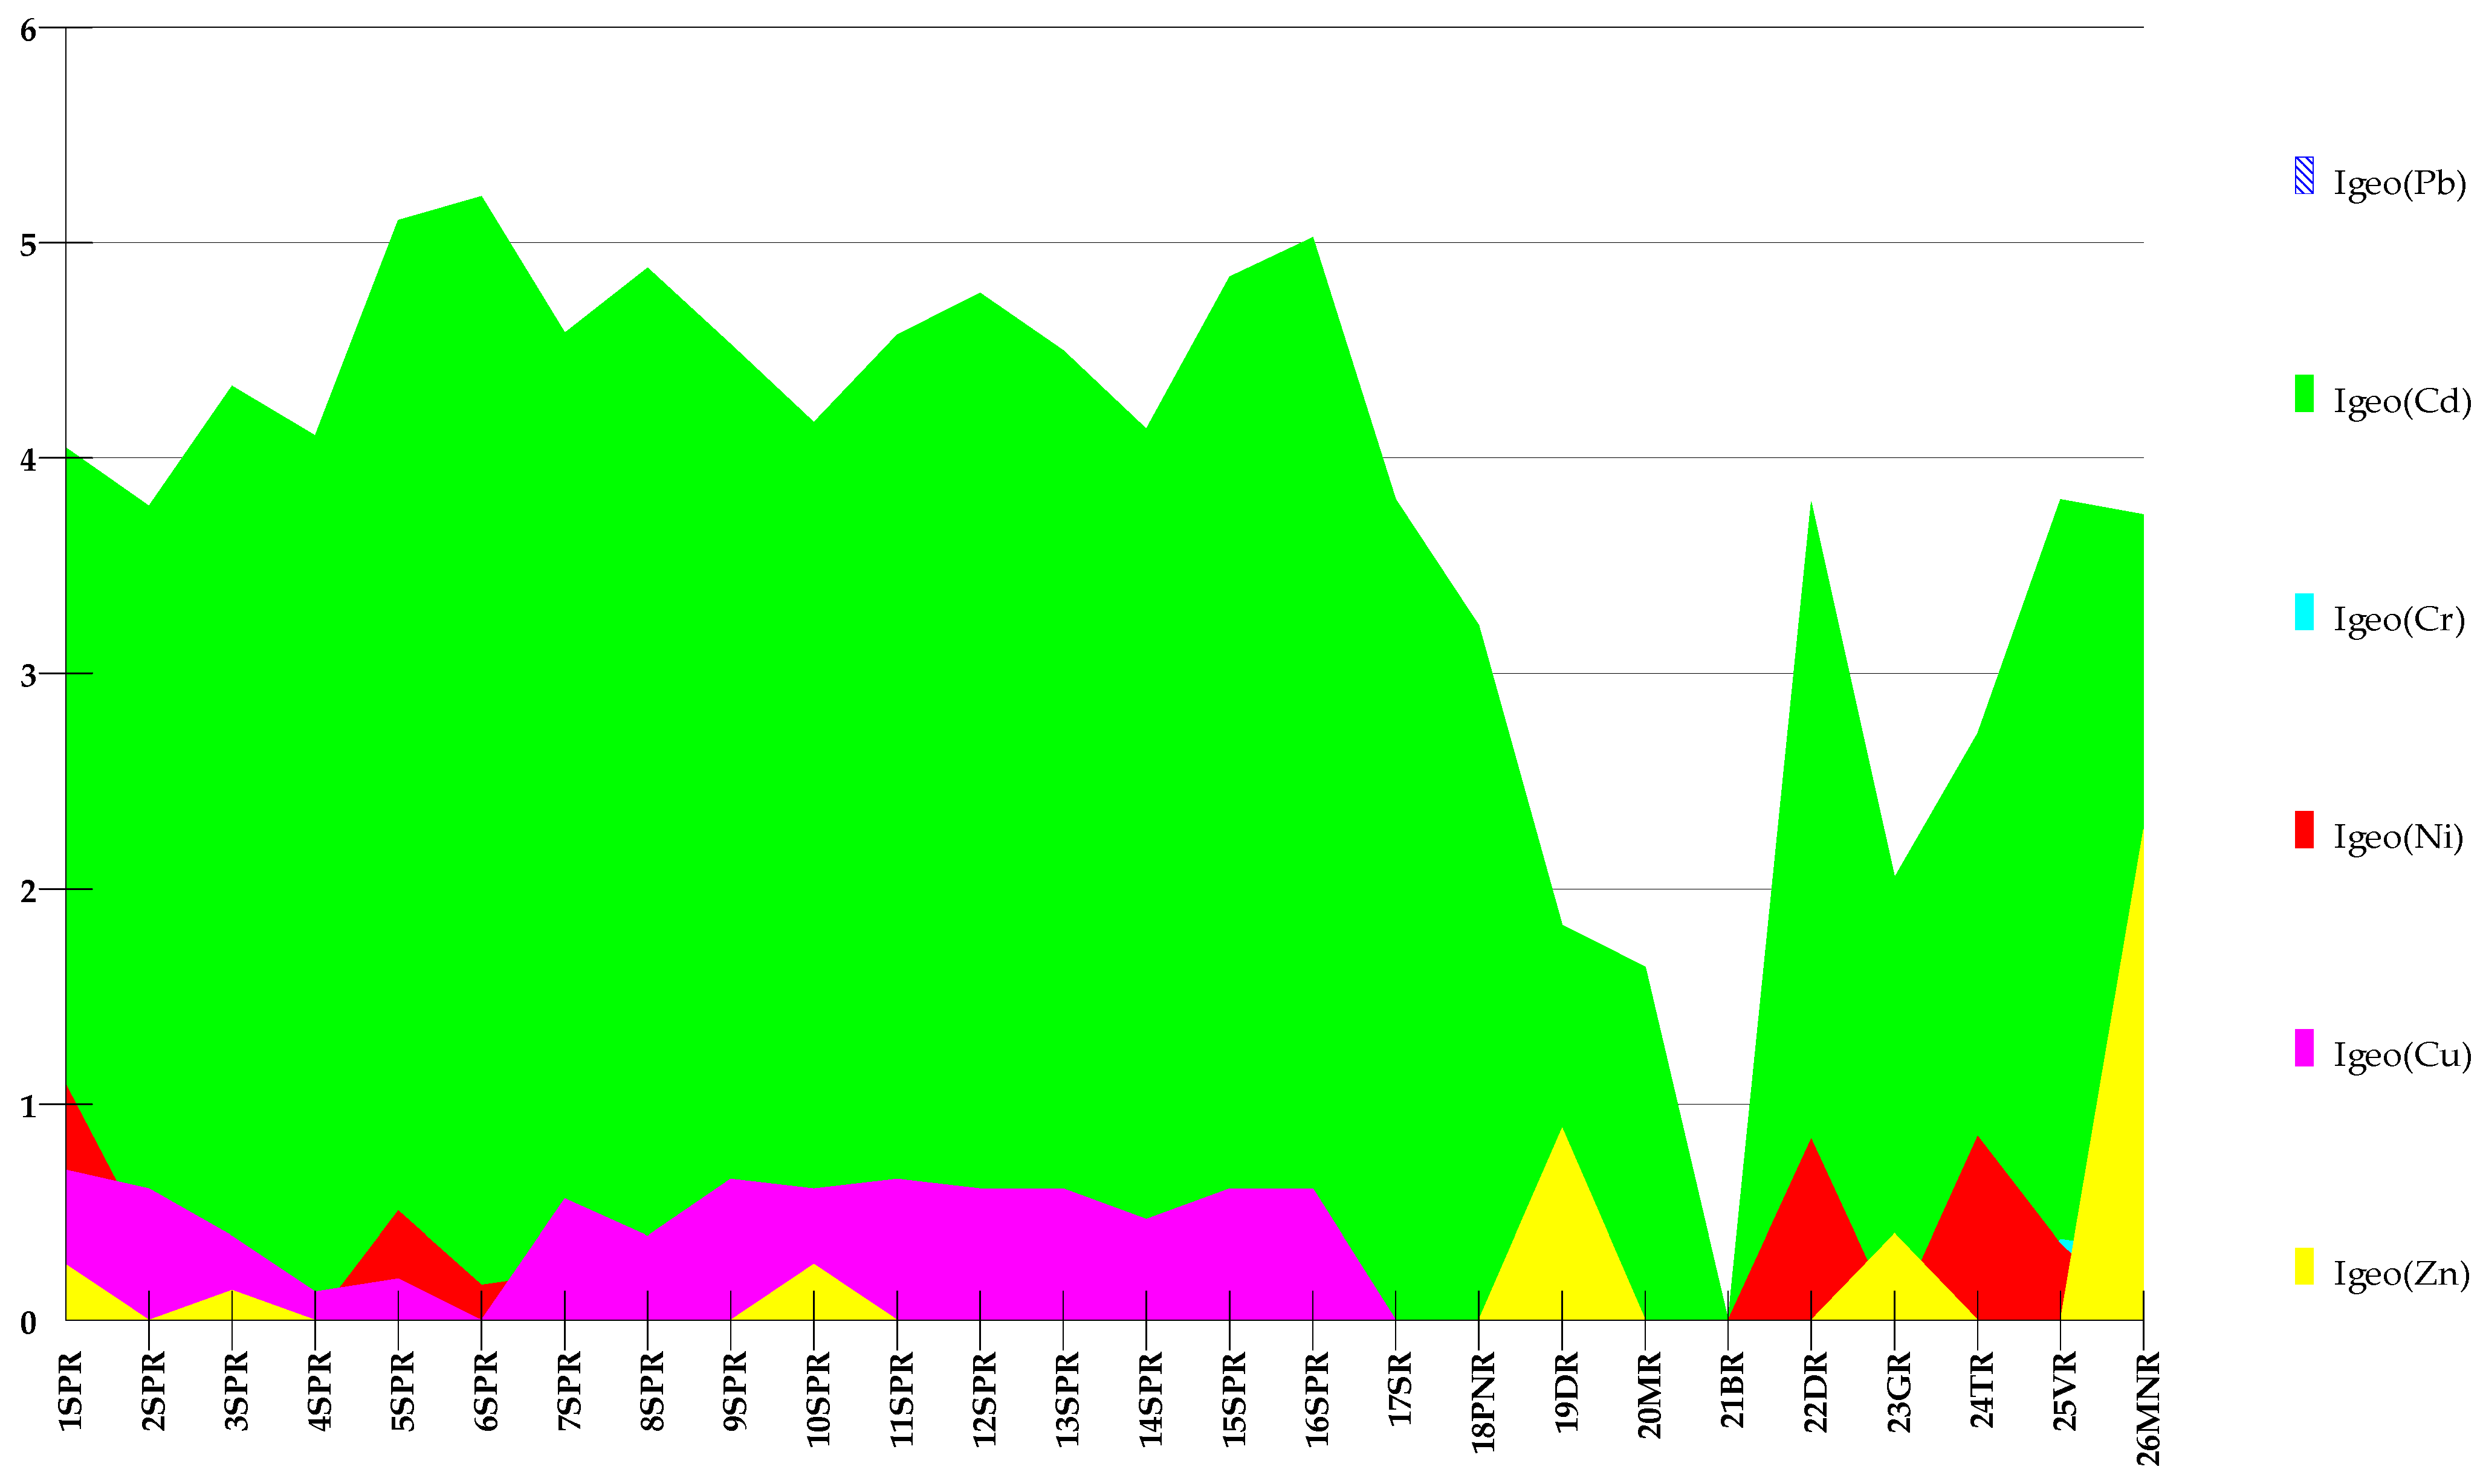
Table 12 also presents the calculated values of Igeo(HM), which help to answer question Q1 (What is the environmental hazard of concern in the case of closed landfills, small illegal waste dumps, and litter?). Examination of the values obtained for the Igeo(HM) characteristic of the investigated soil samples indicates that the geological index corresponding to cadmium Igeo(Cd) is the highest for the landfill 4 < Igeo(Cd) ≥ 5 (heavy to extremely serious contamination (VI-VII), with 2 < Igeo(Cd) ≤ 3 indicating moderate to heavy contamination (IV) for illegal waste dumps.
The Igeo(Cd) for Moldova Noua is higher than 3, proving that the trace element composition of the soil is influenced by contamination time, anthropogenic processes, and history of industrial activity, and not only by waste composition and storage.
The geo-accumulation index (Igeo) fingerprint based on the experimental analyzed data is shown in Figure 8.
These data reveal that Igeo(Cd) shows a very high value in all situations, proving that this element might be considered a latent fingerprint for waste disposal that is correlated with the industrialization level and rehabilitation procedures.
Latent prints are undetectable until revealed with a graphical and/or chemical process designed to boost latent print residue [46].
Based on the study presented by Li et al. [42], cadmium concentration increases with increases in the levels of industrial output, energy consumption, and total population, followed by a decrease in this pollutant since 2000, following the implementation of environmental protection measures to control pollution.
According to the Nordic Council of Ministers [47], in Europe, the release of cadmium to waste and soil was approx. 1572 t/y from industrial sources and 950 t/y from municipal waste and ashes.
The calculation of the indices shown in Table 12, which correspond to the potential ecological risk factor of a single HM, in addition to the cumulative ecological risk factor RI, which corresponds to the cumulative effect of HMs, answer the question Q2: Do heavy metals show single or multiple/cumulative risk?
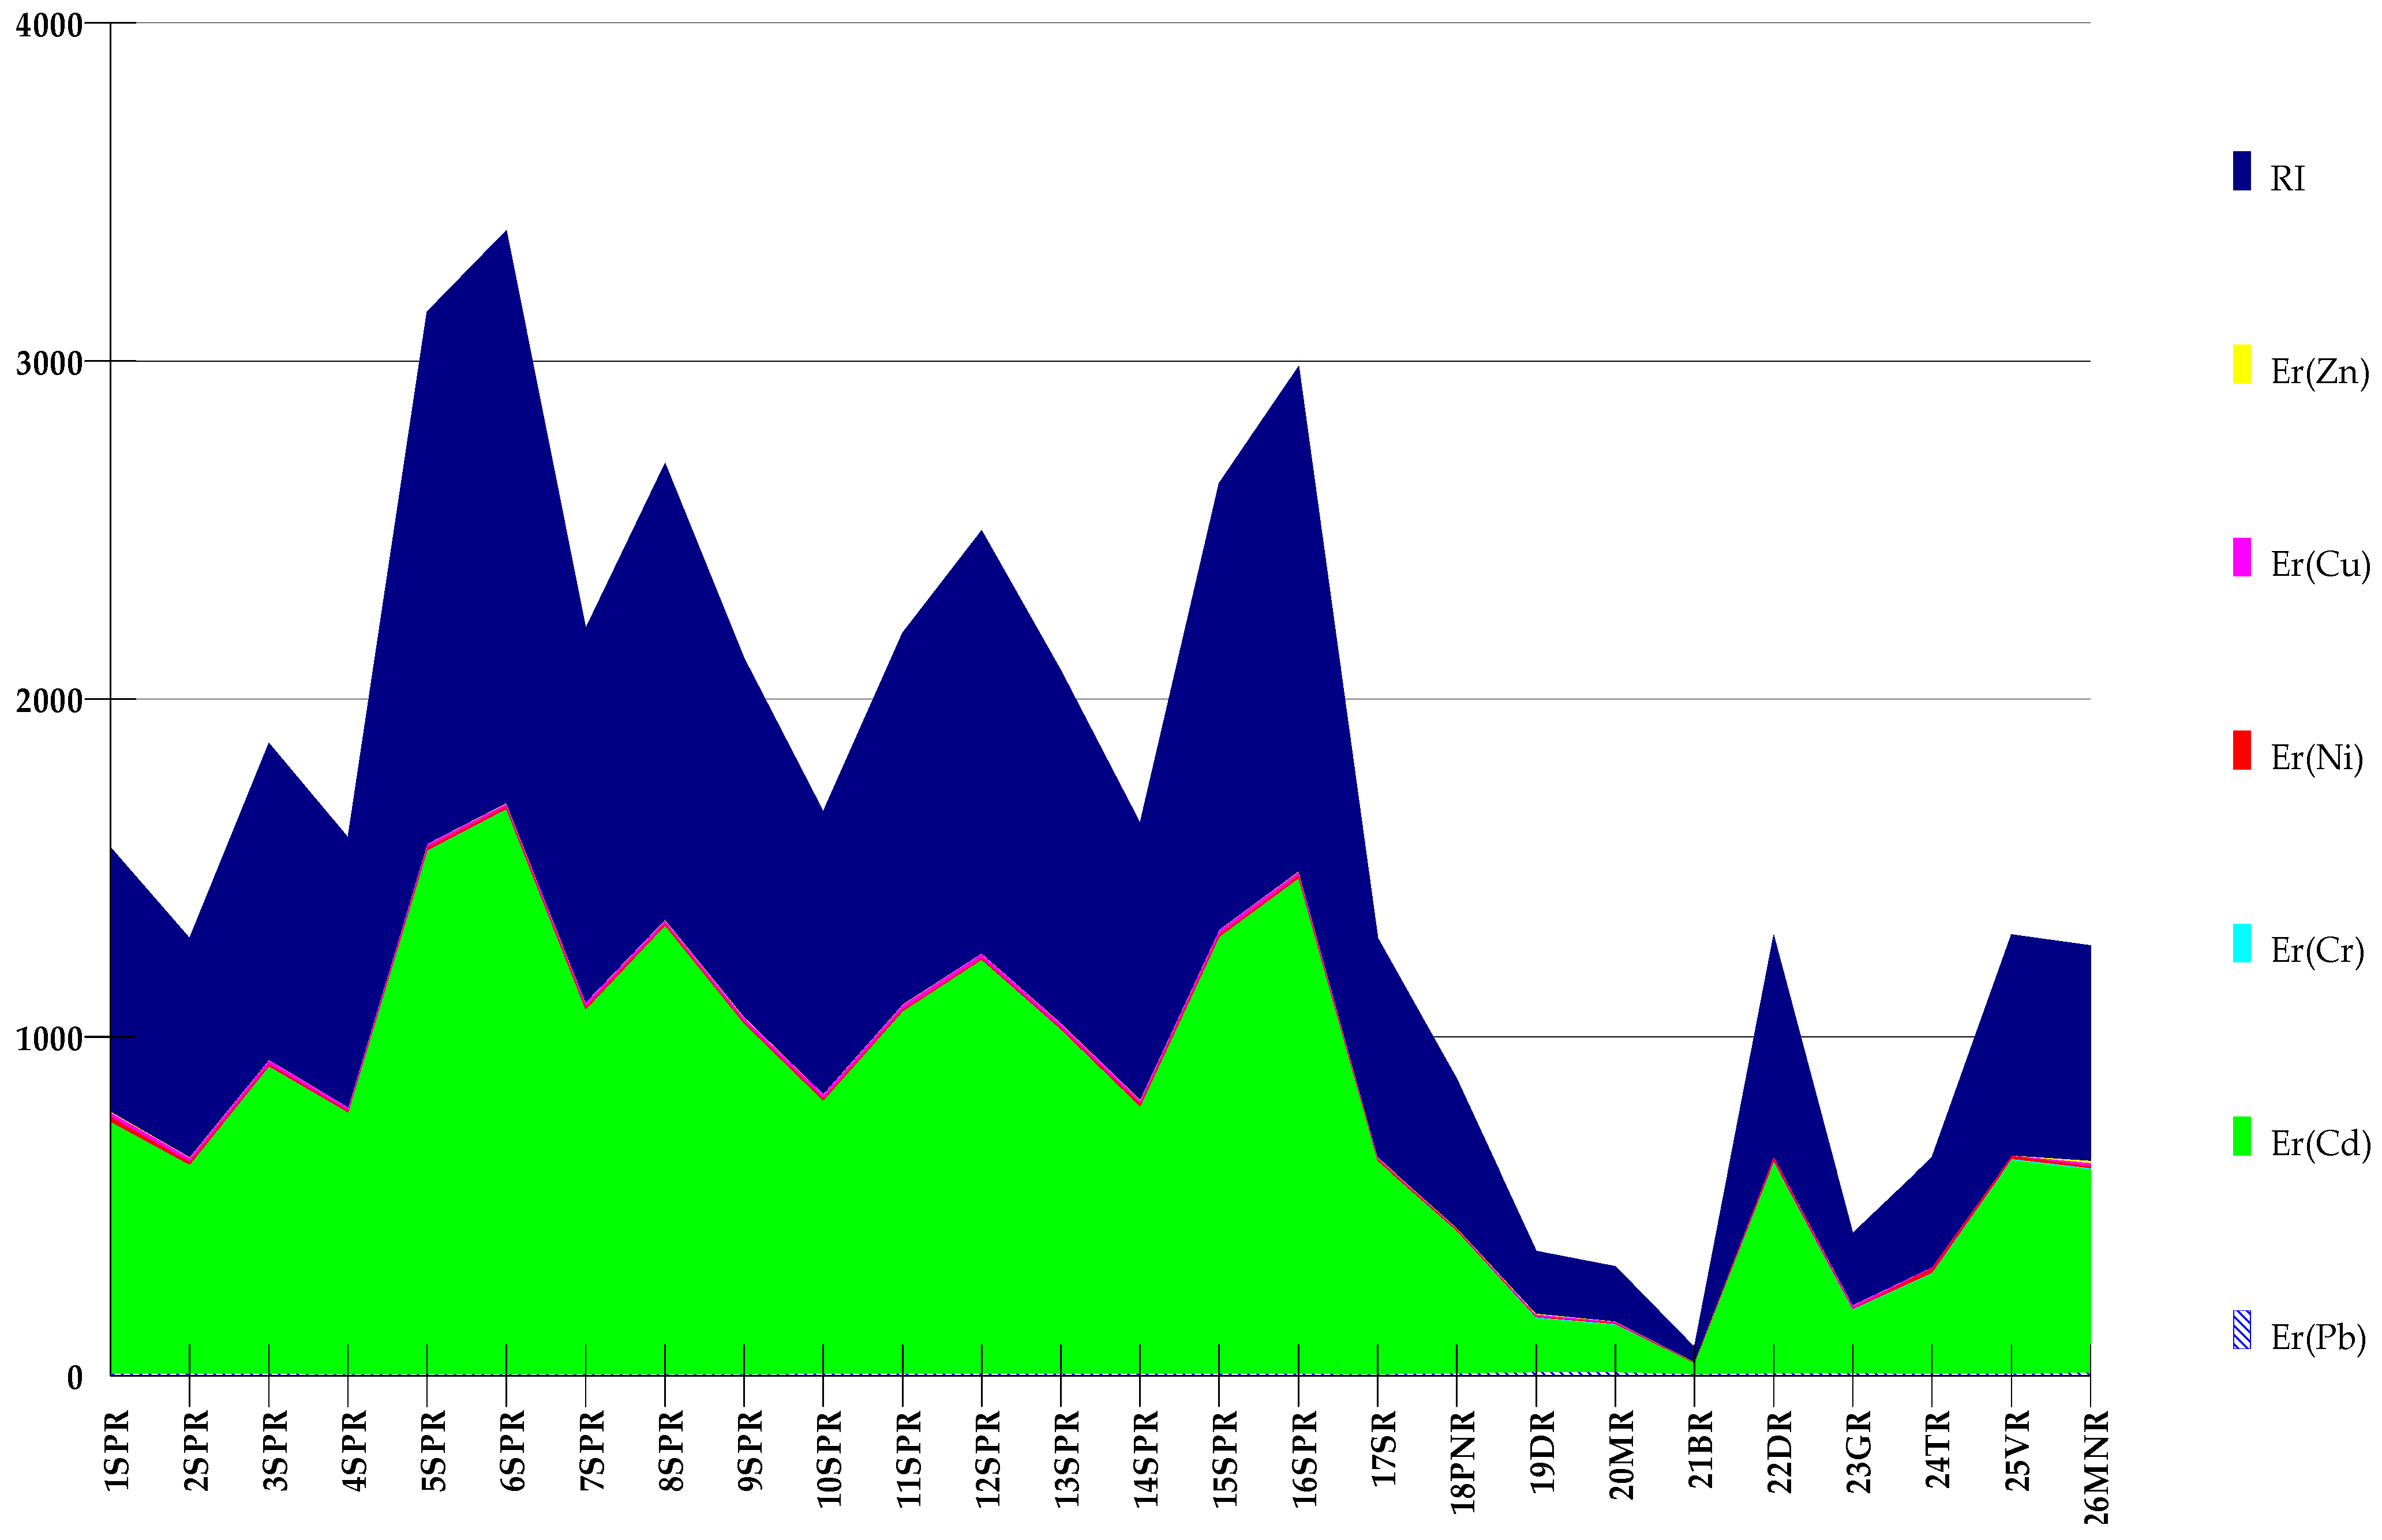
As can be seen based on the data presented in Table 12 and Figure 9, the only monomial potential ecological risk factor is for Cd, which shows values higher than 320 ( E j Cd   ≥ 320, Potential risk class V) for the landfill at Sag-Parta, Peciu Nou, Dumbravita, Varias, and Moldova Noua.
High potential ecological risk (Potential risk class IV) is registered for Deta, Giroc and Timisoara (16 ≤   E j Cd   < 320), whereas Moravita shows considerable potential risk (80 ≤   E j Cd   < 160, Potential risk class III) and Bolvasnita presents low risk ( E j Cd   < 40, Potential risk class I).
Regarding the cumulative risk RI, the trend is given by the monomial potential ecological risk factor for Cd, whereas all the other HM monomial potential ecological risk factors show low potential ecological risk. The highest class of cumulative ecological risk, 880 ≤ RI, is identified only for Sag-Parta landfill (13 of 16 collection points). The second most dangerous cumulative ecological risk (440 ≤ RI < 880) is identified for the soil samples taken from Sag, Dumbravita, Varias, and Moldova Noua, which were characterized by illegal waste dumps. Considerable potential ecological risk (220 ≤ RI < 440) is registered for Peciu Nou and Timisoara. Deta, Mosnita, and Giroc show moderate potential ecological risk (110 ≤ RI < 220), and Bolvasnita is subject to very low ecological risk.
It can be observed that RI values show significant cumulative ecological risk for Sag-Parta landfill and high cumulative ecological risk for the areas with illegal waste dumps, such as 22DR and 26MNR. The same high cumulative ecological risk class is shown by 17SR (the closest location to the landfill), whereas the accumulation of litter close to main roads shows a lower cumulative ecological risk.

4. Conclusions

Our study provides an overview of the impact of time on waste disposal, proving that a landfill is more harmful than illegal waste dumps because the latter are removed from the environment once identified. The influence of illegal waste dumps on ecosystems is less harmful than a landfill, mainly because of the long period of time in which waste is accumulated in landfills. When illegal waste dumps are discovered, they are cleaned by the authorities, thus indicating that strict legislation reduces the level of pollution associated with hazardous waste, including heavy metals. The identification of latent fingerprints can help determine the ecological risk associated with the level of pollutants, and can be used not only to assess HM soil contamination, but also to predict the ecological responses of soil exposed to hazardous waste. The data collected in this study provide strong evidence that cadmium might be considered a latent fingerprint for waste disposal, which is correlated with the industrialization level and rehabilitation procedures. The study outcomes provide information regarding the pollution level and identify cadmium as a significant source of soil contamination in western Romania, due to waste and traffic. The implementation of sustainable environmental monitoring and waste management plays a crucial role in maintaining the ecological balance. The innovative method proposed in this study, based on heavy metal indicators, represents a useful tool for better waste management by local and national authorities.

Author Contributions

Conceptualization, D.-M.B., L.P., M.-A.P. and E.A.; methodology, D.-M.B., L.P. and M.-A.P.; software, D.-M.B., L.P. and M.-A.P.; validation, A.M., D.O., C.D.M. and A.C.; formal analysis, A.C., A.B.B., C.D.M., D.N.R., D.O. and I.L.C.; investigation, A.C., E.A., A.M., D.N.R., A.B.B. and I.L.C.; resources, C.D.M.; data curation, D.O., A.M., A.B.B., C.D.M. and D.N.R.; writing—original draft preparation, D.-M.B., M.-A.P., L.P., E.A. and I.L.C.; writing—review and editing, D.-M.B., M.-A.P., E.A. and D.N.R.; visualization, D.O., A.C., A.M., C.D.M. and A.B.B.; supervision, L.P., D.-M.B. and M.-A.P.; project administration, L.P.; funding acquisition, I.L.C. All authors have read and agreed to the published version of the manuscript.

Funding

This research paper was funded by the Interreg–IPA Cross–border Cooperation Programme Romania-Serbia, through the project “Modern technologies for monitoring land covered with waste in order to restore their initial use”, 2019–2021, code RORS 365.

Institutional Review Board Statement

Not applicable.

Informed Consent Statement

Not applicable.

Data Availability Statement

All data of this study are available from the authors upon request.

Conflicts of Interest

The authors have no conflict of interest regarding the content of this paper. The funders had no role in the design of the study; in the collection, analysis, or interpretation of data; in the writing of the manuscript, or in the decision to publish the results.

References

  1. Council Directive 75/442/EEC of 15 July 1975 on Waste. OJ L 1975, 194, 39–41. Available online: https://eur-lex.europa.eu/legal-content/EN/TXT/?uri=CELEX%3A31975L0442 (accessed on 25 January 2021).
  2. Law No. 265/2006 for the Approval of the Government Emergency Ordinance no. 195/2005 on Environmental Protection, Published in the Official Gazette of Romania, No. 586/6 July. 2006. Available online: https://lege5.ro/gratuit/ha3tambq/legea-nr-265-2006-pentru-aprobarea-ordonantei-de-urgenta-a-guvernului-nr-195-2005-privind-protectia-mediului (accessed on 19 February 2021).
  3. Pfeffer, J.T. Solid Waste Management Engineering; Prentice Hall: Englewood Cliffs, NJ, USA, 1992. [Google Scholar]
  4. Order of the Ministry of Agriculture, Food and Forests No. 223, updated and published in Official Gazette of Romania No. 598/13 August, Bucharest, Romania. 2002. Available online: http://legislatie.just.ro/Public/DetaliiDocument/37981 (accessed on 12 March 2021).
  5. Government Decision on Waste Management Records and for the Approval of the List Containing Waste, Including Hazardous Waste No. 856/2002, Published in the Official Gazette of Romania No. 659/5 September. 2002. Available online: http://legislatie.just.ro/Public/DetaliiDocument/38294 (accessed on 21 January 2021).
  6. Volunteers Pick up Litter in Sabana Park. Available online: https://www.insidecostarica.com/dailynews/2010/december/20/costarica10122006.htm (accessed on 17 January 2021).
  7. Learn the Basics of Hazardous Waste. Available online: https://www.epa.gov/hw/learn-basics-hazardous-waste (accessed on 14 February 2021).
  8. What Are the RCRA 8 Metals? Available online: https://www.ecoflo.com/2014/12/19/what-are-the-rcra-8-metals/ (accessed on 4 March 2021).
  9. Orlescu, C.M.; Costescu, I.A. Solid waste management in Romania: Current and future issues. Environ. Eng. Manag. J. 2013, 12, 891–899. Available online: http://www.eemj.icpm.tuiasi.ro/pdfs/vol12/no5/6_278_Orlescu_13.pdf (accessed on 10 March 2021).
  10. Waste Framework Directive (2008/98/EC). Available online: http://eur-lex.europa.eu/LexUriServ/LexUriServ.do?uri=CELEX:32008L0098:EN:NOT (accessed on 14 May 2021).
  11. Integrated Waste Management System in Timis County—Report on the Environmental Impact Assessment Study. Available online: http://arpmtm.anpm.ro/files/ARPM%20TIMISOARA/Reglementari/Acordul%20de%20mediu/Rapoarte%202011/rsitimisrev1.pdf (accessed on 15 May 2021).
  12. European Commission DG ENV. E3: Heavy Metals in Waste, Final Report. Project ENV.E.3/ETU/2000/0058, COWI A/S, Denmark 2002. Available online: https://fayllar.org/european-commission-dg-env-e3.html (accessed on 18 May 2021).
  13. Conducting an Ecological Risk Assessment. Available online: https://www.epa.gov/risk/conducting-ecological-risk-assessment#tab (accessed on 19 March 2021).
  14. Guidelines for Ecological Risk Assessment, EPA/630/R-95/002F, April 1998, Published on 14 May 1998, Federal Register 63(93):26846–26924. Available online: https://www.epa.gov/sites/production/files/2014-11/documents/eco_risk_assessment1998.pdf (accessed on 13 May 2021).
  15. European Parliament 2009–2014, Petition 1215/2011 by Jean Pierre Pascal, Concerning the Discharge of Industrial Waste in a Landfill Site in Parta-Sag, Timis County, Romania. Available online: https://www.europarl.europa.eu/doceo/document/PETI-CM-492732_EN.pdf?redirect (accessed on 14 May 2021).
  16. Comuna Bolvasnita. Asezare Geografica si Clima. Available online: http://www.primaria-bolvasnita.ro/geografie (accessed on 25 March 2021).
  17. Timisoara. Available online: https://www.britannica.com/place/Timisoara (accessed on 1 April 2021).
  18. Date Istorico-Geografice Comuna Varias Judetul Timis. Available online: http://primaria-varias.ro/date-istorico-geografice-comuna-varias-judetul-timis/ (accessed on 29 March 2021).
  19. Enciclopedia Romaniei. Moldova Nouă. Available online: http://enciclopediaromaniei.ro/wiki/Moldova_Nou%C4%83 (accessed on 11 March 2021).
  20. Nica, D.V.; Bordean, D.M.; Pet, I.; Pet, E.; Alda, S.; Gergen, I. A novel exploratory chemometric approach to environmental monitorring by combining block clustering with Partial Least Square (PLS) analysis. Chem. Cent. J. 2013, 7, 1–10. Available online: https://link.springer.com/article/10.1186/1752-153X-7-145#Sec4 (accessed on 15 March 2021). [CrossRef] [Green Version]
  21. Bordean, D.M.; Borozan, A.B.; Nica, D.; Alda, S.; Cojocaru, L.; Horablaga, M.; Gergen, I. Assessment of soil, copper, cobalt and chromium contamination in old mining areas from Romania. In Proceedings of the International Multidisciplinary Scientific GeoConference: SGEM, Albena, Bulgaria, 17–23 June 2012; STEF92 Technology Ltd.: Sofia, Bulgaria, 2012; Volume 5, pp. 101–108. Available online: http://toc.proceedings.com/19962webtoc.pdf (accessed on 24 February 2021).
  22. Rudnick, R.L.; Gao, S. The Composition of the Continental Crust. In Treatise of Geochemistry; Holland, H.D., Turekian, K.K., Eds.; Elsevier-Pergamon: Oxford, UK, 2003; Volume 3, pp. 1–64. [Google Scholar]
  23. Hakanson, L. An ecological risk index for aquatic pollution control. A sedimentological approach. Water Res. 1980, 14, 975–1001. [Google Scholar] [CrossRef]
  24. Tomlinson, D.C.; Wilson, D.J.; Harris, C.R.; Jeffrey, D.W. Problem in heavy metals in estuaries and the formation of pollution index. Helgol. Wiss. Meeresunter. 1980, 33, 566–575. Available online: https://hmr.biomedcentral.com/track/pdf/10.1007/BF02414780.pdf (accessed on 10 March 2021). [CrossRef] [Green Version]
  25. Alharbi, B.H.; Pasha, M.J.; Alotaibi, M.D.; Alduwais, A.K.; Al-Shamsi, M.A.S. Contamination and risk levels of metals associated with urban street dust in Riyadh, Saudi Arabia. Environ. Sci. Pollut. Res. 2020, 27, 18475–18487. [Google Scholar] [CrossRef]
  26. Muller, G. Schwermetalle in den sediments des Rheins: Veränderungen seit 1971. Umschan 1979, 79, 778–783. [Google Scholar]
  27. Khaled, A.; Abdel-Halim, A.; El-Sherif, Z.; Mohamed, L.A. Health risk assessment of some heavy metals in water and sediment at Marsa-Matrouh, Mediterranean Sea, Egypt. J. Environ. Prot. 2017, 8, 74–97. [Google Scholar] [CrossRef] [Green Version]
  28. Kumar, M.; Gogoi, A.; Kumari, D.; Borah, R.; Das, P.; Mazumder, P.; Tyagi, V.K. Review of perspective, problems, challenges, and future scenario of metal contamination in the urban environment. J. Hazard. Toxic Radioact. Waste 2017, 21, 04017007. [Google Scholar] [CrossRef]
  29. Kuerban, M.; Maihemuti, B.; Waili, Y.; Tuerhong, T. Ecological risk assessment and source identification of heavy metal pollution in vegetable bases of Urumqi, China, using the positive matrix factorization (PMF) method. PLoS ONE 2020, 15, e0230191. [Google Scholar] [CrossRef] [Green Version]
  30. Sulaiman, M.B.; Asegbeloyin, J.N.; Ihedioha, J.; Oyeka, E.E.; Oji, E.O. Trace Metals Content of Soil around a Municipal Solid Waste Dumpsite in Gombe, Nigeria: Assessing the Ecological and Human Health Impact. J. Chem. Health Risks 2019, 9, 173–190. [Google Scholar] [CrossRef]
  31. Vongdala, N.; Tran, H.D.; Xuan, T.D.; Teschke, R.; Khanh, T.D. Heavy metal accumulation in water, soil, and plants of municipal solid waste landfill in Vientiane, Laos. Int. J. Environ. Res. Public Health 2019, 16, 22. [Google Scholar] [CrossRef] [PubMed] [Green Version]
  32. Poznanović Spahić, M.M.; Sakan, S.M.; Glavaš-Trbić, B.M.; Tančić, P.I.; Škrivanj, S.B.; Kovačević, J.R.; Manojlović, D.D. Natural and anthropogenic sources of chromium, nickel and cobalt in soils impacted by agricultural and industrial activity (Vojvodina, Serbia). J. Environ. Sci. Health A 2019, 54, 219–230. [Google Scholar] [CrossRef]
  33. Romanian Law—Order 756/1997 for the Approval of the Regulation on the Assessment of Environmental Pollution, Regulations of 3 November 1997 (Updated by 28 June 2011), Ministry of Water, Forest and Environmental Protection. Available online: http://Legislatie.Just.Ro/Public/Detaliidocumentafis/151788 (accessed on 29 March 2021).
  34. Final Implementation Report for Directive 86/278/EEC on Sewage Sludge: 2013–2015. Available online: https://ec.europa.eu/environment/archives/waste/reporting/pdf/Final_Implementation_Report_2013_2015_Sewage_Sludge.pdf (accessed on 18 March 2021).
  35. Panagos, P.; Ballabio, C.; Lugato, E.; Jones, A.; Borrelli, P.; Scarpa, S.; Orgiazzi, A.; Montanarella, L. Potential sources of anthro-pogenic copper inputs to European agricultural soils. Sustainability 2018, 10, 2380. [Google Scholar] [CrossRef] [Green Version]
  36. Albulescu, M.; Popovici, H.; Turuga, L.; Masu, S.; Chiriac, A. Analysis of heavy metals content of soil and Vitis Vinifera in two vineyard areas of the Caras-Severin County, Romania. J. Environ. Prot. Ecol. 2012, 13, 48–55. Available online: http://www.elearning-chemistry.ro/awut/userfiles/magazine1_acc/37-44_Albulescu-Turuga.pdf (accessed on 11 February 2021).
  37. Teh, T.; Norulaini, N.A.R.N.; Shahadat, M.; Wong, Y.; Omar, A.K.M. Risk assessment of metal contamination in soil and groundwater in Asia: A review of recent trends as well as existing environmental laws and regulations. Pedosphere 2016, 26, 431–450. [Google Scholar] [CrossRef]
  38. Adelekan, B.A.; Alawode, A.O. Contributions of municipal refuse dumps to heavy metals concentrations in soil profile and groundwater in Ibadan Nigeria. J. Appl. Biosci. 2011, 40, 2727–2737. Available online: www.m.elewa.org/JABS/2011/40/7.pdf (accessed on 28 December 2020).
  39. Mouhoun-Chouaki, S.; Derridj, A.; Tazdaït, D.; Salah-Tazdaït, R. A study of the impact of municipal solid waste on some soil physicochemical properties: The case of the landfill of Ain-El-Hammam Municipality, Algeria. Appl. Environ. Soil Sci. 2019, 2019, 3560456. [Google Scholar] [CrossRef] [Green Version]
  40. Mekonnen, B.; Haddis, A.; Zeine, W. Assessment of the Effect of Solid Waste Dump Site on Surrounding Soil and River Water Quality in Tepi Town, Southwest Ethiopia. J. Environ. Public Health 2020, 2020, 5157046. [Google Scholar] [CrossRef]
  41. Anjanapriya, S.; Lalitha, S. Impacts of Heavy Metals in Soil Profile of Surrounding Municipal Solid Waste Dump Site. Int. J. Sci. Res. 2016, 5, 554–557. Available online: https://www.ijsr.net/archive/v5i5/3051603.pdf (accessed on 10 March 2021).
  42. Li, Y.; Zhou, S.; Jia, Z.; Ge, L.; Mei, L.; Sui, X.; Wang, X.; Li, B.; Wang, J.; Wu, S. Influence of Industrialization and Environmental Protection on Environmental Pollution: A Case Study of Taihu Lake, China. Int. J. Environ. Res. Public Health 2018, 15, 2628. [Google Scholar] [CrossRef] [Green Version]
  43. Commission of the European Communities, Brussels, 22.9.2006 SEC(2006)620 Commission Staff Working Document, Thematic Strategy for Soil Protection, Impact Assessment of the Thematic Strategy on Soil Protection {COM(2006)231 Final} {SEC(2006)1165}. Available online: https://ec.europa.eu/environment/archives/soil/pdf/SEC_2006_620.pdf (accessed on 15 March 2021).
  44. Prieto, M.J.; Acevedo, S.O.A.; Prieto, G.F.; González, N.T. Phytoremediation of soils contaminated with heavy metals. Biodivers. Int. J. 2018, 2, 362–376. [Google Scholar] [CrossRef]
  45. EU Waste Management Law. Available online: https://eur-lex.europa.eu/legal-content/EN/TXT/?uri=LEGISSUM%3Aev0010 (accessed on 1 April 2021).
  46. Yamashita, B.; French, M. Latent Print Development. In The Fingerprint Sourcebook; McRoberts, A., McRoberts, D., Eds.; National Institute of Justice: Washington, DC, USA, 2011; pp. 155–222. [Google Scholar]
  47. Nordic Council of Ministers. Cadmium Review; WHO: Geneva, Switzerland, 2003; p. 11. Available online: https://www.who.int/ifcs/documents/forums/forum5/nmr_cadmium.pdf (accessed on 18 November 2020).
Figure 1. A model of waste sorting and energy recovery [11].
Sustainability 13 06141 g001
Figure 2. The map of the study sites at Sag-Parta, Romania (1SPR-16SPR); Sag, Romania (17SR); Peciu Nou, Romania (18PNR); Deta, Romania (19DR); Moravita, Romania (20MR); Bolvasnita, Romania (21BR); Dumbravita, Romania (22DR); Giroc, Romania (23GR); Timisoara, Romania (24TR); Varias, Romania (25VR); and Moldova Noua, Romania (26MNR).
Sustainability 13 06141 g002
Figure 3. HM concentrations in the soil of the investigated sites: (a) Pb; (b) Cd; (c) Cr. Sag-Parta, Romania (1SPR-16SPR); Sag, Romania (17SR); Peciu Nou, Romania (18PNR); Deta, Romania (19DR); Moravita, Romania (20MR); Bolvasnita, Romania (21BR); Dumbravita, Romania (22DR); Giroc, Romania (23GR); Timisoara, Romania (24TR); Varias, Romania (25VR); Moldova Noua, Romania (26MNR); normal value for Romania (NVR); alert threshold value for Romania (ATVR); and intervention threshold value for Romania (ITVR). Results are expressed as the mean value of three independent analyses ± SD.
Sustainability 13 06141 g003
Figure 4. HM concentrations in the soil of the investigated sites: (a) Ni; (b) Cu; (c) Zn. Sag-Parta, Romania (1SPR-16SPR); Sag, Romania (17SR); Peciu Nou, Romania (18PNR); Deta, Romania (19DR); Moravita, Romania (20MR); Bolvasnita, Romania (21BR); Dumbravita, Romania (22DR); Giroc, Romania (23GR); Timisoara, Romania (24TR); Varias, Romania (25VR); Moldova Noua, Romania (26MNR); normal value for Romania (NVR); alert threshold value for Romania (ATVR); and intervention threshold value for Romania (ITVR). Results are expressed as the mean value of three independent analyses ± SD.
Sustainability 13 06141 g004
Figure 5. Graphical representation of joint plot PCA of data. Sag-Parta, Romania (SPR); Bolvasnita, Romania (21BR); Moldova Noua, Romania (26MNR); alert threshold value for Romania (ATVR); and intervention threshold value for Romania (ITVR).
Sustainability 13 06141 g005
Figure 6. Cluster analysis of HM soil data (Squared Euclidian—Data square—root transformed). Sag-Parta, Romania (1SPR-16SPR); Sag, Romania (17SR); Peciu Nou, Romania (18PNR); Deta, Romania (19DR); Moravita, Romania (20MR); Bolvasnita, Romania (21BR); Dumbravita, Romania (22DR); Giroc, Romania (23GR); Timisoara, Romania (24TR); Varias, Romania (25VR); Moldova Noua, Romania (26MNR); normal value for Romania (NVR); alert threshold value for Romania (ATVR); and intervention threshold value for Romania (ITVR).
Sustainability 13 06141 g006
Figure 7. The pollution index of soil loadings (PIL) graphical representation for the investigated soil samples. Sag-Parta, Romania (1SPR-16SPR); Sag, Romania (17SR); Peciu Nou, Romania (18PNR); Deta, Romania (19DR); Moravita, Romania (20MR); Bolvasnita, Romania (21BR); Dumbravita, Romania (22DR); Giroc, Romania (23GR); Timisoara, Romania (24TR); Varias, Romania (25VR); and Moldova Noua, Romania (26MNR).
Sustainability 13 06141 g007
Figure 8. The geo-accumulation index (Igeo) fingerprint based on experimental analyzed data. Sag-Parta, Romania (1SPR-16SPR); Sag, Romania (17SR); Peciu Nou, Romania (18PNR); Deta, Romania (19DR); Moravita, Romania (20MR); Bolvasnita, Romania (21BR); Dumbravita, Romania (22DR); Giroc, Romania (23GR); Timisoara, Romania (24TR); Varias, Romania (25VR); and Moldova Noua, Romania (26MNR).
Sustainability 13 06141 g008
Figure 9. The potential ecological risk index (Er) and the potential ecological risk assessment (RI) fingerprint based on experimental analyzed data. Sag-Parta, Romania (1SPR-16SPR); Sag, Romania (17SR); Peciu Nou, Romania (18PNR); Deta, Romania (19DR); Moravita, Romania (20MR); Bolvasnita, Romania (21BR); Dumbravita, Romania (22DR); Giroc, Romania (23GR); Timisoara, Romania (24TR); Varias, Romania (25VR); and Moldova Noua, Romania (26MNR).
Sustainability 13 06141 g009
Table 1. HM allowable limits in hazardous waste [12].
Heavy MetalAsBaCdCrPbHgSeAg
EPA Allowable Limits (ppm)5.0100.01.05.05.00.21.05.0
Table 2. Data regarding soil samples and soil collection areas.
Soil Collection
Areas
GPS Coordinates in
WGS 84 SYSTEM
Soil Sample
Code
Year of
Sampling
Area Description
Sag-Parta,
Romania
(closed landfill since 2008)
45°40′50″ N21°9′57″ E1SPR2007A large area of 17 ha was occupied by the landfill of Timisoara until 2008, when it was closed. The location did not have the necessary arrangements for a controlled ramp, was not waterproofed, and did not have controlled water leaks or monitoring systems for gas and groundwater. Currently, the municipal waste is selectively collected and composted.
45°40′47″ N21°9′55″ E2SPR
45°40′44″ N21°9′52″ E3SPR
45°40′41″ N21°9′50″ E4SPR
45°40′38″ N21°9′47″ E5SPR
45°40′36″ N21°9′45″ E6SPR
45°40′42″ N21°10′8″ E7SPR
45°40′46″ N21°10′7″ E8SPR
45°40′47″ N21°10′3″ E9SPR
45°40′48″ N21°10′1″ E10SPR
45°40′33″ N21°9′58″ E11SPR
45°40′32″ N21°9′53″ E12SPR
45°40′33″ N21°9′48″ E13SPR
45°40′36″ N21°10′7″ E14SPR
45°40′38″ N21°10′10″ E15SPR
45°40′35″ N21°10′2″ E16SPR
Sag,
Romania
45°39′4″ N21°9′25″ E17SR2016Sag is located at a distance of 3 km from landfill. Sag is a plain commune located at a distance of 13 km from Timisoara, on the national road DN59 Timisoara-Moravita, the European road E70. The samples were collected from the recreational area situated between Timis River and the main road, a potential trap for paper, cigarette butts, and plastic.
Peciu Nou,
Romania
45°36′26″ N21°3′42″ E18PNR2016Peciu Nou is located 16 km from Sag and 23 km from Timisoara. The soil samples were collected from the area close to the main road DJ593, where litter was observable.
Deta,
Romania
45°23′44″ N21°13′47″ E19DR2016Deta is located 30 km from Sag and 44 km from Timisoara on the national road DN59 Timisoara-Moravita, the European road E70.
The soil samples were collected from the area close to the main road DN59, where litter was observable.
Moravita,
Romania
45°15′35″ N21°16′10″ E20MR2016Moravita is located 50 km from Sag and 61 km from Timisoara on the national road DN59 Timisoara-Moravita, the European road E70.
The soil samples were collected from the area close to the main road DN59, where litter was observable.
Bolvasnita,
Romania
45°20′44″ N22°18′31″ E21BR2016Bolvasnita is a village located south of Caransebes, Caras-Severin county, at a distance of about 15 km, and at the western foot of Small Mountain (Muntele Mic) [16]. The soil samples were collected from the area close to the main road DJ608C, where litter was observable.
Dumbravita,
Romania
45°48′23″ N21°14′57″ E22DR2015Dumbravita village is located in a plain area, 6 km from Timisoara. The soil samples were collected from an area with illegal waste dumps formed mainly of construction materials.
Giroc,
Romania
45°41′59″ N21°14′26″ E23GR2015Giroc village is located in a plain area, 7 km from Timisoara. The soil samples were collected from an area with illegal waste dumps formed mainly of construction materials.
Timisoara,
Romania
45°43′53″ N21°12′25″ E24TR2017Timisoara is the capital of Timis county, one of the most important cities in western Romania, and located in the Pannonian Plain, near the divergence of the Timis and Bega rivers [17].
The soil samples were collected from an area close to DN59, a road characterized by large traffic volumes.
Varias,
Romania
46°0′23″ N20°57′51″ E25VR2012Varias commune is part of the territory of Timis county and is located in the northwestern part of the county. It is located at a distance of 45 km from Timisoara, 50 km from Arad municipality, and 30 km from Sinnicolau-Mare city [18]. The soil samples were collected from an area close to the main road DJ692 where litter was observed.
Moldova Noua,
Romania
44°43′57″ N21°40′1″ E26MNR2017Moldova Noua is a small city in southwestern Romania in Caras-Severin County, in an area known as Clisura Dunarii. It is located on the shores of the river Danube [19]. The soil samples were collected from an area with illegal domestic waste dumps.
Table 3. Concentration of elements in the upper Earth crust [22].
Sample SiteSymbolHeavy Metals Concentration (ppm)
PbCdCrNiCuZn
Upper Earth CrustUEC170.0992472867
Table 4. Classes of contamination based on CF values [23].
Classes of ContaminationCFContamination Level
ICF < 1Low pollution
II1 < CF < 3Moderate pollution
III3 < CF < 6High pollution
IVCF > 6Very high pollution
Table 5. Classes of contamination based on PIL values [24,25].
Classes of ContaminationPILContamination Level
IPIL < 1No contamination with the studied metals
IIPIL = 1Baseline levels of pollutants are present
IIIPIL > 1 Deterioration of site quality, the heavy metal Concentrations are above the permissible level
Table 6. The geo-accumulation index (Igeo) [26].
ClassIgeoContamination Level
IIgeo ≤ 0no contamination
II0 < Igeo ≤ 1light to moderate
III1 < Igeo ≤ 2moderate
IV2 < Igeo ≤ 3moderate to heavy
V3 < Igeo ≤ 4 heavy
VI4 < Igeo ≤ 5heavy to extremely serious
VIIIgeo ≥ 5extremely serious
Table 7. Hakanson’s toxic response factor of a specific HM [23].
HM T r i
Pb5
Cd30
Cr2
Ni5
Cu5
Zn1
Table 8. The classification conditions of potential ecological risks [30].
Grades E j i RIClass of Ecological Risk
I E j i   < 40RI < 110Low potential ecological risk
II40 ≤   E j i   < 80110 ≤ RI < 220Moderate potential risk
III80 ≤   E j i   < 160220 ≤ RI < 440Considerable potential risk
IV160 ≤   E j i   < 320440 ≤ RI < 880High potential risk
V E j i   ≥ 320800 ≤ RISignificantly very high
Table 9. Normal values for Romania, and alert and intervention thresholds for heavy metals in soil (ppm) based on The Romanian law—Order 756/1997 for the approval of the Regulation on the assessment of environmental pollution [33] and European Report for DG Environment, regarding HMs in soil [34].
Values (ppm)SymbolPbCdCrNiCuZn
Normal values for RomaniaNVR201302020100
Alert threshold values for Romania *ATVR50310075 (50 *)100300
Intervention threshold values for RomaniaITVR1005300150200600
* Alert threshold value for Ni, according to Order 756/1997 [35].
Table 10. Normal values for the Netherlands and intervention thresholds for heavy metals in soil (ppm) based on old (*) and new (**) Dutch lists [37].
Values (ppm)SymbolPbCdCrNiCuZn
Normal value for the Netherlands *NVN5011005050200
Investigation is required *IRN1505250100100500
Cleanup is required *CRN600208005005003000
Target value in the Netherlands **TVN850.81003536140
Intervention value in the Netherlands **ITVN53012380210190720
Table 11. Maximum values of soil contamination factor CF(HM) obtained in A and B studies.
Maximum Identified CF(HM) ValueCF(Pb)CF(Cd)CF(Cr)CF(Ni)CF(Cu)CF(Zn)
Landfill
Romania Sag-Parta (B-Study)2.1255.671.953.192.437.28
Other investigated References (A-Study)
(**) Nigeria (Ibadan) [38]41.75181.112.151.5058.2738.90
Alger (Hammam) [39]3.5517.780.830.902.861.39
Ethiopia (Tepi) [40] 3.3925.11--10.2212.83
India (Madurai Tamilnandu) [41]-171.672.151.507.465.65
(**) Multiple19.713.251.100.4723.995.35
A double star (**) is used to show the comparation between CF(HM) in soils corresponding to two different landfills: one from Romania (the landfill from Sag-Parta) in 2007, prior to closure; and a landfill from Nigeria.
Table 12. Environmental HM contamination indices.
Country/SitePILIgeo
(Pb)
Igeo
(Cd)
Igeo
(Cr)
Igeo
(Ni)
Igeo
(Cu)
Igeo
(Zn)
Er
(Pb)
Er
(Cd)
Er
(Cr)
Er
(Ni)
Er
(Cu)
Er
(Zn)
RI
1SPR2.52−0.354.05−1.251.090.700.265.88743.331.2615.9612.141.79780.37
2SPR2.12−0.423.78−1.280.350.61−0.065.59616.671.249.5711.431.44645.93
3SPR2.14−0.354.33−1.720.270.390.145.88906.670.919.049.821.65933.98
4SPR1.70−0.774.10−1.90−0.230.13−0.254.41773.330.806.388.211.26794.41
5SPR2.06−0.775.10−1.980.500.19−0.324.411546.670.7610.648.571.201572.25
6SPR2.02−0.675.21−1.650.160.00−0.474.711670.000.968.407.501.091692.65
7SPR2.24−0.504.58−1.200.220.56−0.175.291076.671.308.7211.071.331104.39
8SPR1.86−0.674.88−1.72−0.500.39−0.544.711326.670.915.329.821.031348.46
9SPR1.69−0.774.53−2.86−0.500.65−0.034.411036.670.415.3211.791.471060.07
10SPR1.89−0.354.16−2.58−0.120.610.265.88806.670.506.9111.431.80833.19
11SPR1.95−0.284.57−2.20−0.010.65−0.476.181070.000.657.4511.791.091097.15
12SPR1.98−0.354.76−1.72−0.310.61−0.585.881223.330.916.0611.431.001248.62
13SPR1.96−0.424.50−1.46−0.160.61−0.765.591016.671.096.7011.430.891042.36
14SPR1.97−0.354.13−1.550.010.47−0.365.88790.001.027.5510.361.17815.99
15SPR2.15−0.214.84−1.680.220.61−0.656.471290.000.938.7211.430.951318.51
16SPR2.22−0.285.02−1.440.240.61−0.786.181463.331.118.8311.430.881491.75
17SR1.35−0.673.81−2.11−0.89−0.58−0.484.71630.000.704.045.001.07645.52
18PNR1.33−0.033.22−0.62−0.52−1.81−1.297.35420.001.965.212.140.61437.28
19DR1.670.501.83−0.58−1.10−0.580.8910.59160.002.003.515.002.78183.88
20MR1.310.501.64−0.55−1.14−0.87−0.7510.59140.002.043.404.110.89161.03
21BR0.32−0.58−0.43−6.11−2.33−3.39−0.495.0033.330.041.490.711.0741.65
22DR1.540.033.79−0.040.84−1.81−2.567.65623.332.9113.402.140.25649.69
23GR1.710.232.05−0.51−0.82−0.220.408.82186.672.114.266.431.98210.26
24TR1.34−0.422.72−0.060.85−1.81−2.265.59296.672.8713.512.140.31321.09
25VR1.23−0.213.810.380.35−3.39−2.656.47630.003.899.570.710.24650.89
26MNR3.210.333.740.33−0.310.222.289.41600.003.766.068.757.27635.26
Sag-Parta, Romania (1SPR-16SPR); Sag, Romania (17SR); Peciu Nou, Romania (18PNR); Deta, Romania (19DR); Moravita, Romania (20MR); Bolvasnita, Romania (21BR); Dumbravita, Romania (22DR); Giroc, Romania (23GR); Timisoara, Romania (24TR); Varias, Romania (25VR); and Moldova Noua, Romania (26MNR). PIL: the pollution index of soil loadings; Igeo: the geo-accumulation index; E r i : the potential ecological risk index; RI: potential ecological risk assessment.
Publisher’s Note: MDPI stays neutral with regard to jurisdictional claims in published maps and institutional affiliations.