Article

Nature-Based Solutions for Storm Water Management—Creation of a Green Infrastructure Suitability Map as a Tool for Land-Use Planning at the Municipal Level in the Province of Monza-Brianza (Italy)

1
Department of Agricultural and Environmental Sciences, University of Milano, 20133 Milan, Italy
2
Department of Earth and Environmental Sciences, University of Milano Bicocca, 20126 Milan, Italy
3
Studio Geologia Sacchi, 24121 Bergamo, Italy
4
BrianzAcque s.r.l, 20900 Monza, Italy
*
Author to whom correspondence should be addressed.
Sustainability 2021, 13(11), 6124; https://doi.org/10.3390/su13116124
Submission received: 15 February 2021 / Revised: 29 April 2021 / Accepted: 24 May 2021 / Published: 28 May 2021

Abstract

:
Growing and uncontrolled urbanization and climate change (with an associated increase in the frequency of intense meteoric events) have led to a rising number of flooding events in urban areas due to the insufficient capacity of conventional drainage systems. Nature-Based Solutions represent a contribution to addressing these problems through the creation of a multifunctional green infrastructure, both in urban areas and in the countryside. The aim of this work was to develop a methodology to define Green Infrastructure for stormwater management at the municipal level. The methodology is defined on the basis of three phases: the definition of the territorial information needed, the production of base maps, and the production of a Suitability Map. In the first phase, we define the information needed for the identification of non-urbanized areas where rainwater can potentially infiltrate, as well as areas with soil characteristics that can exclude or limit rainwater infiltration. In the second phase, we constructed the following base maps: a “map of green areas”, a “map of natural surface infiltration potential” and a “map of exclusion areas”. In phase 3, starting from the base maps created in phase 2 and using Geographical Information Systems’ (GIS) geoprocessing procedures, the “Green area compatibility map to realize Green Infrastructure”, the “map of areas not suitable for infiltration” and the final “Green Infrastructure Suitability Map” are created. This methodology should help municipal authorities to set up Green Infrastructure Suitability Maps as a tool for land-use planning.

1. Introduction

Land take and soil sealing are the most evident and worrying consequences of growing and uncontrolled urbanization. Climate change, with an associated increase in the frequency of intense meteoric events, have led to an increasing number of flooding events in urban areas due to the insufficient capacity of conventional drainage systems.
Urban rainwater drainage systems are essential infrastructures for cities, which are needed to collect and convey rainwater away. Conventional stormwater management systems (so-called gray infrastructures) are systems primarily oriented towards a single objective: the control of water quantities. In Italy, most of the grey infrastructure is represented by the sewerage network [1]. It is a “mixed network” which collects both rainwater and wastewater, then transports it to the treatment plant. Due to this network characteristic, despite significant developments, it remains difficult to implement a fully efficient conventional urban drainage system [2].
Intense urbanization over the past few decades has significantly changed land-uses and greatly increased the proportion of impermeable surfaces around the world [3,4,5]. This rise in the percentage of sealed soils has changed urban hydrological systems, as demonstrated by the increase in surface water runoff and peaks of maximum flow, the decrease in the amount of rainwater infiltrated into the soil, alterations in the recharge cycle of aquifers and the deterioration of water quality [6,7,8,9,10].
These factors, along with the combined effect of climate change-induced intense meteoric events, have caused a higher frequency of flooding in urban areas [11].
At present, there exists a need to consider other important aspects of water management in urban environments: the quality of the water itself, the ecological and recreational value of locations and their visual quality, the aesthetic aspect and architectural form of drainage systems and the possibility of reusing the volumes of water conveyed [12].
Over the last two decades, the academic and professional worlds have increasingly investigated the effectiveness of using Nature-Based Solutions (NBS) for the creation of a multifunctional green infrastructure, both in urban areas and in the countryside. The European Commission defines NBS as “solutions that are inspired and supported by nature, which are cost-effective, simultaneously provide environmental, social and economic benefits and help build resilience. Such solutions bring more and more diverse, nature and natural features and processes into cities, landscapes and seascapes, through locally adapted, resource-efficient and systemic interventions. Nature-based solutions must benefit biodiversity and support the delivery of a range of ecosystem services” [13].
Nature-based solutions can contribute to stormwater management both by reducing the volume and flow rate of stormwater runoff and removing contaminants from stormwater. Nature-based solutions such as urban parks and open spaces, wetlands, green roofs, bioswales, rain gardens and detention and retention ponds promote water storage and infiltration, reducing stormwater runoff [14,15,16]. Cities with combined sewer infrastructure will see improvements from nature-based solutions arising from reductions in stormwater quantity and reduced sewage overflows [16].
Nature-based solutions are attractive in combination with grey infrastructure, not only for stormwater management but also for properly considering the full spectrum of co-benefits and their integration within wider GI networks [16,17].
The interdisciplinary concept of ecosystem services (the benefits in terms of goods and services to humans provided by nature) [18] helps to understand the suite of services that the different types of NBSs deliver to the human society, among which we can find stormwater management [16].
The scientific literature related to NBSs for stormwater management has presented a diversified terminology to describe their principles and practices, in relation to local situations and different contexts. Different terms have been used to define similar concepts in different parts of the world, sometimes generating contradictions and confusion [14].
The term Low Impact Development (LID), used mainly in North America, refers to small-scale water treatment works close to the point of origin of runoff [19], while the term Best Management Practice (BMP) describes interventions and practices designed to prevent pollution [14]. Water Sensitive Urban Design (WSUD) has been used since the early 1990s in Australia, with the main objective of managing the water balance, while the concept of Integrated Urban Water Management (IUWM) refers, more broadly, to the integrated management of all parts of the water cycle at the catchment level.
The term Sustainable Drainage Systems (SuDS) originated from the UK and it includes a range of techniques used to drain water by restoring drainage conditions existing prior to site development [20].
The concept of Green Infrastructure (GI) was developed in the USA in the 1990s [21] and represents a term referring not only to rainwater management. Its origins were derived from landscape architecture and landscape ecology.
Green Infrastructure can be defined as “a strategically planned network of high quality natural and semi-natural areas with other environmental features, which is designed and managed to deliver a wide range of ecosystem services and protect biodiversity in both rural and urban settings. […] One of the key attractions of GI is its ability to perform several functions in the same spatial area, in contrast to most ‘grey’ infrastructures, which usually have only one single objective […]. Green Infrastructure is made up of a wide range of different environmental features that can operate at different scales, from small linear features such as hedgerows or green roofs to entire functional ecosystems […]. Each one of these elements can contribute to GI in urban, peri-urban and rural areas, inside and outside protected areas” [22].
Green Infrastructure plays an important role in stormwater management (in addition to the existing grey infrastructure), enhancing natural processes such as infiltration, evapotranspiration and filtering and reuse of water [23]. Green Infrastructure for stormwater management provides several benefits, such as rainwater detention, flood alleviation, fewer sewer overflow events and the reduction of management costs for grey infrastructure [24,25].
In Italy, several regional authorities have adopted laws and regulations aimed at planners and designers in order to satisfy the hydraulic-hydrologic invariance (HHI) principles in land-use plans and new developments design (i.e., the maximum outflow rate should be at greenfield runoff) [26]. These principles can be carried out by dimensioning appropriate grey infrastructure (e.g., water storage tanks) or nature-based solutions to balance the soil sealing effects [27].
In 2017, the Lombardy Region adopted a new regulation related to HHI which obliges municipalities to set up a hydraulic risk management plan that should identify, among other things, areas suitable for rainwater infiltration.
The aim of this work was to develop a methodology to identify areas where there was the potential to install Green Infrastructure for stormwater management at the municipal level, in particular infiltration SuDSs which reduce both the flow and the volume of runoff [28]. This methodology should help municipal authorities to set up Green Infrastructure Suitability Maps as a tool for land-use planning [29,30,31,32,33]. This work is part of a broader study involving several entities (universities and professionals), promoted by BrianzAcque SRL, a public water management company for municipalities in Monza-Brianza province (Italy). The paper presents the results of the first part of the study. In the second part (still ongoing) we are analyzing the existing drainage network (the sewer network) in order to define where and how to carry out specific interventions to solve the problems of insufficiency of the drainage network, through the modeling of the networks.

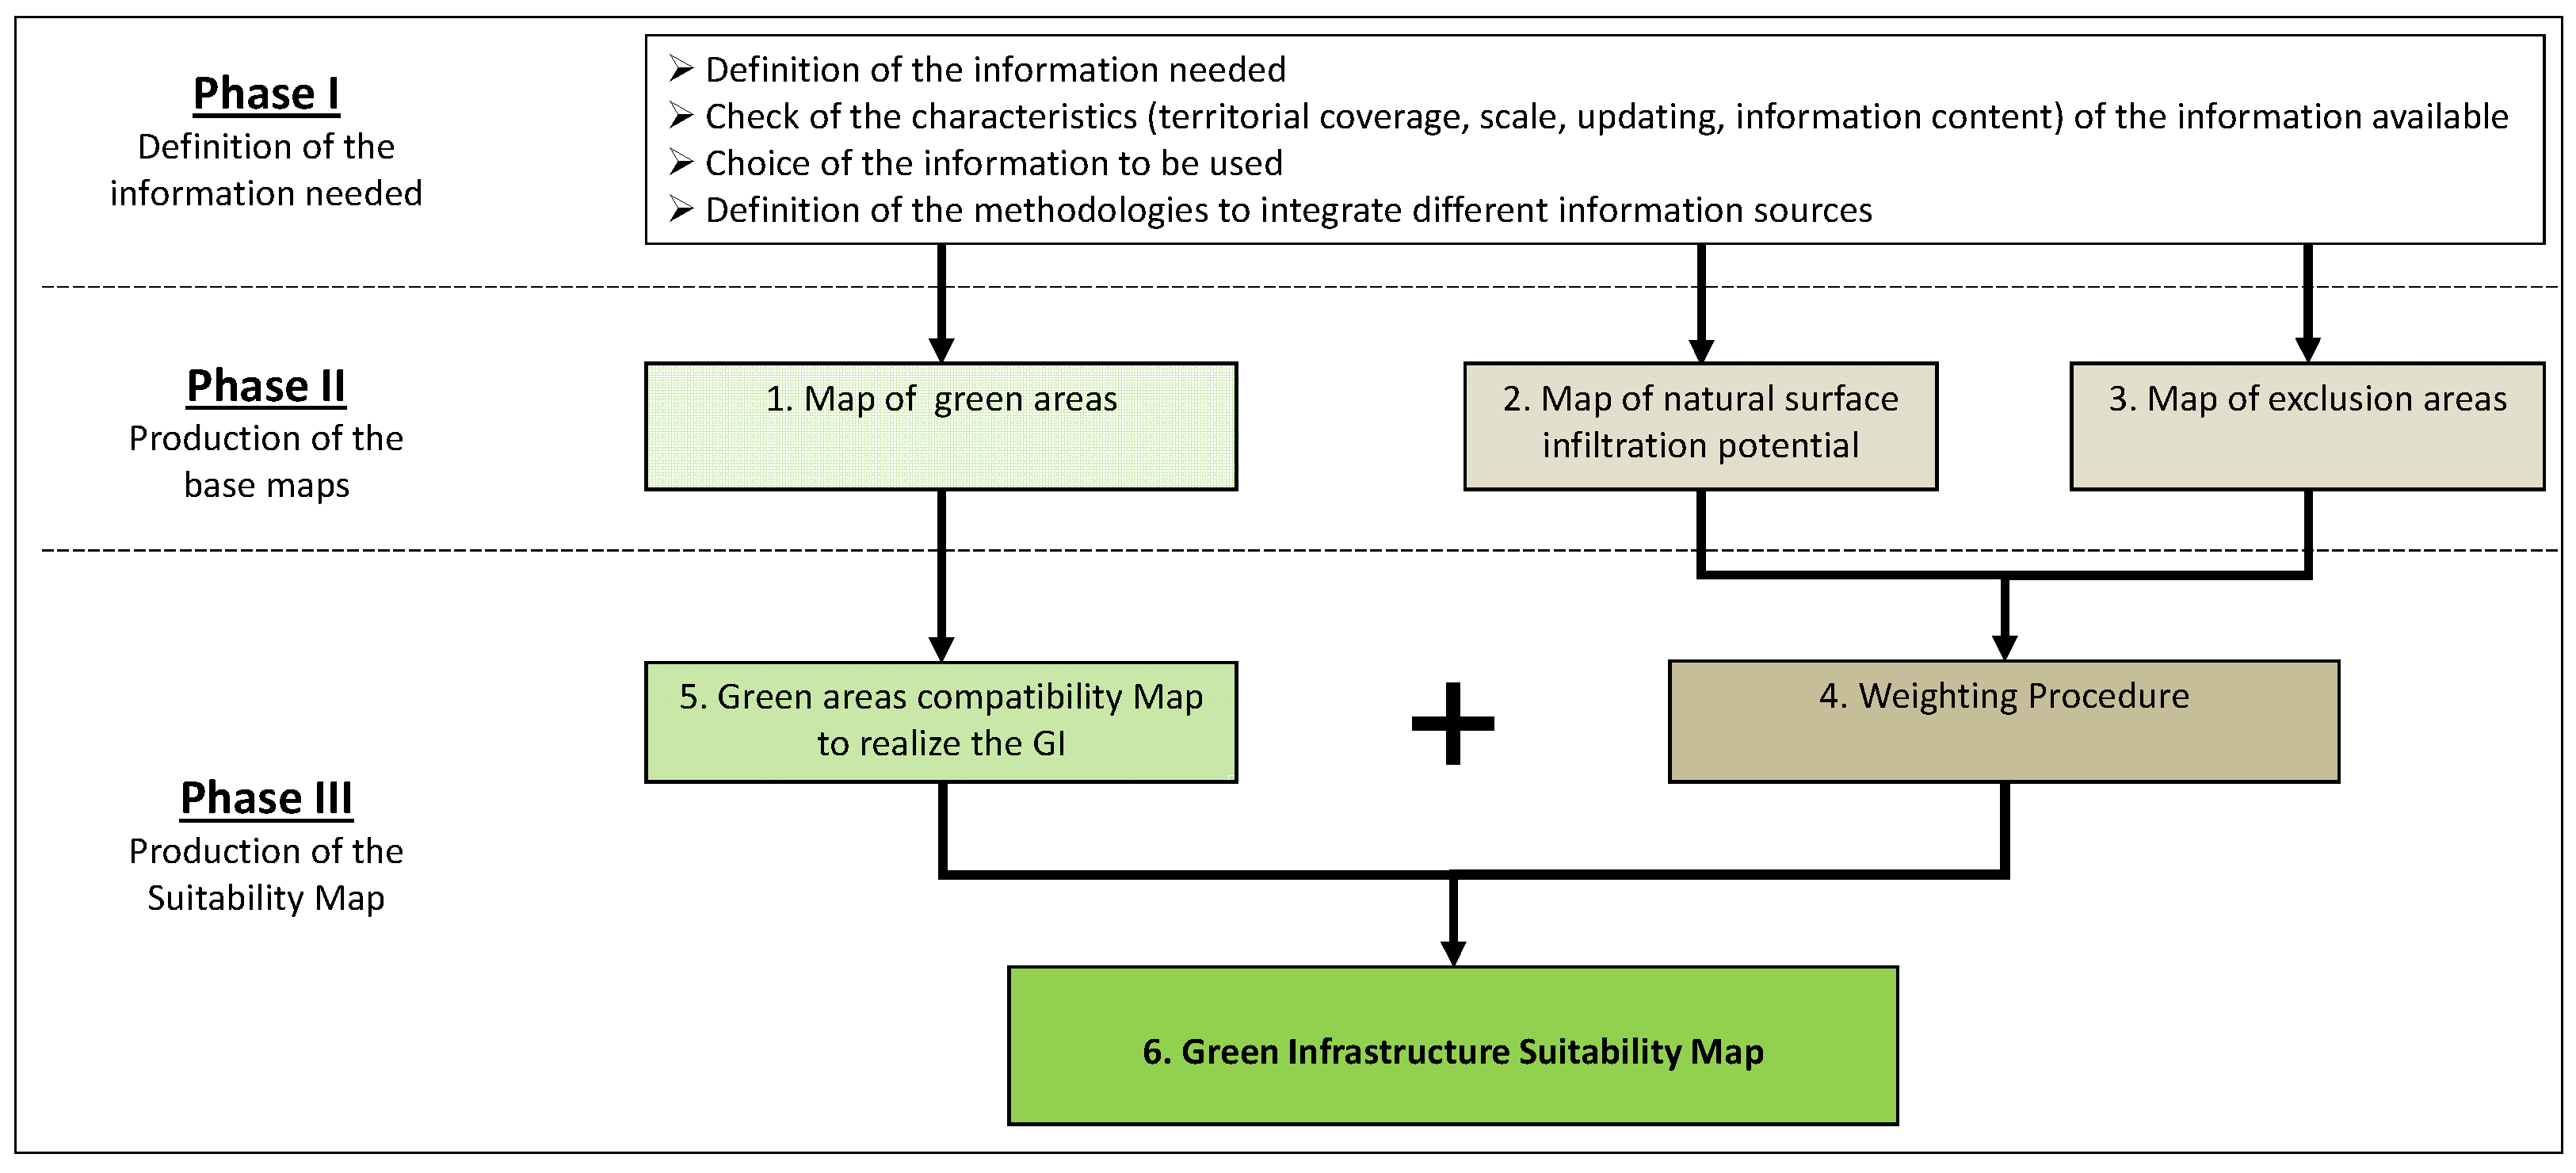
2. Materials and Methods

In a preliminary step, the factors to be taken into consideration for identifying the areas suitable for the realization of green infrastructure for stormwater management were analyzed through a review of the available literature.
Several authors [28,34,35,36,37] have agreed about the use of Geographical Information Systems (GIS) as support systems for the localization of NBS. GIS allows users to manage and consider many territorial characteristics, overlay geographic data layers, develop models based on raster and vector data, support choices of land-use planning, and define possible alternative scenarios.
From the review of the methodologies proposed by various authors, it emerged that the main factors considered are slope, soil type and land use.
The slope determines a considerable influence on the localization of NBS, limiting infiltration and increasing surface runoff. According to several authors [29,35,38], natural solutions for detention and infiltration should be realized in areas with slopes not exceeding 15%. In this sense, zones with inadequate slopes represent areas to be excluded in the definition of green infrastructure.
With regard to the type of soil, the most important parameter considered is the infiltration potential, expressed as the saturated hydraulic conductivity value (m/s) [35,39]. These data can be derived from pedological–lithological maps, if available, with a good level of detail, or through direct survey and infiltration testing.
In urban areas, the permeability characteristics of soils can vary significantly, due to compaction caused by buildings and other uses [40]; for these reasons, direct surveys are generally necessary to define the characteristics of the infiltration potential at a specific site. Tredway and Havlick [41] also underlined the usefulness of carrying out, where necessary, any work to improve the infiltration rate of the soil.
Land use is a fundamental topic as the possibility of natural infiltration depends on the presence of non-impervious surfaces. Land use and the proportion of green space available in a given area determine the behavior of surface waters and affect exposure to floods [28,29,30]. Land-use maps provide information about the green areas that are compatible with the possibility of infiltration and, at the same time, allow for the identification of different impervious surfaces and the estimation of possible surface runoff [28,29,30,31,42,43,44].
The proposed methodology was defined on the basis of three phases (see Figure 1): (I) Definition of the information needed; (II) Production of the base maps; and (III) Production of the Suitability Map. We further present, as a case study, an application of the methodology to the municipality of Caponago (in the province of Monza-Brianza).

2.1. Definition of the Information Needed (Phase I)

During this phase, we defined the information needed for the identification, on the one hand, of non-urbanized areas where rainwater can potentially infiltrate and, on the other hand, areas with soil characteristics that can exclude or limit rainwater infiltration. Secondly, we selected the most suitable information based on their availability, territorial coverage, scale and updating.
Most of the data analyzed were either produced by the Lombardy Region and made available on their geoportal or produced by the municipalities involved.

2.2. Production of the Base Maps (Phase II)

In phase II, the following base maps were produced: a map of green areas, a map of natural surface infiltration potential and a map of exclusion areas.

2.2.1. Map of Green Areas

In relation to the green areas potentially available for infiltration (phase II, map 1 of Figure 1), we followed a specific procedure, which is shown in Figure 2.
First of all, an analysis of the available geographical databases concerning the theme of land-use/land-cover was carried out. In particular, the following data sources were analyzed:
  • The land-use database “DUSAF”, produced by Lombardy Region;
  • The topographic database “DBT”, produced by Lombardy Region and Municipalities;
  • Maps contained in Municipal urban plans, produced by Municipalities.
The Land-use database DUSAF is a geographical database produced for the last 20 years by the Lombardy Region. The first version was created by the photo-interpretation of digital orthophotos (IT2000 program, frames from 1998 to 1999); subsequent updates were made in 2005, 2006, 2007, 2009, 2012 and 2015, up to the latest update available with orthophotos in 2018 (DUSAF 6). The database has a level of detail compatible with the scale of 1:10,000 (minimum mapped area = 1600 m2) and uses a legend structured in classes and subclasses. It is available, for the entire Region, in shapefile format.
The Topographic database DBT represents the reference base of the Regional Information System at the municipal level. Its creation was overseen by the regional law n.12/2005 and it has been produced by the municipalities at 1:1000–1:2000 scales. With reference to vegetation, the DBT includes agro-forest areas (agricultural crops, woods, pasture—uncultivated, areas temporarily not vegetated) and urban green areas (green areas, rows, trees). The update year differs from municipality to municipality and varies from 2007 to 2015; it is available as a shapefile for most of the regional territory.
The maps of the municipal urban plan are specific to each municipality; in the case of Caponago, information on green areas is contained in the maps “Destination of land use” and “Components of environmental systems” (2011, scale 1:5000), which identify agricultural areas, wooded areas and green areas of public interest, such as parks and gardens. They are only available in pdf format.
From a comparison of the above-mentioned databases, the following considerations emerged: The DUSAF database represents the official land-use map of the Lombardy Region, which is particularly suitable for obtaining information about green areas in extra-urban contexts (e.g., agricultural, wooded and semi-natural areas); however, the level of detail of the DUSAF may not be sufficient in the urban context. It has been updated to 2018.
The DBT contains information with a greater level of detail in the urban context and includes, in addition to public green spaces, private areas. It contains green areas connected to the transport network (e.g., traffic islands, roundabouts). The DBT of Caponago has been updated to 2015.
The maps of the Municipal urban plan (PGT) of Caponago contain information on green areas that are less detailed and less updated than the DUSAF and DBT. In the urban context, only public green areas are detected (not private).
Based on the information available, and the objectives of the project, we defined the classes of green areas to map as:
  • Agricultural, wooded and semi-natural areas;
  • Urban green areas;
  • Green areas connected to the transport network.
In order to have the most updated and accurate data, we decided to map the green areas by integrating information from different sources.
We used the DUSAF database as a data source for agricultural, wooded and semi-natural areas (1), mainly located in the extra-urban context and the DBT green areas connected to the transport network (3).
For urban green areas (2), the choice of data source (DBT or PGT) was made by evaluating the following conditions (in hierarchical order):
  • Availability of data in shapefile format, including not only public green areas but also private green areas (i.e., annexed to residential areas, industrial areas etc.);
  • Completeness of the data related to green cover;
  • Up-to-date data (we preferred to use the most recent data).
In this work, we used the DBT for urban green areas (2), (as shown in Table 1) as it satisfied all three conditions (unlike the PGT); it is available in shapefile format, it is complete with regard to green cover and it is more up-to-date.
After selecting the databases to be used, we proceeded with the extraction of the data and the creation of the final database. With regard to agricultural, wooded and semi-natural areas mainly located in the extra-urban context, polygons were extracted from the DUSAF database. With regard to urban green areas, polygons were extracted from the DBT (only for the portion of the territory in the urban context). A check was carried out in order to identify any changes in land-use through visual analysis of the most recent satellite images available (Google, ESRI) and digital orthophotos available on the Lombardy geoportal.
With regard to green areas connected to the road network, polygons were extracted from the DBT. All the derived layers were then merged into a single shapefile, creating a field containing the final classification, as reported in Table 2.
As required by the Lombardy regional law, we analyzed the whole municipal territory. This is also coherent with the need to give land-use planners information related to all the not yet urbanized areas of the municipality, in order that they can take into account different factors for the decision of the new urbanizations to include in the land use plans.
The map of green areas (phase II, map 1 of Figure 1) was produced at 1:5000 scale (Figure 3).

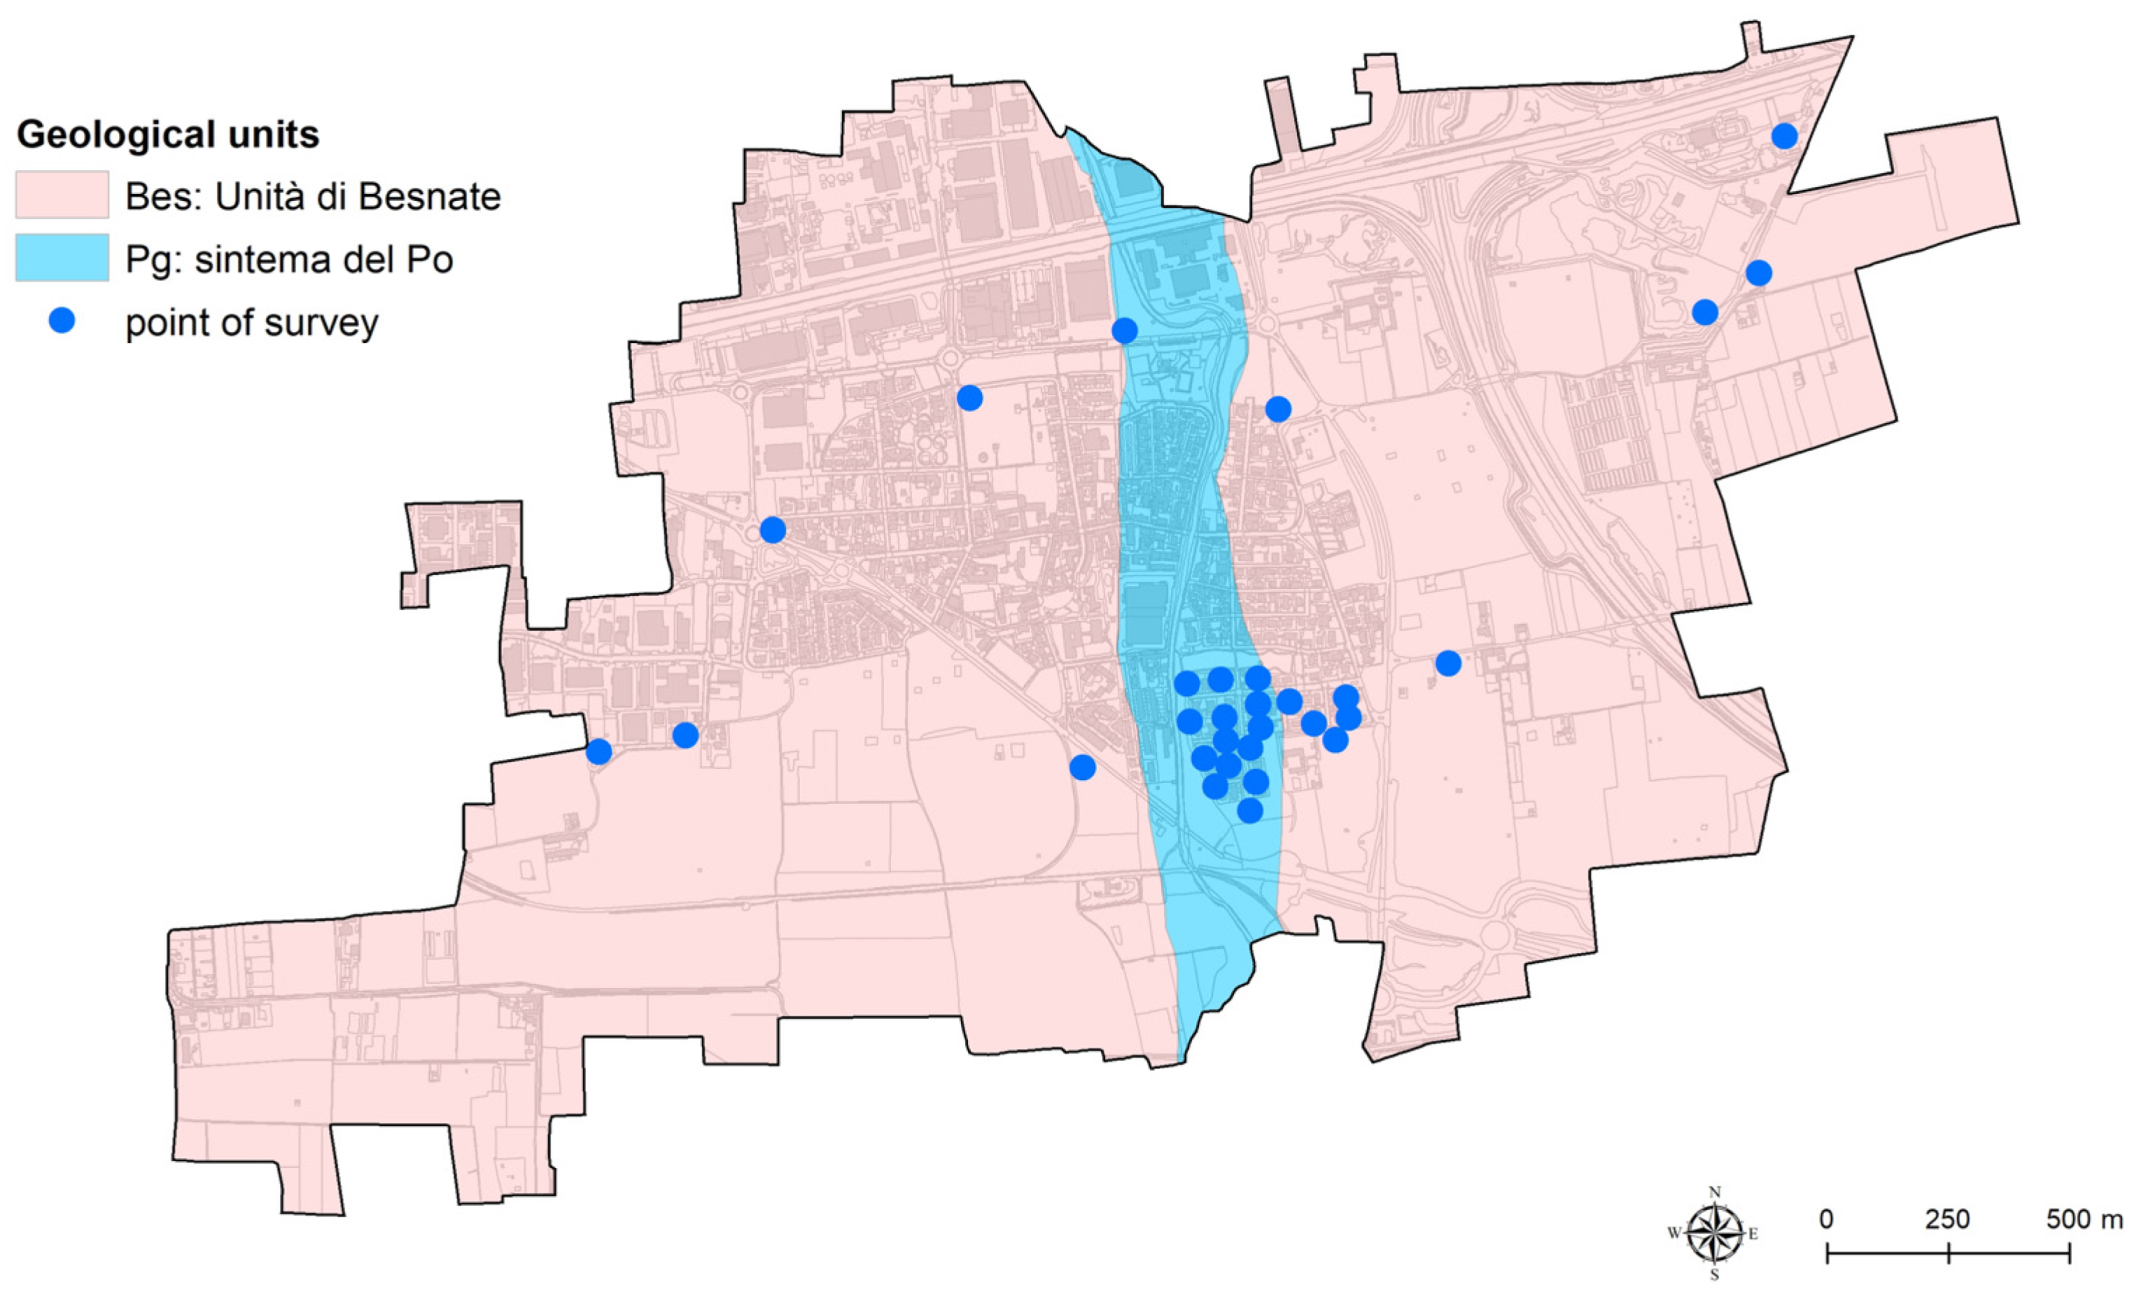
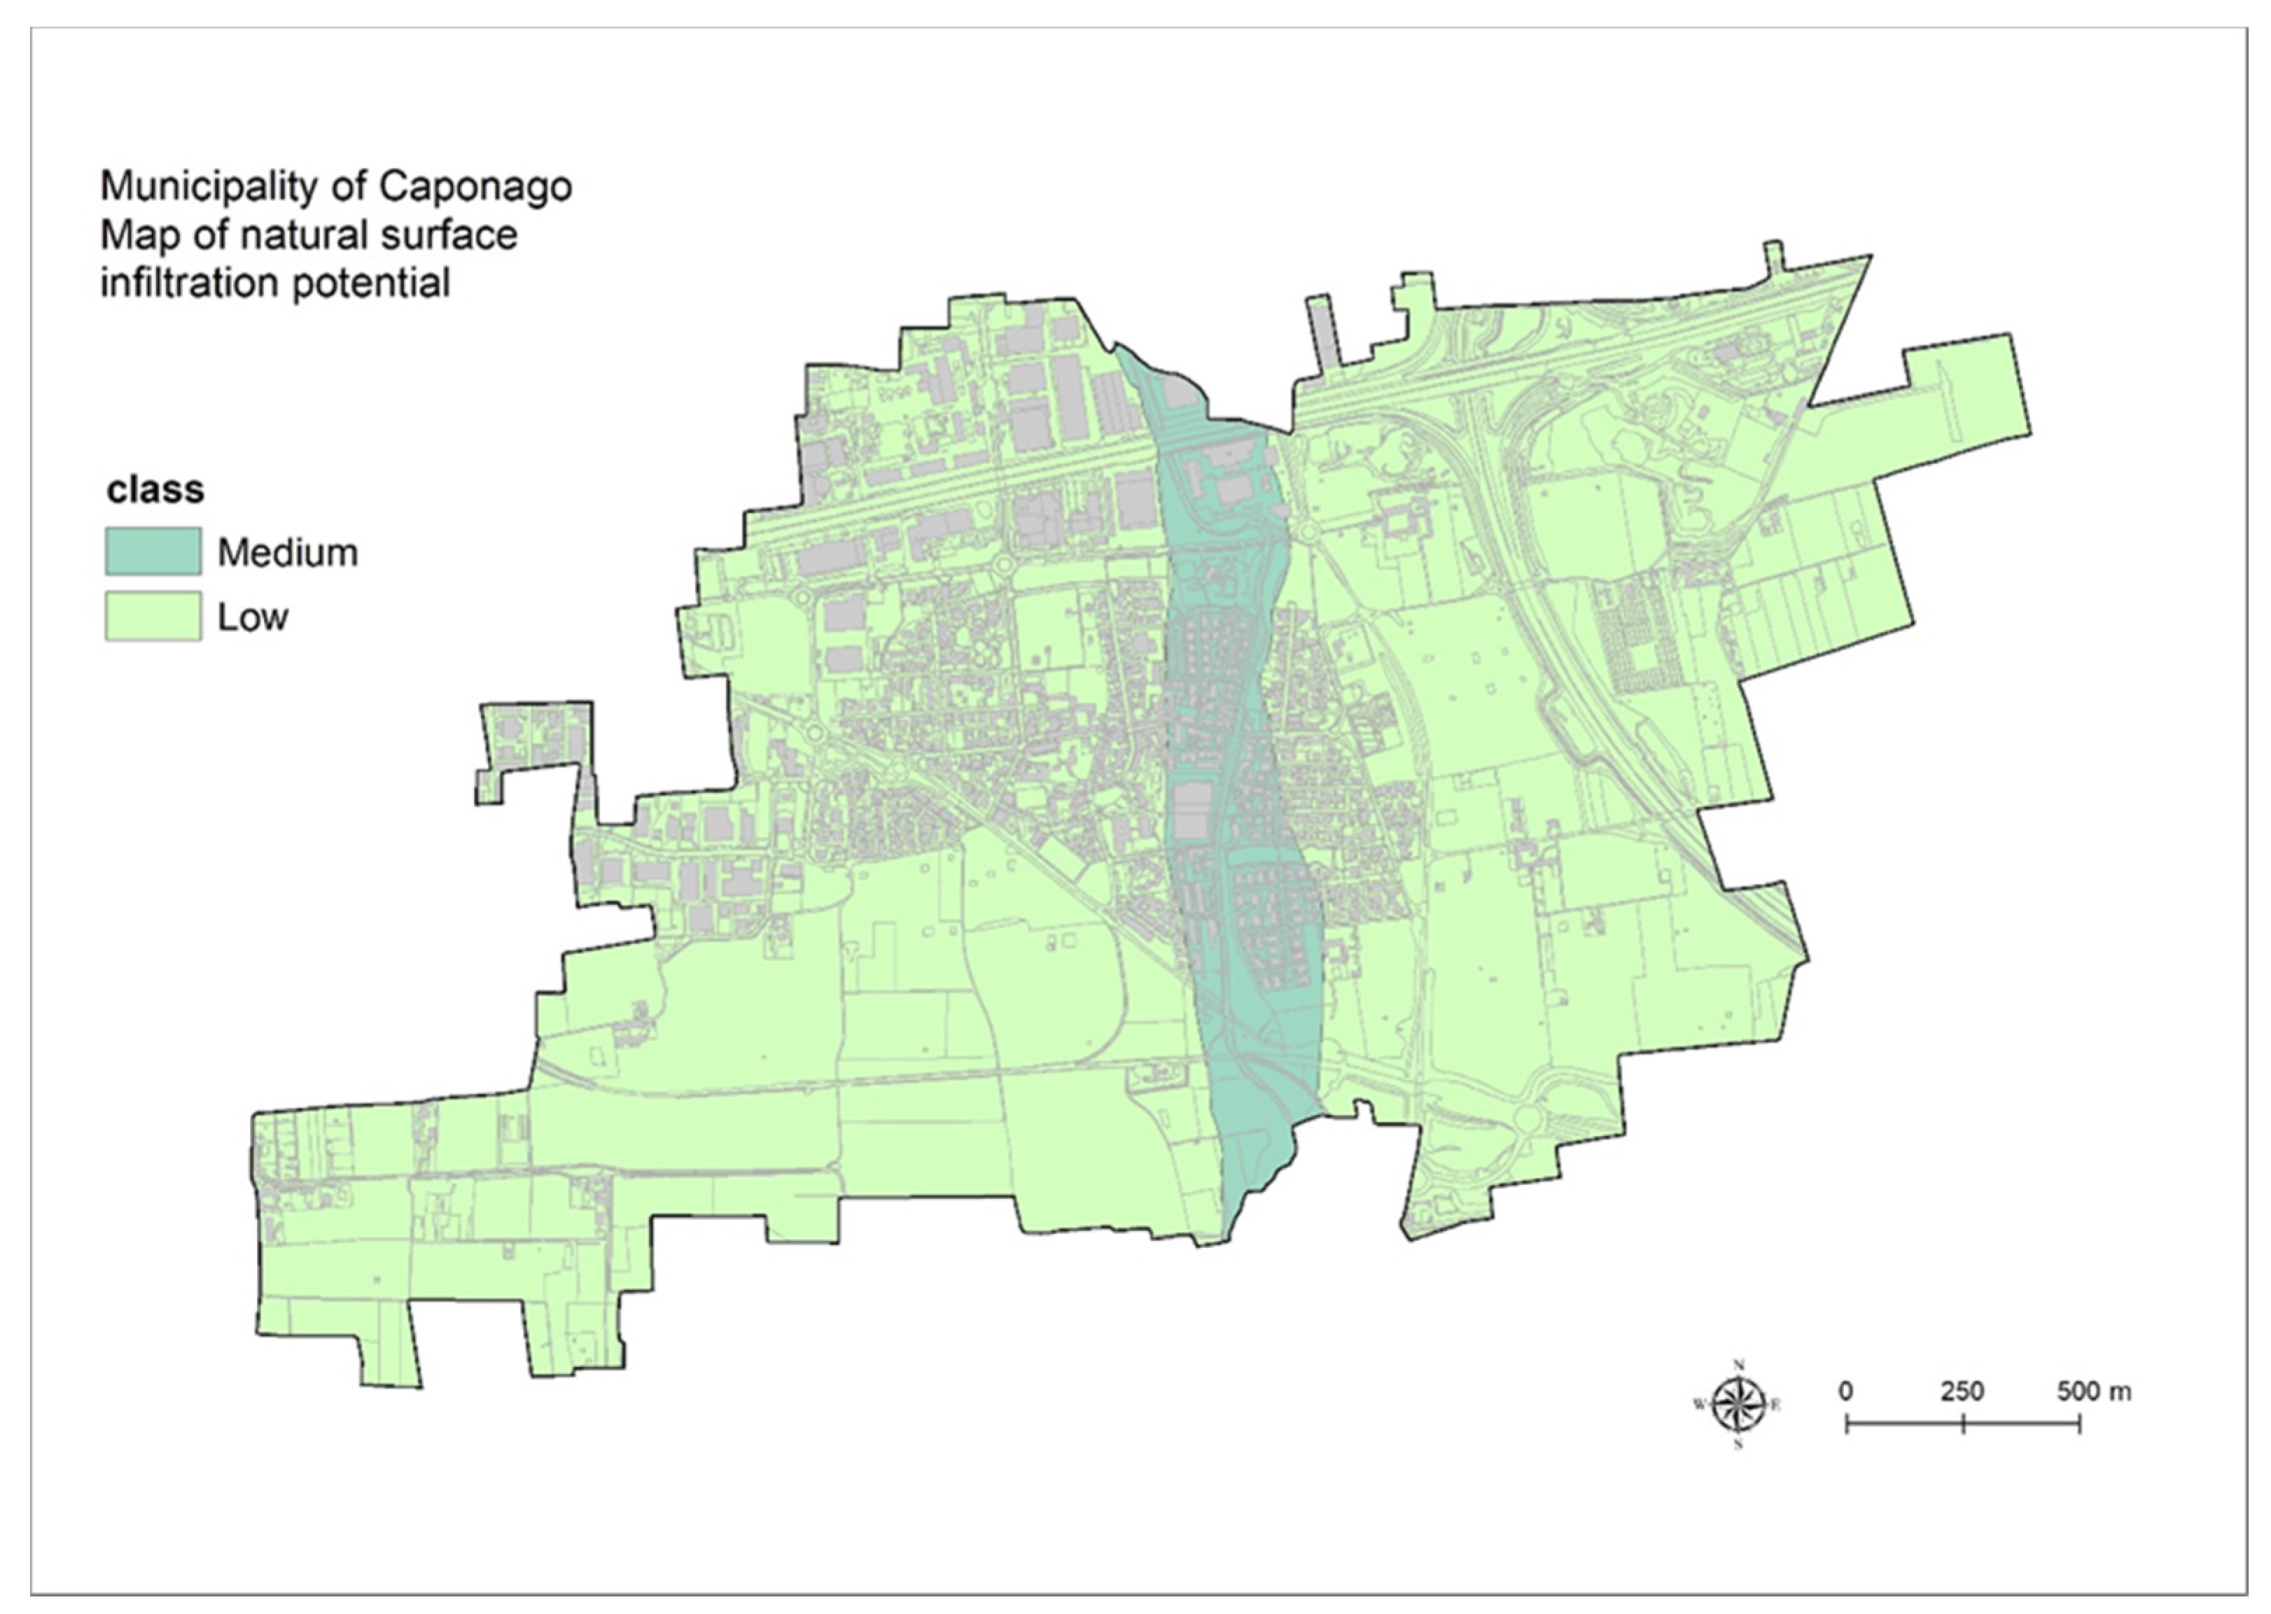
2.2.2. Map of Natural Surface Infiltration Potential

The second map of the procedure (phase II, map 2 of Figure 1) is related to the natural surface infiltration potential. It expresses the capacity of water to infiltrate through the most superficial layers of the soil. It is useful for the study of hydraulic risk and the evaluation of infiltration strategies. The map was built through a zoning of the territory into geological units that are “average homogeneous”, from the point of view of infiltration, for each of which a saturated hydraulic conductivity value (m/s) was estimated. The zones were derived from the geological cartography available—in particular, from the Regional Geological Map at 1:10000 scale (“CARG” project)—integrated with other information from the geological cartography of the municipal urban plan.
The infiltration values were derived from an empirical estimation of the permeability of the different lithofacies, based on the available surveys and corrected by infiltration tests.
With regard to the study area, the geological units were derived from the geological map of the municipal urban plan. The Regional Geological Map (CARG) is not available at present. The delimited units were “average homogeneous”, from the point of view of the surface infiltration potential and may present heterogeneity in different specific sites (Table 3).
Once zoning was carried out, a saturated hydraulic conductivity value was assigned to the units and appropriately reclassified into hydrofacies, thanks to the availability of infiltration data obtained by surveys at variable depth (Figure 4).
The association of infiltration values derived from infiltration tests to the geological units allowed us to estimate a reference value for each unit and, thus, to proceed to the mapping of the infiltration potential. Being a parameter that varies over several orders of magnitude, it was considered appropriate to consider the logarithm of the infiltration potential and to average the available values.
Table 4 shows the reference values of saturated hydraulic conductivity (m/s) related to the different classes of infiltration potential, whereas Table 5 shows the attribution of the final class of surface infiltration potential to each geological unit in the study area.
The map of natural surface infiltration potential (phase II, map 2 of Figure 1) is represented in Figure 5.

2.2.3. Map of Exclusion Areas

The third map of the procedure (phase II, map 3 of Figure 1) is related to the exclusion areas. These are portions of the territory that have hydrogeological characteristics such that the infiltration of water could represent a risk to the safety of the population. These areas were identified on the basis of laws and regulations and were derived from various territorial plans, such as:
  • The Flood Risk Management Plan (PGRA) of the Po river basin, as established from the EU Floods Directive (60/2007);
  • The Hydrogeological Plan of the Po river (PAI), provided by the Po river basin authority;
  • A geological feasibility map of the municipal urban plan;
  • A geological general map of the municipal urban plan.
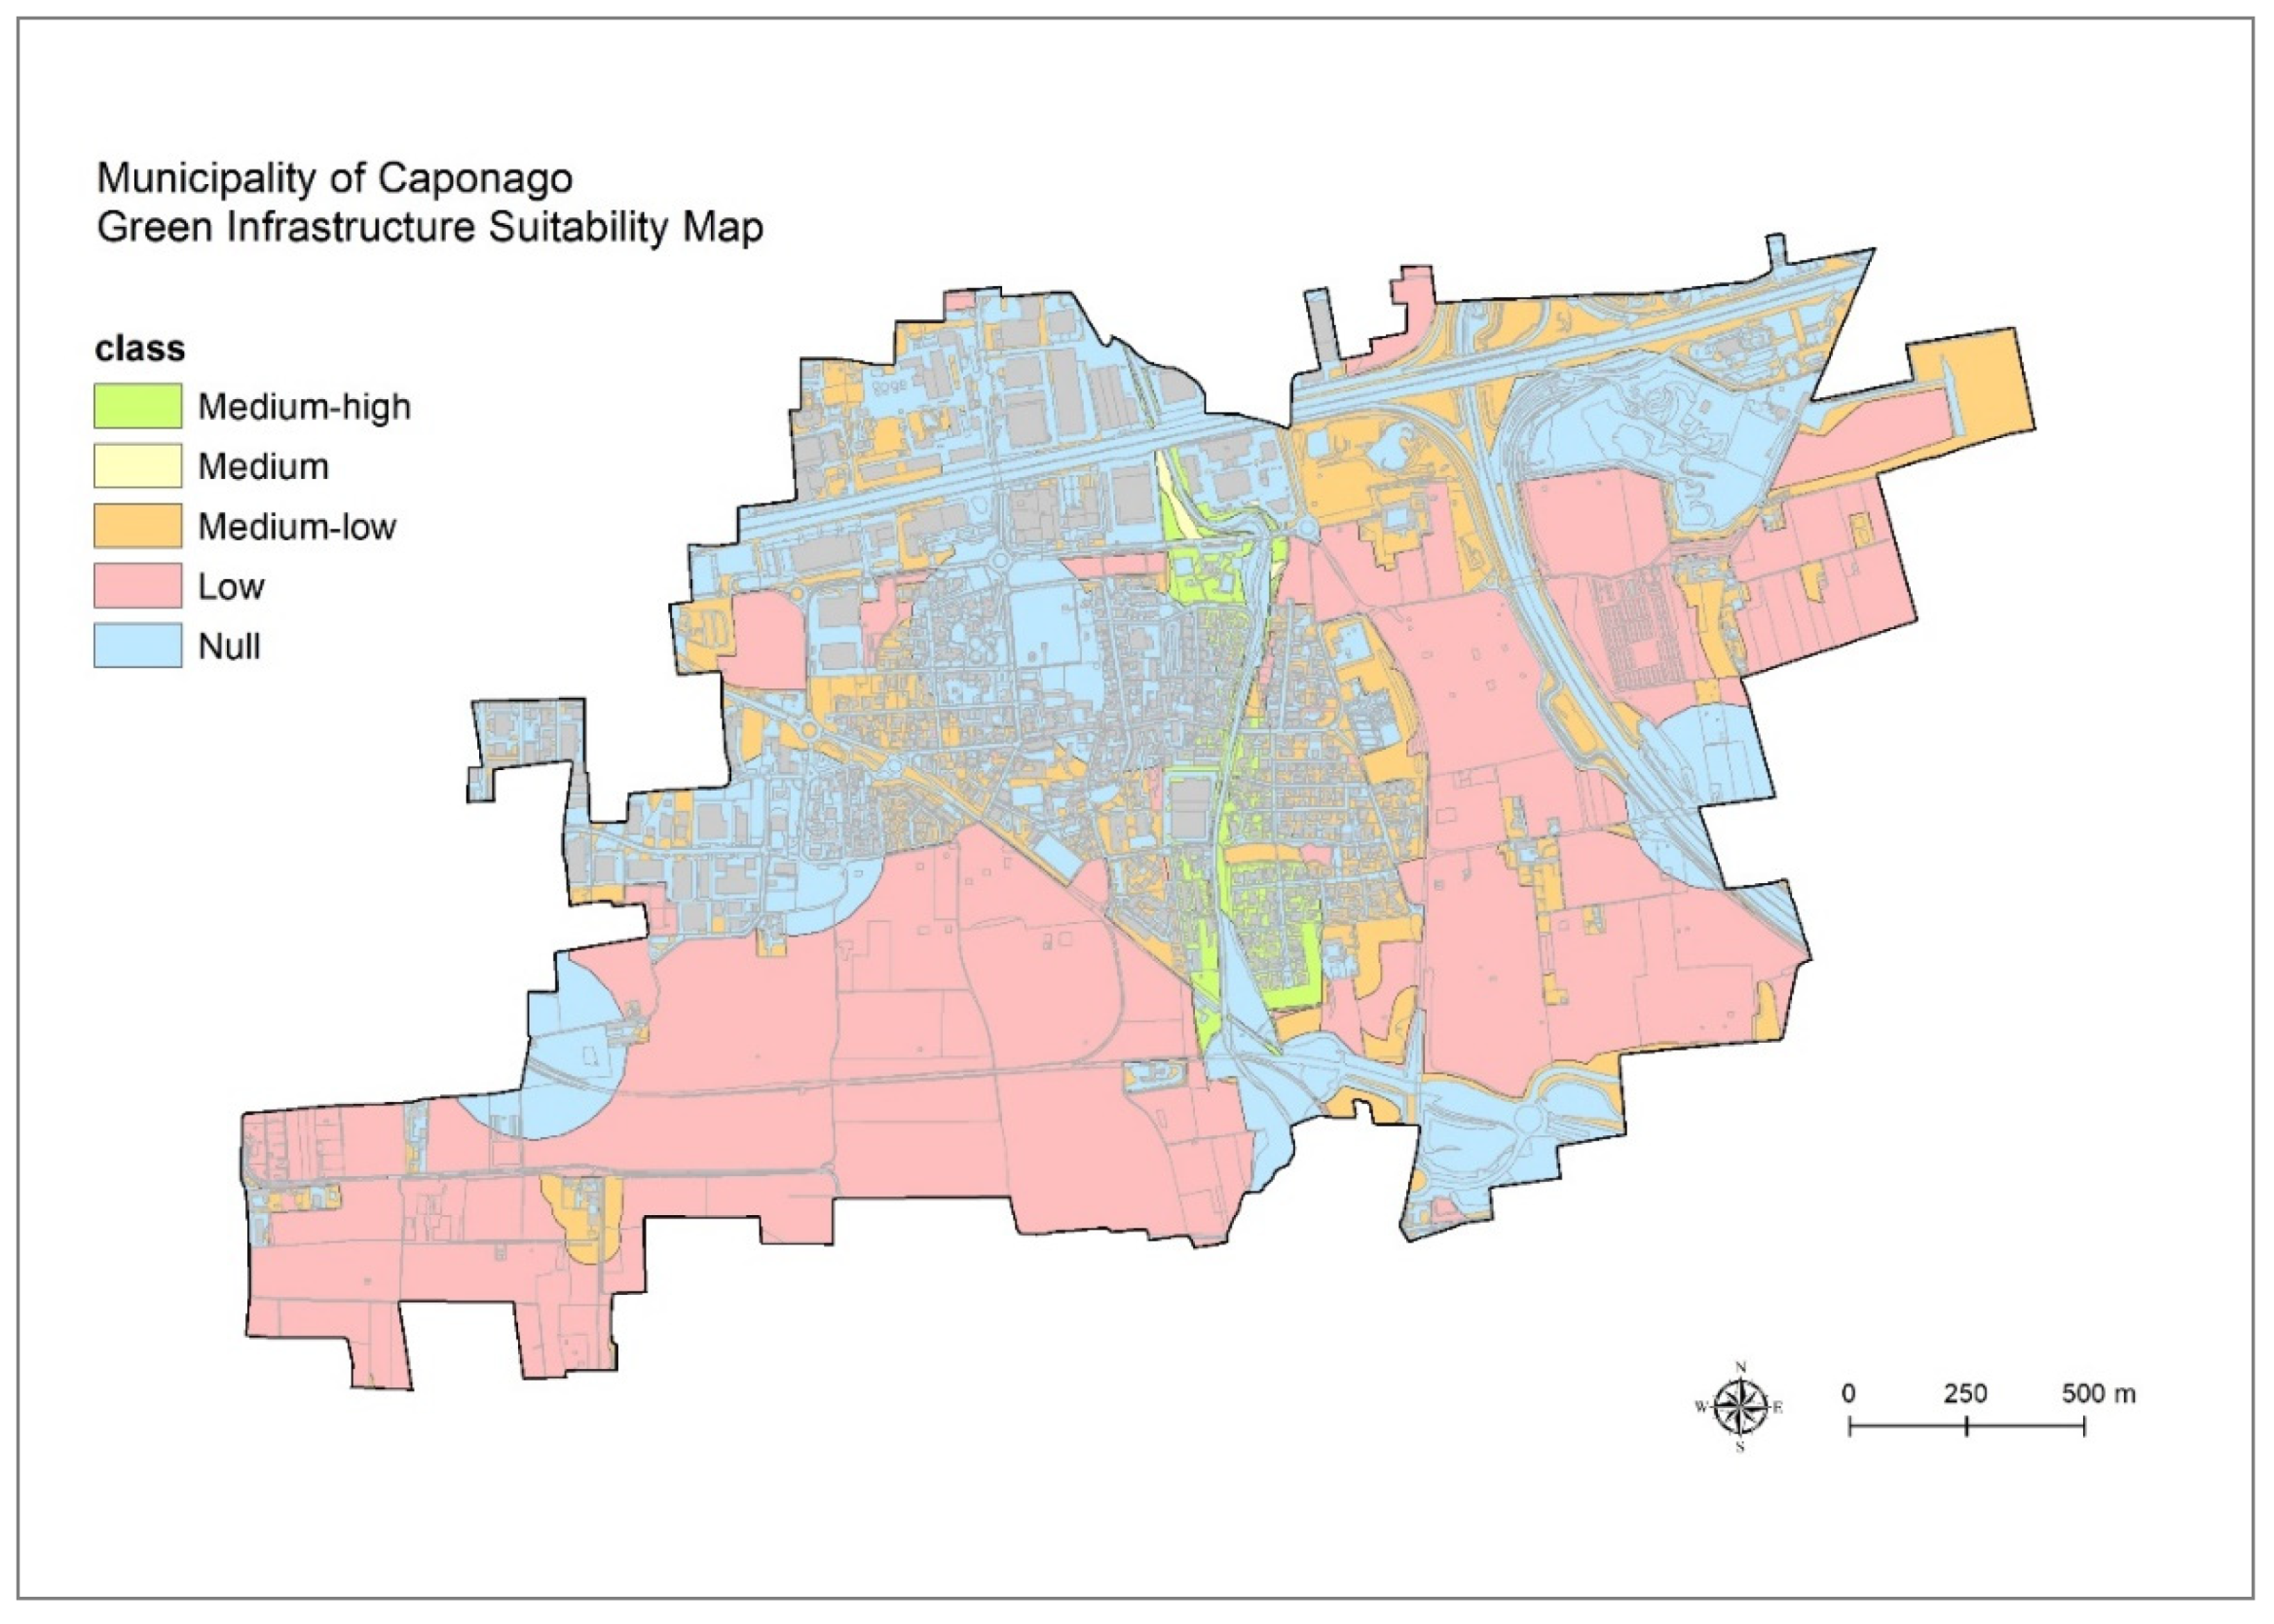
The layers, in shapefile format, were derived from these data and the map of exclusion areas was produced, as shown in Figure 6.
As already mentioned, land morphology must be also considered in order to exclude areas with inadequate slopes. The construction of a Digital Terrain Model (DTM) allowed us to identify areas with a slope greater than 15%. In the territory of Caponago, the slope never exceeded this value.

3. Results

In phase III of the procedure, first the “Green area compatibility map to realize the Green Infrastructure” (phase III, map 4 of Figure 1) was created. Then, using a GIS overlay procedure, this map was combined, after the assignment of appropriate weights, with the Map of natural surface infiltration potential (phase II, map 2 of Figure 1) and the map of exclusion areas (phase II, map 3 of Figure 1), in order to create the final Green Infrastructure Suitability Map (phase III, map 5 of Figure 1).

3.1. Green Area Compatibility Map to Realize the Green Infrastructure

We derived the “Green area compatibility map to realize the Green Infrastructure” by giving a compatibility score to each green area typology in the map of green areas. The compatibility score expresses how compatible each green area typology is with the realization of the Green Infrastructure for rainwater management.
In order to provide an appropriate compatibility score, we identified the “equipped green areas” (i.e., those with benches, playgrounds and so on) using municipal maps, satellite images and Google Street View (Figure 7).
The compatibility score was derived through the aggregation of different characteristics: Naturalness [N], Anthropic presence [A], Productive value [P] and Urban context [U]. Each characteristic was assessed by assigning a value ranging from 1 (low presence of the characteristic) to 5 (maximum presence of the characteristic).
The compatibility score was directly proportional to naturalness and urban context while being inversely proportional to the anthropic presence and productive value. Every single score was then calculated as follows:
  • Naturalness score [Ns] = [N];
  • Urban context score [Us] = [U];
  • Anthropic presence score [As] = 5 − [A] + 1;
  • Productive value score [Ps] = 5 − [P] + 1.
The Total Compatibility score [TCs] for each green area (see Table 6) was finally calculated as follows:
[ T C s ] = [ N s ] + [ U s ] + [ A s ] + [ P s ] .
Green areas were finally reclassified, according to the TCs value, into three compatibility classes: High compatibility (TCs = 16–20), medium compatibility (TCs = 10–15) and low compatibility (TCs = 4–9). The Green area compatibility map to realize the GI was then produced, as shown in Figure 8.

3.2. Weighting Procedure for Potential Infiltration and Exclusion Areas

The Green Infrastructure Suitability Map was produced by overlaying (with GIS) the Green area compatibility map to realize the GI, the map of natural surface infiltration potential and the map of exclusion areas.
The Green area compatibility map to realize the GI was, in fact, reduced by the potential infiltration of soil and the presence of areas where it is not possible to infiltrate.
For this reason, a weight (ranging from 0 to 1) was assigned to each infiltration potential class and to each exclusion area (Table 7) in order to take into account the reduction of the compatibility, which could remain unchanged (weight = 1) or decrease to a minimum (weight = 0).

3.3. Green Infrastructure Suitability Map

Once the three maps had been overlaid, the Green Infrastructure Suitability Map (Figure 9) was produced, classifying the total Green Infrastructure Suitability score into six classes [GI-Suit] (Table 8). [GI-Suit] was calculated as the product of the Total Compatibility score [TCs] and the weights [WPI] and [WEA], according to the following formula:
[ G I - S u i t ] = [ T C s ] · [ W P I ] · [ W E A ] .

4. Discussion and Conclusions

4.1. Discussion

The methodology applied to the study area allowed us to quantify the availability of green areas that are useful for the creation of GI at the municipal level.
The non-sealed areas in the municipality of Caponago cover 337.56 ha, equal to 67.28% of the municipal area (501.73 ha). The remaining areas are water (0.58%) and impervious surfaces (32.15%).
Most of these areas are agricultural, wooded and semi-natural areas (50.74% of the municipal area and 74.42% of the green areas), while urban green areas represent 15.13% of the municipal area and 22.48% of green areas. Significantly lower percentages concerned green areas connected to the transport network (Table 9).
Despite the small size of the municipality of Caponago, the characteristics of the study area are those typical of an area with intermediate land-use intensity. Valtanen et al. [9] described three study areas in the city of Lahti (Finland) according to their land-use intensity and type: from high land-use intensity (80% of impervious area) to low land-use intensity (14% of impervious area). Yao et al. [5] and Du et al. [8] reported situations relating to large Chinese cities with impervious surfaces ranging from 20% to 50%. Surma [43] reported three case studies in Poland with impervious surfaces ranging from 19.8% to 47.5%.
With regards to the areas compatible with the construction of GI, the green areas with high compatibility are close to urban areas and road networks (Figure 8) and represent 17.64% of the municipal territory and 26.22% of the total green areas. This means that about three-quarters of the permeable areas of the municipality have from medium to null compatibility with the construction of GI (Table 10).
Among the green areas with high compatibility, the prevailing class was made up of Urban green areas (14.33% of the municipal area, 21.30% of total green areas). Among the areas with medium compatibility, the main class was represented by agricultural, wooded and semi-natural areas, with 18.19% of the municipal territory and 27.03% of the total green areas.
About green areas suitable for the construction of the GI, there are no areas with high suitability. This is due to the fact that the characteristics of the soils are such that the natural surface infiltration potential is medium or low (Figure 5) and the relative maximum weight is, therefore, 0.7 (Table 7). Charlesworth et al. [28] and Muthanna et al. [36] also reported very small percentages (2.5% and 3.2%) of areas suitable for infiltration SuDS in the city of Coventry (UK) and Trondheim (Norway) respectively.
The areas with medium-high suitability (10.14 ha) represent 2.02% of the municipal area and 3% of the total green areas (Table 11). 6.05 ha are urban green areas and 4.09 are agricultural, wooded and semi-natural areas. No green areas connected to the transport network are included in the medium-high suitability class.
The agricultural, wooded and semi-natural areas are very close to the urban area (Figure 10) so they are indeed interesting for the sustainable management of rainwater. Christman et al. [27] also reported the presence of a percentage (between 5% and 22%) of non-urban areas among the high-priority GSI (Green Stormwater Infrastructure) implementation sites in the city of Philadelphia (USA).
Only 27% of urban green areas with medium-high suitability for the construction of the GI are public areas. The remaining 73% is private, 68% residential and 5% industrial (Figure 10). Dhakal and Chevalier [24] reported a similar average percentage (65–75%) of private land in five American cities (Portland, Seattle, Philadelphia, Chicago, and Syracuse), noting that incentives and other programs offered to private landowners have produced encouraging results.
The areas with medium-low suitability constitute 14.01% of the municipality and 20.82% of the green areas. The areas with low suitability represent 42.93% of the municipality and 63.81% of the green areas.

4.2. Conclusions

The proposed Green Infrastructure Suitability Map is a tool that municipal authorities can use as:
  • An informative basis in the land-use planning process in order to set up or update the municipal plan (PGT) with reference to rainwater management, in accordance with the regulations of Lombardy Region;
  • A necessary knowledge basis for the definition of municipal stormwater management plans, particularly related to the choice of the most appropriate NBS for each location.
The localization of the most appropriate intervention must be made on the basis of the assessed territorial characteristics, type of prevalent function required (e.g., detention, retention, flow control, infiltration, filtration, or evapotranspiration), context (urban or rural–natural), expected use (accessible to people or not), and maintenance needs.
Our work is still in progress. The Green Infrastructure Suitability Map is the first step towards the development of a more complete process of identifying the type of NBS which is best suited to address various specific local problems.

Author Contributions

Conceptualization, G.S. (Giulio Senes), P.S.F. and N.F.; methodology, G.S. (Giulio Senes), P.S.F., G.C. and N.F.; formal analysis, G.S. (Giulio Senes), P.S.F., G.C.; investigation, G.S., P.S.F. and G.C.; resources, P.S.F., G.C., P.F. and G.S. (Giulio Senes); data curation, P.S.F. and G.C.; writing—original draft preparation, G.S. (Giulio Senes) and P.S.F.; writing—review and editing, G.S. (Giulio Senes), P.S.F., N.F., P.F., G.S. (Giovanna Sacchi) and G.V.; visualization, P.S.F. and G.C.; supervision, G.S. (Giulio Senes) and N.F.; funding acquisition, G.S. (Giulio Senes) and G.S. (Giovanna Sacchi). All authors have read and agreed to the published version of the manuscript.

Funding

This research was funded by BriazAcque s.r.l., Monza (MB), Italy.

Institutional Review Board Statement

Not applicable.

Informed Consent Statement

Not applicable.

Data Availability Statement

Publicly dataset were analyzed in this study. This data can be found here: [www.geoportale.regione.lombardia.it]. The new data produced in this study are not publicly available, they are available on request from the corresponding author.

Acknowledgments

Authors are grateful to Marco Togni, Giacomo Redondi, Iuri Dino Tagliaferri.

Conflicts of Interest

The authors declare no conflict of interest.

Declaration

This work has been presented on Greening cities shaping cities symposium in October 2020.

References

  1. Istituto Superiore per la Protezione e la Ricerca Ambientale. Qualità Dell’ambiente Urbano. IX Rapporto. Focus su Acque e Ambiente Urbano; ISPRA: Roma, Italy, 2013; ISBN 978-88-448-0622-4.
  2. Davis, M.; Naumann, S. Making the Case for Sustainable Urban Drainage Systems as a Nature-Based Solution to Urban Flooding. In Nature-Based Solutions to Climate Change Adaptation in Urban Areas. Theory and Practice of Urban Sustainability Transitions; Kabisch, N., Korn, H., Stadler, J., Bonn, A., Eds.; Springer: Cham, Switzerland, 2017; pp. 123–137. [Google Scholar] [CrossRef] [Green Version]
  3. Berndtsson, J.C. Green roof performance towards management of runoff water quantity and quality: A review. Ecol. Eng. 2010, 36, 351–360. [Google Scholar] [CrossRef]
  4. Guan, M.F.; Sillanpaa, N.; Koivusalo, H. Modelling and assessment of hydrological changes in a developing urban catchment. Hydrol. Process. 2015, 29, 2880–2894. [Google Scholar] [CrossRef]
  5. Yao, L.; Chen, L.D.; Wei, W. Assessing the effectiveness of imperviousness on stormwater runoff in micro urban catchments by model simulation. Hydrol. Process. 2016, 30, 1836–1848. [Google Scholar] [CrossRef] [Green Version]
  6. Fairbrass, A.; Jones, K.; McIntosh, A.; Yao, Z.; Malki-Epshtein, L.; Bell, S. Green Infrastructure for London: A Review of the Evidence. A Report by the Engineering Exchange for Just Space and the London Sustainability Exchange; Natural Environmental Research Council: London, UK, 2018. [Google Scholar]
  7. Chen, J.Q.; Theller, L.; Gitau, M.W.; Engel, B.A.; Harbor, J.M. Urbanization impacts on surface runoff of States the contiguous United States. J. Environ. Manag. 2017, 187, 470–481. [Google Scholar] [CrossRef]
  8. Du, J.; Qian, L.; Rui, H.; Zuo, T.; Zheng, D.; Xu, Y.; Xu, C.Y. Assessing the effects of urbanization on annual runoff and flood events using an integrated hydrological modeling system for Qinhuai River basin, China. J. Hydrol. 2012, 464, 127–139. [Google Scholar] [CrossRef]
  9. Valtanen, M.; Sillanpaa, N.; Setala, H. Effects of land use intensity on stormwater runoff and its temporal occurrence in cold climates. Hydrol. Process. 2014, 28, 2639–2650. [Google Scholar] [CrossRef]
  10. Yang, G.X.; Bowling, L.C.; Cherkauer, K.A.; Pijanowski, B.C. The impact of urban development on hydrologic regime from catchment to basin scales. Landsc. Urban Plan. 2011, 103, 237–247. [Google Scholar] [CrossRef]
  11. Tao, W.D.; Bays, J.S.; Meyer, D.; Smardon, R.C.; Levy, Z.F. Constructed wetlands for treatment of combined sewer overflow in the US: A review of design challenges and application status. Water 2014, 6, 3362–3385. [Google Scholar] [CrossRef] [Green Version]
  12. Chocat, B.; Ashley, R.; Marsalek, J.; Matos, M.R.; Rauch, W.; Schilling, W.; Urbonas, B. Toward the sustainable management of urban storm-water. Indoor Built Environ. 2007, 16, 273–285. [Google Scholar] [CrossRef]
  13. European Union. Nature-Based Solutions for Climate Mitigation. Analysis of EU-Funded Projects; European commission: Bruxelles, Belgium, 2020; ISBN 978-92-76-18200-9. [Google Scholar] [CrossRef]
  14. Fletcher, T.D.; Shuster, W.; Hunt, W.F.; Ashley, R.; Butler, D.; Arthur, S.; Trowsdale, S.; Barraud, S.; Semadeni-Davies, A.; Bertrand-Krajewski, J.; et al. SUDS, LID, BMPs, WSUD and more—The evolution and application of terminology surrounding urban drainage. Urban Water J. 2015, 12, 525–542. [Google Scholar] [CrossRef]
  15. Zhou, Q. A Review of Sustainable Urban Drainage Systems Considering the Climate Change and Urbanization Impacts. Water 2014, 6, 976–992. [Google Scholar] [CrossRef]
  16. Keeler, B.L.; Hamel, P.; McPhearson, T.; Hamann, M.H.; Donahue, M.L.; Meza Prado, K.A.; Arkema, K.K.; Bratman, G.N.; Brauman, K.A.; Finlay, J.C.; et al. Social-ecological and technological factors moderate the value of urban nature. Nat. Sustain. 2019, 2, 29–38. [Google Scholar] [CrossRef]
  17. European Union. Nature-Based Solutions: State of the Art in EU-Funded Projects; European commission: Bruxelles, Belgium, 2020; ISBN 978-92-76-17334-2. [Google Scholar] [CrossRef]
  18. Senes, G.; Fumagalli, N.; Ferrario, P.S.; Rovelli, R.; Sigon, R. Definition of a land quality index to preserve the best territories from future land take. An application to a study area in Lombardy (Italy). J. Agric. Eng. 2020, 51, 43–55. [Google Scholar] [CrossRef]
  19. US Environmental Protection Agency. Low Impact Development (LID). A Literature Review; EPA Office of Water (4203): Washington, DC, USA, 2000.
  20. Ashley, R.; Illman, S.; Kellagher, R.; Scott, T.; Udale-Clarke, H.; Wilson, S.; Woods Ballard, B. The SuDS Manual; CIRIA: London, UK, 2015. [Google Scholar]
  21. Walmsley, A. Greenways and the making of urban form. Landsc. Urban Plan. 1995, 33, 81–127. [Google Scholar] [CrossRef]
  22. European Union. Building a Green Infrastructure for Europe; European Commission: Bruxelles, Belgium, 2013; ISBN 978-92-79-33428-3. [Google Scholar] [CrossRef]
  23. Lähde, E.; Khadka, A.; Tahvonen, O.; Kokkonen, T. Can We Really Have It All?—Designing Multifunctionality with Sustainable Urban Drainage System Elements. Sustainability 2019, 11, 1854. [Google Scholar] [CrossRef] [Green Version]
  24. Dhakal, K.P.; Chevalier, L.R. Urban stormwater governance: The need for a paradigm shift. Environ. Manag. 2016, 57, 1112–1124. [Google Scholar] [CrossRef]
  25. Vogel, J.R.; Moore, T.L.; Coffman, R.R.; Rodie, S.N.; Hutchinson, S.L.; McDonough, K.R.; McLemore, A.J.; McMaine, J.T. Critical Review of Technical Questions Facing Low Impact Development and Green Infrastructure: A Perspective from the Great Plains. Water Environ. Res. 2015, 87, 849–862. [Google Scholar] [CrossRef]
  26. Pappalardo, V.; Campisano, A.; Martinico, F.; Modica, C.; Barbarossa, L. A hydraulic invariance-based methodology for the implementation of storm-water release restrictions in urban land use master plans. Hydrol. Process. 2017, 31, 4046–4055. [Google Scholar] [CrossRef]
  27. Christman, Z.; Meenar, M.; Mandarano, L.; Hearing, K. Prioritizing Suitable Locations for Green Stormwater Infrastructure Based on Social Factors in Philadelphia. Land 2018, 7, 145. [Google Scholar] [CrossRef] [Green Version]
  28. Charlesworth, S.; Warwick, F.; Lashford, C. Decision-Making and Sustainable Drainage: Design and Scale. Sustainability 2016, 8, 782. [Google Scholar] [CrossRef] [Green Version]
  29. Charlesworth, S.M.; Warwick, F. Sustainable drainage, green and blue infrastructure in urban areas. In Sustainable Water Engineering; Charlesworth, S.M., Booth, C., Adeyeye, K., Eds.; Elsevier: Amsterdam, The Netherlands, 2020; pp. 185–206. ISBN 9780128161203. [Google Scholar] [CrossRef]
  30. Wang, X.; Shuster, W.; Pal, C.; Buchberger, S.; Bonta, J.; Avadhanula, K. Low Impact Development Design—Integrating Suitability Analysis and Site Planning for Reduction of Post-Development Stormwater Quantity. Sustainability 2010, 2, 2467–2482. [Google Scholar] [CrossRef] [Green Version]
  31. Li, L.; Uyttenhove, P.; Vaneetvelde, V. Planning green infrastructure to mitigate urban surface water flooding risk—A methodology to identify priority areas applied in the city of Ghent. Landsc. Urban Plan. 2020, 194, 103703. [Google Scholar] [CrossRef]
  32. Yau, W.K.; Radhakrishnan, M.; Liong, S.Y.; Zevenbergen, C.; Pathirana, A. Effectiveness of ABC waters design features for runoff quantity control in Urban Singapore. Water 2017, 9, 577. [Google Scholar] [CrossRef] [Green Version]
  33. Dagenais, D.; Thomas, I.; Paquette, S. Siting green stormwater infrastructure in a neighbourhood to maximise secondary benefits: Lessons learned from a pilot project. Landsc. Res. 2017, 42, 195–210. [Google Scholar] [CrossRef]
  34. Pappalardo, V.; La Rosa, D.; Campisano, A.; La Greca, P. The potential of green infrastructure application in urban runoff control for land use planning: A preliminary evaluation from a southern Italy case study. Ecosyst. Serv. 2017, 26, 345–354. [Google Scholar] [CrossRef]
  35. Sun, Y.; Tong, S.; Yang, Y.J. Modeling the cost-effectiveness of stormwater best management practices in an urban watershed in Las Vegas Valley. Appl. Geogr. 2016, 76, 49–61. [Google Scholar] [CrossRef]
  36. Muthanna, T.M.; Sivertsen, E.; Kliewer, D.; Jotta, L. Coupling field observations and Geographical Information System (GIS)-based analysis for improved Sustainable Urban Drainage Systems (SUDS) performance. Sustainability 2018, 10, 4683. [Google Scholar] [CrossRef] [Green Version]
  37. Gallagher, K.V.; Alsharif, K.; Tsegaye, S.; Van Beynen, P. A new approach for using GIS to link infiltration BMPs to Groundwater Pollution Risk. Urban Water J. 2018, 15, 847–857. [Google Scholar] [CrossRef]
  38. Kuller, M.; Bach, P.M.; Ramirez-Lovering, D.; Deletic, A. What drives the location choice for water sensitive infrastructure in Melbourne, Australia? Landsc. Urban Plan. 2018, 175, 92–101. [Google Scholar] [CrossRef]
  39. Martin-Mikle, C.J.; de Beurs, K.M.; Julian, J.P.; Mayer, P.M. Identifying priority sites for low impact development (LID) in a mixed-use watershed. Landsc. Urban Plan. 2015, 140, 29–41. [Google Scholar] [CrossRef] [Green Version]
  40. Gregory, J.H.; Dukes, M.D.; Jones, P.H.; Miller, G.L. Effect of urban soil compaction on infiltration rate. J. Soil Water Conserv. 2006, 61, 117–124. [Google Scholar]
  41. Tredway, J.C.; Havlick, D.G. Assessing the Potential of Low-Impact Development Techniques on Runoff and Streamflow in the Templeton Gap Watershed, Colorado. Profess. Geogr. 2017, 69, 372–382. [Google Scholar] [CrossRef]
  42. Tsegaye, S.; Singleton, T.L.; Koeser, A.K.; Lamb, D.S.; Landry, S.M.; Lu, S.; Barber, J.B.; Hilbert, D.R.; Hamilton, K.O.; Northrop, R.J.; et al. Transitioning from gray to green (G2G)—A green infrastructure planning tool for the urban forest. Urban For. Urban Green. 2018, 40, 204–214. [Google Scholar] [CrossRef]
  43. Surma, M. Sustainable urban development through an application of green infrastructure in district scale—A case study of Wrocław (Poland). J. Water Land Dev. 2015, 25, 3–12. [Google Scholar] [CrossRef]
  44. Foomani, M.S.; Malekmohammadi, B. Site selection of sustainable urban drainage systems using fuzzy logic and multi-criteria decision-making. Water Environ. J. 2019, 34, 584–599. [Google Scholar] [CrossRef]
Figure 1. Phases of the methodology proposed for the definition of Green Infrastructure for stormwater management.
Sustainability 13 06124 g001
Figure 2. Procedure for mapping green areas potentially available for infiltration.
Sustainability 13 06124 g002
Figure 3. Map of green areas for the municipality of Caponago.
Sustainability 13 06124 g003
Figure 4. Geological units and localization of the points of survey for the municipality of Caponago.
Sustainability 13 06124 g004
Figure 5. Map of natural surface infiltration potential.
Sustainability 13 06124 g005
Figure 6. Map of exclusion areas for the municipality of Caponago. They represent the portions of the territory that have hydrogeological characteristics such that the infiltration of water could represent a risk to the safety of the population.
Sustainability 13 06124 g006
Figure 7. Identification of “equipped green areas” using municipal maps, satellite images and Google Street View. In the example, only the area “A” is classified as an “equipped green area”.
Sustainability 13 06124 g007
Figure 8. Green area compatibility map for realizing the Green Infrastructure for the municipality of Caponago.
Sustainability 13 06124 g008
Figure 9. Green Infrastructure Suitability Map for the municipality of Caponago.
Sustainability 13 06124 g009
Figure 10. Typologies of green areas with medium-high suitability for creating GI in the municipality of Caponago.
Sustainability 13 06124 g010
Table 1. Urban green areas: availability, completeness and update for Caponago.
Urban Green Area ConditionsPGTDBT
Availabilitynoyes
Completenessnoyes
Updateyesyes
Table 2. Map of green areas: final classes.
ClassType
Urban green areasgarden
flowerbed
trees
other green area
Green areas connected to transport networktraffic island/roundabout
parking strip
Agricultural, wooded and semi-natural areascrop
crop with trees
horticultural
horticultural (greenhouse)
floricultural and plant nursery
vineyard
grassland
grassland with trees
orchard
vegetable garden
deciduous wood
reforestation
riparian wood
bushes
bushes in abandoned agricultural lands
Table 3. Characteristics of the geological units in Caponago.
Geological UnitCARG CodeDescription
Unità di BesnateBesFluvioglacial and glacial deposits, slightly weathered, up to 4 m. Sporadic Loess deposits.
Sintema del PoPgGravels, sands and silts from recent fluvial deposits, lacustrine deposits, slope and colluvial deposits, landslide deposits. Fresh upper surface, characterized by entisols and inceptisols.
Table 4. Classes of surface potential infiltration.
Classes of Surface Infiltration PotentialReference Values of Saturated Hydraulic Conductivity (m/s)
Very high>10−2
High10−2–10−3
Medium10−3–10−4
Low10−4–10−5
Very low<10−5
Table 5. Surface potential infiltration classes assigned to the geological units in Caponago.
Geological UnitCARG CodeSurface Potential Infiltration Class
Unità di BesnateBesLow
Sintema del PoPgMedium
Table 6. Compatibility scores for green area classes. H: high; M: medium; L: low.
Type of Green AreaValue of the CharacteristicCompatibility Score
Naturalness [N]Ant. Pres. [A]Prod. Value [P]Urban Context [U]Naturalness = [N]Ant. Pres. [=(5 − A) + 1]Prod. Value [=(5 − P) + 1]Urban Context [=U]Total ScoreCompatibility Class
Equipped green area1515115512M
Garden4111455115M
Garden in urban context (uc)4115455519H
Trees4111455115M
Trees uc4115455519H
Other green area4111455115M
Other green area uc4115455519H
Flowerbed1211145111M
Flowerbed uc1215145515M
Traffic island/roundabout1211145111M
Traffic island/roundabout uc1215145515M
Parking strip151111518L
Parking strip uc1515115512M
Floricultural and plant nursery155111114L
Floricultural and plant nursery uc155511158L
Horticultural155111114L
Horticultural uc155511158L
Horticultural (greenhouse)155111114L
Horticultural (greenhouse) uc 155511158L
Vegetable garden233123319L
Vegetable garden uc2335233513M
Crop234123218L
Crop uc2345232512M
Crop with trees3231343111M
Crop with trees uc3235343515M
Orchard235123117L
Orchard uc2355231511M
Vineyard235123117L
Vineyard uc2355231511M
Grassland3231343111M
Grassland uc3235343515M
Grassland with trees4221444113M
Grassland with trees uc4225444517H
Deciduous wood4221444113M
Deciduous wood uc4225444517H
Reforestation4221444113M
Reforestation uc4225444517H
Riparian wood5111555116H
Riparian wood uc5115555520H
Bushes5111555116H
Bushes uc5115555520H
Bushes in abandoned agricultural lands5111555116H
Bushes in abandoned agricultural land uc5115555520H
Table 7. Weights assigned to potential infiltration and exclusion areas.
Potential Infiltration [PI]Saturated Hydraulic Conductivity (m/s)Weight [WPI]
High10−210−31.0
Medium10−310−40.7
Low10−4–10−50.5
Very low<10−50.1
Exclusion Areas [EA]Weight [WEA]
Absolute protection area of wells, buffer zone of wells, flooded area, contaminated area, quarry, frequently flooded areas (return period of 20–50 years)0.0
Not frequently flooded areas (return period of 100–200 years), rarely flooded areas (return period of p > 200 years), groundwater vulnerability to pollution1
Table 8. GI-Suit Scores and Green infrastructure suitability classes.
Score of [GI-Suit]Classes of Green Infrastructure Suitability
0Null
1–7Low
7–10Medium–Low
10–13Medium
13–15Medium–High
16–20High
Table 9. Municipal green areas: Values in ha, % of municipal area [ma] and % of total green areas [tga].
Green Area ClassArea (ha)% of ma% of tga
Agricultural, wooded and semi-natural areas254.6050.7475.42
Green areas connected to the transport network7.071.412.09
Urban green areas75.8915.1322.48
Total337.5667.28100.00
Table 10. Municipal areas compatible with creating GI: Values in ha, % of municipal area [ma] and % of total green areas [tga].
Class of Green AreaHigh CompatibilityMedium CompatibilityLow Compatibility
ha% of ma% of tgaha% of ma% of tgaha% of ma% of tga
Agric., wooded and semi-natural16.623.314.9291.2418.1927.03146.7429.2543.47
Green areas connec. transport0.000.000.007.071.412.090.000.000.00
Urban green areas71.914.3321.303.990.801.180.000.000.00
Total88.5217.6426.22102.320.3930.31146.7429.2543.47
Table 11. Suitability of municipal areas for creating GI: Values in ha, % of municipal area [ma], and % of total green areas [tga].
Class of Green AreaMedium-High SuitabilityMedium SuitabilityMedium-Low SuitabilityLow SuitabilityNull Suitability
ha% of ma% of tgaha% of ma% of tgaha% of ma% of tgaha% of ma% of tgaha% of ma% of tga
Agric., wooded, and semi-natural 4.090.821.210.70.140.2112.392.473.67214.942.8363.6522.554.496.68
Green areas connec. transp. 0.000.000.000.000.000.006.021.201.780.000.000.001.040.210.31
Urban green areas6.051.211.790.170.030.0551.8610.3415.360.520.100.1517.583.505.21
Total10.142.0230.870.170.267014.0120.82215.442.9363.8144.068.7812.20
Publisher’s Note: MDPI stays neutral with regard to jurisdictional claims in published maps and institutional affiliations.

