1. Introduction
In the extant literature on the economic benefits of education—and on the determining factors shaping a fruitful education—various methodological strands can be distinguished. First, there is a standard economic welfare approach where GDP per capita—either individually or collectively—is seen as the ultimate measuring rod of welfare: the higher GDP per capita, the higher the quality achievement of education has been. Clearly, distributional, social-environmental and contextual conditions are largely neglected here [
1,
2].
Another strand of literature focuses the attention more on the supply side of education [
3,
4,
5,
6,
7,
8,
9,
10], where the presence of good educational amenities, open access and social incentive systems play a critical role in assessing educational achievements. This approach closely follows the capability theory advocated inter alia by Nobel laureate Amartya Sen [
11].
A third important line of research approaches educational performance from an individual demand perspective and is inspired by quantitative sociological and psychological research [
6,
12,
13,
14,
15,
16]. The latter class of scientific research addresses both social and environmental drivers of good educational results and is partly rooted in motivational and perception attitudes and behaviours of individuals. Such positive stimuli are seen as a ‘social good’ that provides incentives and encouragement to citizens. To test the propositions articulated in the latter approach calls for large datasets on individuals. Such data are available in Sweden. Therefore, in our evaluation study on educational performance, we will test the latter methodological approach for Sweden.
The Swedish compulsory school system—as part of the national welfare system—is built around the idea of equality of educational opportunity in which every child has equal rights to learn, develop and become independent and prosperous citizen. Most countries have adopted similar educational ideals. However, in Sweden, like in all countries, access to quality education varies between locations and between sociodemographic groups. Variation in pupils’ performance and grades may be accepted as long as these variations stem from
fair circumstances, such as the child’s ambition, but the variation in educational success caused by structures beyond the control of the pupil should be the concern of policy makers, not only for the rights of each pupil, but also because inequality of any sort is less effective and more expensive in the long run [
17]. From a theoretical perspective, the categorisation of opportunities into fair and unfair opportunities has its roots in Roemer’s theoretical framework of inequality of opportunity (see for instance [
18,
19]). If we translate the opportunity theory into the educational system, we can isolate the performance factors that are fair and those that are unfair and analytically identify factors that are unfair. Clearly, structural inequalities in cases where grades are dependent on belonging to different socioeconomic groups, gender or ethnicities are unfair, but variations in grades that are the result of effort are good for both pupils and society.
A substantial amount of research has been conducted to establish the relationship between pupils’ performance and variables that describe individual-level, family-related and school- or community-related characteristics. A considerable amount of that literature is focused on how to make education equal in terms of access to opportunity to study on equal terms. Sirin [
20] summarized in a meta-analytic study the effects of Socioeconomic Status (SES) on pupils’ performance in the US. The results indicate that family level SES has a considerable effect on the educational performance (see also [
21]), where pupils in high-SES families on average are performing better than their peers, while children from low-SES environments were doing better if they were schooled in high-SES schools [
20,
22]. In regions with profound residential segregation, the influence of parents, friends and neighbours on the educational success of a child risks enforcing the differences between groups, and if similar structures are found at the pupils’ schools, the inequality in opportunity is limiting not only the potential of the child but also that of society [
23].
Studies of educational performance in Sweden have several benefits that facilitate the study of inequality of educational opportunity. First, there is a national register of grades that is available to researchers. This register can be associated with SES statistics describing the variables on family, neighbourhood and school level. Secondly, there are several studies of educational performance that can be used as a platform for the development of hypotheses. The Swedish studies confirm various international experiences, in which individual characteristics such as being foreign born, being a boy and coming from low-SES families and low-SES neighbourhoods are associated with lower educational performance (see for instance [
24,
25,
26,
27,
28]). Several studies also show that factors related to social capital affect grades, while choice of school, social networks and location-specific characteristics are important [
24,
25,
29,
30,
31].
Overall, it is clear that, besides individual-level characteristics, variables related to family, neighbourhood and school also affect the performance of the child. However, access to population registers, and registers containing educational performance, is rare to obtain internationally, making in-depth studies of educational performance more difficult or even impossible in many countries. In order to facilitate national studies and international comparisons of equality in access to educational opportunities as well as in pupils’ performances, variables and measures that are accessible on different scales and in as many countries as possible would be helpful. This requires the creation and use of variables that may function as proxies of social capital, networks, neighbourhood composition in terms of educational background, and income. There is a long range of variables/indices that have been developed with a global reach as target and with the aim of capturing human capital, well-being and the development potential and therefore can be seen as suitable proxies for predicting student performance. By reconstructing and disaggregating the most suitable index, we show to what extent the most suitable candidate can be used to capture factors that predict educational performance. This ties in with the recent wave of social indicators research.
Possibly, the most well-recognized index of human well-being is the HDI (Human Development Index), developed by the UN [
32,
33]. The index comprises several variables describing health, education and income and is frequently used to evaluate educational outcome on national and sometimes regional levels [
34,
35]. Individual-level studies using HDI to evaluate educational performance do so by including the HDI of out-migration countries as a background variable (see for instance [
36,
37]). Alternative indices that could be used to study educational performance include (though not exhaustively) the Happy Planet Index [
38], which is similar to the HDI index but also includes ecological footprints and a subjective measure of well-being. The GDI measure (Gender Development Index, [
39]) is essentially a gender-sensitive HDI-measure. The OECD’s Better Life Index [
40] is another complex index with several components describing education, life-satisfaction, community, environment, etc. The where-to-be-born index (formerly known as the Quality of Life Index) is also a complex measure including political freedom, governance, equality, health, etc. [
41]. Thus, there is a range of indicators on social well-being, which reflects the emerging interest in ‘beyond-GDP’ statistical approaches (see e.g., [
42]).
The list could be made longer, but in general, most alternatives to HDI are either reliant on data that are subjective (and therefore difficult to generate on a local level and on a massive scale) such as the Happy Planet index and/or are too complex and demanding in terms of data collection, disqualifying regions or countries that cannot generate the requested data, such as the better life and where-to-be-born indices. Some of these indices rely on macrolevel statistics (variables such as democracy, carbon footprint, etc.), which means that they cannot be disaggregated and used to study variation in opportunity within regions. Finally, the GDI index is almost identical to the HDI index, but the difficulty to generate reliable data internationally makes the index less suitable for this study [
43]. However, gender is central for our understanding of pupils’ performance and is integrated as a separate variable in the analyses in our study.
In the present study, we use data from the rich statistical repositories available in Sweden aiming to test whether a globally available index (HDI) can be used to study variations in inequality of opportunity in access to education on smaller scales. We use data from 2014, which is the latest year in which we have access to both register data and election data of the national parliament—the latter (voting participation) is used as a proxy for social capital. Therefore, the key question and focus of this paper is how a well-known and well-established index of human opportunity (HDI) can be used as a proxy of student performance with special attention to the need for comparative measures on a global level. The idea being that by using microdata on student performance in Sweden, we can test the performance of the index at different regional levels, thus contributing to a greater understanding of how the index can be used in regions with low-quality data or data on geographically aggregate levels. By reconstructing the HDI on a super-local (residential coordinates) level using floating catchment techniques, we can compare to what extent family, neighbourhood and school level variables describing educational performance and sociodemographics can be captured by HDI. The benefit of this exercise is that we can produce policy advice and methods for international studies of inequalities and performance in the educational system using variables that can be generated regionally in most parts of the world. This means that, over time and between regions/countries, comparisons of students’ performance can be generated also in cases where availability to data describing the contexts of pupils is difficult to realise. The remainder of the paper is organised as follows: First, we offer a short description of the Swedish compulsory educational system and the administrative subdivisions. Secondly, we present data and methods for both the creation of the local HDI and for the analytical approach adopted in our study. Thirdly, we present our results, while in the concluding part we discuss our findings from our analysis and propose a set of policy recommendations.
2. Materials and Methods
2.1. The Swedish Educational System
Sweden has a 10 year mandatory school system followed by a voluntary 3 year upper-secondary education with options to specialize in different vocational educations or to prepare for higher education in theoretical, scientific or social scientific orientations. The administrative responsibility for mandatory schools rests on the 290 municipalities in the country. The schools can be owned and operated by municipalities (most common) or by private companies or corporations, but admittance is open to the public (though more popular schools often use queues). The operation of the school is funded through a voucher system in which each school is paid for each pupil they educate. The competition for more popular schools and the localisation of new schools (not regulated) have in some municipalities led to a substantial school segregation (see for instance [
44,
45]). The available data does not indicate the ownership of the schools, but it is clear that school-level and municipality-level effects may be expected. The analyses therefore control for ICC (intraclass correlation coefficient) on school and municipality level.
2.2. Data
The data employed in this study come from the PLACE database. PLACE is a longitudinal full population register compiled by Statistics Sweden (SCB) and located at Uppsala University. PLACE contains a wide set of sociodemographic variables including residential coordinates (on 100 × 100 m level), school grades, family relations, and variables describing work life and income. The database currently contains data between 1990 and 2017. In our study, we use data that cover all compulsory school students’ final year grade during 2014. We have chosen to use 2014 since this is also the last election year in Swedish politics to which the PLACE database had residential variables to match the voting district statistics. Voting participation is used as a proxy for social capital on neighbourhood level in our regression analysis. Residential coordinates for the year 2013 are used to capture the location of the last known residence of individuals that died during 2014. The geocoded data is needed to estimate life expectancy on coordinate level (see below).
Used variables can broadly be categorized into three groups: the dependent variable (Grades), HDI variables, sociodemographic, geographical, and voting participating variables as independent variables.
2.3. Dependent Variable
Swedish pupils receive a final grade called ‘meritvärde’ that functions as a composite grade for all subjects studied during the last year of compulsory schooling. The grade spans between 10 and 320 (
Table 1) and is relatively normally distributed. Since the education is mandatory, almost the entire cohort of pupils that graduated in 2014 are included. The grades are log-transformed in the regressions.
2.4. HDI
The HDI is composed of three variables designed to capture health, knowledge and standard of living. Health is represented by Life Expectancy (LE) at birth, knowledge through observed and expected years of education per person, and standard of living is expressed using a standardized measure of Gross National Income per capita (GNIpc). Normally, the calculation of HDI is conducted using national or regional data, meaning that the reference population to which any regional measure is compared is large. However, in this study, we wanted to create individualized measures of HDI on residential coordinate level. In order to create index values for each residential coordinate, we had to re-calculate the HDI, so that it captured the context surrounding each location wherein people live. For this purpose, we employed a floating catchment technique with fixed population counts surrounding each coordinate using the EquiPop flow software [
44,
46]. The neighbourhood count was set to the 100 nearest neighbours surrounding each coordinate. The count was chosen to represent an approximate count of neighbours that would be recognizable to the locals and whose influence and networks could be interpreted as bearers of the local social capital. The method was used to calculate local values representing age-specific mortality ratios, duration of education and average disposable income among the full population (LE) and the adult population (education and income). The HDI variables were introduced in the regressions as individual-level variables,
HDI_100, and as municipality average values as
HDI_regional.
2.5. Independent Variables
The independent variables were chosen on the basis of the prevailing literature and included variables on individual, family and neighbourhood levels. The variables are as follows: Female, is a binary variable indicating the gender of the pupil. Visible Minority (VM) is a binary variable categorizing pupils that are born in Asia (excluding Russia), Africa and Latin America as belonging to a visible minority. The variable was designed to capture both the effects of migration and the effects of potential discrimination. In order to capture the effect of within-country migration on grades, we created the variable move, which identifies all individuals that relocated between 2013 and 2014. The move variable was designed to capture changes in social capital and networks, since the student had limited time to integrate at the new location of residence. Two family-related variables were included. First, the SingleParentChild variable identifies children that are residing with a single parent (other family forms consisting of two adults, function as reference category). Secondly, the DisposableIncome of the child is a household-derived variable indicating the purchasing power of the child, calculated on the basis of costs and income of the household. In order to capture neighbourhood-level social capital, we used Voter Participation percentages, from the election of the national parliament in 2014, assigned to the pupils on the basis of their residential location.
Since a multilevel regression approach was adopted, we also used areal variables to which each pupil belonged. These areal variables identify each school and each schooling municipality of the pupils. This enabled us to identify the magnitude of grade variation attributable to the school and to the municipality administrating the local education.
2.6. Methods
This section presents the steps followed to construct local HDI and the empirical model in which student success is analysed. The HDI is a composite index of longevity, knowledge and standard of living. In the local version of the index, we used the latest functional form proposed in HDR [
47] and used a bespoke neighbourhood approach to construct variables defined around each student in Sweden (see [
35] for more details). The local HDI can be defined as follows:
where
is a normalized index of life expectancy for age cohorts with 5 year time intervals between each other from 0 to 90 years. The index takes a minimum of 0, when the life expectancy around the 100 nearest neighbours of student
i is 20, while it takes the value 1 when life expectancy reaches the maximum of 85 (note that in some neighbourhoods the index can exceed 1 if the maximum life expectancy at birth is greater than 85 years).
is a localised education index, which represents the mean years of schooling among the 100 nearest neighbours of
i and normalised to vary between 0 and 1. Finally,
is the localised income index, which uses individual disposal income among the 100 nearest neighbours of the student
i. The income index is normalised so as to sum up to the Gross National Income (GNI) at the national level and to vary between 0 (monthly minimum of 100
$ at the time of the study) and 1 (monthly maximum of
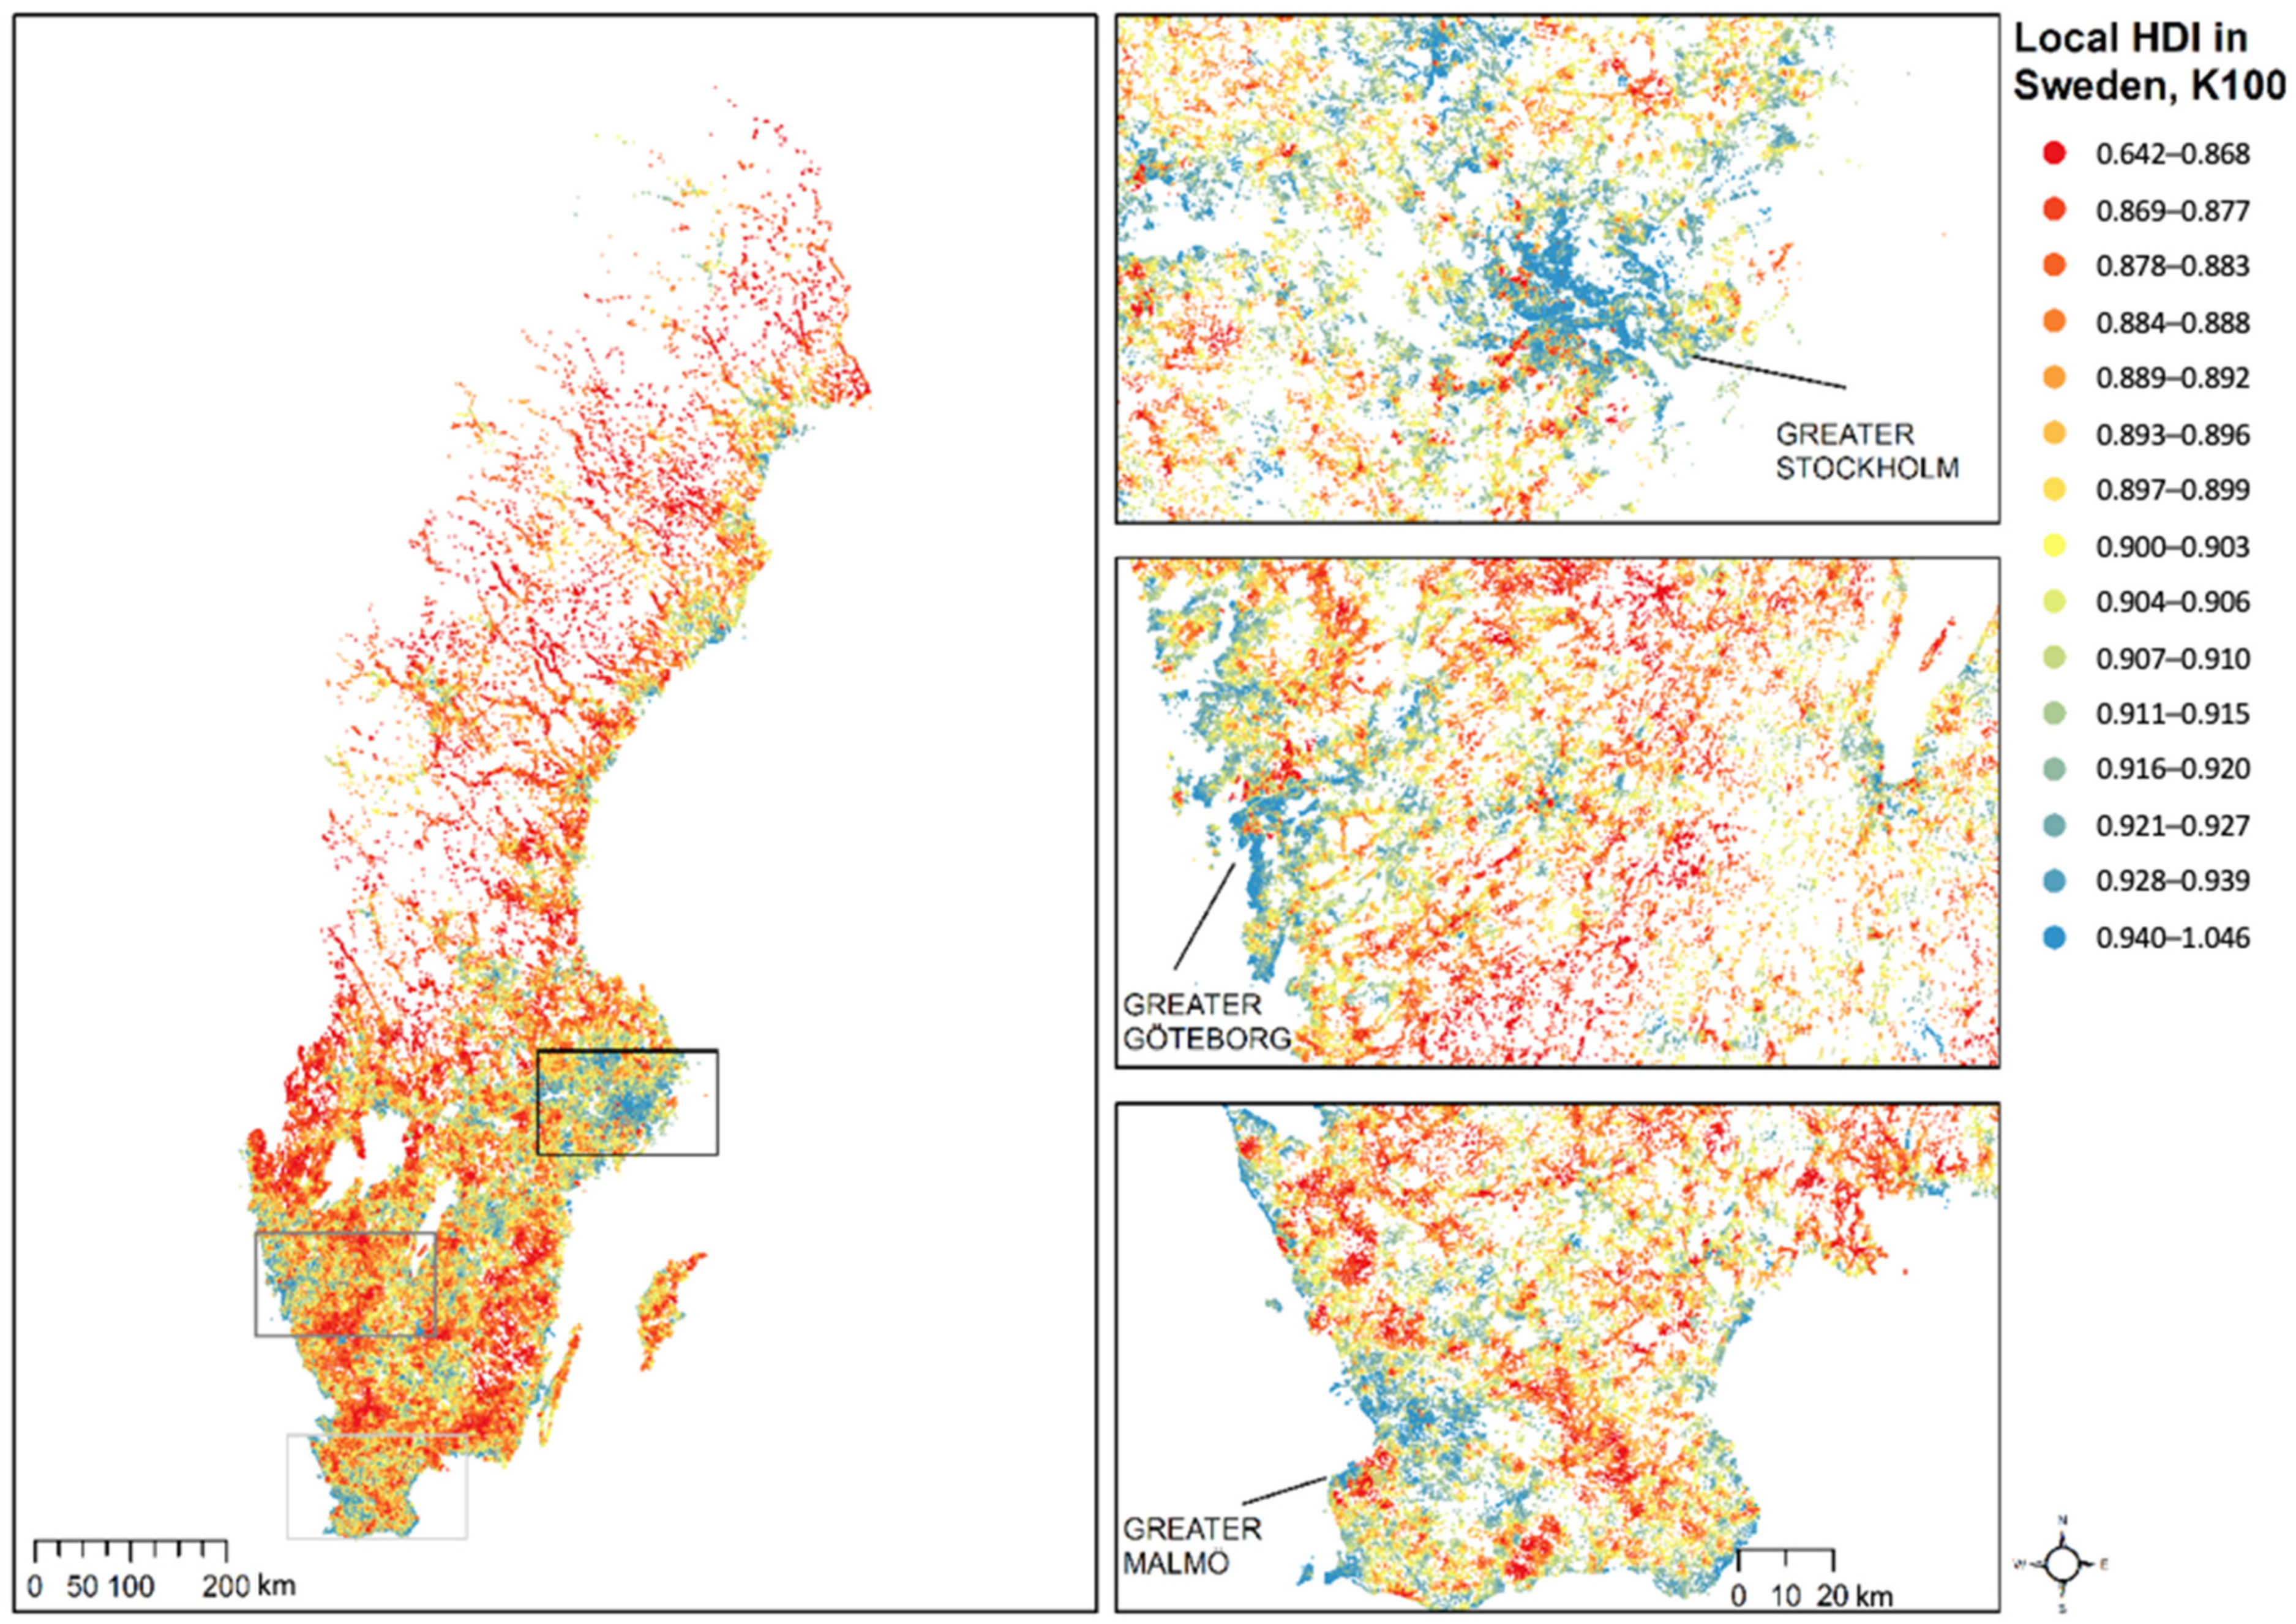
$75,000 at the time of the study). Since the local HDI have geocoded information representing residential coordinates, the values can be mapped to illustrate local and regional variations in HDI. In
Figure 1, the maps clearly show that high-HDI values are concentrated in urban areas but also that considerable variation between areas can be detected. Coastal areas, city centres and urban areas dominated by detached homes on average show greater HDI values, while areas with low population density and few amenities have lower HDI values. This information is used in our subsequent multilevel model.
Below, we present the multilevel model of educational attainment. The multilevel modelling framework has become almost a mainstream method in educational research (see [
48,
49,
50,
51]). Compared to a linear regression framework, multilevel models have the advantage of simultaneously estimating hierarchical influences in student success starting from student-level to classroom- and school-level determinants. The proper design to model the hierarchical structure of our student data is important for a number of reasons. As mentioned above, we need to specify a model, which can cater to school-level socioeconomic segregation, resulting from the localisation of new schools and competition for popular ones [
27,
45,
52]. Additionally, from an equal opportunities perspective, hierarchical influences may cause unfair inequalities in student outcomes, and understanding the interactions between different levels does facilitate policy making. Finally, the local HDI index, by construction, can predict inequalities at three levels available in the dataset; revealing such a complex interplay might again have significant policy implications.
The following multilevel random intercept model allows for correlation between students from the same schools in the second level and also from the same municipalities in the third level:
where
is compulsory examination grades of 9th year students who go to the school s and in municipality
j,
are a set of student-level variables including the local HDI and
school-level
municipality level random effects, while
is student-level residuals.
The variance structure of Equation (2) allows computing so-called Intraclass Correlation Coefficient (ICC), which can be thought of as a measure of the explained variance at different levels:
where
denotes school-level variance,
municipality-level variance and
denotes the residual variance at the student level. The
ICC varies between 0 (no link between variances) and 1 (group level explains all the variance).
In the following section, we present the outputs from seven multilevel regressions, starting with a null model and stepwise populating the model with student-level and spatial covariates including the local HDI. This way, we were able to examine the role of the local HDI in explaining both student, school and municipality level variations.
3. Results
This section conducts a multilevel model analysis between compulsory examination grades of 9th year students and the local HDI index computed around each student.
Table 2 summarises the outputs from seven different models, specified in a stepwise fashion. The first model is the so-called empty model, where the logarithm of student grades is fitted to school- and municipality-level random effects without any covariates. We add the local HDI to the second and regional HDI to the third model. In the fourth model, gender, visible minority (VM) background, a dummy for the children of single parents and parental income are defined as predictors. In addition to student-level variables, the fifth model incorporates the local HDI computed around each student in the dataset.
Meanwhile, voter participation rates in the bespoke neighbourhoods of students and a dummy indicating whether the student has recently moved to a new municipality are added in the sixth model as additional spatial indicators. Finally, the seventh model includes an interaction term between the visible minority dummy and the local HDI. Intraclass coefficients are reported at the bottom of each model specification.
Empty models are helpful to understand the relative variation at different levels. The estimated variance structure can be used as a reference for the following six models in understanding the contribution of additional covariates in explaining the variability in student outcomes. The first column of
Table 2 shows the variance estimates at three levels. ICCs indicate that school-level differences explain around 15% of the total variation in educational attainment in the absence of any explanatory variable. At the same time, 1% of the observed variance is due to municipality-level influences. Overall, the differential quality of schools and varying municipality structure account for 16% variation in 9th graders’ success. As shown in the second model, adding local HDI to the model reduces the second- and third-level variances substantially. This means that local HDI is able to explain a relevant portion of the variability in student performance and that the model is now able to explain a higher portion of the outcome inequality. It is worth noting that the same explanatory power of HDI does not hold when computed at the municipality level. As shown in the third model, even though municipality-level variance is almost entirely explained by including regional HDI, the majority of the variability at the school-level remains unexplained.
The fourth model provides a further test of how the local HDI can be an efficient predictor of individual outcomes. The model replaces the variable local HDI with a set of student-level variables, which are typically used in inequality of opportunity studies [
53]. Looking at the reduction in the school-level variability, we observe that the most prominent predictors of student success—according to well-established education literature—are able to explain almost the same amount of variance as the local HDI. In other cases, the datasets available to the researcher lack essential idiosyncratic information. Our results indicate that the local measures of human development can respond to the data needs especially when conducting inequality of opportunity studies.
Moreover, the results from the fourth model suggest that female students and those with high family income obtain higher grades than males and that having a VM minority background is negatively and significantly associated with the examination results. In addition, children of single parents perform less well at school. We note that parental background and minority status are exogenous factors that create unfair inequalities in education [
18,
53,
54] and must be addressed to ensure equal opportunities. Different from typical approaches to the study of equal opportunities, our results also emphasize the hierarchical structure of opportunity loss due to the sorting of similar socioeconomic groups to similar schools and municipalities. In this regard, the fourth model is informative, where student-level predictors explain 7% of the school-level variation and a part of the municipality-level variance in the pupils’ success with respect to the null model. This is the part of the variance that can be attributed to unfair inequalities in student success and point out to a strong sorting by socioeconomic backgrounds to similar schools.
In the next step, we included the local HDI (k = 100) in the fourth model. As shown in the fifth row of
Table 2, the HDI has a statistically significant and positive influence on the grades when controlling several student-level variables. In particular, one unit increase in HDI corresponds to a 76% increase in the dependent variable. This also means that the human development level (surrounding the student) accounts for a higher share of the differences in attainment than the student-level exogenous factors. The substantial decrease in the ICCs at the school and municipality levels points out the significant role of human development in providing equal opportunities to children.
The sixth model is defined similar but includes additional spatial covariates. The model output suggests that while students who recently moved to a new municipality perform poorly, the increase in the social capital—defined as the voter participation rates among the 500 nearest neighbours—significantly and positively affects student performance. The coefficient of voter participation rates is somehow low, but it is worth noting that HDI might already predict a part of variation due to social capital, as these two measures are highly correlated (see [
35]).
In the last model specification, we interact the local HDI with the variable VM to test whether human development can be operationalized to mediate the detrimental effects of exogenous factors. The interaction term is positive and statistically significant. This finding and the overall results of this section have several implications. Firstly, the local HDI proves to be an efficient measure not only of current human development but also of the future level of development, as indicated by its significant relationship with academic success. The results presented thus far also indicate a systematic disadvantage for students who have unfavourable family backgrounds and those who are exposed to low human development in immediate environments. On the other hand, the local human development has the potential of inverting the negative exogenous factors and providing equal opportunities to children of any social background.
In order to test the validity of our findings, we repeat the multilevel regression models for the years 2015, 2016 and 2017 (In constructing the datasets, we selected the populations of students who share the same neighbourhood as the original dataset (year 2014). Therefore, the sensitivity analyses do not run with the full population). The results presented in
Table A1 show that with respect to baseline specification, the local HDI explains the majority of the variation at three levels in all years. Thus, the sensitivity test confirms our findings.
4. Conclusions
The present paper seeks to study how well HDI explains the variation in educational performance among compulsory school children. The choice to study school grades was motivated by the fact that the potential for human development and well-being of the future generation is embedded in the success of each pupil. Additionally, this exercise has the potential of revealing the policy relevance of the measure of local HDI as a mediator of the exogenous factors affecting student performance from an equality (of opportunity) perspective. Overall, the results indicate that local HDI controls factors that might be concealed and hard to generate on the macrolevel. In this study, the index is able to capture the relationship between human development in the immediate surroundings of students and their academic performance. The results also point to the mediator effect of human development against the potential discrimination or segregation, which are factors known to generate inequalities in access to opportunities. From a public policy perspective, our results, in part, echo [
55], in that family structure (income in our case) does not have direct and straightforward consequences on inequality in student success; therefore, family income subsidies are not enough to tackle unfair inequality. On the other hand, human development on a large scale has the potential to improve the life chances of individuals in several respects, as shown by the previous literature [
32,
33]. The local HDI, proposed by the present paper, adds to the previous literature and confirms several previous findings. In particular, our empirical modelling analyses of the 9th graders highlight that the exposure to human-development-rich neighbourhoods and exposure to healthy, high-human-capital and economically-sound environments can indeed provide children with equal opportunities and life chances.
The present paper contributes to the literature by operationalizing the local HDI as a predictor of student success. This is the first study that has tested the local HDI in the context of academic performance. Additionally, the methods introduced in the paper can be applied to other countries as the computation of the local HDI is less data demanding than alternative approaches to educational success. Our study is not only academically interesting but provides also important cornerstones for policy lessons. In particular, the following set of implications may be mentioned:
Unlike several key variables that are not immediately available for educational attainment research, the local HDI is a composite index of indicators that are almost universally available to the research community. This means that the index can employ standardised and accessible information, while not only enriching local case studies. Therefore, it is useful for informing policy makers, while it also allows conducting cross-country comparative studies.
In line with the arguments of [
17] on the importance of measuring variation rather than means, the findings of the present study also suggest that human development indices at the country or regional level may not be sufficient to infer robust conclusions for the state of art and show that within a country even municipality variation in human capital can explain socioeconomic inequalities.
Our results support findings from several previous studies that highlight the significance of local environments for determining students’ life chances. Improving quality of life in neighbourhoods can have far-reaching positive implications for more than one generation. By construction, human development is a function of education. It appears that the local HDI predicts the academic success today but—more importantly—also anticipates the human development in the near future. From a policy perspective, our adjusted HDI therefore has important implications for intergenerational social mobility and for the individual position on the socioeconomic life-time ladder.
We have introduced a new conceptual framework for the analysis of educational performance by the local HDI and made several references to the inequality of opportunity literature. Although our results reveal the explanatory power of the local HDI in explaining the variation in student success, we have not explicitly estimated inequality of opportunities in education. Future studies could especially repeat already-existing measures of inequality of opportunity with local measures of HDI. This would not only provide further testing of the local HDI as a predictor of socioeconomic background of students but also would allow considering the local HDI in a cross-country comparative perspective.


