Article

Natural Carbon Sinks Linked to Pastoral Activity in S Spain: A Territorial Evaluation Methodology for Mediterranean Goat Grazing Systems

by
Sara Muñoz Vallés
1,*,
Juan Manuel Mancilla-Leytón
1,
Eduardo Morales-Jerrett
2 and
Yolanda Mena
2
1
Departamento de Biología Vegetal y Ecología, Facultad de Biología, Universidad de Sevilla, 41012 Sevilla, Spain
2
Departamento de Agronomía, Escuela Técnica Superior de Ingeniería Agronómica, Universidad de Sevilla, 41013 Sevilla, Spain
*
Author to whom correspondence should be addressed.
Sustainability 2021, 13(11), 6085; https://doi.org/10.3390/su13116085
Submission received: 20 April 2021 / Revised: 20 May 2021 / Accepted: 25 May 2021 / Published: 28 May 2021
(This article belongs to the Special Issue Pastoral Goat Husbandry and Environment)

Abstract

:
Exploring and developing new tools for the accounting and management of natural C sinks will provide a closer, more accurate option to remark the importance of such sinks in relation to livestock production, helping to support the persistence of some seriously endangered traditional, environmentally sustainable livestock farming. Following both precision and usability criteria, two main C sink databases covering the Andalusian region (S Spain) were developed from the Spanish Land Parcel Identification System (SIGPAC, coarse resolution) and the Spanish Information System on Land Cover (SIOSE, finer resolution) land use classes. Particular C sink factors based on growth rates for individual plant species were associated with detailed vegetation maps and, further, were linked to Land Use and Covers cartography across the region. In addition, eight ruminant farms were exhaustively studied in situ and used as a control. Results were compared with the obtained through the application of the developed C sink databases, and with the commonly used Petersen methodology. The sink capacity of vegetation associated with farms varied from 0.25 to 1.37 t CO2 ha−1 year−1, depending on the plant species composition and abundance. All the approaches showed significant differences from the control. C sink values were significantly higher when applying SIGPAC-based C sink database to farms, while values from the SIOSE and Petersen methodology approaches provided more moderate values, closer to the control. SIGPAC and Petersen approaches showed higher usability but presented lower precision due to a poor definition of plant cover. SIOSE-based C sink database provided suitable values able to be adapted to reality and used by farmers. In this regard, further research efforts to improve the adjustment of results and ease of use are required. The present approach means a methodological advance in the estimation of the C sink capacity associated with pastoral livestock farms, able to be incorporated into the CF calculation in contrasted areas worldwide, in the frame of the ‘eco-schemes’ being recently under development through the EU CAP.

1. Introduction

The Sustainable Development Goal 2 of the 2030 Agenda for Sustainable Development, “Zero Hunger”, is one of the main challenges defined by the United Nations Development Programme (UNDP), highlighting the need to produce more food to feed a growing human population that is predicted to reach 9700 million persons by 2050 and could peak at nearly 11 billion around 2100 [1]. To meet this objective, agricultural and livestock production is estimated to be necessarily increased by at least 60% from what was produced in the period from 2005 to 2007 [2,3]. The annual demand for meat, milk, and other dairy products is indeed increasing worldwide, even in countries where such consumption was not traditionally high, also due to income growth, and it is expected to continue growing towards 2050 [2,4]. Nevertheless, present predominant ways of livestock production are associated with several environmental problems such as deforestation, loss of biodiversity and pollution of soils [5]. Under such conditions, the livestock sector is, in addition, estimated to contribute to Climate Change with around 14.5% of anthropogenic global greenhouse gas (GHG) emissions [6], considering both farm direct and associated indirect GHG sources (e.g., animal feeding, transport, management of soils, etc.). Particularly, small ruminants (i.e., goat and sheep) are estimated to be responsible for 6% of these referred livestock emissions [6,7,8], in form of nitrous oxide (N2O), methane (CH4)—with biogenic origin—and carbon dioxide (CO2) [6].
Under the current prevailing conditions of management and production, which nowadays is still moving towards intensification, the expected demand of livestock products for food would predictably lead to an increase in the associated GHG emissions, among other environmental impacts, if these conditions are not changed towards other more sustainable concepts of production and farm management. In this regard, institutions and some population groups increasingly aware and concerned about environmental problems propose measures such as: (i) to reduce or limit the consumption of meat and dairy products [9,10]); (ii) to promote management techniques aimed to reduce GHG emissions [11]; (iii) to ensure grazing management models that allow the carbon to continue keeping stored in soil and vegetation [5,12,13]; and (iv) to increase the carbon sink ability associated to ruminant farming systems, which is particularly true in the case of pastoral farms [14].
In this context, the Carbon Footprint (CF) is widely used as a reliable indicator to estimate the amount of GHG emitted from a particular economic sector, organization, activity, product or person [15]. It is increasingly relevant in the communication to stakeholders regarding impacts of food production on Climate Change [7,8]. In the livestock sector, the calculation of CF is addressed from the perspective of the Life Cycle Analysis (LCA) and measured in terms of GHG emissions per unit of product during a production cycle (generally, kg of equivalent CO2 produced per year and product unit) [16]. CF calculations may theoretically consider C sequestration to obtain net values of emissions. Nevertheless, the difficulty and complexity of such measurements have resulted in a lack of the inclusion of C sink data in most of the published results concerning CF for the livestock sector [8,12,17,18,19] and references there cited, thus providing a biased view of the problem.
In this regard, natural carbon sinks are considered in the Kyoto protocol among the “Flexible Mechanisms” as relevant tools that facilitate signatory countries to reach their GHG reduction commitments [20]. The maintenance and strengthening of current natural C sinks, i.e. oceans and terrestrial vegetation, as well as the creation of new ones, are presently considered as one of the main strategies to address global Climate Change, in parallel to the implementation of policies for the reduction of GHG emissions [21]. Particularly, the role of terrestrial vegetation, and the ecosystems comprising it, has been highlighted as natural C sinks in recent years, as vegetation has the ability to absorb CO2 and store the carbon in their structures, organic matter, and, finally, soil [22]. Considering lower study scales, natural C sinks can also help to understand the real impact of particular activities, such as livestock production, on Climate Change [23]. In this respect, woody vegetation acting as atmospheric C sinks can play a relevant role in balancing the values of GHG net emission associated with livestock, particularly in the case of traditional grazing systems, that are in turn associated with diverse vegetated areas. In this concern, it has been reported that well-managed grazing of untilled land by ruminants not only prevents C from being released back to the atmosphere, but they can also help to sequester it [14]. In addition, livestock production associated with grazing systems promotes the maintenance of natural ecosystems which provide, in turn, numerous goods and services beyond their quality as natural C sinks, such as the maintenance of biodiversity or the reduction of combustible plant biomass, thus reducing forest fire risk [13,24]. Nevertheless, the role as natural C sinks of grazing lands associated with livestock production, which could significantly balance the net GHG emission values, have been poorly considered to date. In this sense, applied studies assessing the C sink ability of vegetated areas in other study environments (e.g. forestry, urban green systems) on the basis of annual plant growth or gas interchange [21,25,26,27,28,29] become relevant for this purpose.
Exploring and developing new tools for the accounting and management of natural C sinks will provide a closer, more accurate option to remark the importance of such sinks in relation to livestock production. At the same time, applying methodologies providing accurate sink capacity measures associated with the different management and production systems will allow light to be shed on the real situation and, thus, help to preserve and enhance such systems that contribute to reducing GHG emissions and increase C sequestration. In all the above context, the aim of this study was to develop a methodology for the evaluation of natural C sinks associated with ruminant farms making use of the territory for grazing, able to be easily included in the CF calculations, using the Andalusian region (S Spain) as a case study. This methodology pursued the establishment of reliable sink estimations allowing the balance of total emission values and providing a more realistic view of the global impact of this activity.

2. Materials and Methods

2.1. Methodological Approach

The correct accounting of the CF at the farm level, including both GHG emissions and C sequestration, is an essential element in moving towards a ‘low carbon livestock farming’. In addition, CF accounting tools focused on the need to achieve a balance between the accuracy of results and ease of use by farmers. The development of a methodology to assess C sinks associated with farms using natural and seminatural vegetated areas for grazing is included during a pilot experience developed on the Andalusian region (S Spain) as an innovative approach for the accounting of CF at the farm level. The region extends over 87,268 km2, with 43,864 km2 (ca. 50%) classified as forest habitats including forests, woodlands, scrublands, and grasslands [30].
The C sink tool is based on the abilities of the particular plant species to absorb CO2 from the atmosphere and assimilate it into their structures, through estimations of annual biomass increases [13,26,27,28], as an alternative to commonly used calculations based on soil C storage and land use change. Thus, one of the main goals of this approach was the establishment of accurate plant inventories in those areas subjected to grazing by livestock, including plant species, abundance, and ages, particularly considering woody vegetation and especially trees [21]. On the other hand, following usability optimization criteria, the amount of information to be requested to users (farmers and technicians) as inputs needs to be minimized. Thus, different levels of land characterization and eligible land use options to define farm activity by farmers were used. As a result, alternative C sink databases were developed and tested. In addition, in situ detailed C sink assessments were carried out and used as control through the selection of different experimental farms associated with territorial use for grazing.

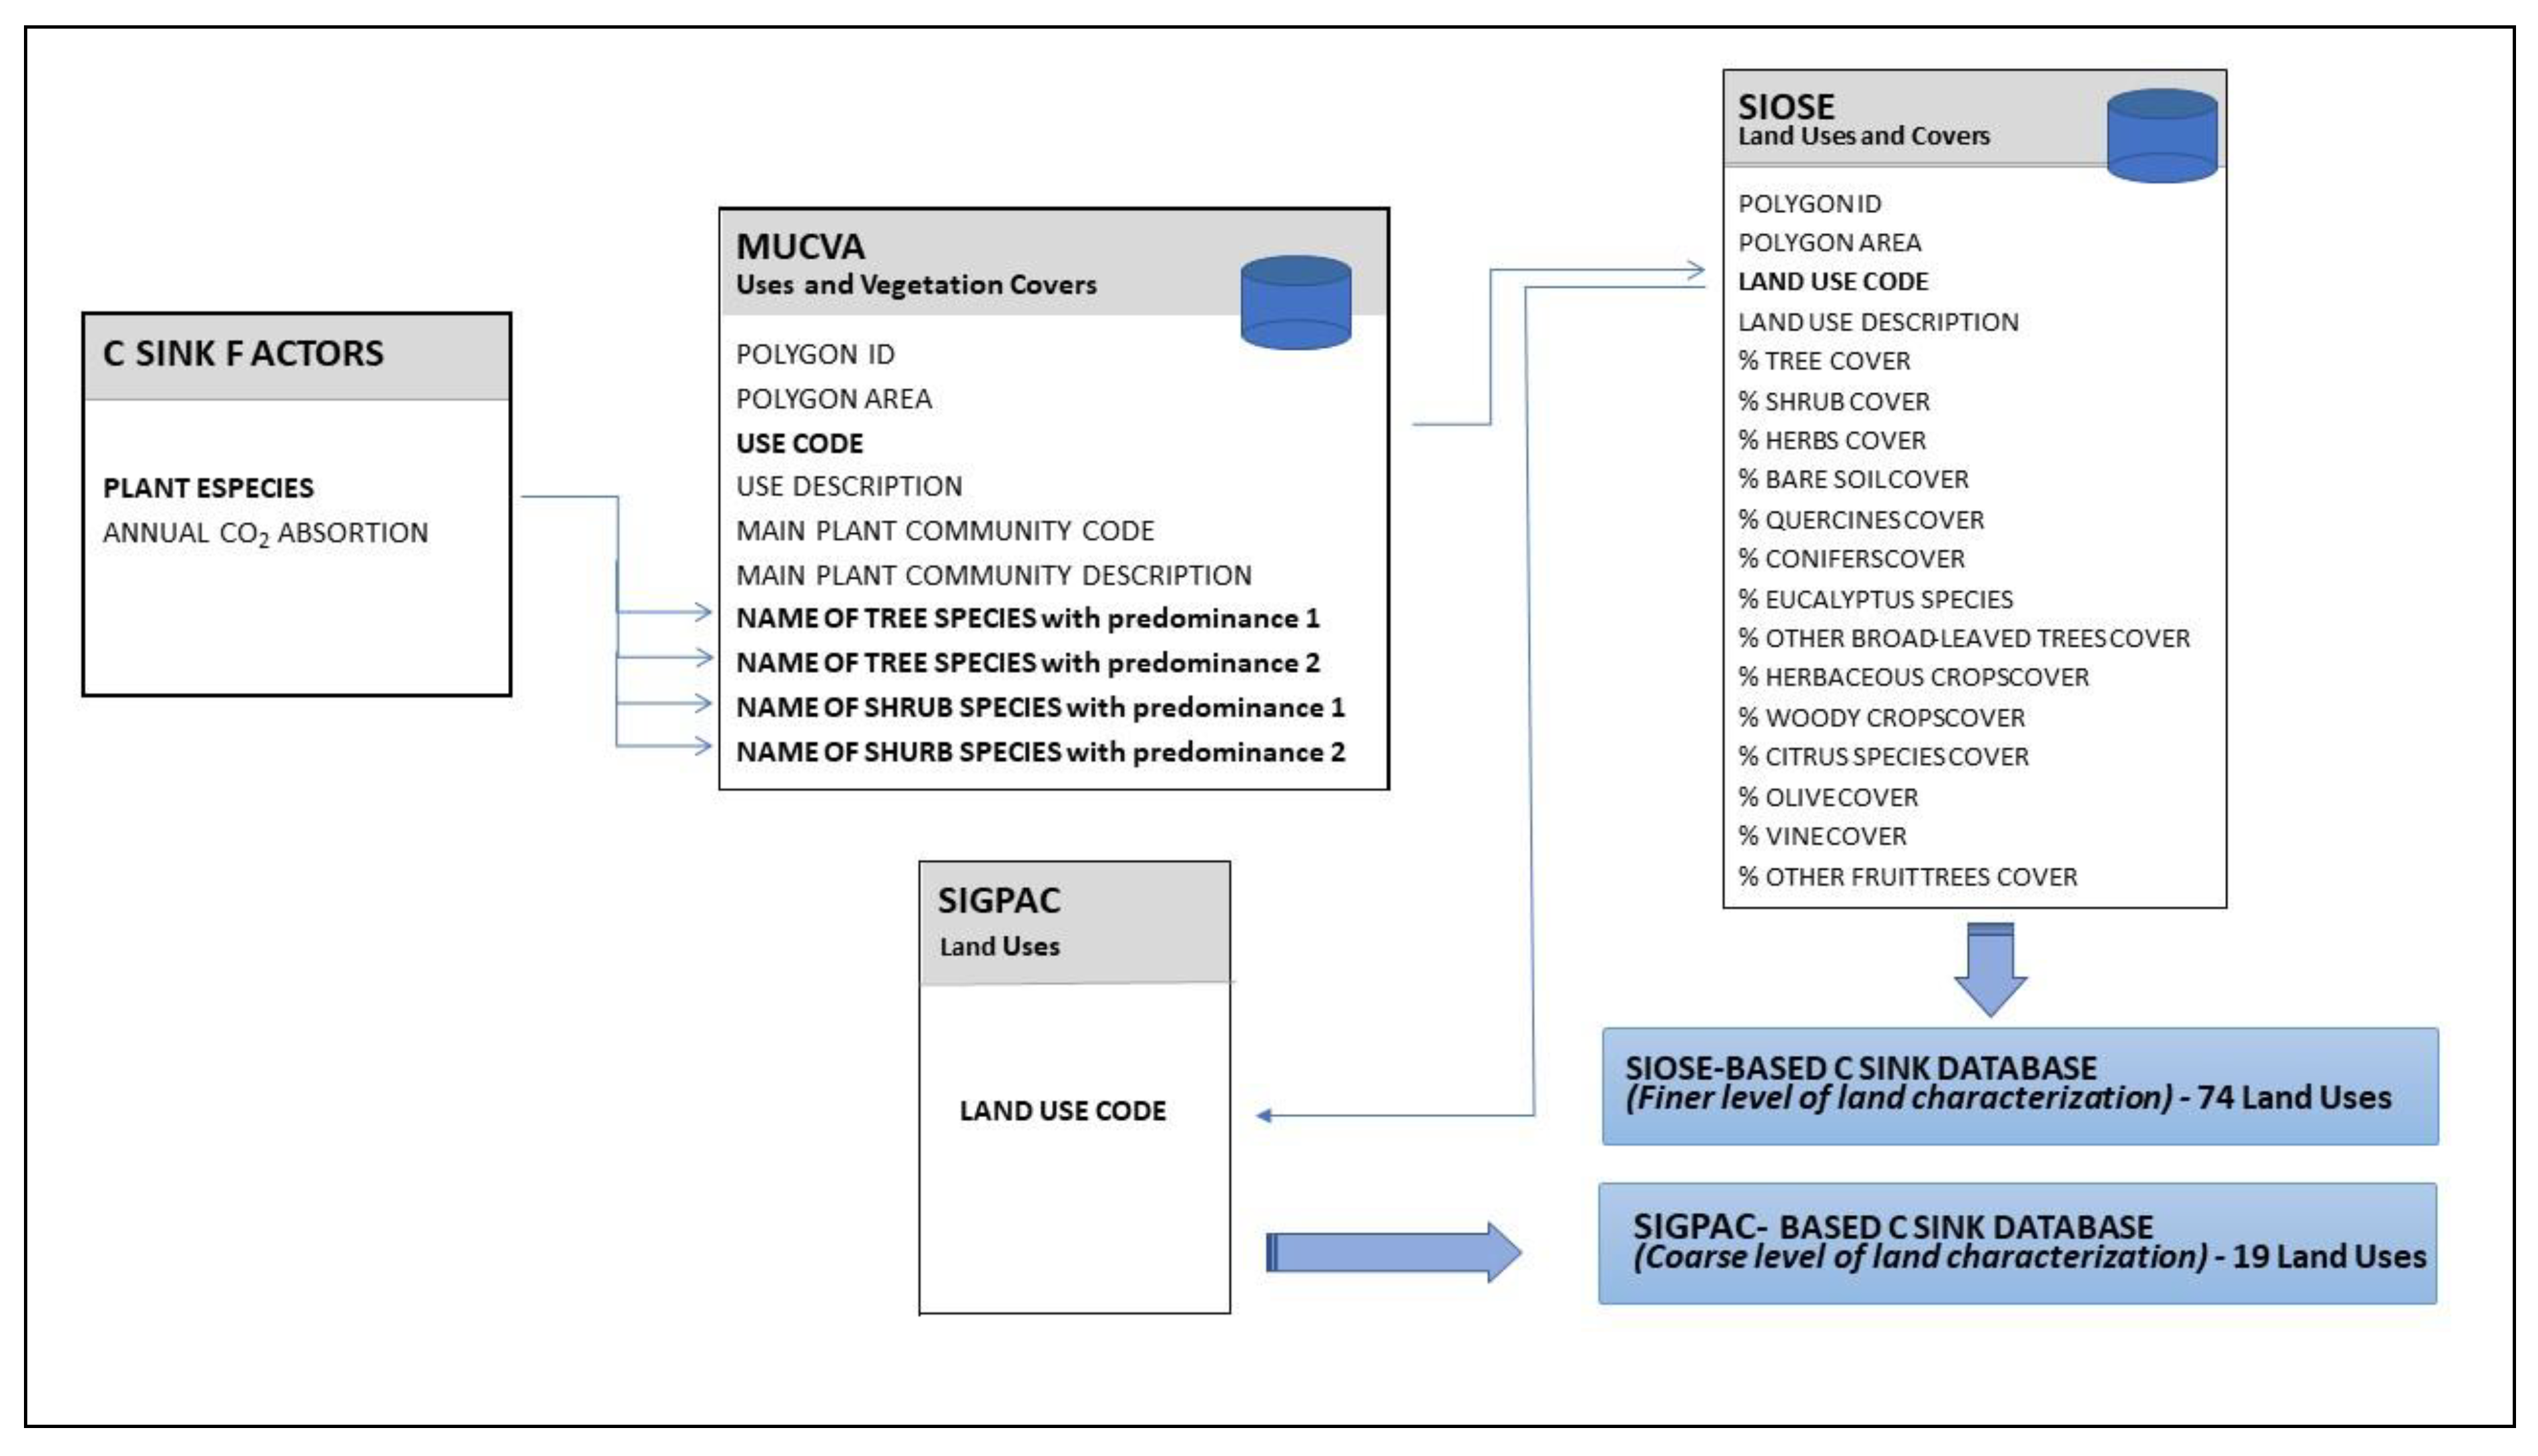
2.2. Development of C Sink Databases

Following both precision and usability criteria cited above, two main C sink databases were developed based on (i) selected maps of land use and covers (i.e., SIGPAC, SIOSE, below introduced), (ii) detailed maps of plant communities describing each land cover (i.e. SIOSE, MUCVA, below introduced), and (iii) associated annual sink factors for individual plant species (Figure 1). All initial data were obtained from existing alphanumeric and spatial information databases available from public repositories under probed quality (i.e., the Environmental Information Network of Andalusia—REDIAM—and the Basic Spatial Data of Andalusia—DERA—by the Statistical and Cartographic Institute of Andalusia).
In a first step, two sources for the territorial characterization, i.e., land uses and cover, were considered. On one hand, land use classes defined by the European Common Agricultural Policy (CAP) for the Spanish territory and established for the Land Parcel Identification System (SIGPAC in Spain), was used. This system identifies a total of 29 land use classes including permanent and non-permanent agricultural uses as well as non-agricultural uses (Table S1). This option offered a great usability advantage in the tool due to easy identification of covers by farmers and technicians, since both farms and the different land uses, they comprise according to this classification are identified by farmers into the SIGPAC to manage the subsidies from the CAP in the Spanish territory. On the other hand, land use classes defined by the Spanish Information System on Land Cover, SIOSE (1:25,000 scale; year 2013) was used. This is a standardized and harmonized database developed in the frame of the INSPIRE European Directive, providing land cover information supplied by the regional governments and the General State Administration in Spain. SIOSE would be comparable to the European CORINE Land Cover but providing a higher resolution. This map includes spatial information of 182 uses in the Andalusian territory, as well as the percentage of the different vegetation strata (trees, shrubs, herbs; also, bare soil) and the main groups of plant species (quercines, conifers, eucalyptus species, other broad-leaved trees, herbaceous crops, woody crops, citrus species, olive groves, vineyards, other fruit trees) (Table S2). Although both the Spanish National Geographic Institute (IGN) and the autonomous communities provide a generalization of SIOSE with the European land database CORINE Land Cover (1:100,000 scale), SIOSE (1:25,000 scale) was selected for use in this work due to its finer resolution. Since this classification is exhaustive and complex, land use and cover classes should be often difficult to be properly selected by farmers but, on the other hand, they are easily related to the SIGPAC classification (Table S1).
The identification of particular plant communities, the percentages of plant coverings, and their accurate description in each of the land use and cover classes were obtained by relating spatial data from SIOSE to those comprised in the Map of Uses and Vegetation Covers of Andalusia, here cited as MUCVA (1:25,000 scale; year 2007, detailed level). MUCVA provides information about plant communities as well as the identification of principal and secondary woody plant species of trees and shrubs growing through the Andalusian territory (Table S3). In this case, 66 types of plant coverings and 1450 plant communities here described have been used from MUCVA. All this information of interest from SIOSE and MUCVA was combined and extracted to each of the Andalusian municipalities as the finest available territorial unit, by means of data management in a Geographic Information System (GIS). This extraction, classified by province and municipalities, was obtained through consecutive intersection operations by using the software ArcGIS 10.3.1. (ESRI, TM; 2015). As a result, the corresponding vegetation maps to each of the Andalusian provinces and municipalities were produced. Subsequently, alphanumeric information was translated into a worksheet to make possible its use inside the CF tool.
Previously calculated annual C sink factors were finally associated with the plant species defined by MUCVA in the worksheet. C sink factors were considered on the basis of the annual growth rates and biomass accumulation for each assessed plant species and size. Annual C sink factors were obtained from the National Forest Inventories [31], the inventories of CO2 sinks in Andalusia and Spain [32,33], and the Ex Ante CO2 Absorption Calculator of Spanish Tree Forest Species, provided by the Spanish Ministry of Agriculture and Fisheries, Food and Environment [34]. To this aim, a modal value of plant size and annual C sink was established for the majority of woody species represented in the territory. Modal size values were used instead of the mean sizes to assure that we worked with the individual sizes better represented in the territory.
In order to facilitate the use by farmers and technicians, all the information was reduced to the finest available territorial unit, the totality of the Andalusian municipalities, as expressed above. On one hand, data regarding plant species were translated to their correspondent C sink values to make possible further calculations with the associated land uses. An importance of 60% of the sink value was considered for principal tree and shrub species, 40% of the sink value for secondary species, and 100% of the proper C sink value was applied in the case of uses where only one principal species of tree and/or shrub is defined. For those species lacking a proper annual C sink value, the correspondent value from the nearest species pertaining to the same genus and habitat was applied. For the remaining shrub species of large and medium sizes lacking reference sink values, a standard value (0.3 kg of CO2 per individual and year), corresponding to the minimum value associated with the assessed species was applied. For those small-sized shrub species (mainly chamaephytics and similar to e.g., Lavandula or Rosmarinus genus) lacking reference sink values, a standard value of 0.1 kg of CO2 per individual and year was applied. On the basis of previous work with available data and sink values, standard factors of 0.3; 7.47; 7.47, and 5.69 kg of CO2 per individual and year were applied for coverings such as vineyards, citrus trees, other fruit trees, and other broad-leaved tree species, respectively. Finally, for the herbaceous stratum, a maximum standard sink value of 0.1 kg of CO2 per m2 and year was applied. In addition, arable lands were not included in the calculations since they are likely considered a significant risk of carbon loss [35], and were in contrast included together with the rest of GHG accounting in the CF tool. As a final step, information about estimated absorptions by plant individuals was translated to sink values per unit of vegetation coverage and hectare. This was calculated on the basis of basal crown area calculation decisions to each type of plant covering, through spatial analysis of orthophotography and random measurements of modal-sized crowns by using the Google Earth Pro application (Google LLC).
To develop the two final C sink databases associated with land uses established in both SIGPAC (coarse level of land characterization) and SIOSE (finer level of land characterization), weighted averages were firstly calculated to obtain mean values of both plant strata coverings (% based on SIOSE information, see Table S2) and the associated annual C sink values of individual plant species for those polygons with the same land use inside the same municipality. This work was carried out by applying a case labeling system and subsequent analysis with IBM SPSS Statistics version 25.0 [36]. Thus, polygons with a wider representation inside each land use in a municipal territory will receive higher importance in the calculation of the C sink rate associated with such land use. Weighted averages were both calculated to obtain mean values of plant strata coverings and annual C sink values for the different SIGPAC and SIOSE land uses inside each of the Andalusian municipalities. As a result, C sink values were finally associated to land uses established in every municipality to both SIGPAC and SIOSE (Figure 1), according to their correspondence with the percentage of covering of vegetation strata defined by SIOSE, plant species expressed by MUCVA, and their correspondence with uses defined in SIGPAC or SIOSE, respectively. Total C sink factors expressed as Tn ha−1 year−1 to each land use in each municipality and reference worksheet (SIGPAC or SIOSE based) was calculated as the sum of the final sink values per vegetation stratum.

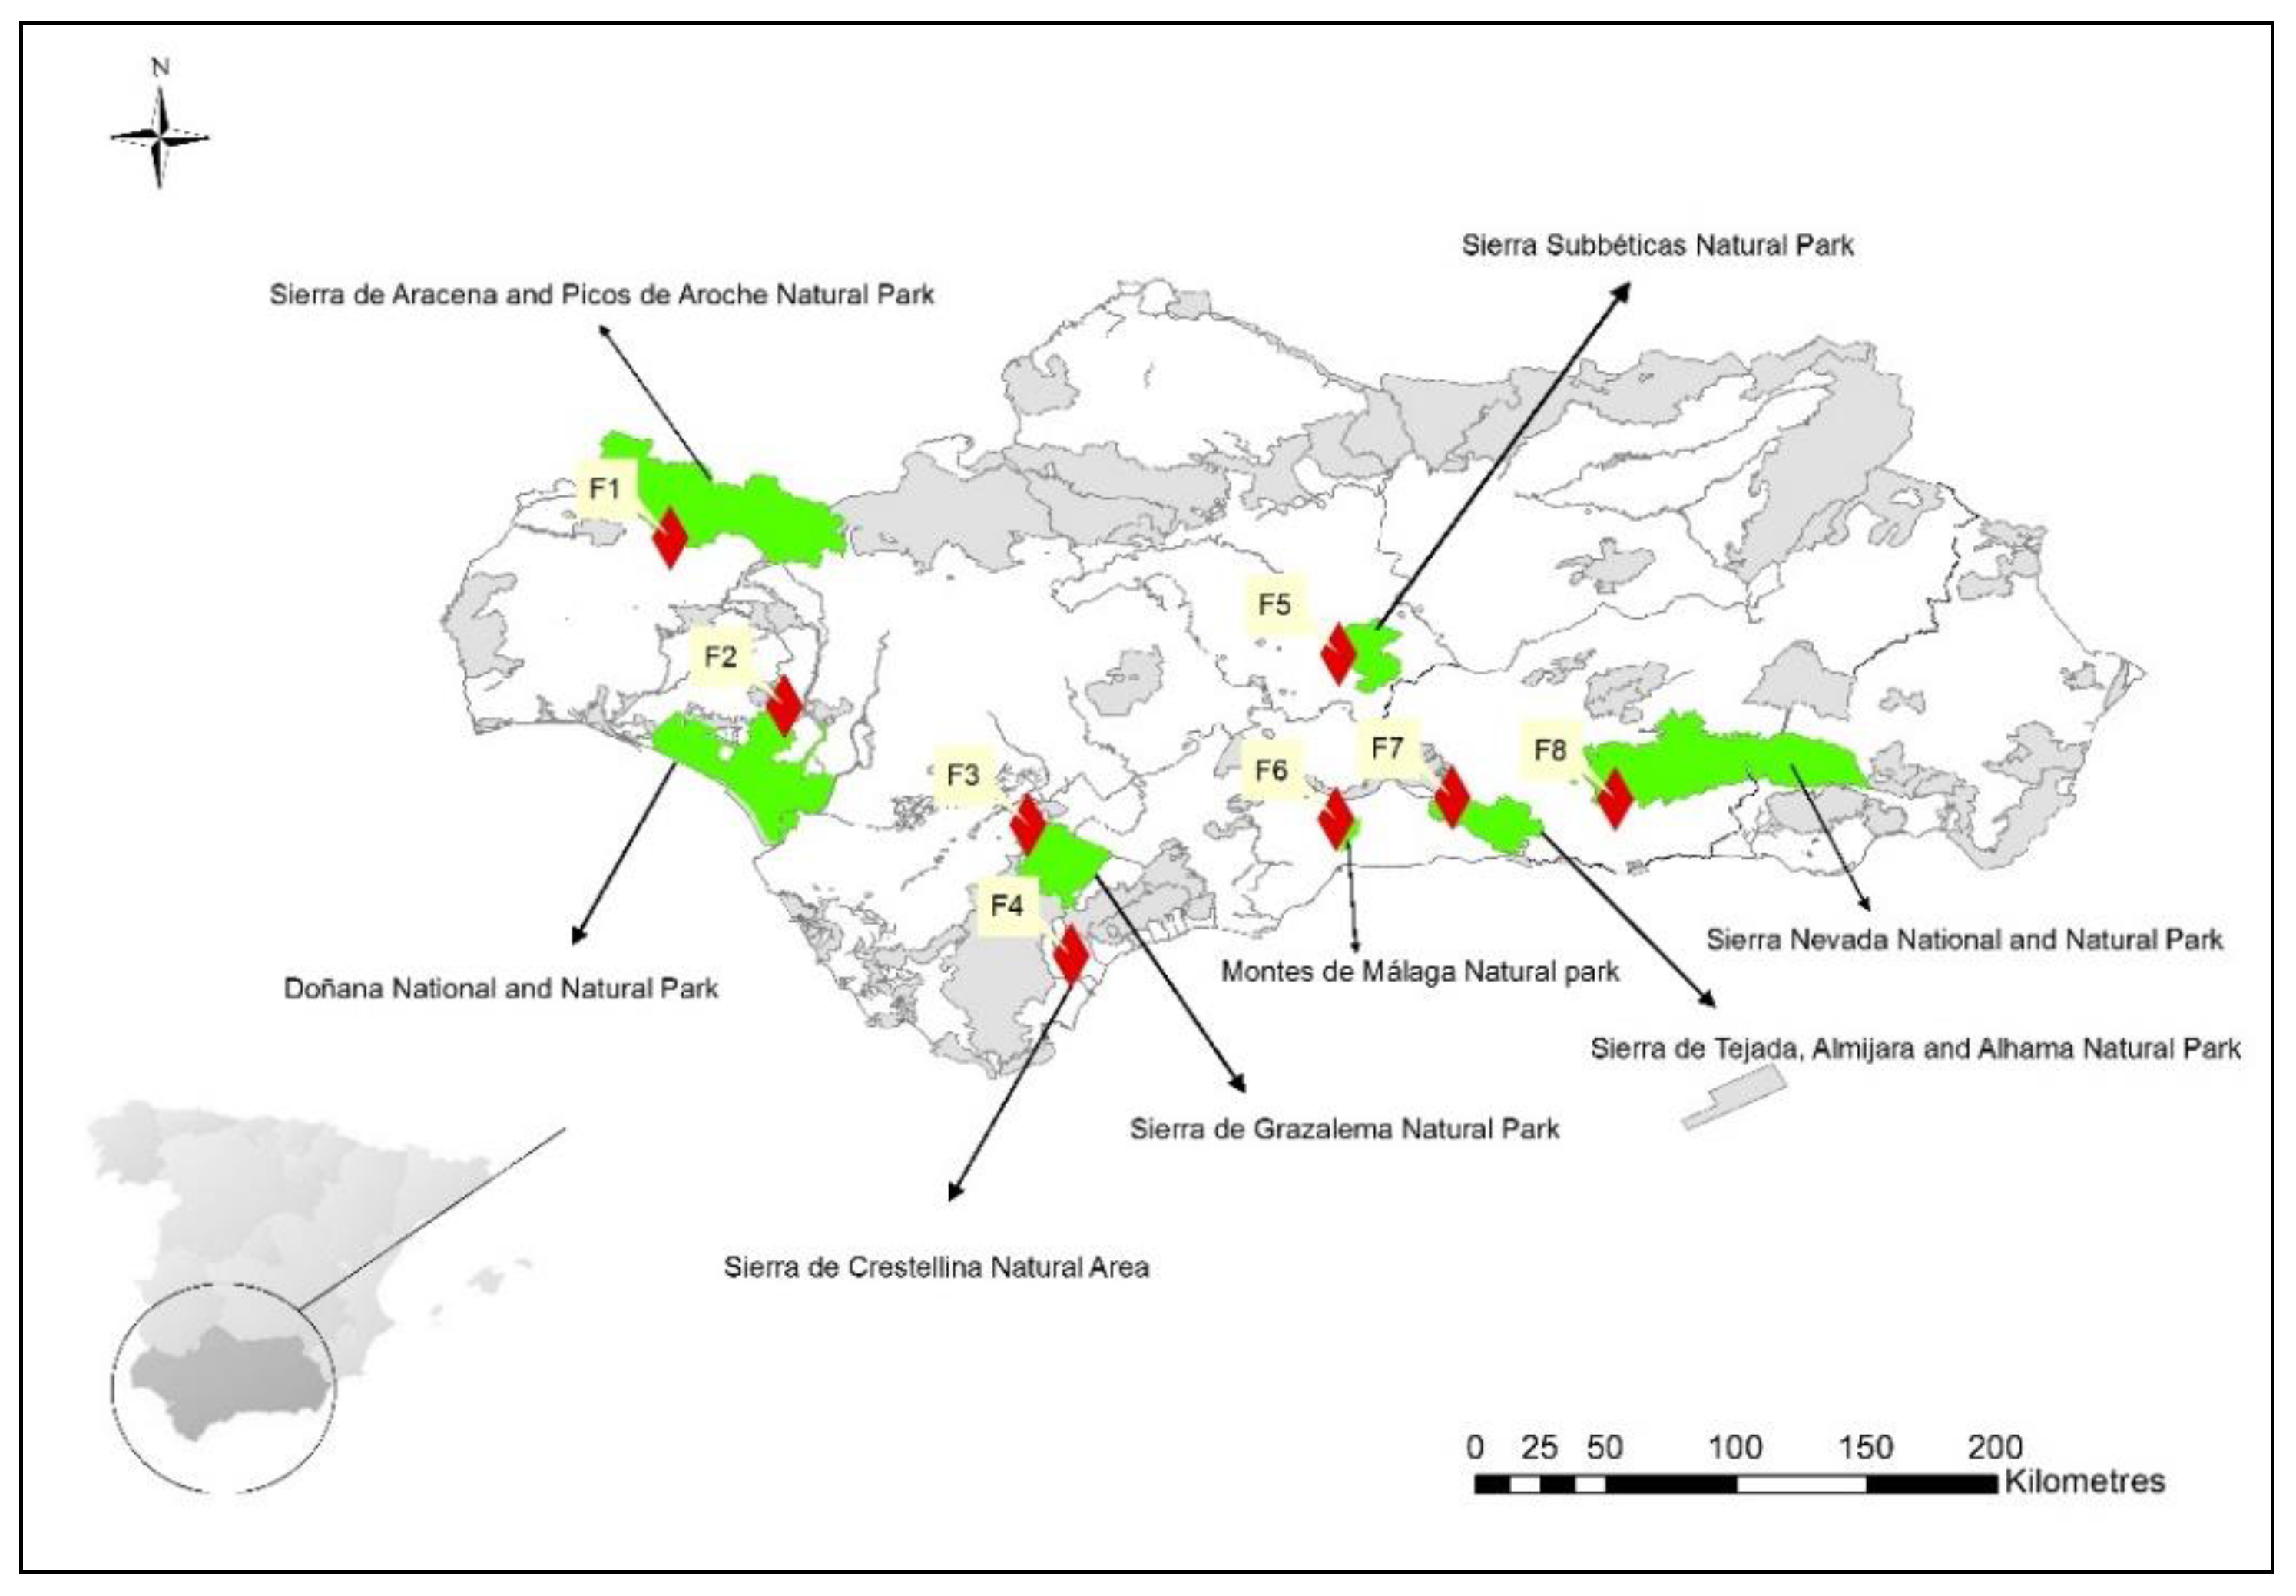
2.3. In Situ Farm Assessment and Tool Testing

To test the goodness of fit of the two described models generated at the territorial level (SIGPAC-based and SIOSE-based C sink databases), a total of 8 ruminants livestock farms (all of which include goat herds) located throughout the Andalusian territory were selected. These farms are under contrasted climate conditions and associated with different protected natural areas and showing different degrees of use of the territory (Figure 2). The associated plant C sinks were assessed in situ to a detailed scale by applying the methodology described by Muñoz-Vallés et al [19]. Results would serve as control values in comparison with those obtained through the application of the C sink databases developed from SIGPAC and SIOSE. To this end, and in close collaboration with farmers, vegetated areas used for grazing by livestock were identified, and exhaustive plant inventories and samplings of the plant biomass were carried out in each case.
Vegetation samplings were carried out in 2018. Previous to farm visits, a preliminary characterization of vegetation units were developed on the basis of homogeneous vegetation areas identified in recent aerial digital orthophotographs (year 2016, color, 0.25–0.5 m per pixel). Those units were further verified and corrected at the field, and the identification of existing woody plant species, abundance (as both relative cover and number of individuals per ha), the establishment of modal sizes (through biometrics measures of diameters of trunk diameters at breast height, crown diameters and heights), together with the relative coverings of the herbaceous layer was recorded for each vegetation unit. All this information was incorporated into a GIS (ArcGIS 10.3.1. ESRI, TM) to facilitate further calculations. In addition, random 1 km2 × 1 km2 plots were established into GIS, and measures of a number of woody species individuals and relative coverings were carried out to corroborate and extend measures developed at the field. C sink factors previously selected for woody species and herbs above described were finally applied to the inventories and the corresponding annual C sink capacity was calculated for each experimental farm.
Finally, according to the monitored areas, both the SIGPAC and SIOSE-based C sink databases were applied and corresponding C sink values for each experimental farm were calculated on the basis of the vegetated areas used for grazing. With the purpose of comparing these tools developed in the present work with previous studies, and as an additional testing approach, C sink values of experimental farms were also calculated by applying the methodology described by Petersen et al. [37] (hereinafter referred to as “Petersen methodology”), based on the assessment of soil C storage into a 100-year account perspective to allocate soil C changes and applied to several studies in relation with the CF assessment of ruminant farms [8,12,13,23].

2.4. Statistical Analysis
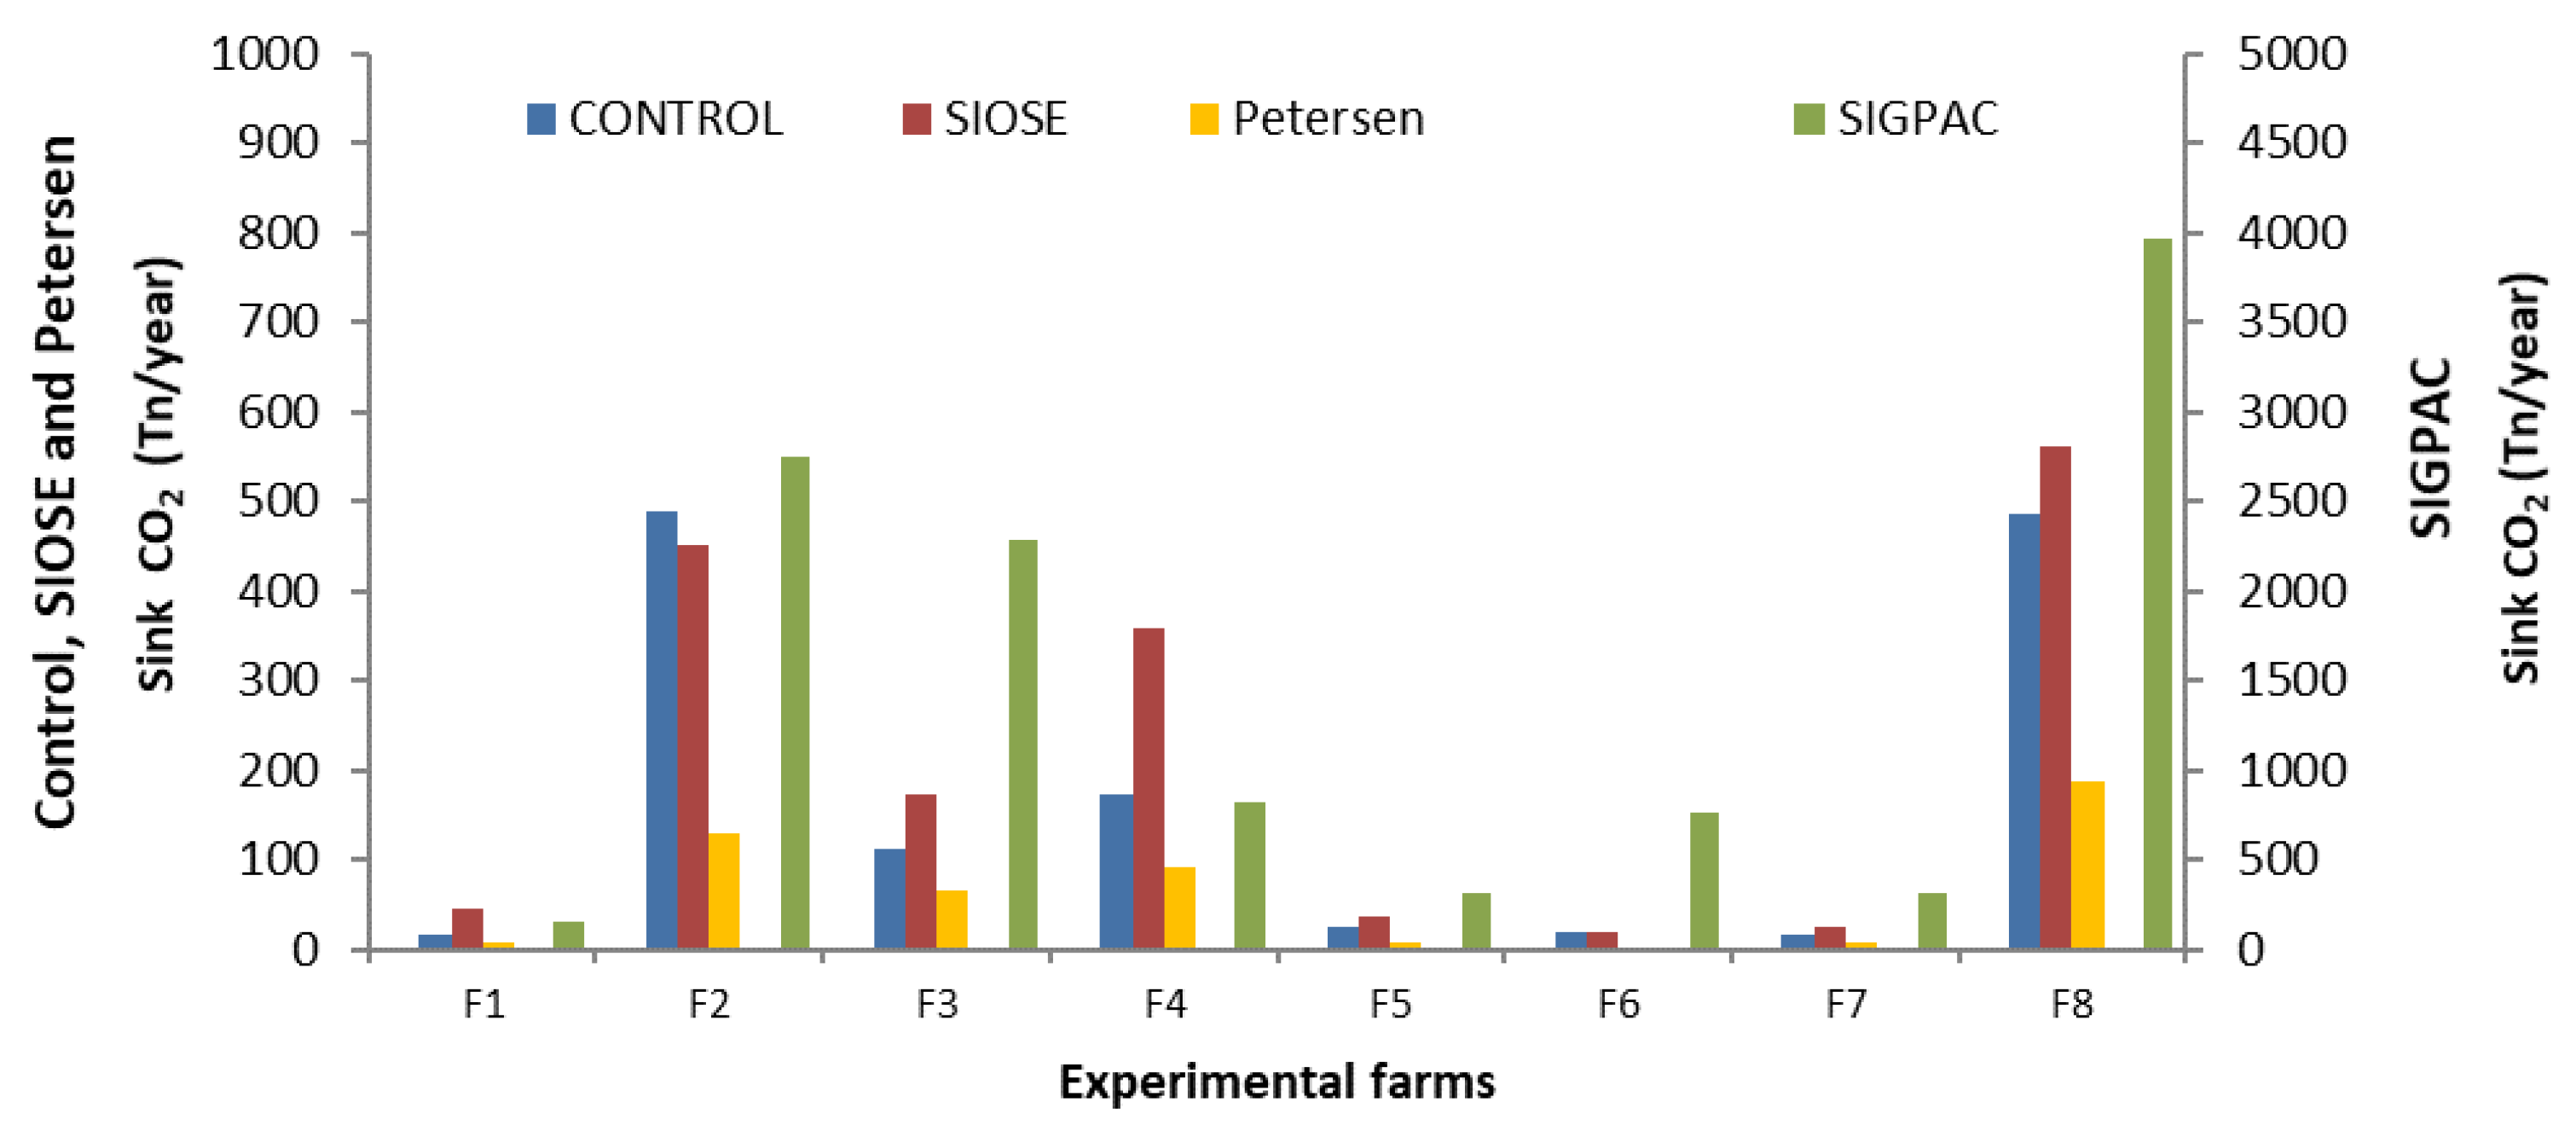
C sink values per ha and year obtained during the in situ detailed scale assessment to each of the 8 experimental farms were compared with results obtained from the SIGPAC and SIOSE-based C sink databases and those obtained by applying the Petersen methodology. To this aim, U Mann-Whitney analysis on Statistica 8 software [38] was applied.

3. Results

Plant coverings considered in the study were woody vegetation (trees and shrubs strata) and herbs (Table S2). A total of 19 land uses comprising suitable plant coverings were finally selected for the SIGPAC-based C sink database and 74 land uses were considered in the case of the SIOSE-based database (Table S1). Other uses lacking natural or seminatural vegetation or woody crops (e.g., artificial surfaces and infrastructures, urban areas, water bodies, beaches, and dunes, etc.) were not included in the databases. Under such conditions, sink calculations covered a totality of 778 Andalusian municipalities, which meant 99% of the total. The establishment of C sink values for plant species included a total of 52 forest and crop woody species. Sink factors per plant individual showed a modal value of 6.68 kg CO2 year−1 and a mean value of 11.52 ± 2.25 kg CO2 year−1 (mean ± S.E.). Regarding the developed C sink databases, the SIGPAC-based one comprised 5542 cases of land uses in the 778 municipalities evaluated, while the SIOSE-based C sink database contained a total of 1,248,513 cases of land uses in those municipalities, due to a higher number of land use classes and thus a more detailed spatial characterization of the territory in the second case.
The in situ assessment of the 8 pastoral-based farms comprised a total of 3345.78 hectares of territory used for grazing by livestock (Table 1). The sink capacity of the vegetation assessed in these 8 farms varied from 16.49 t CO2 year−1 to 487.62 t CO2 year−1, depending on the total surface used for grazing, and the composition and abundance of plant species in each case (Table 1), with a clear weight of contribution of woody vegetation to the total sink in comparison with the herbaceous stratum (Figure S1). The average CO2 sink capacity per ha and year was 0.48 ± 0.13 t CO2 ha−1 year−1 (mean ± S.E.), with a minimum of 0.25 and a maximum of 1.37 t CO2 ha−1 year−1.
Sink values obtained for the 8 experimental farms by applying the developed SIGPAC-based C sink database, the SIOSE-based C sink database, and the Petersen methodology varied between 3965.62 and 163.23 t CO2 year−1, between 560.46 and 19.09 t CO2 year−1, and between 3.58 and 188.56 t CO2 year−1, respectively (Figure 3). Total sink values were significantly higher in the case of the application of the SIGPAC land uses for the land characterization, up to an order of magnitude higher, to every assessed farm, while values obtained from the SIOSE and Petersen methodology approaches provided more moderate values, closer to the control ones (Figure 3).
The average CO2 sink values per ha and year were 10.15 ± 6.47 t CO2 ha−1 year−1 when calculated using the SIGPAC-based database, 0.63 ± 0.11 t CO2 ha−1 year−1 when calculated with the SIOSE-based database, and 0.16 ± 0.01 t CO2 ha−1 year−1 when calculated by applying the Petersen methodology, with minimum values of 1.37, 0.40, and 0.14 t CO2 ha−1 year−1, and maximum values of 55.29, 1.38, and 0.26 t CO2 ha−1 year−1, respectively (Table 2). These values were again significantly higher in the case of the SIGPAC-based database, while values from the application of the SIOSE-based database and the Petersen methodology were nearer to the control ones. In addition, values obtained from the Petersen methodology were relatively homogeneous, independently from the composition and abundance of species in the assessed areas.
Values of annual C sink per ha obtained through the detailed in situ assessment, the use of the coarse and finer level of land characterization databases (SIGPAC- and SIOSE-based C sink databases), and the application of the Petersen methodology for each experimental farm showed significant differences in every case (p ≤ 0.05; Table 2 and Table S4).

4. Discussion

4.1. Methodological Advances in Estimating the C Sink Capacity of Pastoral Livestock and Its Incorporation into the Calculation of the CF

The passive absorption of CO2 carried out by the terrestrial vegetation acting as natural C sinks constitute a sustainable way to mitigate Climate Change on the basis of ecosystem resources. In recent years, several studies on pastoral sheep and goat husbandry have demonstrated that a suitable consideration of C absorptions during the estimation of the CF results in marked decreases in total GHG emissions, reporting reductions of up to 23–43% for semi-extensive systems and of >55% for extensive systems [12,13,23]. At present, the scarce studies including some C absorptions values during the CF calculations have mostly considered C stored on soil through Land Use Change analysis [12,13,23,37,39]. Due to the fluxes and storage dynamics of such compartments across the C biogeochemical cycle, C content in soil (SOC) is a relatively stable C stock and may triple the amount of C stored in global above-ground vegetation [29,40]. Nevertheless, different generalized management actions resulting in SOC increases (e.g., adding organic materials such as crop residues or animal manure to soil) do not necessarily constitute an additional transfer of atmospheric C to land [40]. In addition, although it is possible to obtain values of the annual amount of CO2 removed from the atmosphere from data of SOC over time, those values show the cumulative result of the historical forms of management that occurred in a given area, which may not be really associated with the current activity during the CF assessment. All this highlights the importance of considering net C sinks (effective pathways to absorb C from the atmosphere) during the accounting of efficient C removals from the atmosphere, instead of C sequestration in terms of net C increases in SOC along wide periods of time.
The C sink values found in the in situ detailed assessment were consistent with the results obtained in previous studies that use models based on allometric equations to calculate plant biomass, on annual plant growth rates of the species, or even gas interchange to estimate the annual rates of sequestration and carbon storage [21,27,28,41,42,43,44,45]. This sink ability of naturally vegetated areas used for grazing has been shown to be mainly supported by woody vegetation, where shrublands have played a relevant role in parallel to forests. In this regard, several authors have considered a poor sink ability by grasslands [32]. Nevertheless, natural grasslands have shown a higher C sink potential when compared with managed soils and arable lands [40], thus highlighting their contribution to climate change mitigation.
When considering the territorial approaches through the implementation of land use and vegetation maps, the remarkably higher sink values found by the application of the SIGPAC-based C sink database responded to a poor definition of plant covers, particularly when considering forest areas. This led to a rough accumulation of variances by both bringing together the different uses of SIGPAC existing in a municipal term and working with average values of the different plant strata. Although this approach was really easy to implement and use by farmers, land characterization to this level resulted in a too-high focus on crops while forest areas were poorly differentiated. In this regard, further efforts should focus on the ability of farmers to select better-defined vegetation classes in the case of forest areas. In this same sense, the methodology developed by Petersen et al. [37] was also easy to apply and provided values nearer to the control ones. However, since it is based on the raw amount of woody vegetated surface in our case study, independently from the plant species composition, it offered relatively homogeneous sink results per ha and year when applied to significantly different land compositions. Thus, further application of suitable adaptations in the C sink calculator tool, for instance, through a more precise definition of the abundance of woody vegetation from their covers by the application of predictive adjustment models, is strongly required in such cases.
On the other hand, the SIOSE-based C sink database provided a better adjustment to the reality of land uses in the farms and showed little differences with the control, of both total values applied to the farm and in terms of values per hectare. Again, this variation would be explained by the accumulation of variance when we bring together the different uses of SIOSE and average plant coverings in each municipal term. In this sense, some adaptations on this database regarding woody vegetation coverings would offer values nearer to the control ones. Furthermore, the difficulty of application for the final users (farmers) could be handled with the support of technicians, since the correct identification of plant strata is only required during the first use of the CF tool.
The present approach developed from the application of precise vegetation inventories (supported by public information and maps of land covers and vegetation), together with individual C sink values per plant species (also developed from public information), has resulted in a suitable and accurate method to include such calculations in the establishment of the farms’ CF, and is, in addition, able to be applied in contrasting areas worldwide (e.g., Rakotovao et al [46]). In this regard, further measurements and the development of datasets offering C sink values for a wider list of plant species growing in the territory would be needed to improve the precision of the assessments. In addition, other computational options allowing the spatial analysis of the territory, linking the citing maps and delimitations of farms over Geographic Information Systems, for instance, would improve the obtained results. Finally, full accountings of net absorptions by photosynthesis plus GHG losses via organic matter decomposition and respiration on soil needs to be taken into account for a complete assessment of forest, shrublands, and grasslands as natural C sinks [40].

4.2. Recognition and Valorization of the C Sink Capacity as Ecosystem Service of Pastoral Livestock

Traditional grazing systems play a critical role in the survival of people living in some marginal lands [5], in addition to the relevant role in the management and maintenance of natural ecosystems they play, directly related to atmospheric C sink and climate change mitigation. Nevertheless, several reasons of economic and social nature have contributed to a current clear regression of pastoral livestock farming occurring in developed countries. In Spain, the grazing livestock population has been found to drop by almost 50% in the last 25 years [47]. Grazing systems in Spain are located mainly in mountainous lands, semi-arid and/or marginal areas, and most of the milk-orientated grazing goat systems have undergone a similar intensification and mechanization process to systems rearing other livestock species [48]. In this sense, most of the goat farming systems in the central-western area of Andalusia were highly extensive in the 1990s [49] while up to 47% of the farms were found to be intensively or semi-intensively managed in 2010 [50]. On the other hand, traditional meat-producing systems, based on the use of very rustic endangered breeds and large grazing lands, are also in clear regression or under imminent risk of disappearance [13]. In the case of Andalusia, there are two meat-oriented autochthonous breeds, Blanca Serrana (BS) and Negra Serrana (NS) and, in only ten years, 19.6% of BS herds and 90% of NS herds have disappeared [51]. Regarding this, difficulties by consumers to identify and access differentiated pasture-based products have been identified by stakeholders as one of the main problems [13].
Grazing lands can provide a wide array of Ecosystem Services (ES) that depend on their management practices and intensity [52]. Nevertheless, although citizens have better knowledge of other ES, such as forest fire prevention [53], the contribution to the maintenance of pastures as C sinks has not yet been properly recognized and, therefore, rewarded. Linking ES, including C sinks, to the products (via labeling, for instance) would favor a better positioning in the markets. In addition, a payment for the regulation ES provided, included in the new Common Agriculture Policy (CAP), would contribute to improving the profitability of this livestock farming model, thus favoring the generational change in rural areas and, thereby, preventing its disappearance. In the belief that the benefits of traditional pastoralism cannot be ignored, some progress is being made because the absence of grazing may result in loss of biodiversity and reduced ecosystem functions [54]. Nevertheless, a little knowledge regarding ES provided by extensive herds has resulted in an inadequate design of CAP aids, particularly in the first Pillar including direct payments and market measures [55]. The new CAP, currently under discussion, establishes that the Member States shall provide, in their strategic plans, support for voluntary payment schemes for the climate and the environment (´eco-schemes´), to reward and incentivize farmers or groups of farmers who make commitments to develop more sustainable farm and land management aiming to maintain public goods [56]. Regarding this strategic plan, Spain has proposed eight eco-schemes, the first of which is directly related to the role of extensive livestock in maintaining natural C sinks, ´Eco-scheme 1. Improving the sustainability of pastures, increasing the capacity of the carbon sink and prevention of fires through the promotion of extensive grazing´. Agro-forest-pastoral systems, in addition to food for pastoral livestock, can play an important role in the reduction of global GHG emissions. Achieving stable values of organic C soil stocks in such systems depends on the vegetation present, but also on climate, lithology, soil type and use, and handling and management of these systems [22]. The latter includes the presence of ruminant herds under extensive models and rational use and maintenance of natural resources through suitable management systems avoiding under- or overgrazing. In addition to increasing the C sink capacity of the lands, encouraging a controlled grazing activity in wooded and shrub grasses in areas with a high probability of fires will help to prevent fire events and fire spread. Under the Eco-scheme 1 above cited, the farmer will benefit from a payment per eligible hectare that includes not only permanent pastures but also shrubs and wooded pastures, after verifying that effective grazing is been carried out [57]. Thus, the methodology here developed for the accounting of natural C sink, maintaining a balance between precision and usability, may be useful in this background to calculate and implement the payment for the ES of pastoral livestock farming collected in the Spanish Eco-scheme 1.

5. Conclusions

Implementing the assessment of C sinks during the CF calculation is a current need to highlight and put in value this ecosystem service linked to pastoral livestock activity. The present approach, developed from the application of precise vegetation inventories together with individual C sink values per plant species, provides a methodological advance in the estimation of the C sink capacity associated with pastoral livestock farms. The effort made to maintain a balance between precision and usability facilitates their incorporation into the CF calculation and makes it useful to calculate and implement this regulating ecosystem service in the payments for the ES of pastoral livestock farming collected in the European CAP co-schemes under development.

Supplementary Materials

The following are available online at https://www.mdpi.com/article/10.3390/su13116085/s1, Figure S1. Contribution of the three different vegetation strata to the total calculated C sink values (kg CO2 ha−1 year−1) in the 8 experimental farms though the detailed in situ assessment. TR: Trees; SH: Shrubs; HE: Herbs. Table S1. Land use classes in SIGPAC and SIOSE selected for the assessment of the Andalusian natural C sinks associated to livestock farms, and concordances between both classifications. Table S2. Selected fields included in the SIOSE 2013 database and used for the development of the SIOSE-based C sink database to the assessment of natural C sink associated to the Andalusian livestock farms. Table S3. Selected fields included in the MUCVA 2007 (detailed scale) database, used for the development of the C sink databases to the assessment of natural C sink associated to the Andalusian livestock farms. Table S4. Results of the Mann-Withney U Test comparing C sink values (t CO2 ha−1 year−1) obtained in the 8 experimental farms from the different methodology (CONTROL = in situ detailed assessment; SIGPAC= application of the SIGPAC- based C sink dababase; SIOSE = application of the SIOSE-based C sink dababase; Pertersen = appplication of the Petersen methodology). Asterisks indicate significant differences (* p < 0.05; ** p < 0.005; *** p < 0.001).

Author Contributions

Conceptualization, S.M.V., J.M.M.-L. and Y.M.; Methodology, Formal analysis and Data curation, S.M.V.; Investigation and writing edition, S.M.V., Y.M., J.M.M.-L. and E.M.-J. Supervision and funding acquisition, Y.M. All authors have read and agreed to the published version of the manuscript.

Funding

This research was financed through Measure 16 of the Rural Development Program of Andalusia 2014–2020, included in the grants for the creation and operation of the Operational Groups of the European Innovation Partnership (EIP-Agri) in matters of agricultural productivity and sustainability, and co-financed by the European Union through the European Agricultural Fund for Rural Development (90%) and by the Andalusian Regional Government (10%) (Project GOP21-GR-16-0016).

Institutional Review Board Statement

Not applicable.

Informed Consent Statement

Not applicable.

Data Availability Statement

Not applicable.

Acknowledgments

We thank the Regional Ministry of Agriculture, Livestock, Fisheries and Sustainable Development of the Andalusian Government (Junta de Andalucía), the Statistical and Cartographic Institute of Andalusia, and the Spanish National Geographic Institute for the information made available to the public through its different download portals. Special thanks are also given to all the farmers who kindly participated in this study, making their farms available for the research.

Conflicts of Interest

The authors declare no conflict of interest section.

References

  1. Revision of World Population Prospects Twenty-Sixth Round; Department of Economic and Social Affair: New York, NY, USA, 2019. Available online: https://population.un.org/wpp/ (accessed on 10 April 2021).
  2. Alexandratos, N.; Bruinsma, J. World Agriculture Towards 2030/2050; The 2012 Revision; Global Perspective Studies Team; ESA Working Paper No. 12-03; Food and Agriculture Organization of the United Nations: Rome, Italy, 2012. [Google Scholar]
  3. Bruinsma, J. World agriculture: Towards 2015/2030—An FAO perspective. Earthscan, London and FAO, Rome. Available online: http://www.fao.org/fileadmin/user_upload/esag/docs/y4252e.pdf (accessed on 5 April 2021).
  4. Sustainable Agricultural Development for Food Security and Nutrition: What Roles for Livestock? A Report by the High Level Panel of Experts on Food Security and Nutrition. Committee on World Food Security: Rome, Italy, 2016. Available online: http://www.fao.org/3/mq860e/mq860e.pdf (accessed on 1 April 2021).
  5. Garnett, T.; Godde, C.; Muller, A.; Röös, E.; Smith, P.; de Boer, I.J.M.; zu Ermgassen, E.; Herrero, M.; van Middelaar, C.; Schader, C.; et al. Grazed and Confused? Ruminating on Cattle, Grazing Systems, Methane, Nitrous Oxide, the Soil Carbon Sequestration Question—and What It All Means for Greenhouse Gas Emissions; Food Climate Research Network, University of Oxford: Oxford, UK, 2015. [Google Scholar]
  6. Gerber, P.J.; Steinfeld, H.; Henderson, B.; Mottet, A.; Opio, C.; Dijkman, J.; Falcucci, A.; Tempio, G. Tackling Climate Change Through Livestock—A Global Assessment of Emissions and Mitigation Opportunities; Food and Agriculture Organization of the United Nations: Rome, Italy, 2013. [Google Scholar]
  7. Zervas, G.; Tsiplakou, E. An assessment of GHG emissions from small ruminants in comparison with GHG emissions from large ruminants and monogastric livestock. Atmos. Environ. 2012, 49, 13–23. [Google Scholar] [CrossRef]
  8. Batalla, I.; Knudsen, M.T.; Mogensen, L.; Hierro, Ó.; Del Pinto, M.; Hermansen, J.E. Carbon footprint of milk from sheep farming systems in Northern Spain including soil carbon sequestration in grasslands. J. Clean. Prod. 2015, 104, 121–129. [Google Scholar] [CrossRef]
  9. Steinfeld, H.; Gerber, P.; Wassenar, T.; Castel, V.; Rosales, M. Livestock’s Long Shadow: Environmental Issues and Options; Food and Agriculture Organization: Rome, Italy, 2006. [Google Scholar]
  10. Pirlo, G.; Terzano, G.; Pacelli, C.; Abeni, F.; Carè, S. Carbon footprint of milk produced at Italian buffalo farms. Livest. Sci. 2014, 161, 176–184. [Google Scholar] [CrossRef]
  11. Manzano, P.; White, S.R. Intensifying pastoralism may not reduce greenhouse gas emissions: Wildlife-dominated landscape scenarios as a baseline in life-cycle analysis. Clim. Res. 2019, 77, 91–97. [Google Scholar] [CrossRef]
  12. Gutiérrez-Peña, R.; Mena, Y.; Batalla, I.; Mancilla-Leytón, J.M. Carbon footprint of dairy goat production systems: A comparison of three contrasting grazing levels in the Sierra de Grazalema Natural Park (Southern Spain). J. Environ. Manag. 2019, 232, 993–998. [Google Scholar] [CrossRef] [PubMed]
  13. Morales-Jerrett, E.; Mancilla-Leytón, J.M.; Delgado-Pertíñez, M.; Mena, Y. The contribution of traditional meat goat farming systems to human wellbeing and its importance for the sustainability of this livestock subsector. Sustainability 2020, 12, 1181. [Google Scholar] [CrossRef] [Green Version]
  14. Horrillo, A.; Gaspar, P.; Escribano, M. Organic Farming as a Strategy to Reduce Carbon Footprint in Dehesa Agroecosystems: A Case Study Comparing Different Livestock Products. Animals 2020, 10, 162. [Google Scholar] [CrossRef] [Green Version]
  15. Carbon, A.; Console, G. Carbon Footprint. Carbon Footprint Ltd. Available online: https://www.carbonfootprint.com/offsetstandards.html (accessed on 15 April 2021).
  16. Buratti, C.; Fantozzi, F.; Barbanera, M.; Lascaro, E.; Chiorri, M.; Cecchini, L. Carbon footprint of conventional and organic beef production systems: An Italian case study. Sci. Total Environ. 2017, 576, 129–137. [Google Scholar] [CrossRef] [PubMed]
  17. Ibidhi, R.; Calsamiglia, S. Carbon Footprint Assessment of Spanish Dairy Cattle Farms: Effectiveness of Dietary and Farm Management Practices as a Mitigation Strategy. Animals 2020, 10, 2083. [Google Scholar] [CrossRef]
  18. Pirlo, G.; Carè, S. A Simplified Tool for Estimating Carbon Footprint of Dairy Cattle Milk. Ital. J. Anim. Sci. 2013, 12, e81. [Google Scholar] [CrossRef]
  19. Loyarte-López, E.; Barral, M.; Morla, J.C. Methodology for carbon footprint calculation towards sustainable innovation in intangible assets. Sustainability 2020, 12, 1629. [Google Scholar] [CrossRef] [Green Version]
  20. The Kyoto Mechanism. Available online: https://canviclimatic.gencat.cat/en/oficina/actuacio_internacional/protocol_kioto/mecanismes_del_protocol/ (accessed on 15 March 2021).
  21. Muñoz-Vallés, S.; Cambrollé, J.; Figueroa-Luque, E.; Luque, T.; Niell, F.X.; Figueroa, M.E. An approach to the evaluation and management of natural carbon sinks: From plant species to urban green systems. Urban For. Urban Green. 2013, 12, 450–453. [Google Scholar] [CrossRef]
  22. Fatichi, S.; Pappas, C.; Zscheischler, J.; Leuzinger, S. Modelling carbon sources and sinks in terrestrial vegetation. New Phyt. 2019, 221, 652–668. [Google Scholar] [CrossRef] [PubMed] [Green Version]
  23. Salvador, S.; Corazzin, M.; Romanzin, A.; Bovolenta, S. Greenhouse gas balance of mountain dairy farms as affected by grassland carbon sequestration. J. Environ. Man. 2017, 196, 644–650. [Google Scholar] [CrossRef] [PubMed]
  24. Rodríguez-Ortega, T.; Olaizola, A.M.; Bernués, A. A novel management-based system of payments for ecosystem services for targeted agri-environmental policy. Ecosyst. Serv. 2018, 34, 74–84. [Google Scholar] [CrossRef]
  25. Rebane, S.; Jõgiste, K.; Põldveer, E.; Stanturf, J.A.; Metslaid, M. Direct measurements of carbon exchange at forest disturbance sites: A review of results with the eddy covariance method. Scand. J. For. Res. 2019, 34, 585–597. [Google Scholar] [CrossRef]
  26. Nowak, D.J. Atmospheric carbon reduction by urban trees. J. Environ. Man. 1993, 37, 207–217. [Google Scholar] [CrossRef]
  27. Nowak, D.J.; Crane, D.E. Carbon storage and sequestration by urban trees in the USA. Environ. Pollut. 2002, 116, 381–389. [Google Scholar] [CrossRef]
  28. Nowak, D.J.; Stevens, J.C.; Sisinni, S.M.; Luley, C.J. Effects of urban tree management and species selection on atmospheric carbon dioxide. J. Arboric. 2002, 28, 113–122. [Google Scholar]
  29. Kuittinen, M.; Moinel, C.; Adalgeirsdottir, K. Carbon sequestration through urban ecosystem services. A case study from Finland. Sci. Total Environ. 2016, 563, 623–632. [Google Scholar] [CrossRef]
  30. Díaz, M.; Concepción, E.D.; Oviedo, J.L.; Caparrós, A.; Farizo, B.Á.; Campos, P. A comprehensive index for threatened biodiversity valuation. Ecol. Ind. 2020, 108, 105696. [Google Scholar] [CrossRef]
  31. Spanish National Forest Inventory (NFI). Spanish Ministry for the Ecological Transition and the Demographic Challenge. Available online: https://www.miteco.gob.es/es/biodiversidad/temas/politica-forestal/ (accessed on 10 December 2020).
  32. Montero, G.; Ruiz-Peinado, R.; Muñoz, M. Producción de Biomasa y Fijación de CO2 por los Bosques Españoles; Ministerio de Educación y Ciencia: Madrid, Spain, 2005. [Google Scholar]
  33. Agudo Romero, R.; Muñoz Martínez, M.; del Pino del Castillo, O. 1er Inventario de Sumideros de CO2 en Andalucía; Consejería de Medio Ambiente, Junta de Andalucía: Sevilla, Spain, 2007. [Google Scholar]
  34. Ex Ante CO2 Absorption Calculator of Spanish Tree Forest Species, Provided by the Spanish Ministry of Agriculture and Fisheries, Food and Environment 2018. Available online: http://cambioclimaticomurcia.carm.es/calculadora/preguntas.htm (accessed on 10 December 2020).
  35. Modernising and Simplifying the CAP; Second Background Document; Climate and Environmental Challenges Facing Agricultural and Rural Areas. European Commission: Brussel, Belgium, 2017. Available online: https://ec.europa.eu/info/sites/info/files/food-farming-fisheries/key_policies/documents/env_background_final_en.pdf (accessed on 15 April 2021).
  36. Ho, R. Handbook of Univariate and Multivariate Data Analysis with IBM SPSS; CRC Press: Boca Raton, FL, USA, 2013. [Google Scholar]
  37. Petersen, B.M.; Knudsen, M.T.; Hermansen, J.E.; Halberg, N. An approach to include soil carbon changes in life cycle assessments. J. Clean. Prod. 2013, 52, 217–224. [Google Scholar] [CrossRef]
  38. Hilbe, J.M. STATISTICA 7: An overview. Am. Stat. 2007, 61, 91–94. [Google Scholar] [CrossRef]
  39. Powlson, D.S.; Whitmore, A.P.; Goulding, K.W. Soil carbon sequestration to mitigate climate change: A critical re-examination to identify the true and the false. Eur. J. Soil Sci. 2011, 62, 42–55. [Google Scholar] [CrossRef]
  40. Dass, P.; Houlton, B.Z.; Wang, Y.; Warlind, D. Grasslands may be more reliable carbon sinks than forests in California. Environ. Res. Lett. 2018, 13, 074027. [Google Scholar] [CrossRef]
  41. Stoffberg, G.H.; van Rooyen, M.W.; van der Linde, M.J.; Groeneveld, H.T. Carbon sequestration estimates of indigenous street trees in the City of Tshwane, South Africa. Urban For. Urban Green. 2010, 9, 9–14. [Google Scholar] [CrossRef]
  42. Thornton, P.K.; Herrero, M. Potential for reduced methane and carbon dioxide emissions from livestock and pasture management in the tropics. Proc. Natl. Acad. Sci. USA 2010, 107, 19667–19672. [Google Scholar] [CrossRef] [PubMed] [Green Version]
  43. Liu, C.; Li, X. Carbon storage and sequestration by urban forests in Shenyang, China. Urban For. Urban Green. 2012, 11, 121–128. [Google Scholar] [CrossRef]
  44. Purre, A.H.; Pajula, R.; Ilomets, M. Carbon dioxide sink function in restored milled peatlands—The significance of weather and vegetation. Geoderma 2019, 346, 30–42. [Google Scholar] [CrossRef]
  45. Shua, S.; Zhua, W.; Wanga, W.; Jiaa, M.; Zhanga, Y.; Sheng, Z. Effects of tree size heterogeneity on carbon sink in old forests. For. Ecol. Manag. 2019, 432, 637–648. [Google Scholar] [CrossRef]
  46. Rakotovao, N.H.; Razafimbelo, T.M.; Rakotosamimanana, S.; Randrianasolo, Z.; Randriamalala, J.R.; Albrecht, A. Carbon footprint of smallholder farms in Central Madagascar: The integration of agroecological practices. J. Clean. Prod. 2017, 140, 1165–1175. [Google Scholar] [CrossRef]
  47. Pulina, G.; Milán, M.J.; Lavín, M.P.; Theodoridis, A.; Morin, E.; Capote, J.; Caja, G. Invited review: Current production trends, farm structures, and economics of the dairy sheep and goat sectors. J. Dairy Sci. 2018, 101, 6715–6729. [Google Scholar] [CrossRef] [PubMed] [Green Version]
  48. Ruiz Morales, F.A.; Castel, J.M.; Mena, Y. Current status, challenges and the way forward for dairy goat production in Europe. Asian-Australas. J. Anim. Sci. 2019, 32, 1256–1265. [Google Scholar]
  49. Mena, Y.; Castel, J.M.; Caravaca, F.P.; Guzmán, J.L.; González-Redondo, P. Situación Actual, Evolución y Diagnóstico de los Sistemas Semiextensivos de Producción Caprina en Andalucía Centro-Occidental; Consejería de Agricultura y Pesca, Junta de Andalucía: Sevilla, Spain, 2005. [Google Scholar]
  50. Castel, J.M.; Ruiz, F.A.; Mena, Y.; Sánchez-Rodríguez, M. Present situation and future perspectives for goat production systems in Spain. Small Rumin. Res. 2010, 89, 207–210. [Google Scholar] [CrossRef]
  51. ARCA. Sistema Nacional de Información de Razas. Available online: https://www.mapa.gob.es/es/ganaderia/temas/zootecnia/razasganaderas/razas/catalogo/default.aspx (accessed on 15 April 2021).
  52. D’Ottavio, P.; Francioni, M.; Trozzo, L.; Sedić, E.; Budimir, K.; Avanzolini, P.; Trombetta, M.F.; Porqueddu, C.; Santilocchi, R.; Toderi, M. Trends and approaches in the analysis of ecosystem services provided by grazing systems: A review. Grass Forage Sci. 2018, 73, 15–25. [Google Scholar] [CrossRef]
  53. Mena, Y.; Ruiz-Mirazo, J.; Ruiz Morales, F.A.; Castel, J.M. Characterization and typification of small ruminant farms providing fuelbreak grazing services for wildfire prevention in Andalusia (Spain). Sci. Total Environ. 2016, 544, 211–219. [Google Scholar] [CrossRef]
  54. Ingty, T. Pastoralism in the highest peaks: Role of the traditional grazing systems in maintaining biodiversity and ecosystem function in the alpine Himalaya. PLoS ONE 2021, 16, e0245221. [Google Scholar] [CrossRef] [PubMed]
  55. Beaufoy, G.; Ruiz-Mirazo, J. Ingredients for a new Common Agricultural Policy in support or sustainable livestock systems linked to the landscape. Pastos 2013, 43, 25–34. [Google Scholar]
  56. Eco-Esquemas. Documento PE GTAN FEAGA 03.2020. Ministerio de Agricultura, Pesca y Alimentación, Secretaría General de Agricultura y Alimentación. Grupo de Trabajo de Alto Nivel de Intervenciones del Primer Pilar (PEPAC 23–27). Available online: https://www.mapa.gob.es/es/pac/post-2020/documentogeneraldeecoesquemas_tcm30-556248.pdf (accessed on 1 April 2021).
  57. Eco-Esquema 1: Mejora de la Sostenibilidad de los Pastos, Aumento de la Capacidad de Sumidero de Carbono y Prevención de Incendios Mediante el Impulso del Pastoreo Extensivo. Ministerio de Agricultura, Pesca y Alimentación. Secretaría General de Agricultura y Alimentación, PE GTAN FEAGA. Available online: https://www.mapa.gob.es/es/pac/post-2020/ecoesquema1mejorasostenibilidaddelospastoscapacidaddesumiderodecarbonoyprevenciondeincendios_tcm30-552834.pdf (accessed on 1 April 2021).
Figure 1. Process diagram illustrating the databases used as information sources and information fields comprising them for the development of the two C sink worksheets (SIGPAC-based or SIOSE-based C sink databases) to be included in the developed C-sink calculator tool. C sink databases were developed based on associated annual sink factors for individual plant species and detailed maps of plant communities describing each land cover.
Sustainability 13 06085 g001
Figure 2. Location of experimental farms selected for the in situ detailed assessment as natural C sinks of the vegetated areas used for grazing. Natural Protected Areas in the territory are shown as grey shadows and those ones associated with farms are identified as a green shadow.
Sustainability 13 06085 g002
Figure 3. Values of total C sink calculated in the 8 experimental farms through the detailed in situ assessment (CONTROL) and the application of the SIGPAC-based (SIGPAC) and the SIOSE-based (SIOSE) C sink databases as well as the Petersen methodology (Petersen). Due to the differences shown in the scale of obtained values, SIGPAC values are expressed into a secondary y-axis, on the right side.
Sustainability 13 06085 g003
Table 1. Total vegetated surfaces used for grazing and types of plant cover found in the 8 experimental farms, and total C sink calculated during the detailed in situ assessment.
Farm IDPlant CoverSurface (ha)C Sink (t CO2 ha−1 year−1)
F1Quercine forest4.780.33
Sparse quercines and shrubs4.190.09
Shrublands with Cistus sp. and Ulex sp.7.460.27
Shrublands of Cistus ladanifer40.340.30
Natural grassland5.560.06
TOTAL62.340.59 *
F2Mixed forest657.420.68
Mediterranean shrubland64.490.46
Natural grassland159.830.06
TOTAL881.740.55 *
F3Quercine forest303.170.29
Shrublands with trees4.300.38
Sparse shrubs81.270.30
Natural grassland and sparse trees27.55<0.01
Natural grassland18.880.03
TOTAL435.170.26 *
F4Quercine forest89.990.20
Thick shrubland and quercines45.310.40
Thick shrubland406.400.31
Sparse shrubs10.050.19
Natural grassland and quercines43.870.16
TOTAL595.620.29 *
F5Wild olive forest1.900.50
Wild olive pastures1.870.45
Shrublands and wild olive5.310.40
Thick shrubland and quercines33.510.53
Sparse shrubs with quercines and wild olive5.780.41
Natural grassland and sparse shrubs13.410.18
TOTAL61.780.73 *
F6Woody crops15.681.09
Quercine pastures1.330.27
Shrublands with Retama sp.5.600.29
TOTAL22.610.97 *
F7Quercine forest55.130.50
Quercine forest with sparse srhubs2.260.45
Arable lands with sparse quercines1.330.03
TOTAL58.720.31 *
F8Pine forest213.430.34
Quercine forest332.190.33
Q. pyrenaica forest224.960.56
Q. pyrenaica pastures41.460.30
Shrublands and pine21.740.36
Shrublands of Ulex sp. and Cytisus sp.51.440.21
Shrublands of Ulex sp. and Castanea sp.29.750.26
Shrublands of Ulex sp. and quercines161.390.68
Shrublands of Ulex sp. and grasslands90.640.12
Thick shrubland and quercines18.620.32
Sparse shrubs and quercines20.690.38
Natural grassland and sparse pines21.490.09
TOTAL1227.800.39 *
* Averages weighted to partial surfaces.
Table 2. Comparison of the C sink values (t CO2 ha−1 year−1) obtained in the 8 experimental farms from the different methodology (Control = in situ detailed assessment; SIGPAC= application of the SIGPAC- based C sink database; SIOSE = application of the SIOSE-based C sink database; Petersen = application of the Petersen methodology). Different letters indicate significant differences (p ≤ 0.05).
F1F2F3F4F5F6F7F8Mean ± S.E.
Control0.250.550.260.290.431.370.310.390.48 ± 0.13 a
SIGPAC2.433.115.271.375.0355.295.483.2310.15 ± 6.47 c
SIOSE0.670.510.400.600.611.380.450.460.63 ± 0.11 b
Petersen0.140.150.150.150.150.260.160.150.16 ± 0.01 d
Publisher’s Note: MDPI stays neutral with regard to jurisdictional claims in published maps and institutional affiliations.

