
Design of a Unified Algorithm to Ensure the Sustainable Use of Air Transport during a Pandemic


Abstract
:1. Introduction
2. Materials and Methods
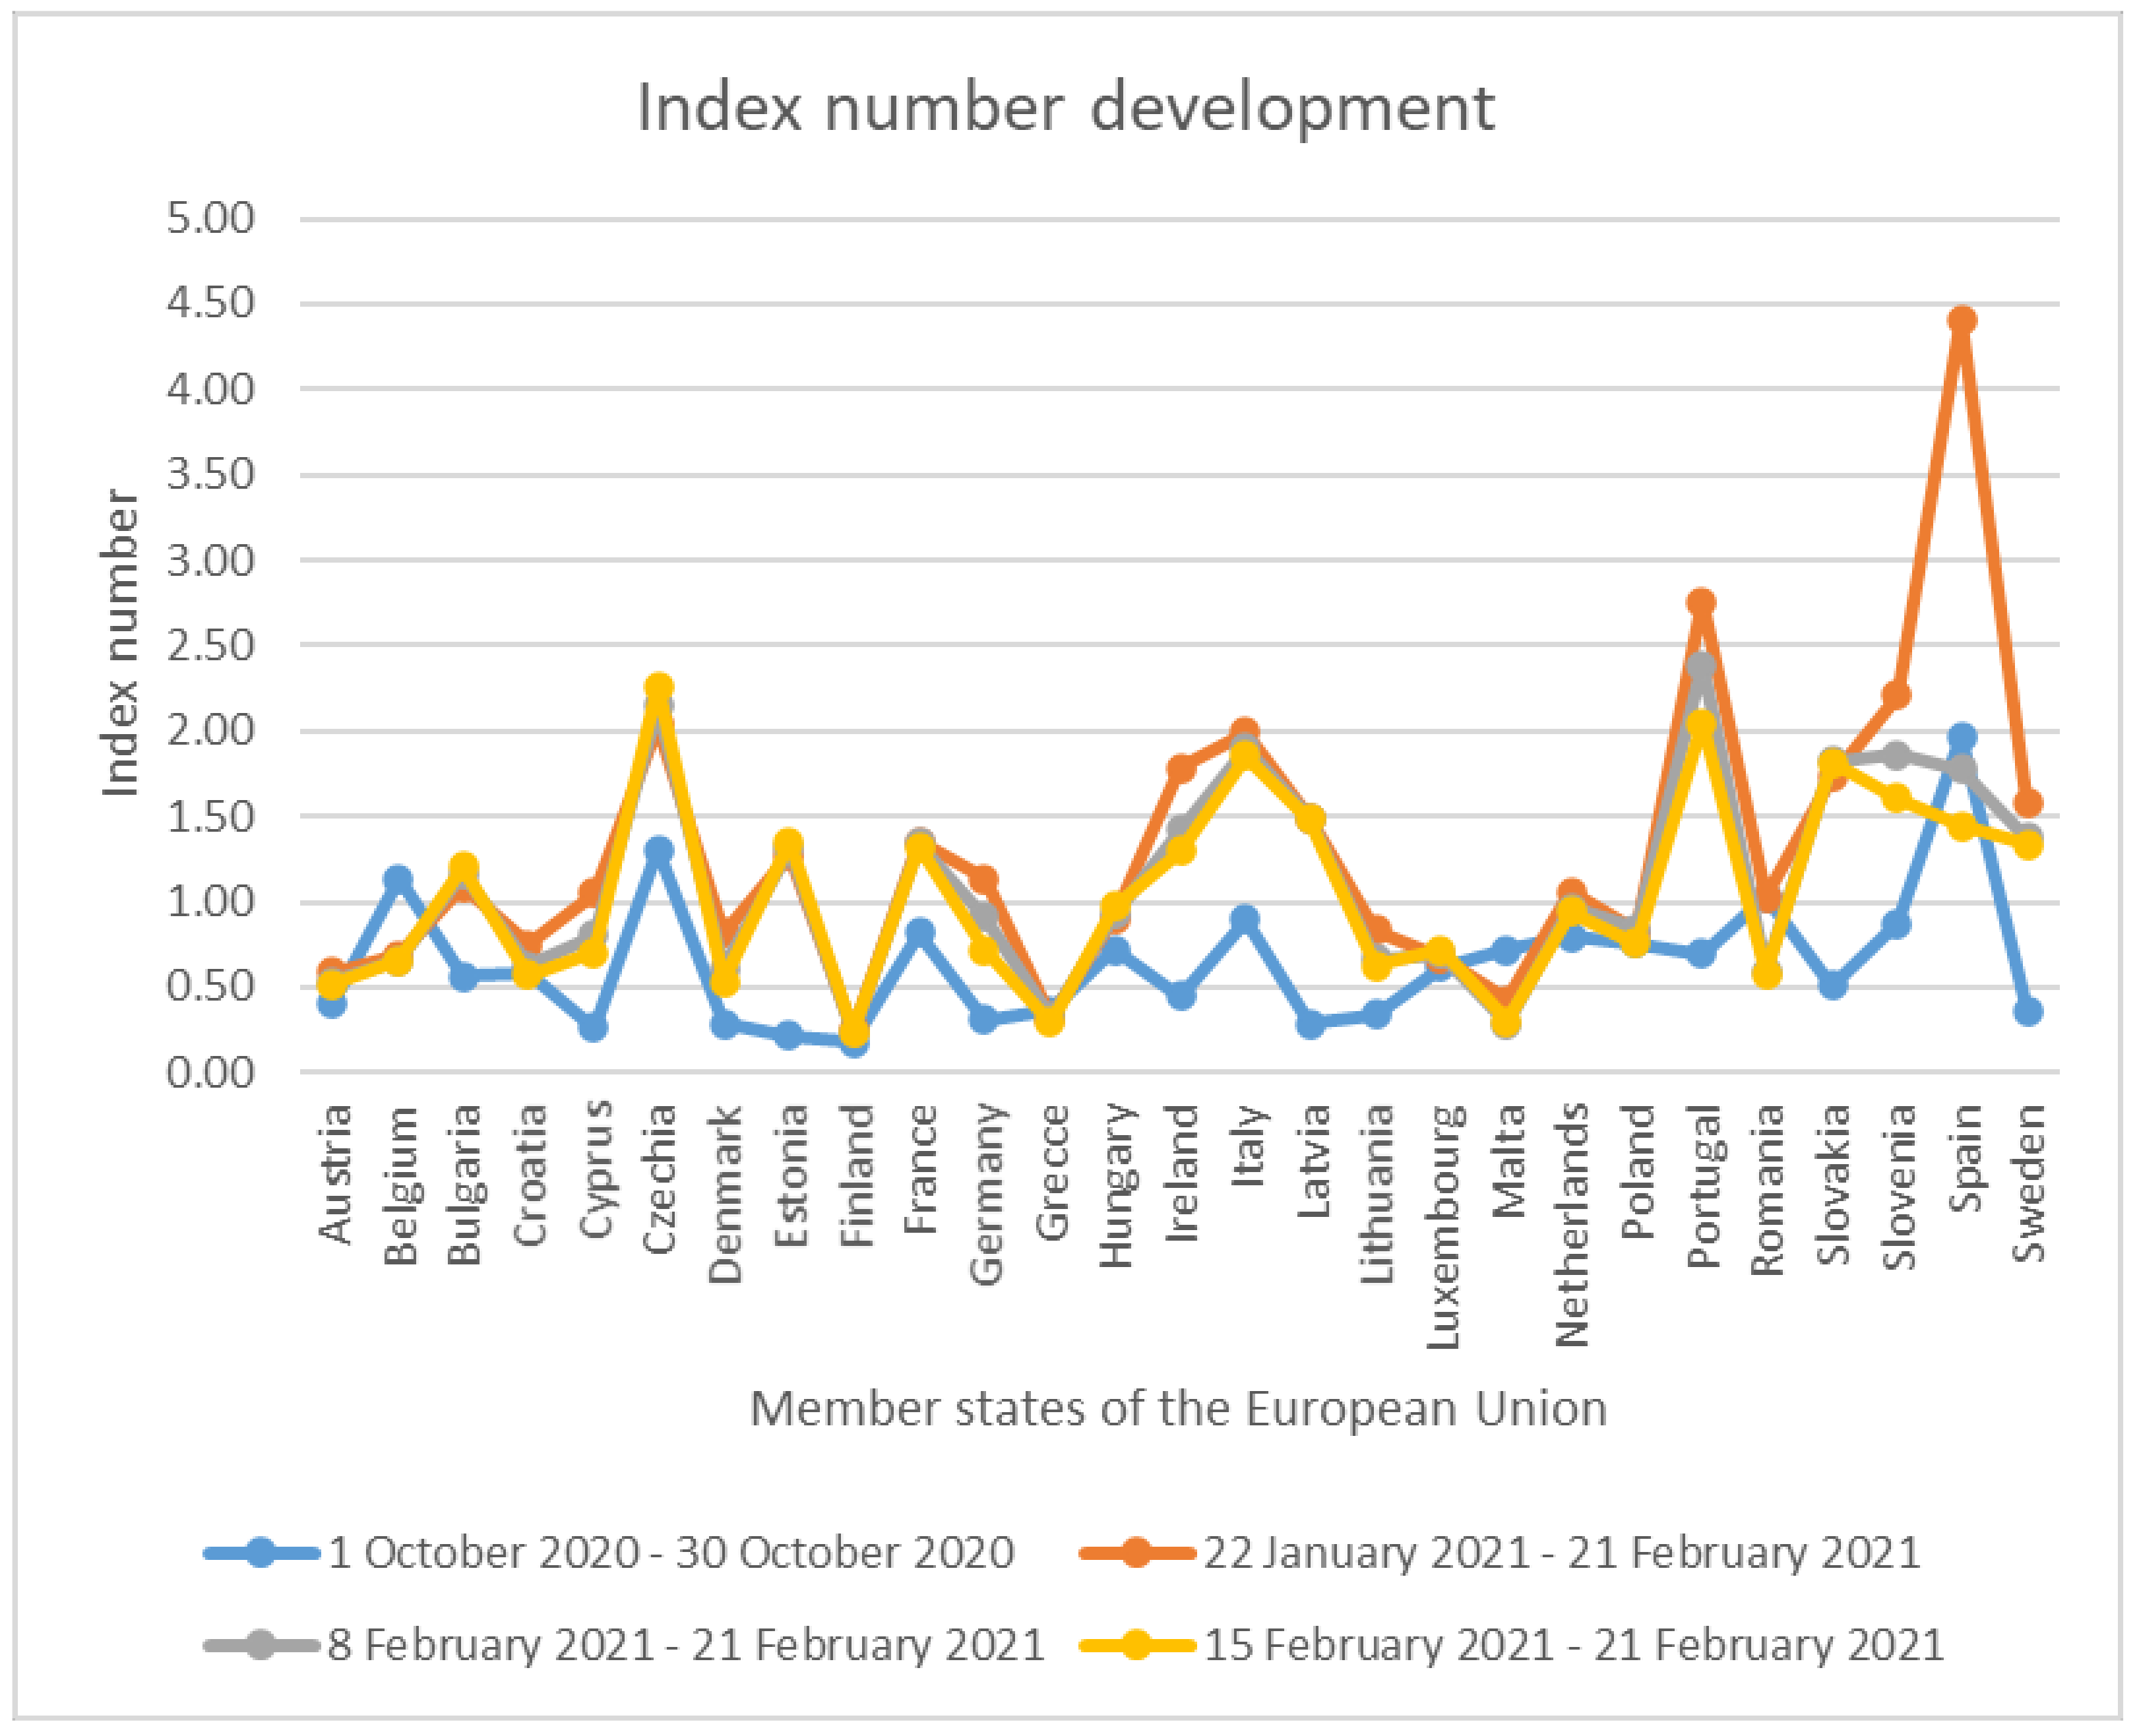
2.1. Monitoring the Spread of the Pandemic in the Member States of the European Union
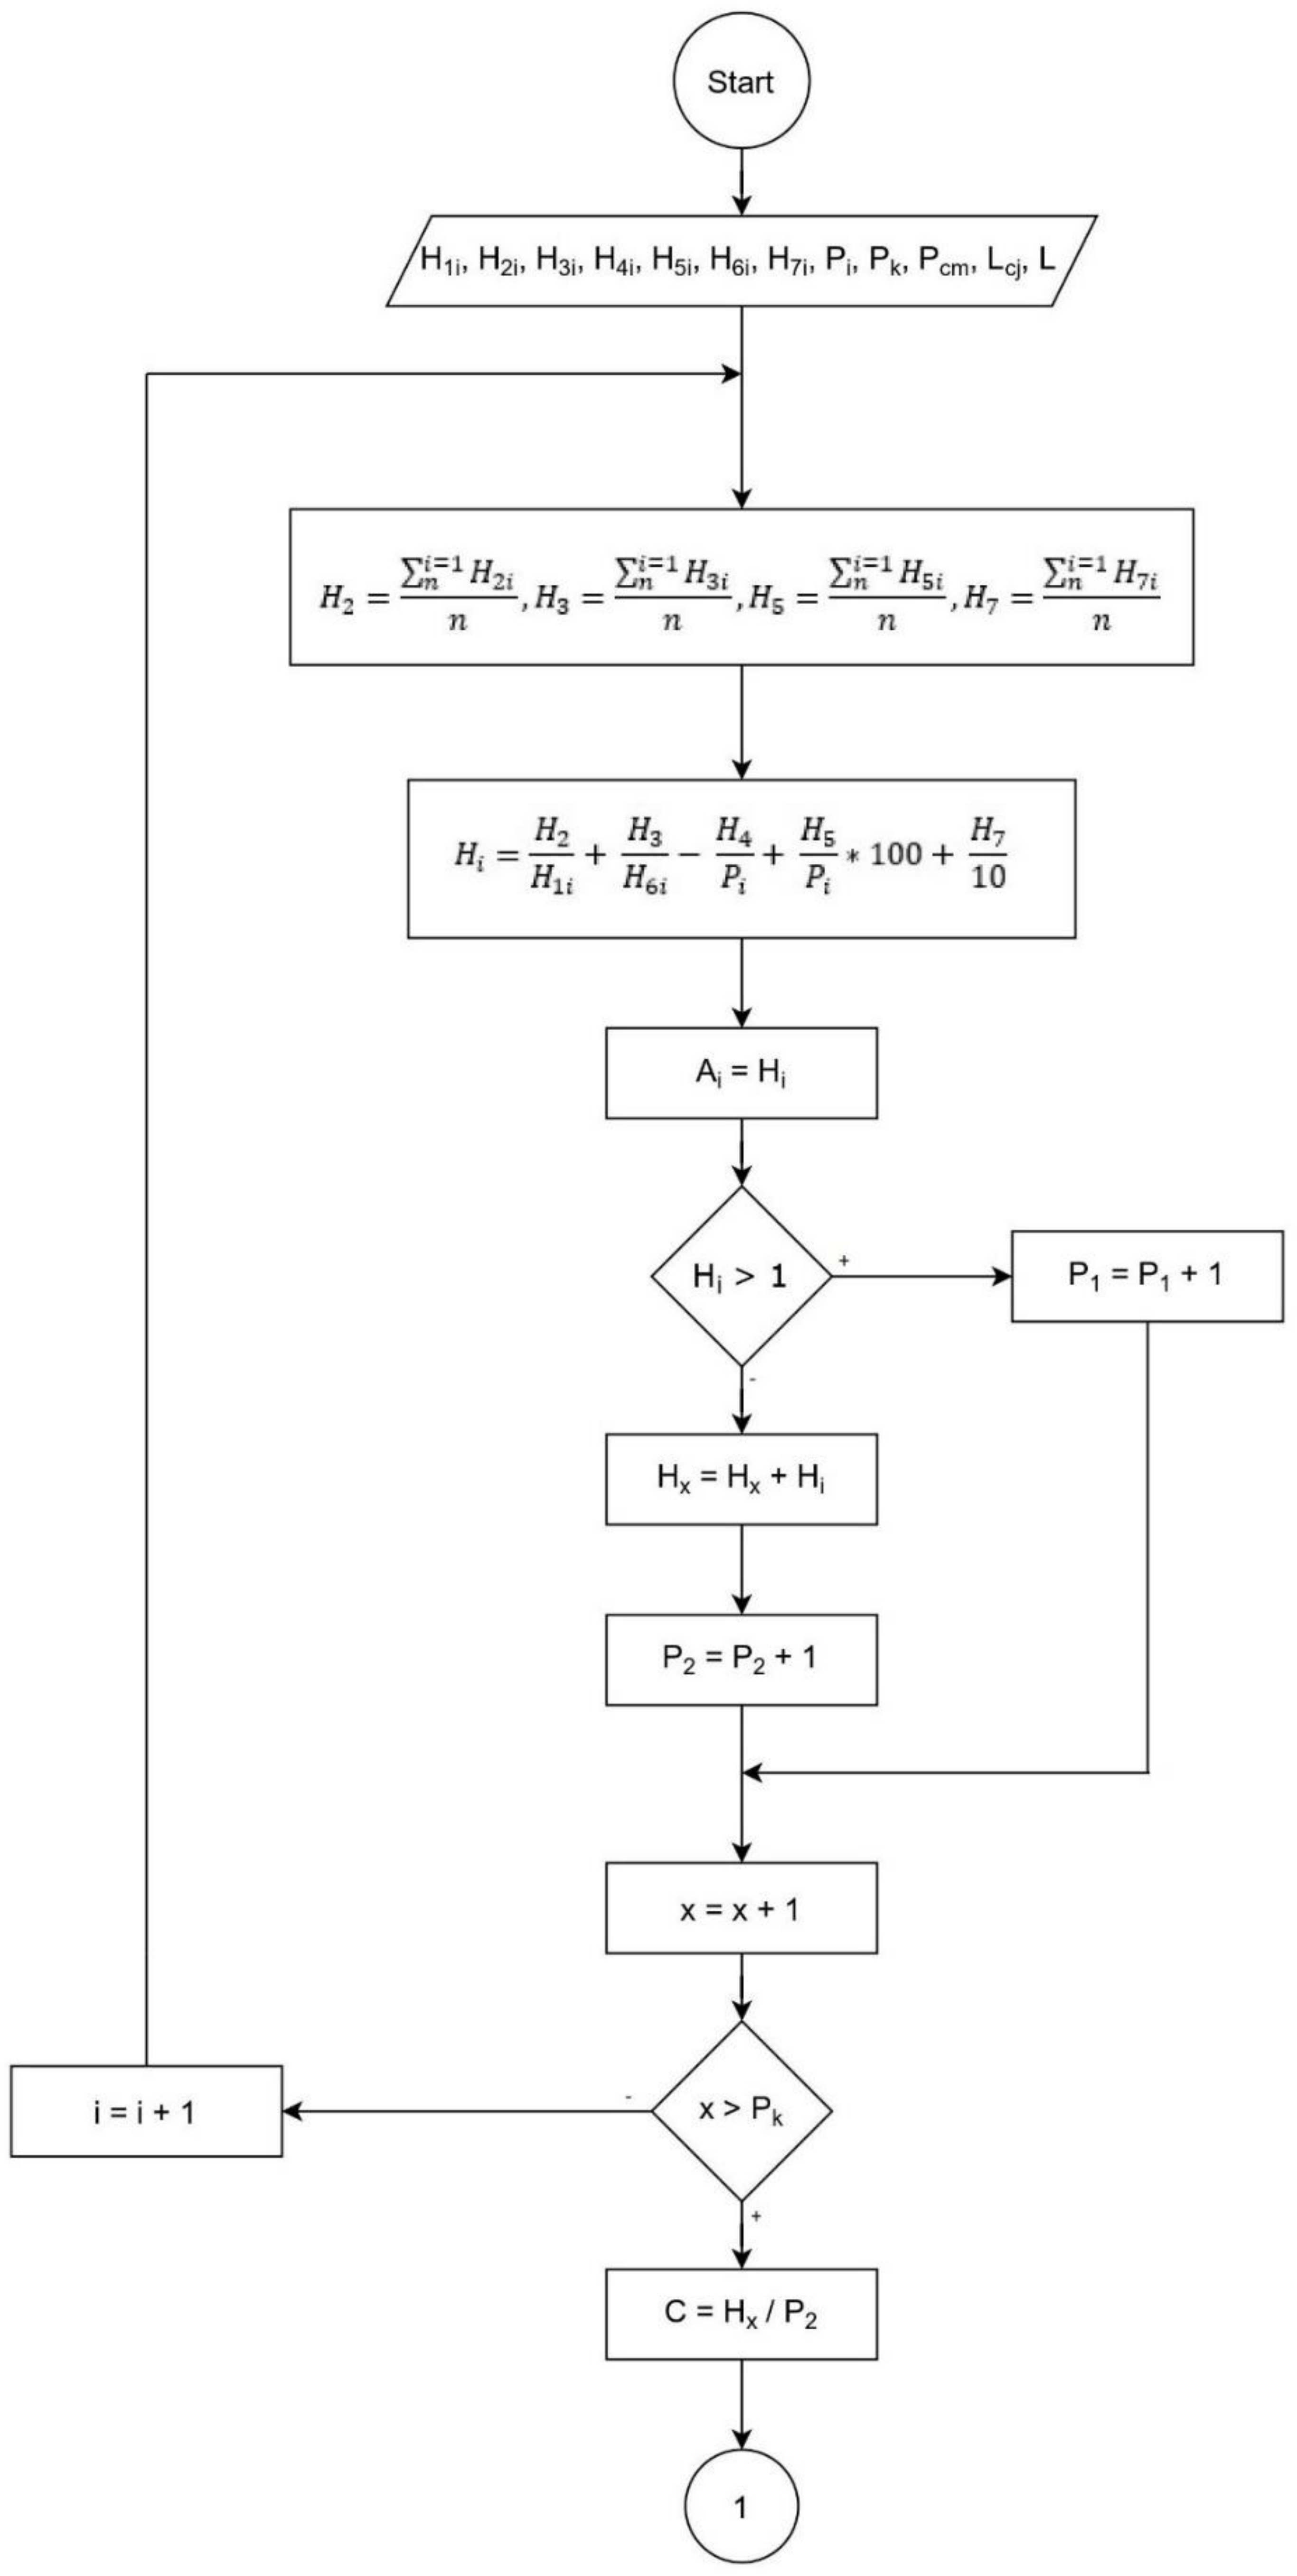
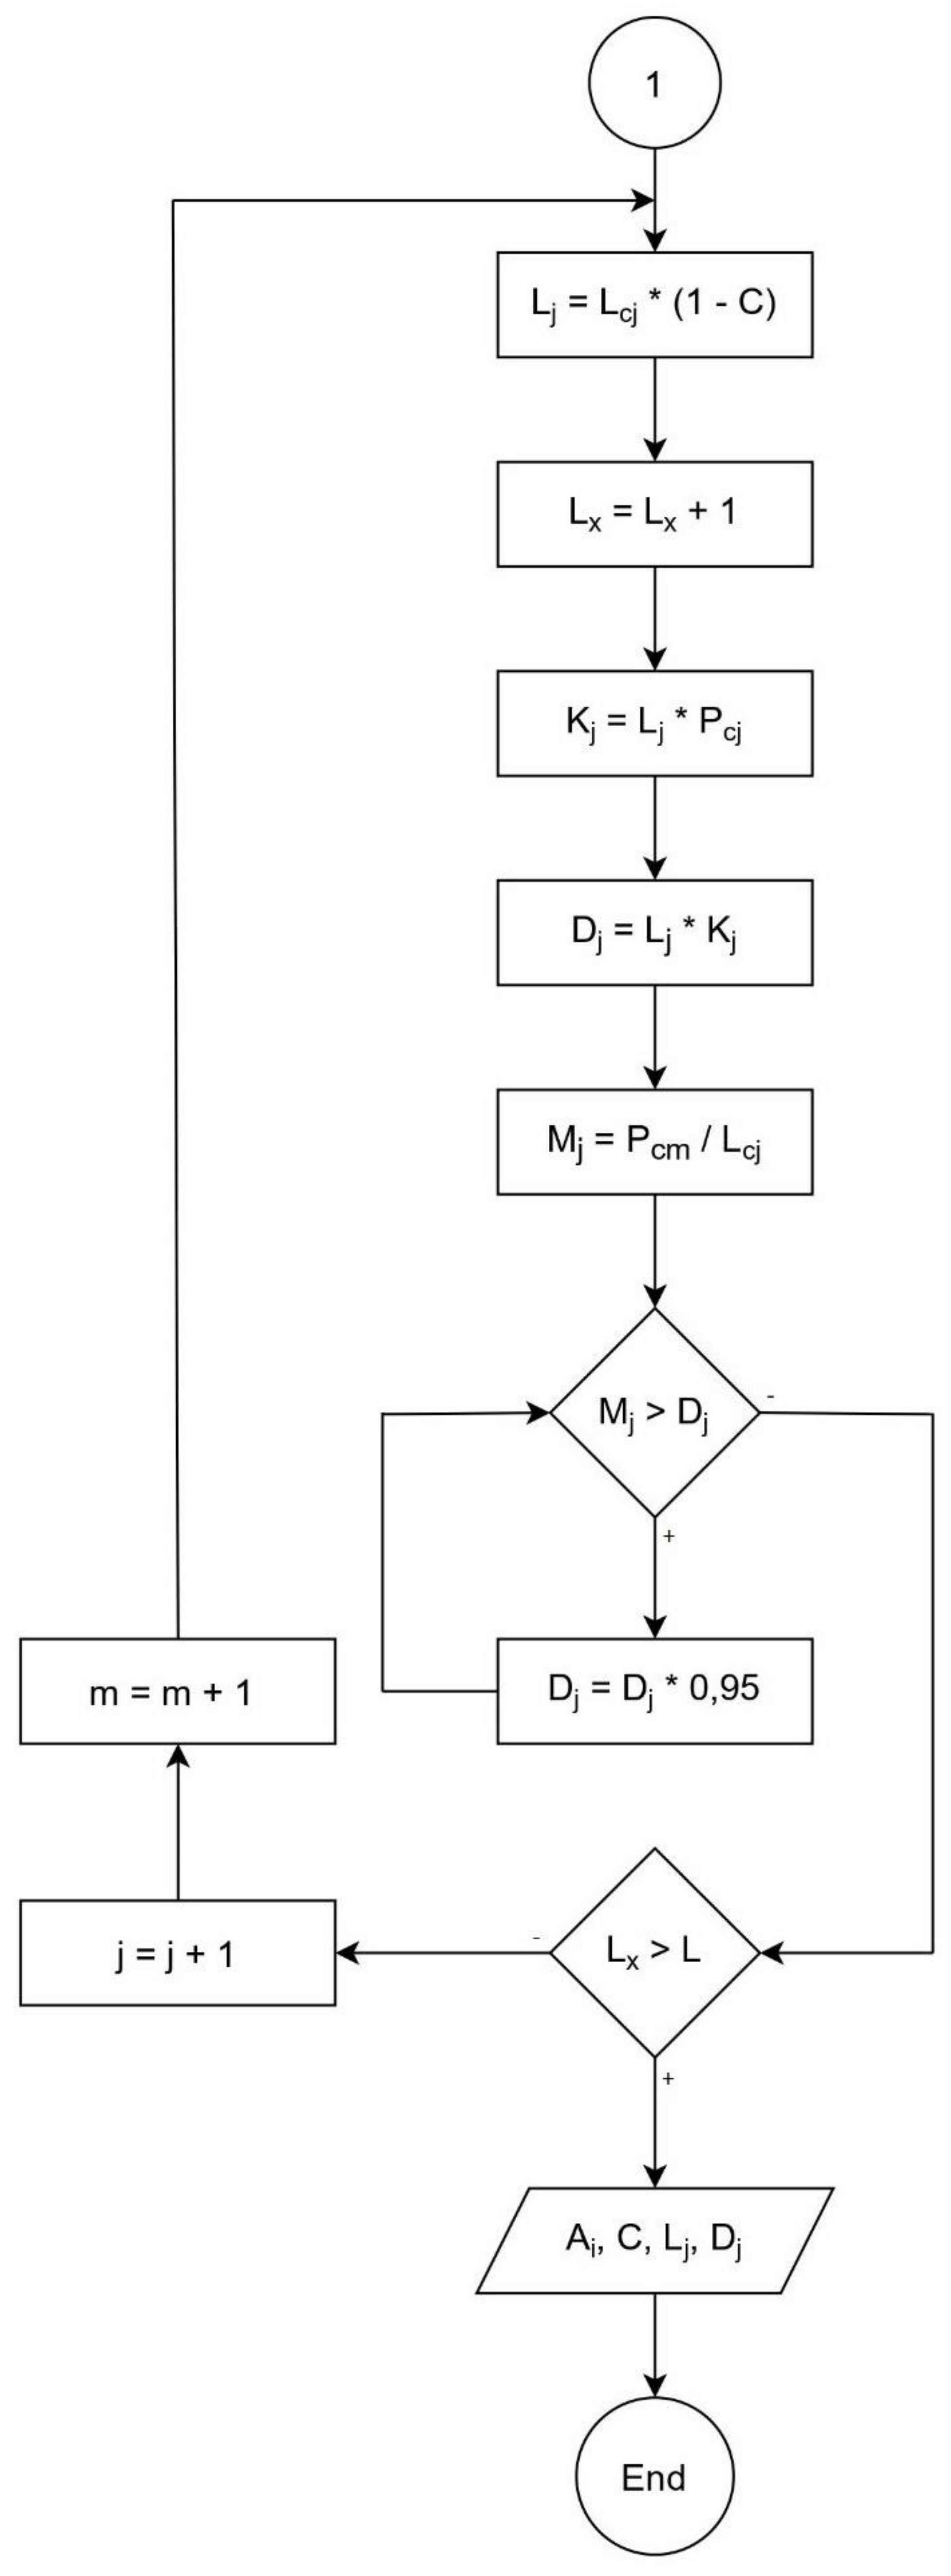
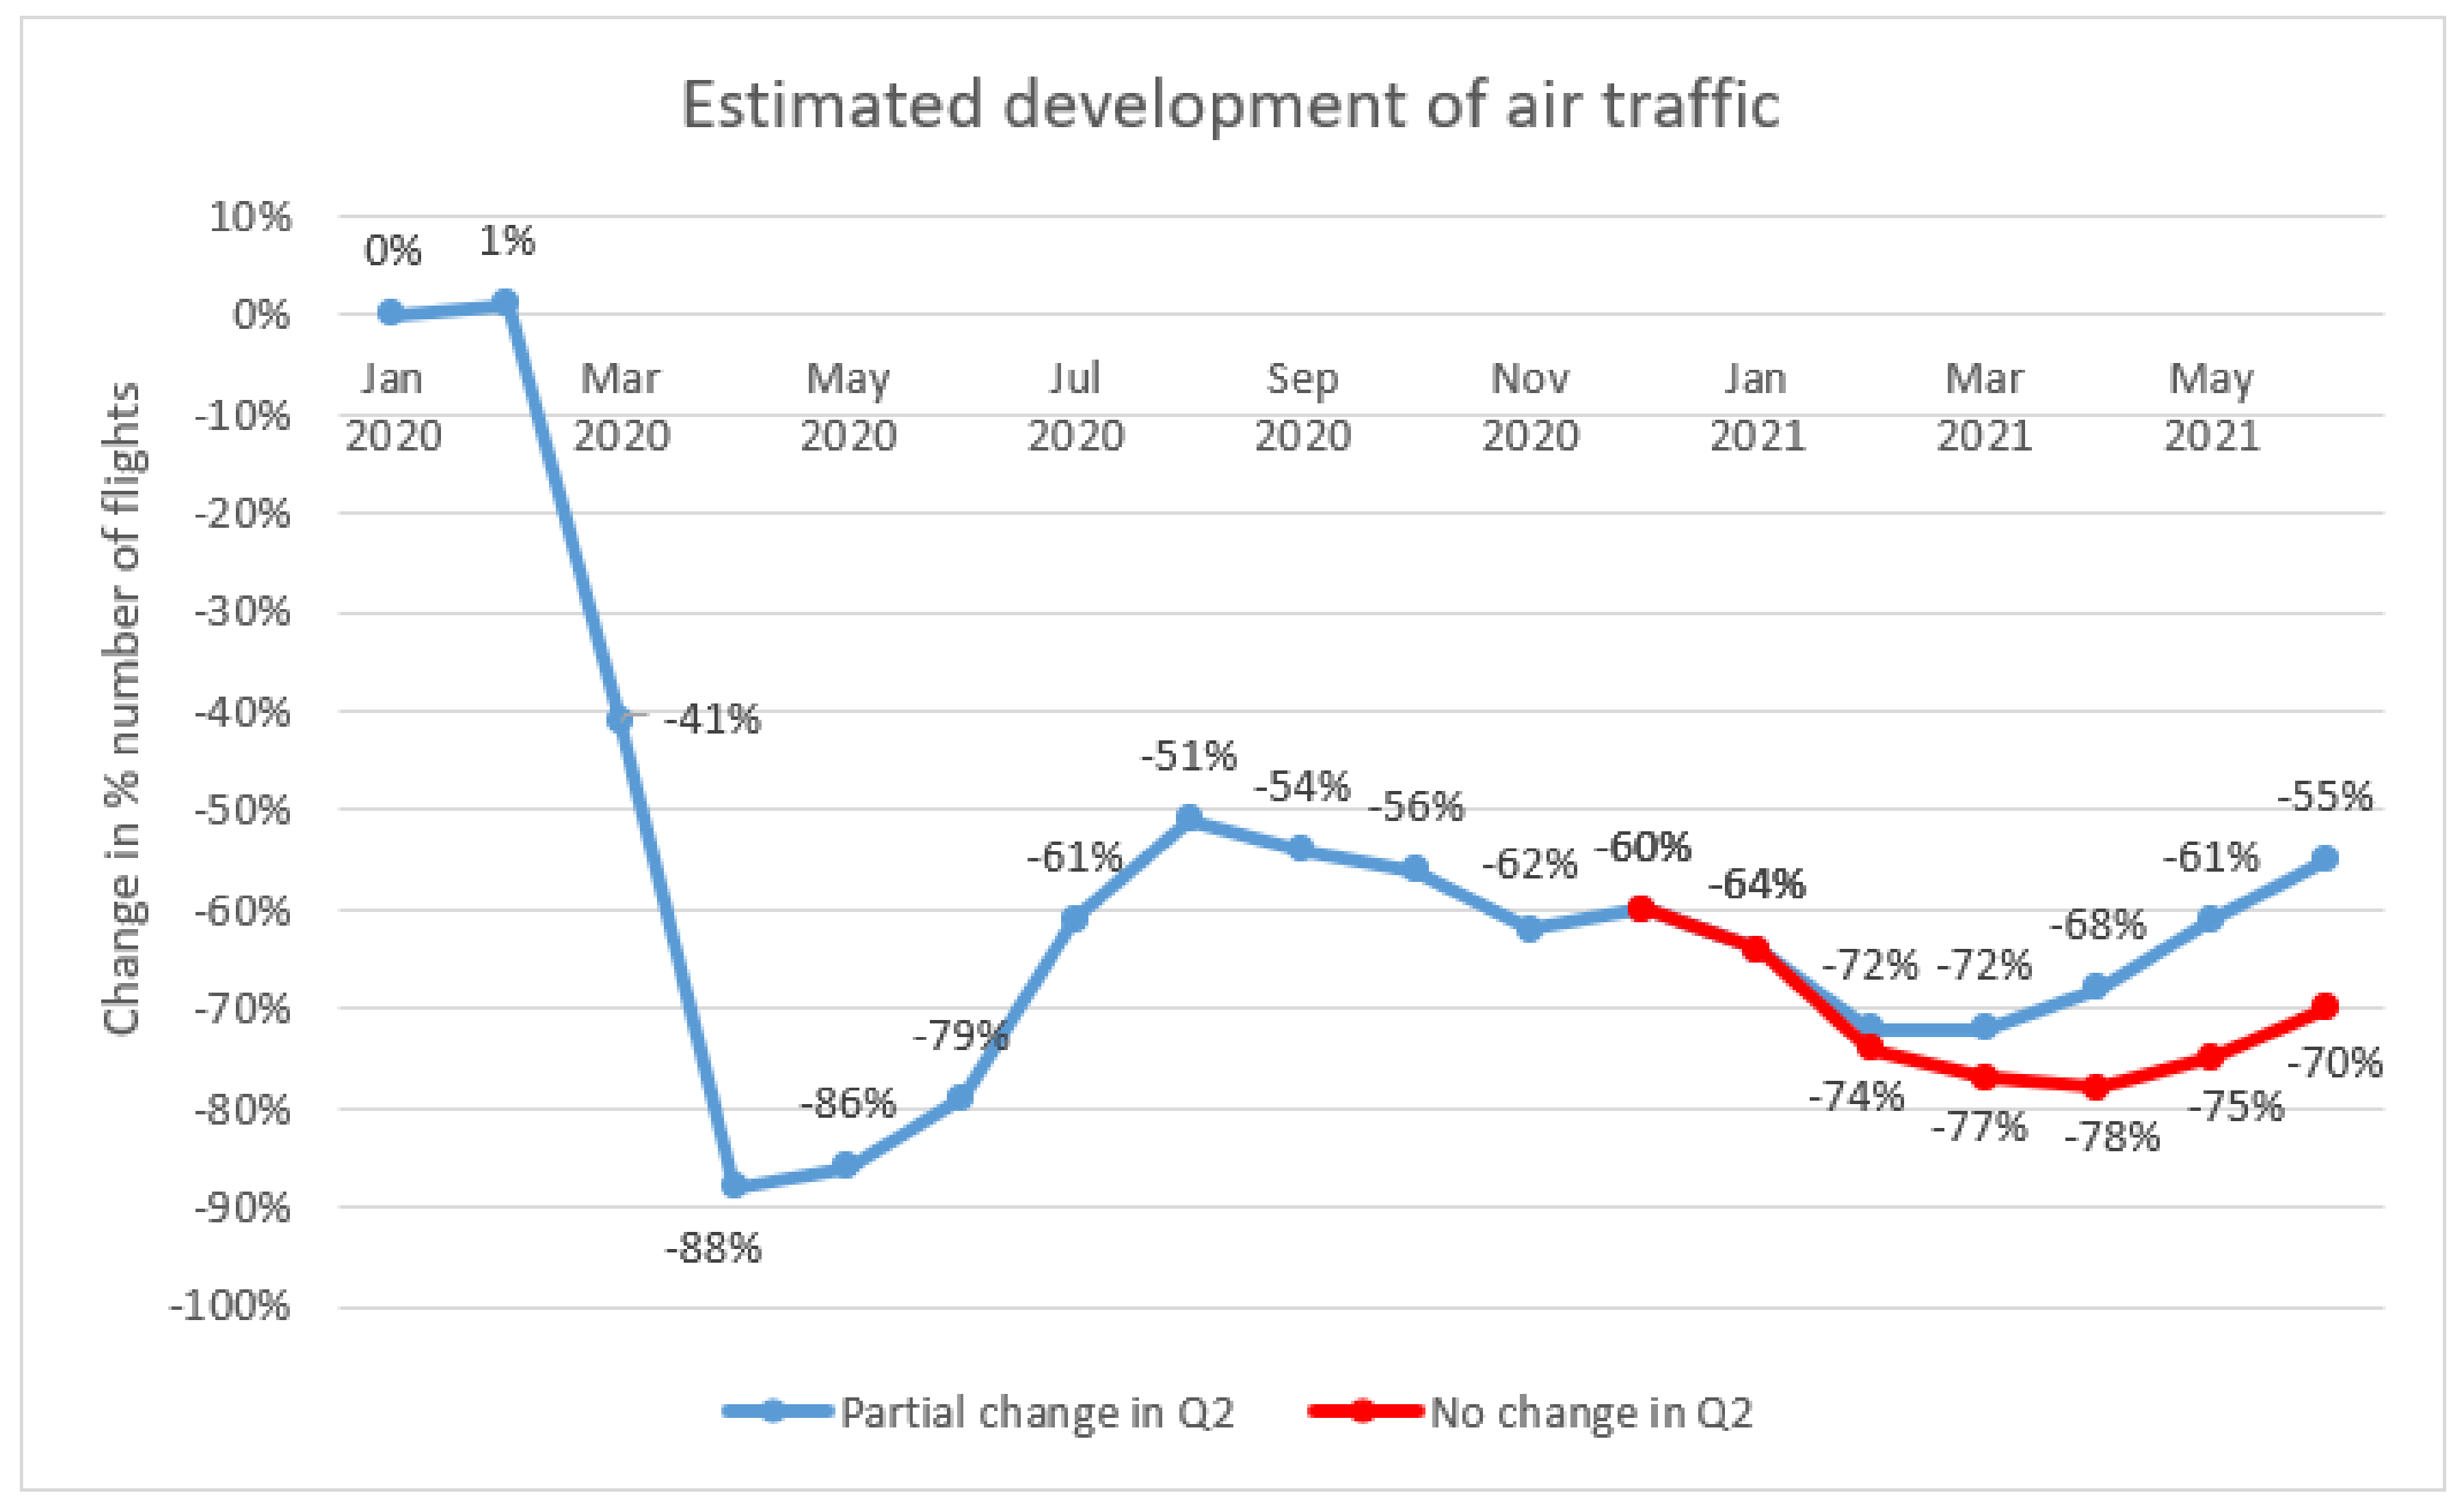
2.2. The Effect of the Pandemic on Air Transport in the European Union
3. Results
4. Discussion
Author Contributions
Funding
Institutional Review Board Statement
Informed Consent Statement
Data Availability Statement
Acknowledgments
Conflicts of Interest
Abbreviations
| i.e., | id est |
| Reprod. | Reproduction |
| Hospit. | Hospitalized |
| ICU | Intensive care unit |
| TR | Total revenue |
| PAX | Passengers |
| LF | Load factor |
| IATA | International Air Transport Association |
References
- Holshue, M.L.; DeBolt, C.; Lindquist, S.; Lofy, K.H.; Wiesman, J.; Bruce, H.; Spitters, C.; Ericson, K.; Wilkerson, S.; Tural, A.; et al. First Case of 2019 Novel Coronavirus in the United States. N. Engl. J. Med. 2020, 382, 929–936. [Google Scholar] [CrossRef]
- Wölfel, R.; Corman, V.M.; Guggemos, W.; Seilmaier, M.; Zange, S.; Müller, M.A.; Niemeyer, D.; Jones, T.C.; Vollmar, P.; Rothe, C.; et al. Virological assessment of hospitalized patients with COVID-2019. Nature 2020, 581, 465–469. [Google Scholar]
- Lai, C.; Shih, T.-P.; Ko, W.-C.; Tang, H.-J.; Hsueh, P.-R. Severe acute respiratory syndrome coronavirus 2 (SARS-CoV-2) and coronavirus disease-2019 (COVID-19): The epidemic and the challenges. Int. J. Antimicrob. Agents 2020, 55, 105924. [Google Scholar]
- Mohanty, K.; Satapathy, A.; Naidu, M.M.; Mukhopadhyay, S.; Sharma, S.; Barton, L.M.; Stroberg, E.; Duval, E.J.; Pradhan, D.; Tzankov, A.; et al. Severe acute respiratory syndrome coronavirus-2 (SARS-CoV-2) and coronavirus disease 19 (COVID-19)–anatomic pathology perspective on current knowledge. Diagn. Pathol. 2020, 15, 1–17. [Google Scholar]
- Guan, W.J.; Ni, Z.Y.; Hu, Y.; Liang, W.H.; Ou, C.Q.; He, J.X.; Liu, L.; Shan, H.; Lei, C.L.; Hui, D.S.C.; et al. Clinical characteristics of coronavirus disease 2019 in China. N. Engl. J. Med. 2020, 382, 1708–1720. [Google Scholar]
- Ibn-Mohammed, T.; Mustapha, K.B.; Godsell, J.; Adamu, Z.; Babatunde, K.A.; Akintade, D.D.; Acquaye, A.; Fujii, H.; Ndiaye, M.M.; Yamoah, F.A.; et al. A critical review of the impacts of COVID-19 on the global economy and ecosystems and opportunities for circular economy strategies. Resour. Conserv. Recycl. 2020, 164, 105169. [Google Scholar]
- Goniewicz, K.; Khorram-Manesh, A.; Hertelendy, A.J.; Goniewicz, M.; Naylor, K.; Burkle, F.M., Jr. Current response and management decisions of the European Union to the COVID-19 outbreak: A review. Sustainability 2020, 12, 3838. [Google Scholar]
- Debata, B.; Patnaik, P.; Mishra, A. COVID-19 pandemic! It’s impact on people, economy, and environment. J. Public Aff. 2020, 20, e2372. [Google Scholar]
- Eurocontrol. COVID-19 Impact on the European Air Traffic Network. 2020. Available online: https://www.eurocontrol.int/covid19 (accessed on 3 February 2021).
- Linka, K.; Goriely, A.; Kuhl, E. Global and local mobility as a barometer for COVID-19 dynamics. Biomech. Modeling Mechanobiol. 2021, 20, 651–669. [Google Scholar]
- Tian, H.; Liu, Y.; Li, Y.; Wu, C.-H.; Chen, B.; Kraemer, M.U.G.; Li, B.; Cai, J.; Xu, B.; Yang, Q.; et al. An investigation of transmission control measures during the first 50 days of the COVID-19 epidemic in China. Science 2020, 368, 638–642. [Google Scholar]
- Du, Z.; Wang, L.; Cauchemez, S.; Xu, X.; Wang, X.; Cowling, B.J.; Meyers, L.A. Risk for transportation of coronavirus disease from Wuhan to other cities in China. Emerg. Infect. Dis. 2020, 26, 1049. [Google Scholar]
- Adenukle, A.; Meehan, M.; Rojas-Alvarez, D.; Trauer, J.; McBryde, E. Delaying the COVID-19 epidemic in Australia: Evaluating the effectiveness of international travel bans. Aust. N. Z. J. Public Health 2020, 44, 257–259. [Google Scholar]
- Anzai, A.; Meehan, M.; Rojas-Alvarez, D.; Trauer, J.; McBryde, E. Assessing the impact of reduced travel on exportation dynamics of novel coronavirus infection (COVID-19). J. Clin. Med. 2020, 9, 601. [Google Scholar]
- Kraemer, M.U.G.; Yang, C.-H.; Gutierrez, B.; Wu, C.-H.; Klein, B.; Pigott, D.M.; Du Plessis, L.; Faria, N.R.; Li, R.; Hanage, W.P.; et al. The effect of human mobility and control measures on the COVID-19 epidemic in China. Science 2020, 368, 493–497. [Google Scholar]
- Gössling, S.; Scorr, D.; Hall, C.M. Pandemics, tourism and global change: A rapid assessment of COVID-19. J. Sustain. Tour. 2020, 29, 1–20. [Google Scholar]
- Suau-Sanchez, P.; Voltes-Dorta, A.; Cugueró-Escofet, N. An early assessment of the impact of COVID-19 on air transport: Just another crisis or the end of aviation as we know it? J. Transp. Geogr. 2020, 86, 102749. [Google Scholar]
- SAS Group. SAS Annual and Sustainability Report Fiscal Year 2020. 2020. Available online: https://www.sasgroup.net/files/documents/Corporate_governace/annual-reports/SAS_AST19-20_ENG2.pdf (accessed on 12 April 2021).
- International Air Transport Association (IATA). Preventing Spread of Coronavirus Disease 2019 (COVID-19) Guideline for Airlines. Available online: https://www.iata.org/contentassets/7e8b4f8a2ff24bd5a6edcf380c641201/airlines-preventing-spread-of-coronavirus-disease-2019.pdf (accessed on 12 April 2021).
- Nakamura, H.; Managi, S. Airport risk of importation and exportation of the COVID-19 pandemic. Transp. Policy 2020, 96, 40–47. [Google Scholar]
- Iacus, S.; Natale, F.; Santamaria, C.; Spyratos, S.; Vespe, M. Estimating and projecting air passenger traffic during the COVID-19 coronavirus outbreak and its socio-economic impact. Saf. Sci. 2020, 129, 104791. [Google Scholar]
- Roy, S. Economic Impact of COVID-19 Pandemic. Technical Report. 2020. Available online: https://www.researchgate.net/publication/343222400_ECONOMIC_IMPACT_OF_COVID-19_PANDEMIC (accessed on 12 April 2021).
- Nižetić, S. Impact of coronavirus (COVID-19) pandemic on air transport mobility, energy, and environment: A case study. Int. J. Energy Res. 2020, 44, 10953–10961. [Google Scholar]
- Salman, D.; Seiam, D.; Fayaz, E. How Can the Aviation Sector Survive after COVID-19? Virtual Econ. 2020, 3, 91–105. [Google Scholar]
- Sigala, M. Tourism and COVID-19: Impacts and implications for advancing and resetting industry and research. J. Bus. Res. 2020, 117, 312–321. [Google Scholar]
- Więckowski, M. Will the Consequences of COVID-19 Trigger a Redefining of the Role of Transport in the Development of Sustainable Tourism? Sustainability 2021, 13, 1887. [Google Scholar]
- Our World in Data. Statistics and Research: Coronavirus (COVID-19) Cases. 2021. Available online: https://ourworldindata.org/covid-cases (accessed on 1 March 2021).
- Our World in Data. Statistics and Research: Coronavirus (COVID-19) Hospitalizations. 2021. Available online: https://ourworldindata.org/covid-hospitalizations (accessed on 1 March 2021).
- Our World in Data. Statistics and Research: Coronavirus Pandemic. 2021. Available online: https://ourworldindata.org/coronavirus (accessed on 5 March 2021).
- Institute for Health Metrics and Evaluation (IHME). COVID-19 Projections. 2021. Available online: https://covid19.healthdata.org/global (accessed on 10 March 2021).
- Rothman, K.J.; Lash, T.; Greenland, S. Modern Epidemiology, 3rd ed.; Lippincott Williams & Wilkins: Philadelphia, PA, USA, 2013; ISBN 9781451190052. [Google Scholar]
- Ryanair. Ryanair Reports Q3 Loss of €306M AS TRAFFIC FALLS 78%. 2020. Available online: https://investor.ryanair.com/wp-content/uploads/2021/02/Ryanair-Q3-FY21-Results.pdf (accessed on 14 March 2021).
- Lufthansa Group. Annual Report 2020: Transforming the Way We Connect People, Cultures and Economies. 2020. Available online: https://investor-relations.lufthansagroup.com/fileadmin/downloads/en/financial-reports/annual-reports/LH-AR-2020-e.pdf (accessed on 14 March 2021).
- AirFranceKML Group. Universal Registration Document 2020: Including the Annual Financial Report. 2020. Available online: https://www.airfranceklm.com/en/system/files/afk_urd_2020_amf.pdf (accessed on 14 March 2021).
- International Airlines Group. Annual Report and Accounts 2020. 2020. Available online: https://www.iairgroup.com/~/media/Files/I/IAG/annual-reports/iag-annual-reports/en/iag-annual-report-and-accounts-2020.pdf (accessed on 14 March 2021).
- WizzAir Holdings Plc. Annual Report and Accounts 2020. 2020. Available online: https://wizzair.com/static/docs/default-source/downloadable-documents/corporate-website-transfer-documents/annual-reports/wizz-air-holdings-plc-annual-report-and-accounts-2020_v3_fd38d396.pdf (accessed on 14 March 2021).
- Tap AirPorugal. Annual Reports. 2020. Available online: https://www.tapairportugal.com/en/about-us/annual-reports (accessed on 14 March 2021).
- Aegean Airlines. Annual Report. 2019. Available online: https://en.about.aegeanair.com/-/media/aboutaegean/ir/ir_announcements/2019/eng_aegean_annual_report_2019_040920.pdf?forceDownload=0 (accessed on 14 March 2021).
- Finnair. Annual Report. 2020. Available online: https://investors.finnair.com/~/media/Files/F/Finnair-IR/documents/en/reports-and-presentation/2021/annual-report-2020.pdf (accessed on 14 March 2021).
- TUI Group. Annual Report of TUI Group. 2020. Available online: https://www.tuigroup.com/damfiles/default/tuigroup-15/en/investors/6_Reports-and-presentations/Reports/2020/TUI_GB20_Gesamt_Englisch_geschuetzt.pdf-291242015c777df3b4485ed846e40048.pdf (accessed on 14 March 2021).
- airBaltic. airBaltic Q3 2020 financial and operational performance update. 2020. Available online: https://www.airbaltic.com/about/annual_reports/report2020q3.pdf (accessed on 14 March 2021).
- Norwegian Air. Norwegian Air Shuttle ASA: Fourth quarter 2020 financial report. 2020. Available online: https://www.norwegian.com/globalassets/ip/documents/about-us/company/investor-relations/reports-and-presentations/interim-reports/norwegian_interim-report_2020_q4.pdf (accessed on 14 March 2021).
- Airports Council International. Airport Statistics and Data Centre. 2021. Available online: https://aci.aero/data-centre/ (accessed on 20 March 2021).


| Country | New Cases | Reprod. Number | Hospit. Patients | ICU Patients | Hospital Beds with Oxygen Support * | ICU Beds * | People Vaccinated | Population |
|---|---|---|---|---|---|---|---|---|
| Austria | 1939 | 1.36 | 726 | 142 | 6637 | 996 | N/A | 9,046,000 |
| Belgium | 10,025 | 1.43 | 2793 | 473 | 6537 | 981 | N/A | 11,589,616 |
| Bulgaria | 1033 | 1.50 | 1478 | 89 | 5179 | 777 | N/A | 6,948,445 |
| Croatia | 1056 | 1.52 | 562 | 56 | 2274 | 341 | N/A | 4,105,268 |
| Cyprus | 84 | 1.51 | 18 | 2 | 298 | 45 | N/A | 875,899 |
| Czechia | 8527 | 1.38 | 3768 | 592 | 7100 | 1065 | N/A | 10,708,982 |
| Denmark | 593 | 1.16 | 119 | 17 | 1448 | 218 | N/A | 5,792,203 |
| Estonia | 49 | 1.17 | 35 | 4 | 622 | 93 | N/A | 1,326,539 |
| Finland | 197 | 1.20 | 51 | 8 | 1817 | 273 | N/A | 5,540,718 |
| France | 26,080 | 1.26 | 11,939 | 2010 | 39,033 | 5855 | N/A | 65,273,512 |
| Germany | 7706 | 0.38 | 12,013 | 863 | 67,027 | 10,055 | N/A | 83,783,945 |
| Greece | 670 | 1.27 | 530 | 70 | 4388 | 659 | N/A | 10,423,056 |
| Hungary | 1576 | 1.24 | 1764 | 325 | 6782 | 1017 | N/A | 9,660,350 |
| Ireland | 816 | 1.20 | 245 | 32 | 1461 | 219 | N/A | 4,937,796 |
| Italy | 11,760 | 1.57 | 8629 | 785 | 19,227 | 2885 | N/A | 60,461,828 |
| Latvia | 131 | 1.42 | 87 | 8 | 1051 | 158 | N/A | 1,886,202 |
| Lithuania | 327 | 1.43 | 254 | 11 | 1786 | 269 | N/A | 2,722,291 |
| Luxembourg | 278 | 1.46 | 67 | 8 | 282 | 42 | N/A | 625,976 |
| Malta | 96 | 1.24 | 47 | 10 | 198 | 30 | N/A | 441,539 |
| Netherlands | 7473 | 1.27 | 1233 | 349 | 5689 | 854 | N/A | 17,134,873 |
| Poland | 8749 | 1.56 | 7843 | 980 | 25,054 | 3758 | N/A | 37,846,605 |
| Portugal | 2121 | 1.34 | 1144 | 166 | 3457 | 792 | N/A | 10,196,707 |
| Romania | 3670 | 1.26 | 6872 | 716 | 13,259 | 1988 | N/A | 19,237,682 |
| Slovakia | 1533 | 1.36 | 581 | 76 | 3176 | 477 | N/A | 5,459,643 |
| Slovenia | 923 | 1.52 | 300 | 50 | 936 | 141 | N/A | 2,078,932 |
| Spain | 13,435 | 1.18 | 12,958 | 1848 | 13,886 | 2084 | N/A | 46,754,783 |
| Sweden | 1016 | 1.33 | 274 | 32 | 2242 | 336 | N/A | 10,099,270 |
| Country | New Cases | Reprod. Number | Hospit. Patients | ICU Patients | Hospital Beds with Oxygen Support * | ICU Beds* | People Vaccinated | Population |
|---|---|---|---|---|---|---|---|---|
| Austria | 1470 | 0.98 | 1294 | 287 | 6637 | 996 | 121,216 | 9,046,000 |
| Belgium | 2182 | 1.03 | 1728 | 312 | 6537 | 981 | 232,861 | 11,589,616 |
| Bulgaria | 736 | 1.14 | 3141 | 283 | 5179 | 777 | 21,496 | 6,948,445 |
| Croatia | 407 | 0.85 | 1148 | 56 | 2274 | 341 | 64,951 | 4,105,268 |
| Cyprus | 117 | 0.86 | 117 | 26 | 298 | 45 | 15,322 | 875,899 |
| Czechia | 7606 | 1.03 | 6032 | 1098 | 7100 | 1065 | 189,566 | 10,708,982 |
| Denmark | 494 | 0.83 | 490 | 91 | 1448 | 218 | 180,625 | 5,792,203 |
| Estonia | 594 | 1.10 | 465 | 36 | 622 | 93 | 23,523 | 1,326,539 |
| Finland | 393 | 1.10 | 130 | 21 | 1817 | 273 | 91,260 | 5,540,718 |
| France | 19,946 | 1.01 | 26,841 | 3223 | 39,033 | 5855 | 959,716 | 65,273,512 |
| Germany | 9214 | 0.88 | 49,050 | 3249 | 67,027 | 10,055 | 1,526,605 | 83,783,945 |
| Greece | 946 | 1.16 | 539 | 54 | 4388 | 659 | 141,298 | 10,423,056 |
| Hungary | 1528 | 1.10 | 3800 | 240 | 6782 | 1017 | 143,184 | 9,660,350 |
| Ireland | 1069 | 0.73 | 1272 | 186 | 1461 | 219 | 143,000 | 4,937,796 |
| Italy | 12,291 | 0.98 | 21,855 | 2183 | 19,227 | 2885 | 1,326,263 | 60,461,828 |
| Latvia | 734 | 1.00 | 1100 | 49 | 1051 | 158 | 16,779 | 1,886,202 |
| Lithuania | 650 | 0.82 | 1166 | 26 | 1786 | 269 | 59,170 | 2,722,291 |
| Luxembourg | 144 | 1.08 | 69 | 13 | 282 | 42 | 7309 | 625,976 |
| Malta | 149 | 1.00 | 26 | 6 | 198 | 30 | 17,767 | 441,539 |
| Netherlands | 4041 | 0.91 | 1506 | 586 | 5689 | 854 | 135,000 | 17,134,873 |
| Poland | 5839 | 1.00 | 13,073 | 776 | 25,054 | 3758 | 638,798 | 37,846,605 |
| Portugal | 6528 | 0.72 | 5662 | 797 | 3457 | 792 | 210,734 | 10,196,707 |
| Romania | 2449 | 0.97 | 5945 | 975 | 13,259 | 1988 | 374,681 | 19,237,682 |
| Slovakia | 1965 | 1.01 | 3422 | 253 | 3176 | 477 | 99,455 | 5,459,643 |
| Slovenia | 983 | 0.90 | 917 | 157 | 936 | 141 | 52,340 | 2,078,932 |
| Spain | 21,821 | 0.94 | 28,967 | 4599 | 13,886 | 2084 | 1,097,369 | 46,754,783 |
| Sweden | 2846 | 1.21 | 1613 | 246 | 2242 | 336 | 221,504 | 10,099,270 |
| Country | New Cases | Reprod. Number | Hospit. Patients | ICU Patients | Hospital Beds with Oxygen Support * | ICU Beds * | People Vaccinated | Population |
|---|---|---|---|---|---|---|---|---|
| Austria | 1538 | 1.07 | 1121 | 264 | 6637 | 996 | 212,062 | 9,046,000 |
| Belgium | 2062 | 1.02 | 1621 | 309 | 6537 | 981 | 349,992 | 11,589,616 |
| Bulgaria | 923 | 1.22 | 3416 | 292 | 5179 | 777 | 41,407 | 6,948,445 |
| Croatia | 325 | 0.89 | 941 | 43 | 2274 | 341 | 61,241 | 4,105,268 |
| Cyprus | 107 | 0.99 | 87 | 19 | 298 | 45 | 22,813 | 875,899 |
| Czechia | 8442 | 1.12 | 6168 | 1188 | 7100 | 1065 | 266,445 | 10,708,982 |
| Denmark | 423 | 0.90 | 341 | 67 | 1448 | 218 | 199,439 | 5,792,203 |
| Estonia | 692 | 1.17 | 495 | 35 | 622 | 93 | 35,917 | 1,326,539 |
| Finland | 438 | 1.11 | 125 | 21 | 1817 | 273 | 170,641 | 5,540,718 |
| France | 19,194 | 0.97 | 26,453 | 3342 | 39,033 | 5855 | 1,922,706 | 65,273,512 |
| Germany | 7346 | 0.89 | 30,401 | 3936 | 67,027 | 10,055 | 2,380,609 | 83,783,945 |
| Greece | 1133 | 1.17 | 539 | 71 | 4388 | 659 | 332,812 | 10,423,056 |
| Hungary | 1895 | 1.25 | 3908 | 242 | 6782 | 1017 | 291,396 | 9,660,350 |
| Ireland | 821 | 0.79 | 906 | 162 | 1461 | 219 | 154,900 | 4,937,796 |
| Italy | 12,322 | 1.03 | 20,626 | 2089 | 19,227 | 2885 | 1,464,945 | 60,461,828 |
| Latvia | 694 | 1.00 | 955 | 71 | 1051 | 158 | 18,075 | 1,886,202 |
| Lithuania | 520 | 0.87 | 901 | 23 | 1786 | 269 | 79,268 | 2,722,291 |
| Luxembourg | 162 | 1.10 | 71 | 14 | 282 | 42 | 14,089 | 625,976 |
| Malta | 158 | 1.07 | 16 | 4 | 198 | 30 | 30,235 | 441,539 |
| Netherlands | 3679 | 0.98 | 1395 | 531 | 5689 | 854 | 414,858 | 17,134,873 |
| Poland | 6322 | 1.12 | 12,329 | 956 | 25,054 | 3758 | 1,291,569 | 37,846,605 |
| Portugal | 2294 | 0.51 | 4724 | 771 | 3457 | 792 | 291,758 | 10,196,707 |
| Romania | 2456 | 1.03 | 4999 | 267 | 13,259 | 1988 | 661,062 | 19,237,682 |
| Slovakia | 2058 | 1.03 | 3576 | 281 | 3176 | 477 | 193,218 | 5,459,643 |
| Slovenia | 790 | 0.90 | 737 | 137 | 936 | 141 | 55,684 | 2,078,932 |
| Spain | 13,652 | 0.81 | 16,236 | 1094 | 13,886 | 2084 | 1,328,459 | 46,754,783 |
| Sweden | 3079 | 1.21 | 1337 | 222 | 2242 | 336 | 326,607 | 10,099,270 |
| Country | New Cases | Reprod. Number | Hospit. Patients | ICU Patients | Hospital Beds with Oxygen Support * | ICU Beds * | People Vaccinated | Population |
|---|---|---|---|---|---|---|---|---|
| Austria | 1698 | 1.12 | 1048 | 261 | 6637 | 996 | 298,199 | 9,046,000 |
| Belgium | 2263 | 1.06 | 1604 | 318 | 6537 | 981 | 423,946 | 11,589,616 |
| Bulgaria | 998 | 1.23 | 3614 | 300 | 5179 | 777 | 92,381 | 6,948,445 |
| Croatia | 327 | 0.96 | 851 | 39 | 2274 | 341 | 87,169 | 4,105,268 |
| Cyprus | 107 | 1.05 | 81 | 16 | 298 | 45 | 37,570 | 875,899 |
| Czechia | 9307 | 1.17 | 6381 | 1273 | 7100 | 1065 | 341,687 | 10,708,982 |
| Denmark | 459 | 0.94 | 289 | 62 | 1448 | 218 | 320,891 | 5,792,203 |
| Estonia | 743 | 1.20 | 512 | 37 | 622 | 93 | 61,904 | 1,326,539 |
| Finland | 489 | 1.13 | 132 | 26 | 1817 | 273 | 287,998 | 5,540,718 |
| France | 20,056 | 0.96 | 25,794 | 3368 | 39,033 | 5855 | 2,564,530 | 65,273,512 |
| Germany | 7538 | 0.93 | 23,690 | 3029 | 67,027 | 10,055 | 3,335,830 | 83,783,945 |
| Greece | 1096 | 1.17 | 539 | 57 | 4388 | 659 | 467,656 | 10,423,056 |
| Hungary | 2223 | 1.33 | 4043 | 273 | 6782 | 1017 | 453,457 | 9,660,350 |
| Ireland | 782 | 0.82 | 799 | 153 | 1461 | 219 | 222,073 | 4,937,796 |
| Italy | 12,481 | 1.06 | 20,149 | 2067 | 19,227 | 2885 | 2,201,756 | 60,461,828 |
| Latvia | 686 | 1.00 | 828 | 91 | 1051 | 158 | 29,288 | 1,886,202 |
| Lithuania | 475 | 0.90 | 861 | 22 | 1786 | 269 | 122,410 | 2,722,291 |
| Luxembourg | 178 | 1.11 | 74 | 15 | 282 | 42 | 23,259 | 625,976 |
| Malta | 158 | 1.10 | 24 | 4 | 198 | 30 | 43,888 | 441,539 |
| Netherlands | 3955 | 1.04 | 1382 | 524 | 5689 | 854 | 778,744 | 17,134,873 |
| Poland | 7116 | 1.18 | 12,332 | 667 | 25,054 | 3758 | 1,785,194 | 37,846,605 |
| Portugal | 1681 | 0.49 | 3917 | 703 | 3457 | 792 | 429,020 | 10,196,707 |
| Romania | 2533 | 1.06 | 4831 | 266 | 13,259 | 1988 | 803,098 | 19,237,682 |
| Slovakia | 2066 | 1.05 | 3623 | 278 | 3176 | 477 | 276,535 | 5,459,643 |
| Slovenia | 755 | 0.91 | 638 | 119 | 936 | 141 | 95,070 | 2,078,932 |
| Spain | 11,012 | 0.78 | 13,020 | 925 | 13,886 | 2084 | 1,893,290 | 46,754,783 |
| Sweden | 3251 | 1.21 | 1288 | 217 | 2242 | 336 | 398,092 | 10,099,270 |
| Airliner | TR 2020 1 | TR 2019 1 | Net Income 2020 1 | Net Income 2019 1 | PAX 2020 2 | PAX 2019 2 | LF 2020 | LF 2019 |
|---|---|---|---|---|---|---|---|---|
| Ryanair Holding [32] | 340 | 1.91 | −306 | 88 | 25,200 | 121,600 | 72.0% | 96.0% |
| Lufthansa Group [33] | 13,589 | 36,424 | −6725 | 1213 | 36,354 | 145,299 | 63.2% | 82.6% |
| Air France-KML Group [34] | 11,088 | 27,189 | −7078 | 290 | 5211 | 87,624 | 41.4% | 87.9% |
| International Airlines Group [35] | 7806 | 25,51 | −6923 | 1715 | 31,275 | 118,253 | 63.8% | 84.6% |
| Austrian Airlines [35] | 460 | 2108 | −381 | 15 | 3114 | 14,613 | 61.9% | 80.8% |
| Brussels Airlines [35] | 414 | 1473 | −332 | −32 | 2362 | 10,285 | 68.3% | 81.5% |
| Wizz Air [36] | 2761 | 2319 | 344 | 265 | 40,027 | 34,566 | 93.6% | 92.8% |
| SAS Group [18] | 2009 | 4517 | −908 | 60 | 12,610 | 29,761 | 60.5% | 75.2% |
| Tap Portugal [37] | N/A | 3345 | N/A | −105 | N/A | 17,052 | N/A | 80.1% |
| Aegean Airlines [38] | N/A | 1308 | N/A | 78 | N/A | 14,900 | N/A | 85.0% |
| Finnair [39] | 829 | 3097 | −523 | 74 | 14,645 | 34,856 | 63.0% | 81.7% |
| TUI Group [40] | 7952 | 18,928 | −3139 | 532 | 8057 | 21,075 | N/A | N/A |
| Air Baltic [41] | 120 | 392 | −578 | −640 | 1179 | 3875 | 55.6% | 76.6% |
| Norwegian Air [42] | 897 | 4293 | −2272 | −158 | 6870 | 36,200 | 75.2% | 86.6% |
| State | IATA Code | Airport | PAX Statistics 2019 1 | PAX Statistics 2020 1 | Change |
|---|---|---|---|---|---|
| Austria | VIE | Vienna International Airport | 31.6 | 7.8 | −75.3% |
| Belgium | BRU | Brussels Airport | 26.3 | 6.7 | −74.0% |
| Bulgaria | SOF | Sofia Airport | 7.1 | 2.9 | −58.7% |
| Croatia | ZAG | Zagreb Airport | 3.3 | 0.9 | −72.0% |
| Cyprus | LCA | Larnaca Airport | 8.2 | 1.6 | −79.5% |
| Czechia | PRG | Václav Havel Airport Prague | 17.8 | 3.0 | −79.4% |
| Denmark | CPH | Copenhagen Airport | 30.1 | 7.5 | −75.0% |
| Estonia | TLL | Tallin Airport | 0.8 | 0.2 | −73.6% |
| Finland | HEL | Helsinki Airport | 26.0 | 5.0 | −76.8% |
| France | CDG | Paris Charles de Gaulle Airport | 76.2 | 33.1 | −69.4% |
| Germany | FRA | Frankfurt am Main Airport | 70.6 | 18.8 | −73.0% |
| Germany | MUC | Munich Airport | 47.9 | 11.1 | −76.8% |
| Greece | ATH | Athens International Airport | 25.6 | 8.1 | −68.4% |
| Hungary | BUD | Budapest Ferenc Liszt International Airport | 16.2 | 3.8 | −76.0% |
| Ireland | DUB | Dublin Airport | 32.9 | 7.4 | −78.0% |
| Italy | FCO | Rome–Fiumicino International Airport | 43.5 | 11.4 | −76.8% |
| Latvia | RIX | Riga International Airport | 7.8 | 0.5 | −91.0% |
| Lithuania | KUN | Kaunas International Airport | 1.2 | 0.4 | −68.0% |
| Luxembourg | LUX | Luxembourg Airport | 4.4 | 1.4 | −68.0% |
| Malta | MLA | Malta International Airport | 7.3 | 1.7 | −76.0% |
| Netherlands | AMS | Amsterdam Airport Schiphol | 71.0 | 20.8 | −71.0% |
| Poland | WAW | Warsaw Chopin Airport | 18.2 | 5.0 | −69.0% |
| Portugal | LIS | Lisbon Portela Airport | 31.0 | N/A | N/A |
| Romania | OTP | Henri Coandă International Airport | 14.7 | 4.4 | −69.0% |
| Slovakia | BTS | Bratislava Airport | 2.3 | 0.4 | −82.0% |
| Spain | MAD | Madrid-Barajas Airport | 61.7 | 17.1 | −79.7% |
| Sweden | ARN | Stockholm Arlanda Airport | 25.6 | 6.5 | −74.0% |
Publisher’s Note: MDPI stays neutral with regard to jurisdictional claims in published maps and institutional affiliations. |
© 2021 by the authors. Licensee MDPI, Basel, Switzerland. This article is an open access article distributed under the terms and conditions of the Creative Commons Attribution (CC BY) license (https://creativecommons.org/licenses/by/4.0/).
Share and Cite
Szabo, S.; Makó, S.; Kešeľová, M.; Szabo, S., Jr. Design of a Unified Algorithm to Ensure the Sustainable Use of Air Transport during a Pandemic. Sustainability 2021, 13, 5970. https://doi.org/10.3390/su13115970
Szabo S, Makó S, Kešeľová M, Szabo S Jr. Design of a Unified Algorithm to Ensure the Sustainable Use of Air Transport during a Pandemic. Sustainability. 2021; 13(11):5970. https://doi.org/10.3390/su13115970
Chicago/Turabian StyleSzabo, Stanislav, Sebastián Makó, Michaela Kešeľová, and Stanislav Szabo, Jr. 2021. "Design of a Unified Algorithm to Ensure the Sustainable Use of Air Transport during a Pandemic" Sustainability 13, no. 11: 5970. https://doi.org/10.3390/su13115970
APA StyleSzabo, S., Makó, S., Kešeľová, M., & Szabo, S., Jr. (2021). Design of a Unified Algorithm to Ensure the Sustainable Use of Air Transport during a Pandemic. Sustainability, 13(11), 5970. https://doi.org/10.3390/su13115970