
Durability Performance Evaluation of Rubberized Geopolymer Concrete


Abstract
:1. Introduction
2. Materials Descriptions and Mix Proportions
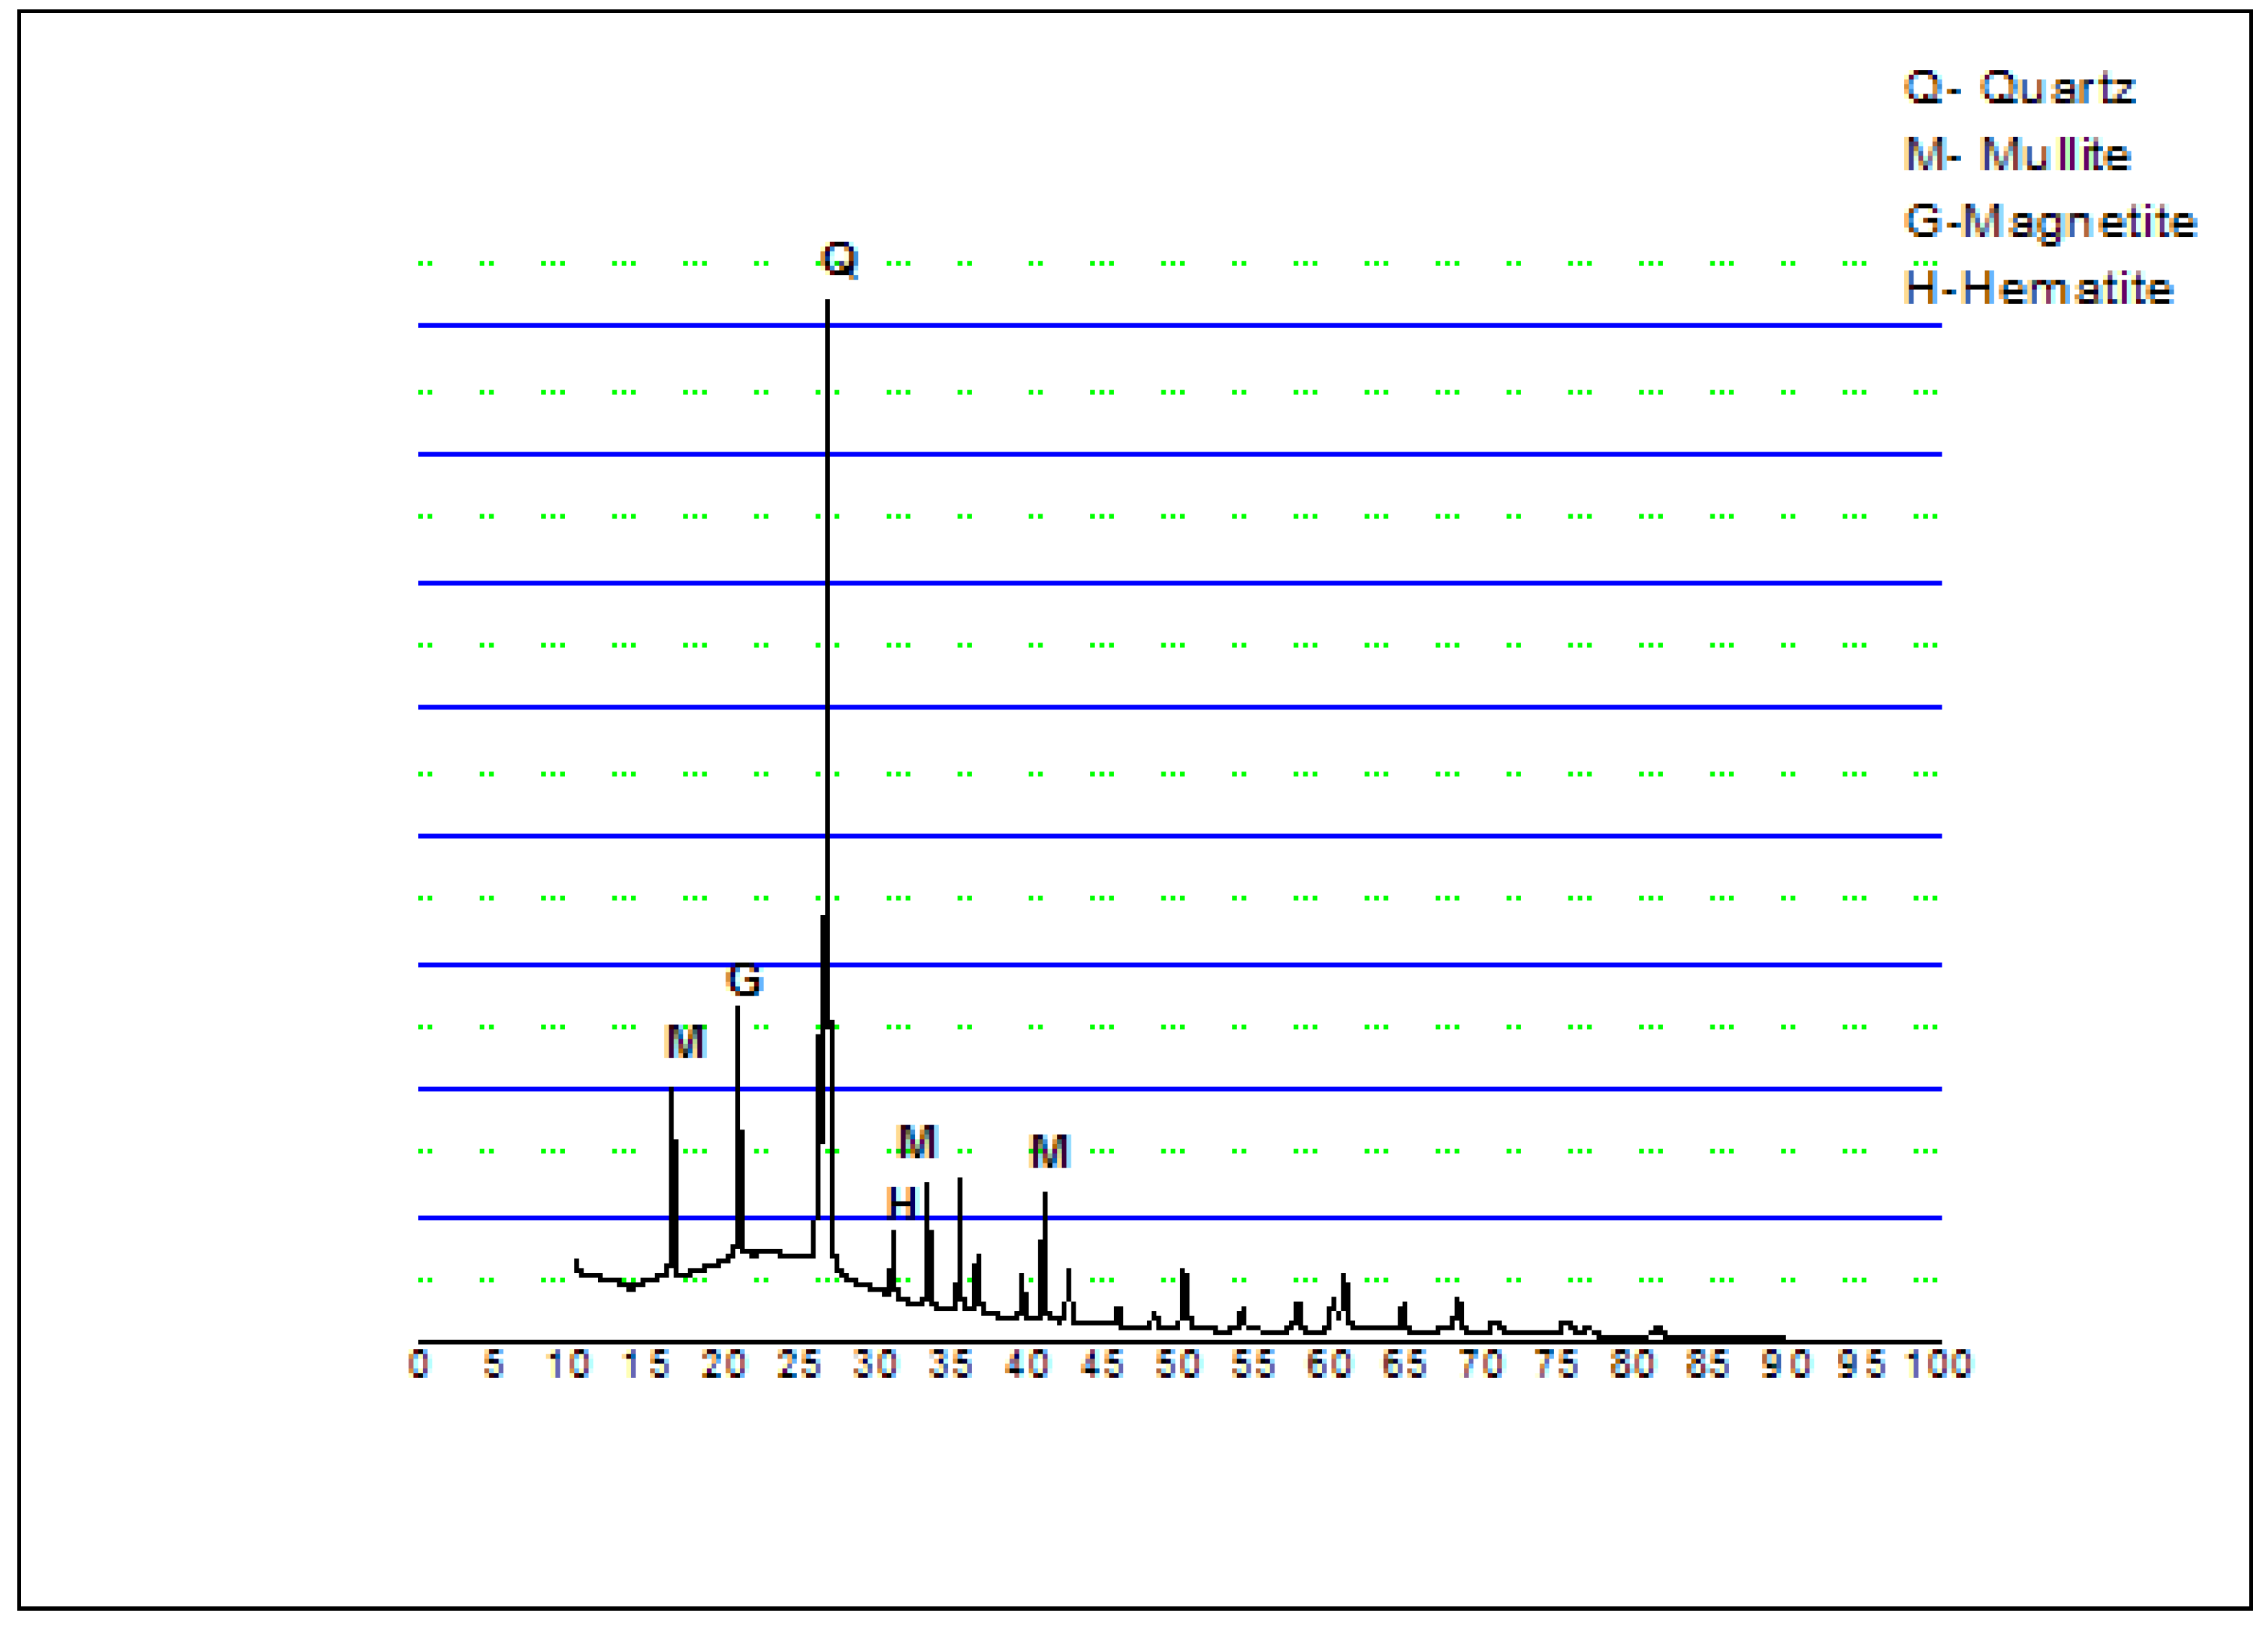
2.1. Raw Materials
2.2. Mix Proportions
2.3. Details of the Experiment
3. Durability Experiments Methods
3.1. Water Permeability
3.2. Carbonation
3.3. Drying Shrinkage
3.4. Sulfate Resistance
3.5. Acid Resistance
3.6. Salt Attack Resistance
3.7. Water Sorptivity
3.8. Chloride Ion Migration
- T = Initial and final temperature average value, in anolyte solution (K),
- R = Constant of Gas= 8.314 J/(K.mol−1)
- L = Sample thickness, m,
- Z = Ion valence’s absolute value (for chloride, Z = 1)
- F = Constant of Faraday = 9.648 × 10⁴ J/(V.mol),
- J = chloride flux, J (mol/cm2s)
- C1 = Chloride ions activity
- ΔE = absolute potential difference of the solution as upstream and downstream measured by the use of two reference electrodes.
3.9. Corrosion
- Ij = Macro-cell current
- Vj = Voltage measured over 100 Ω resistor
4. Results and Discussion
4.1. Water Permeability
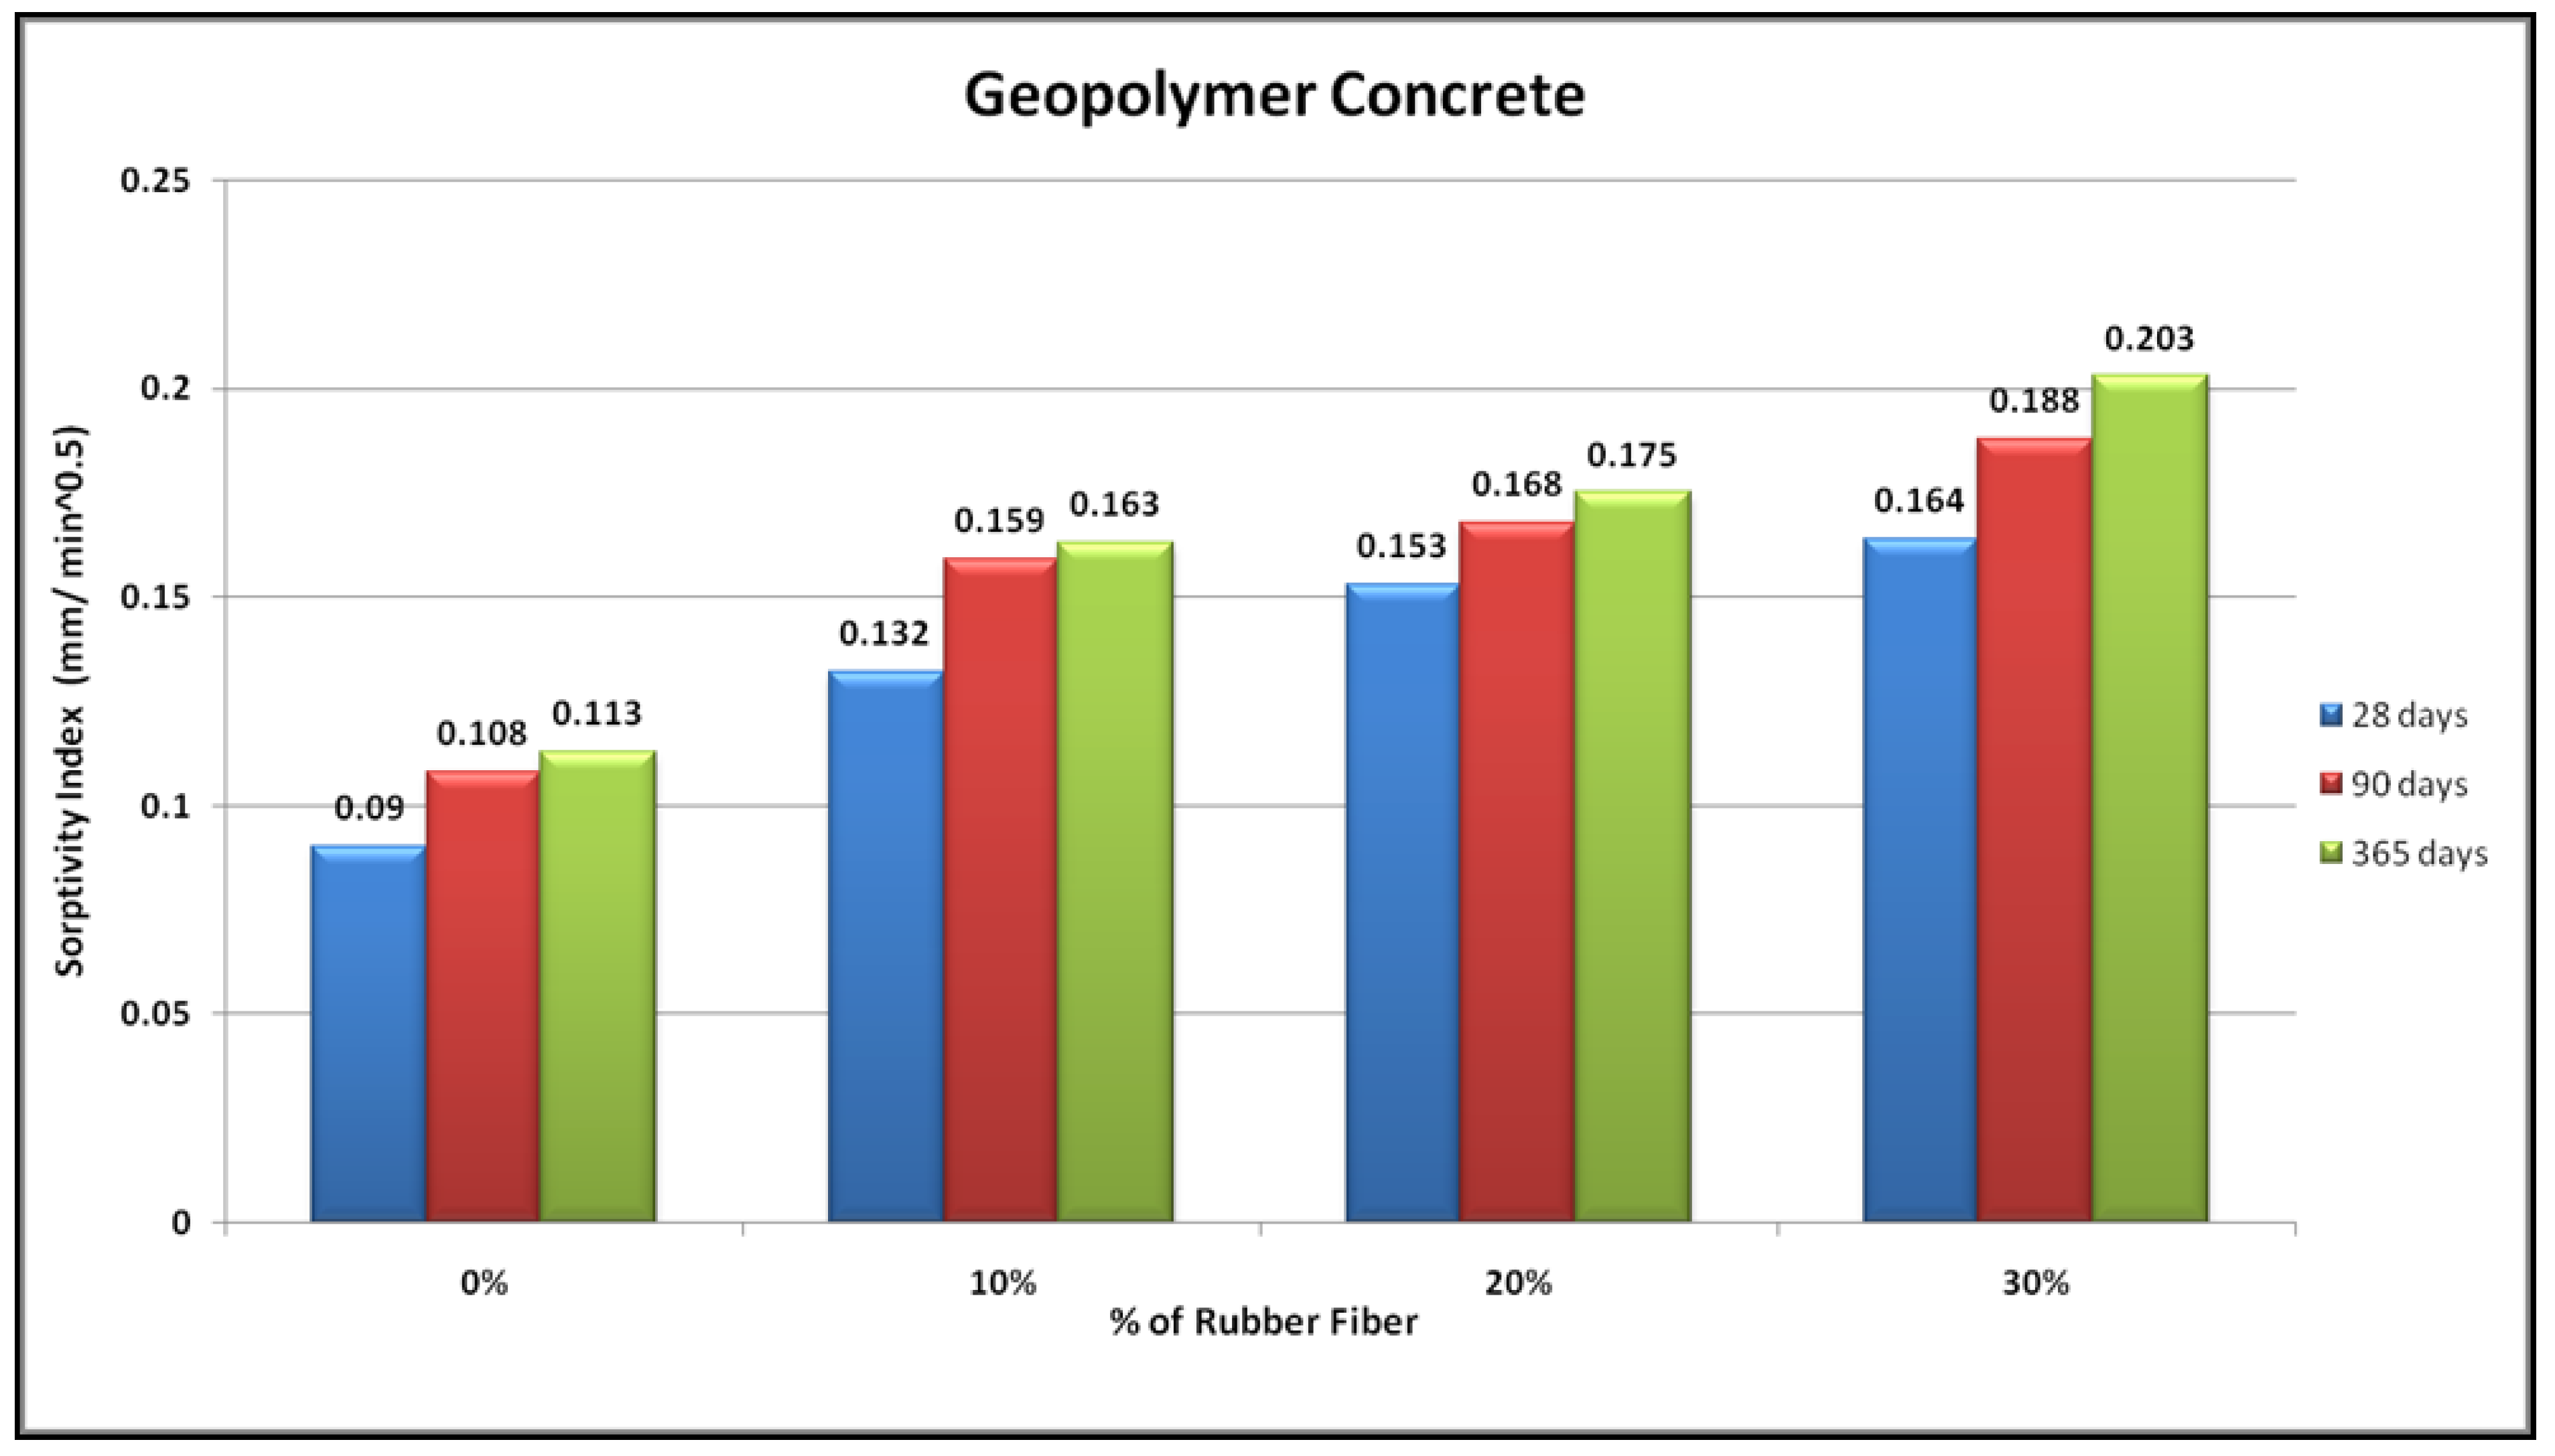
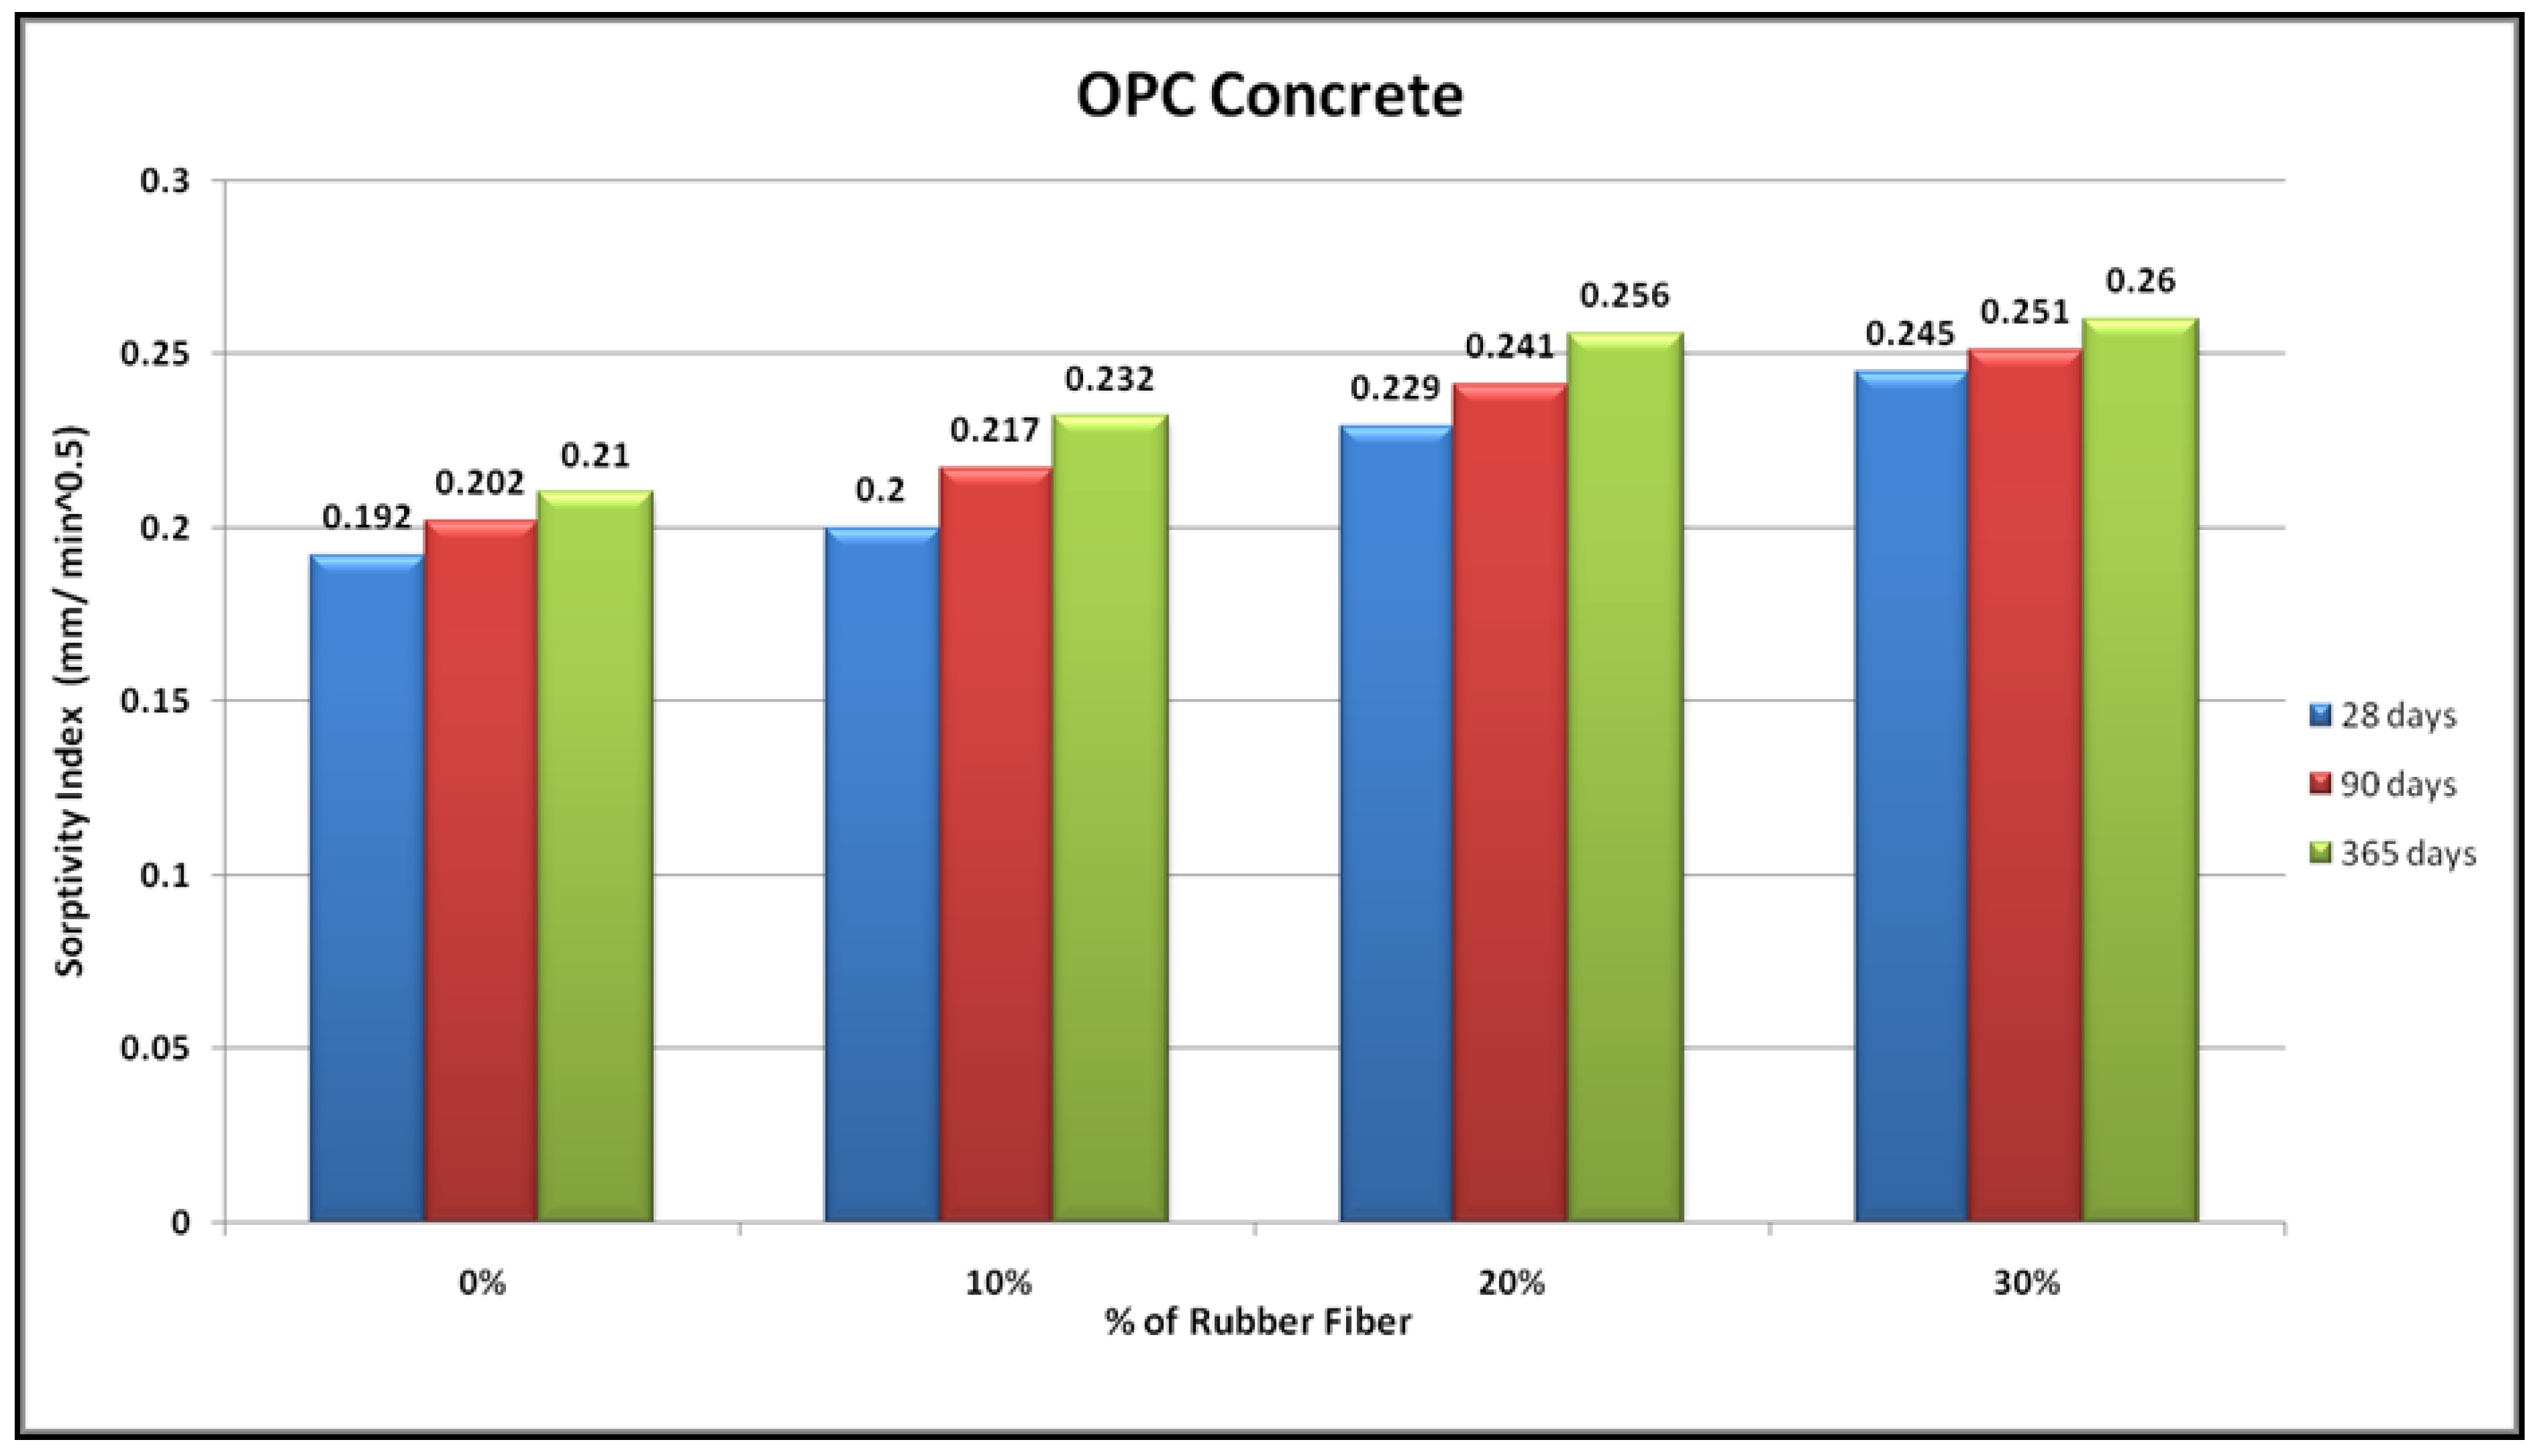
4.2. Sorptivity
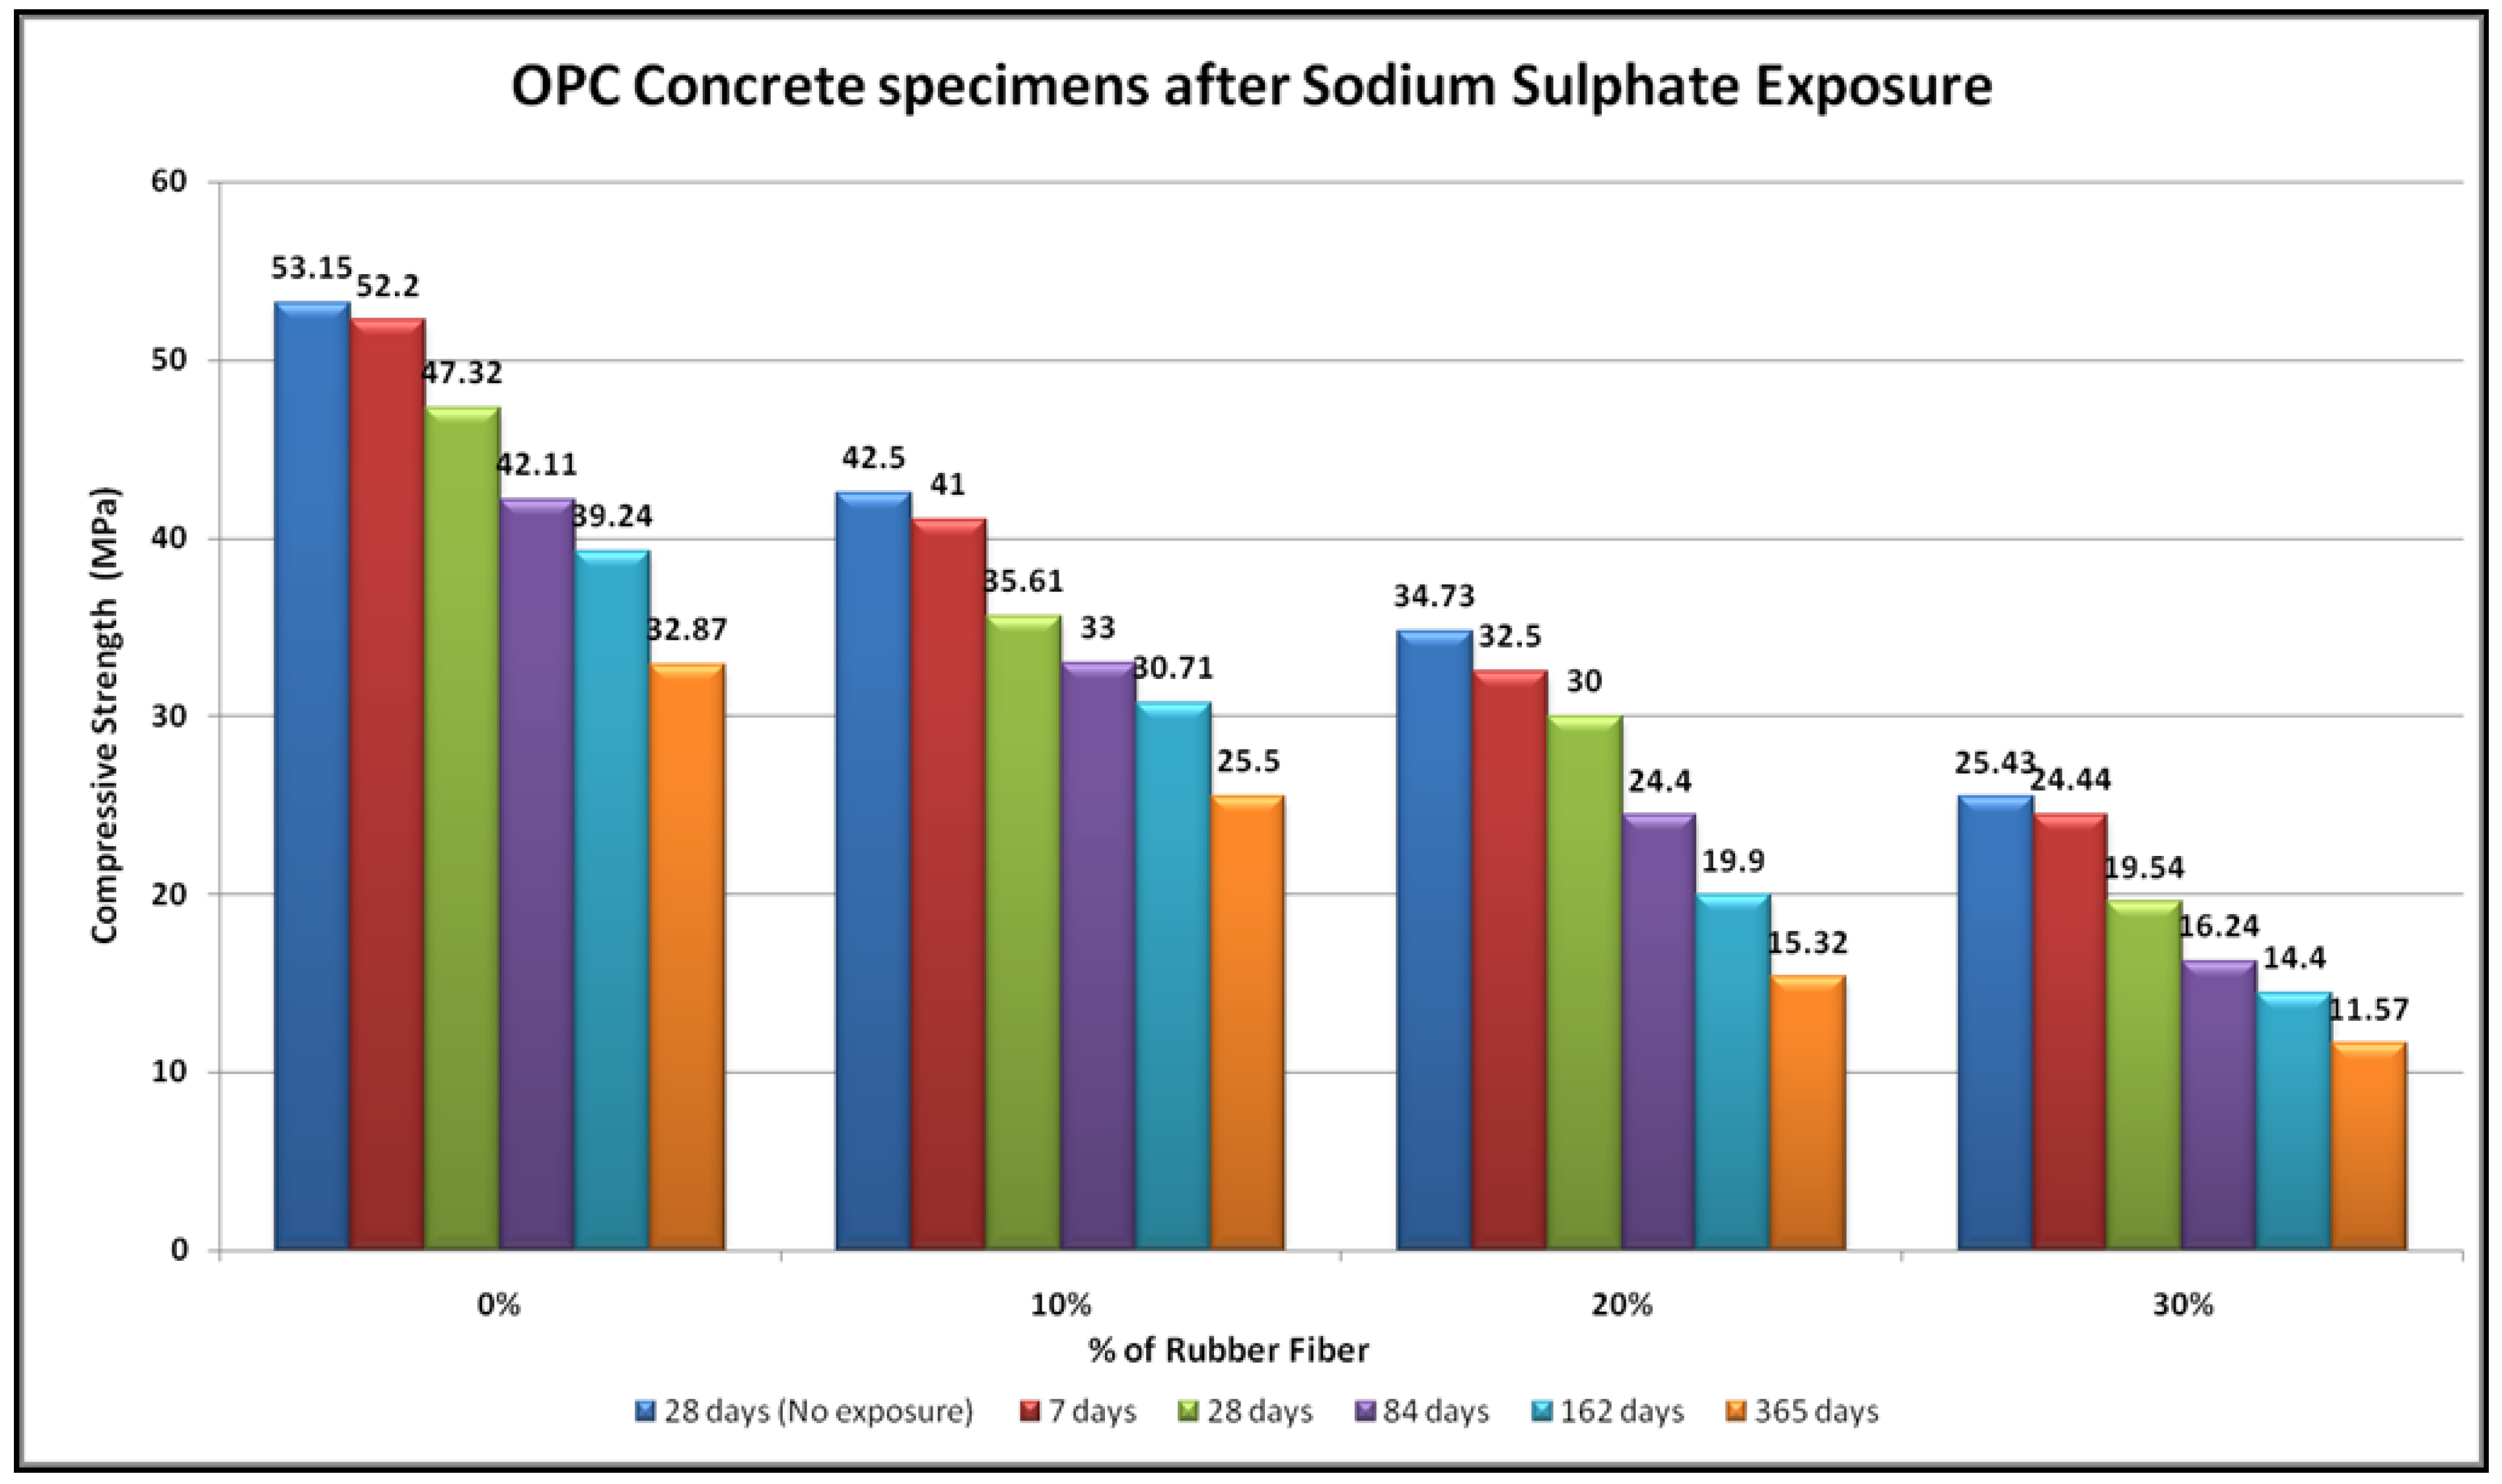
4.3. Sulfate Resistance
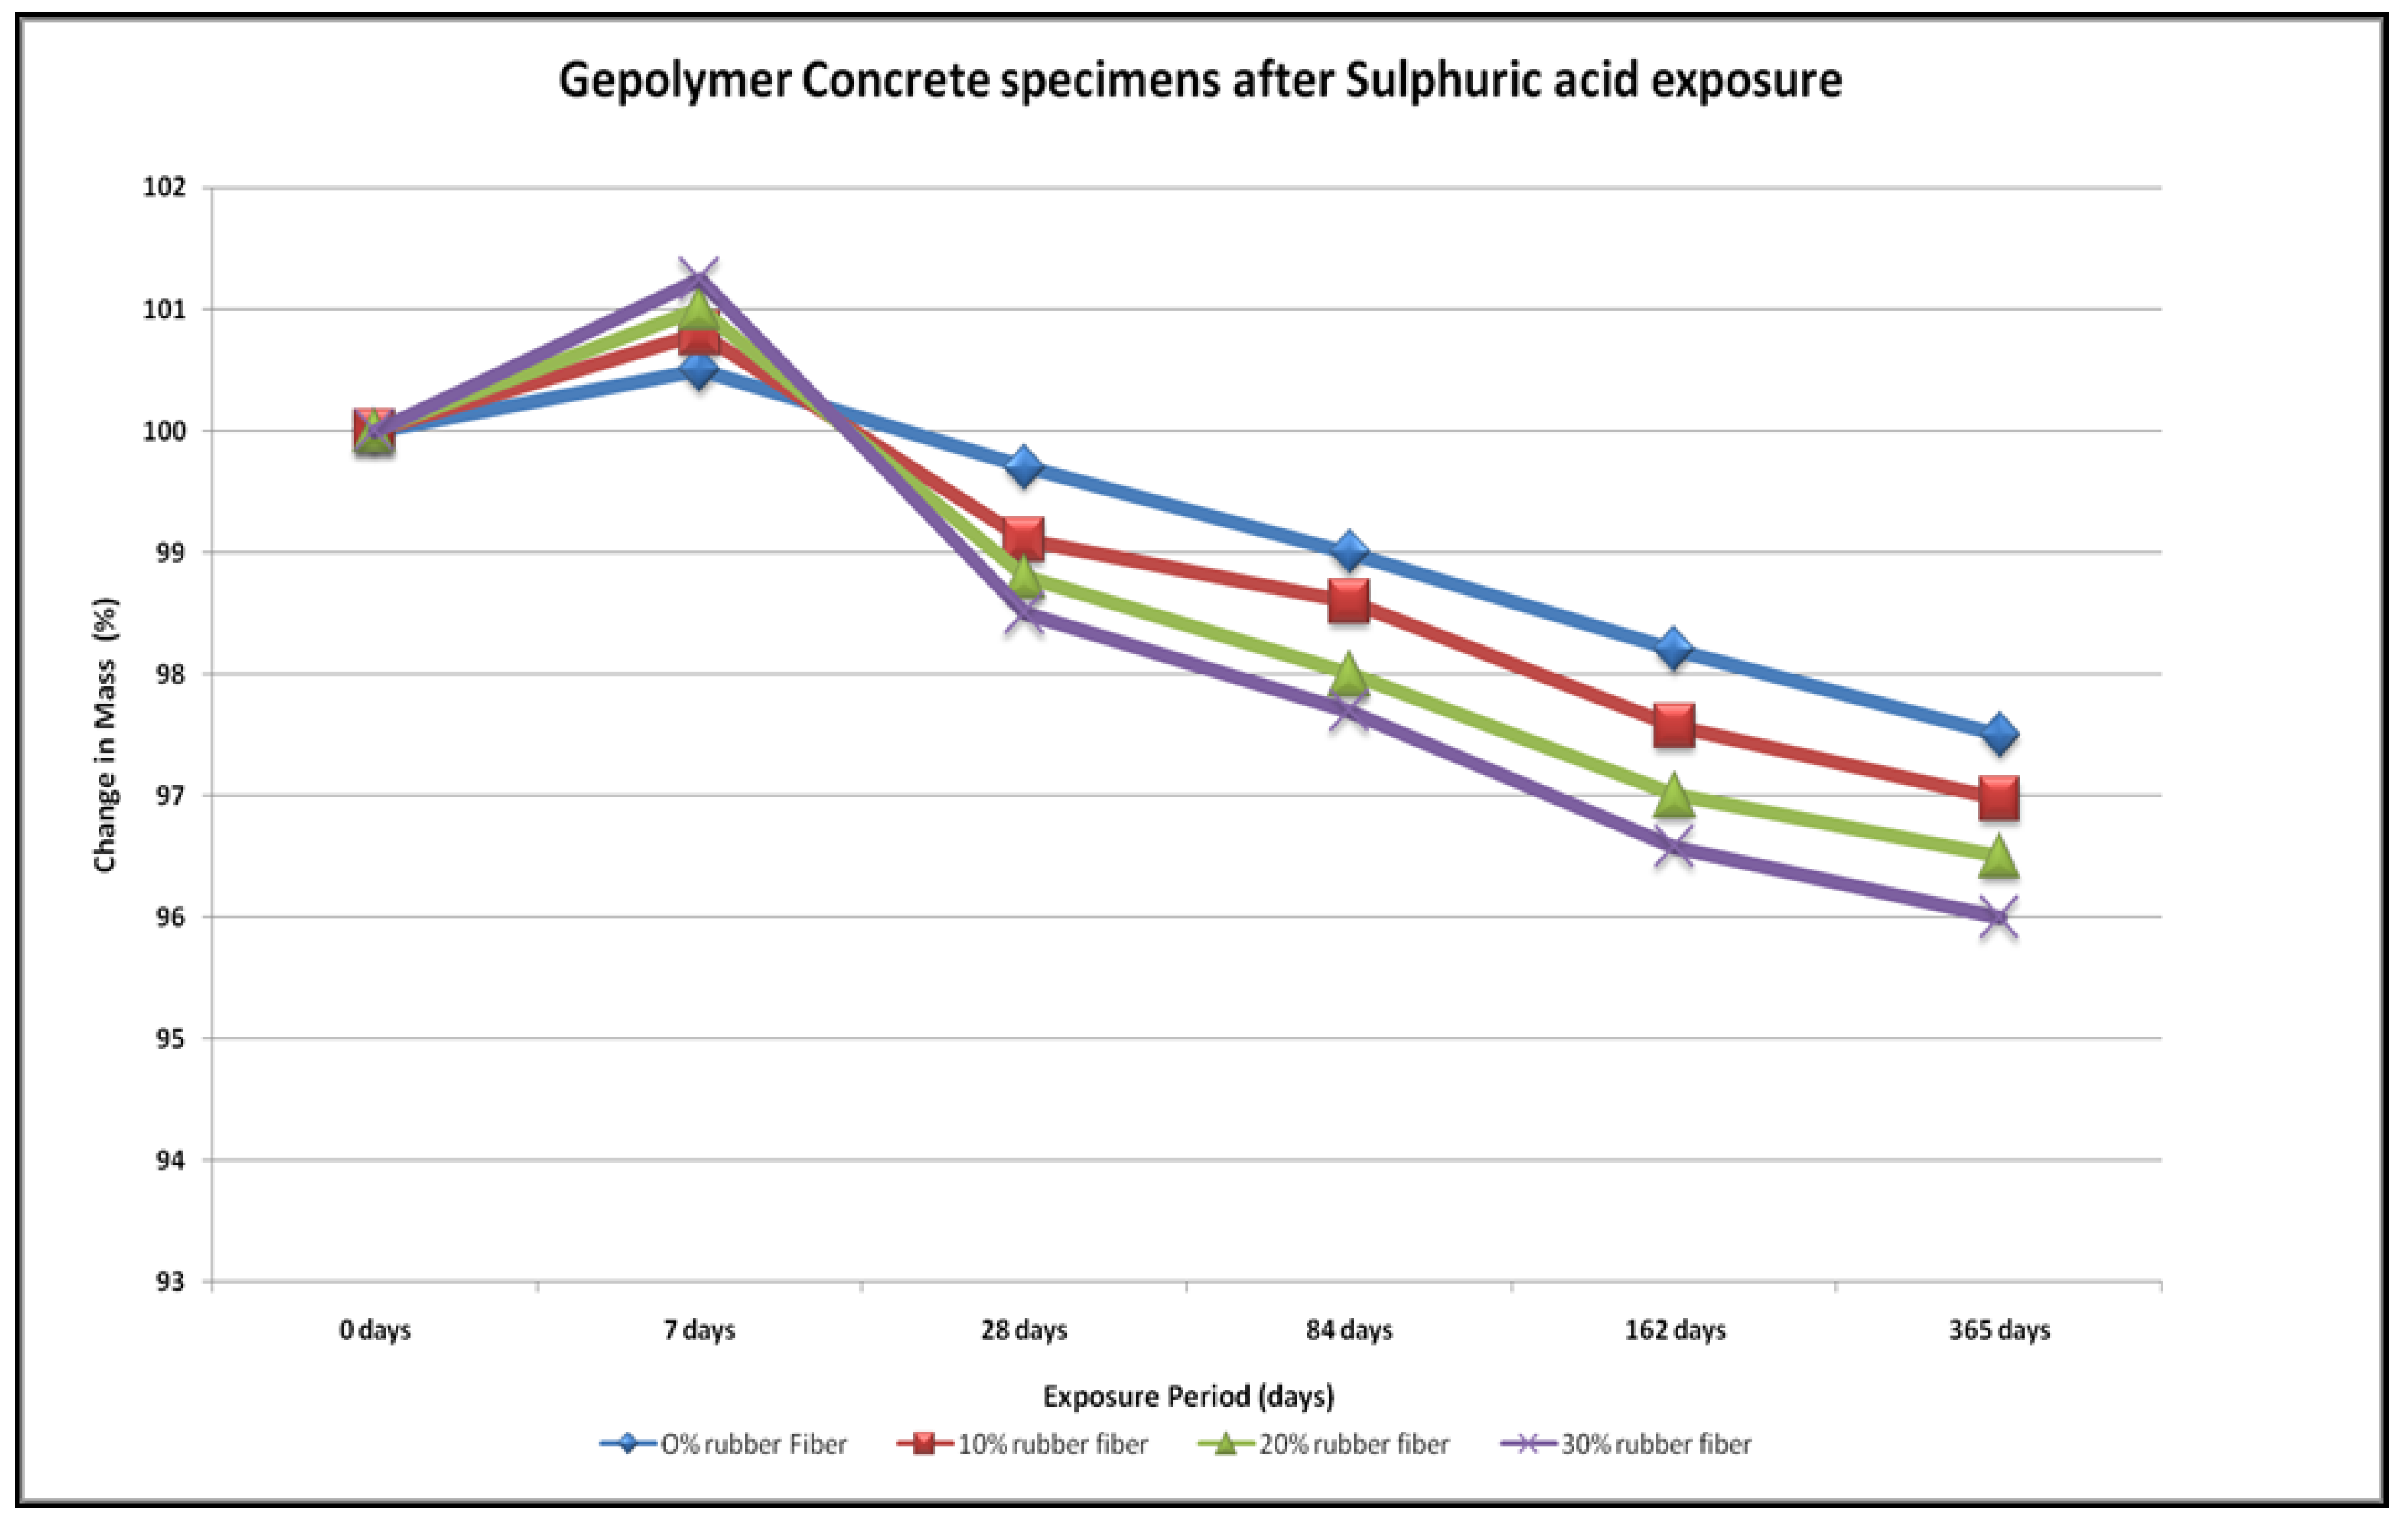
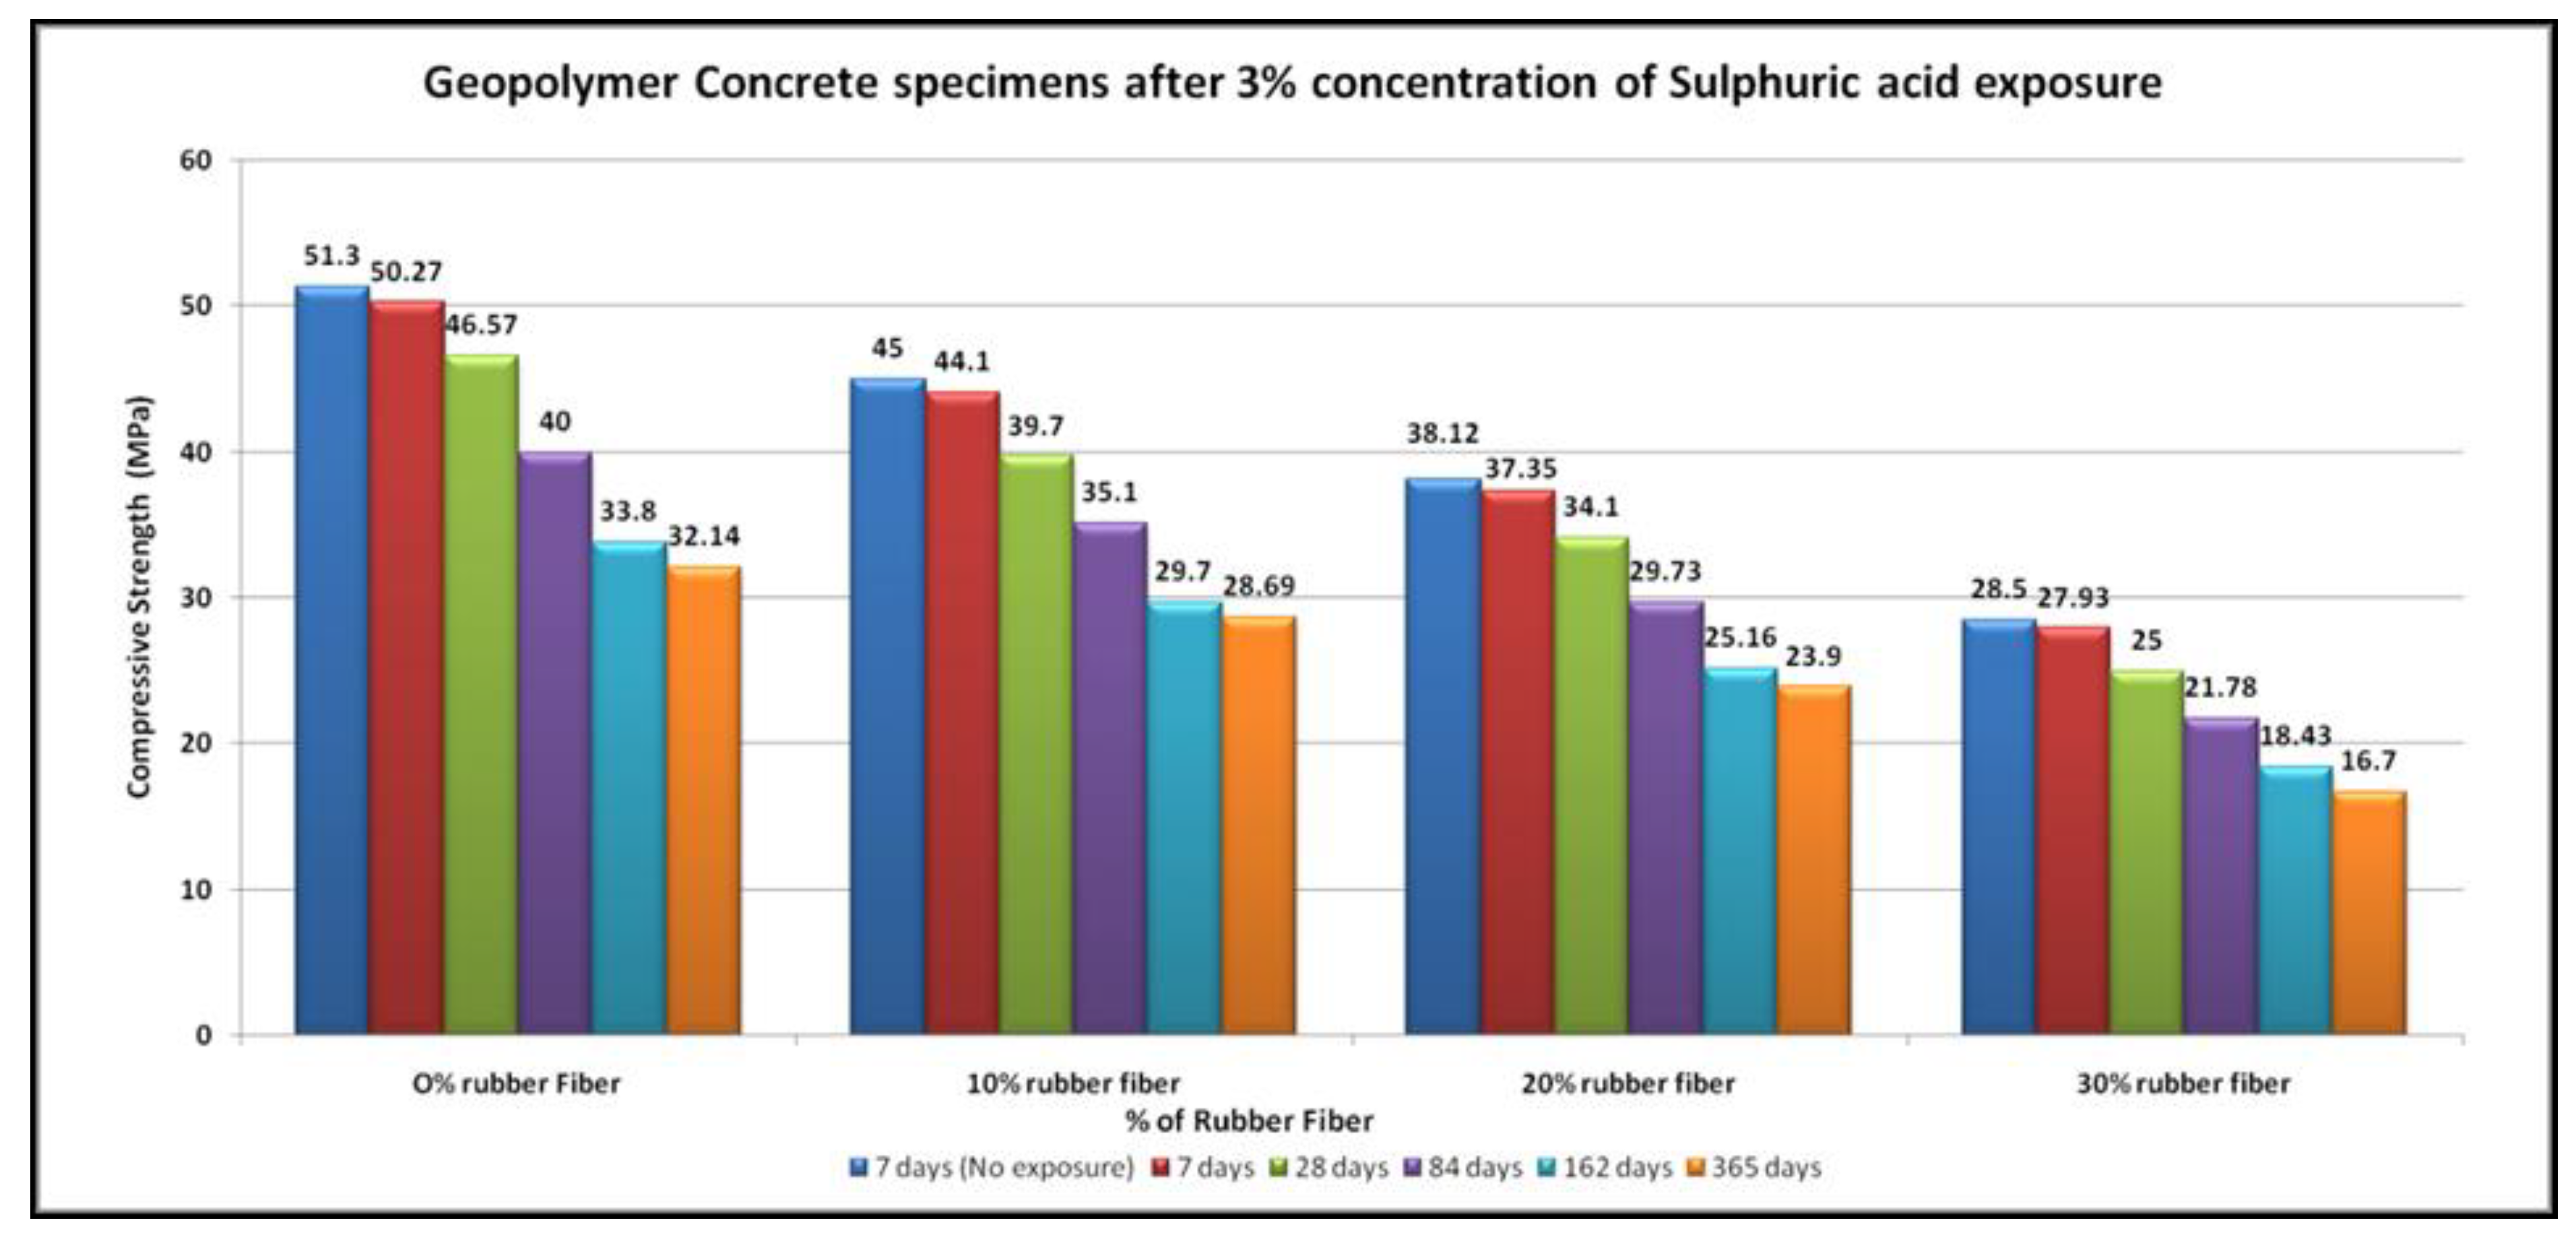
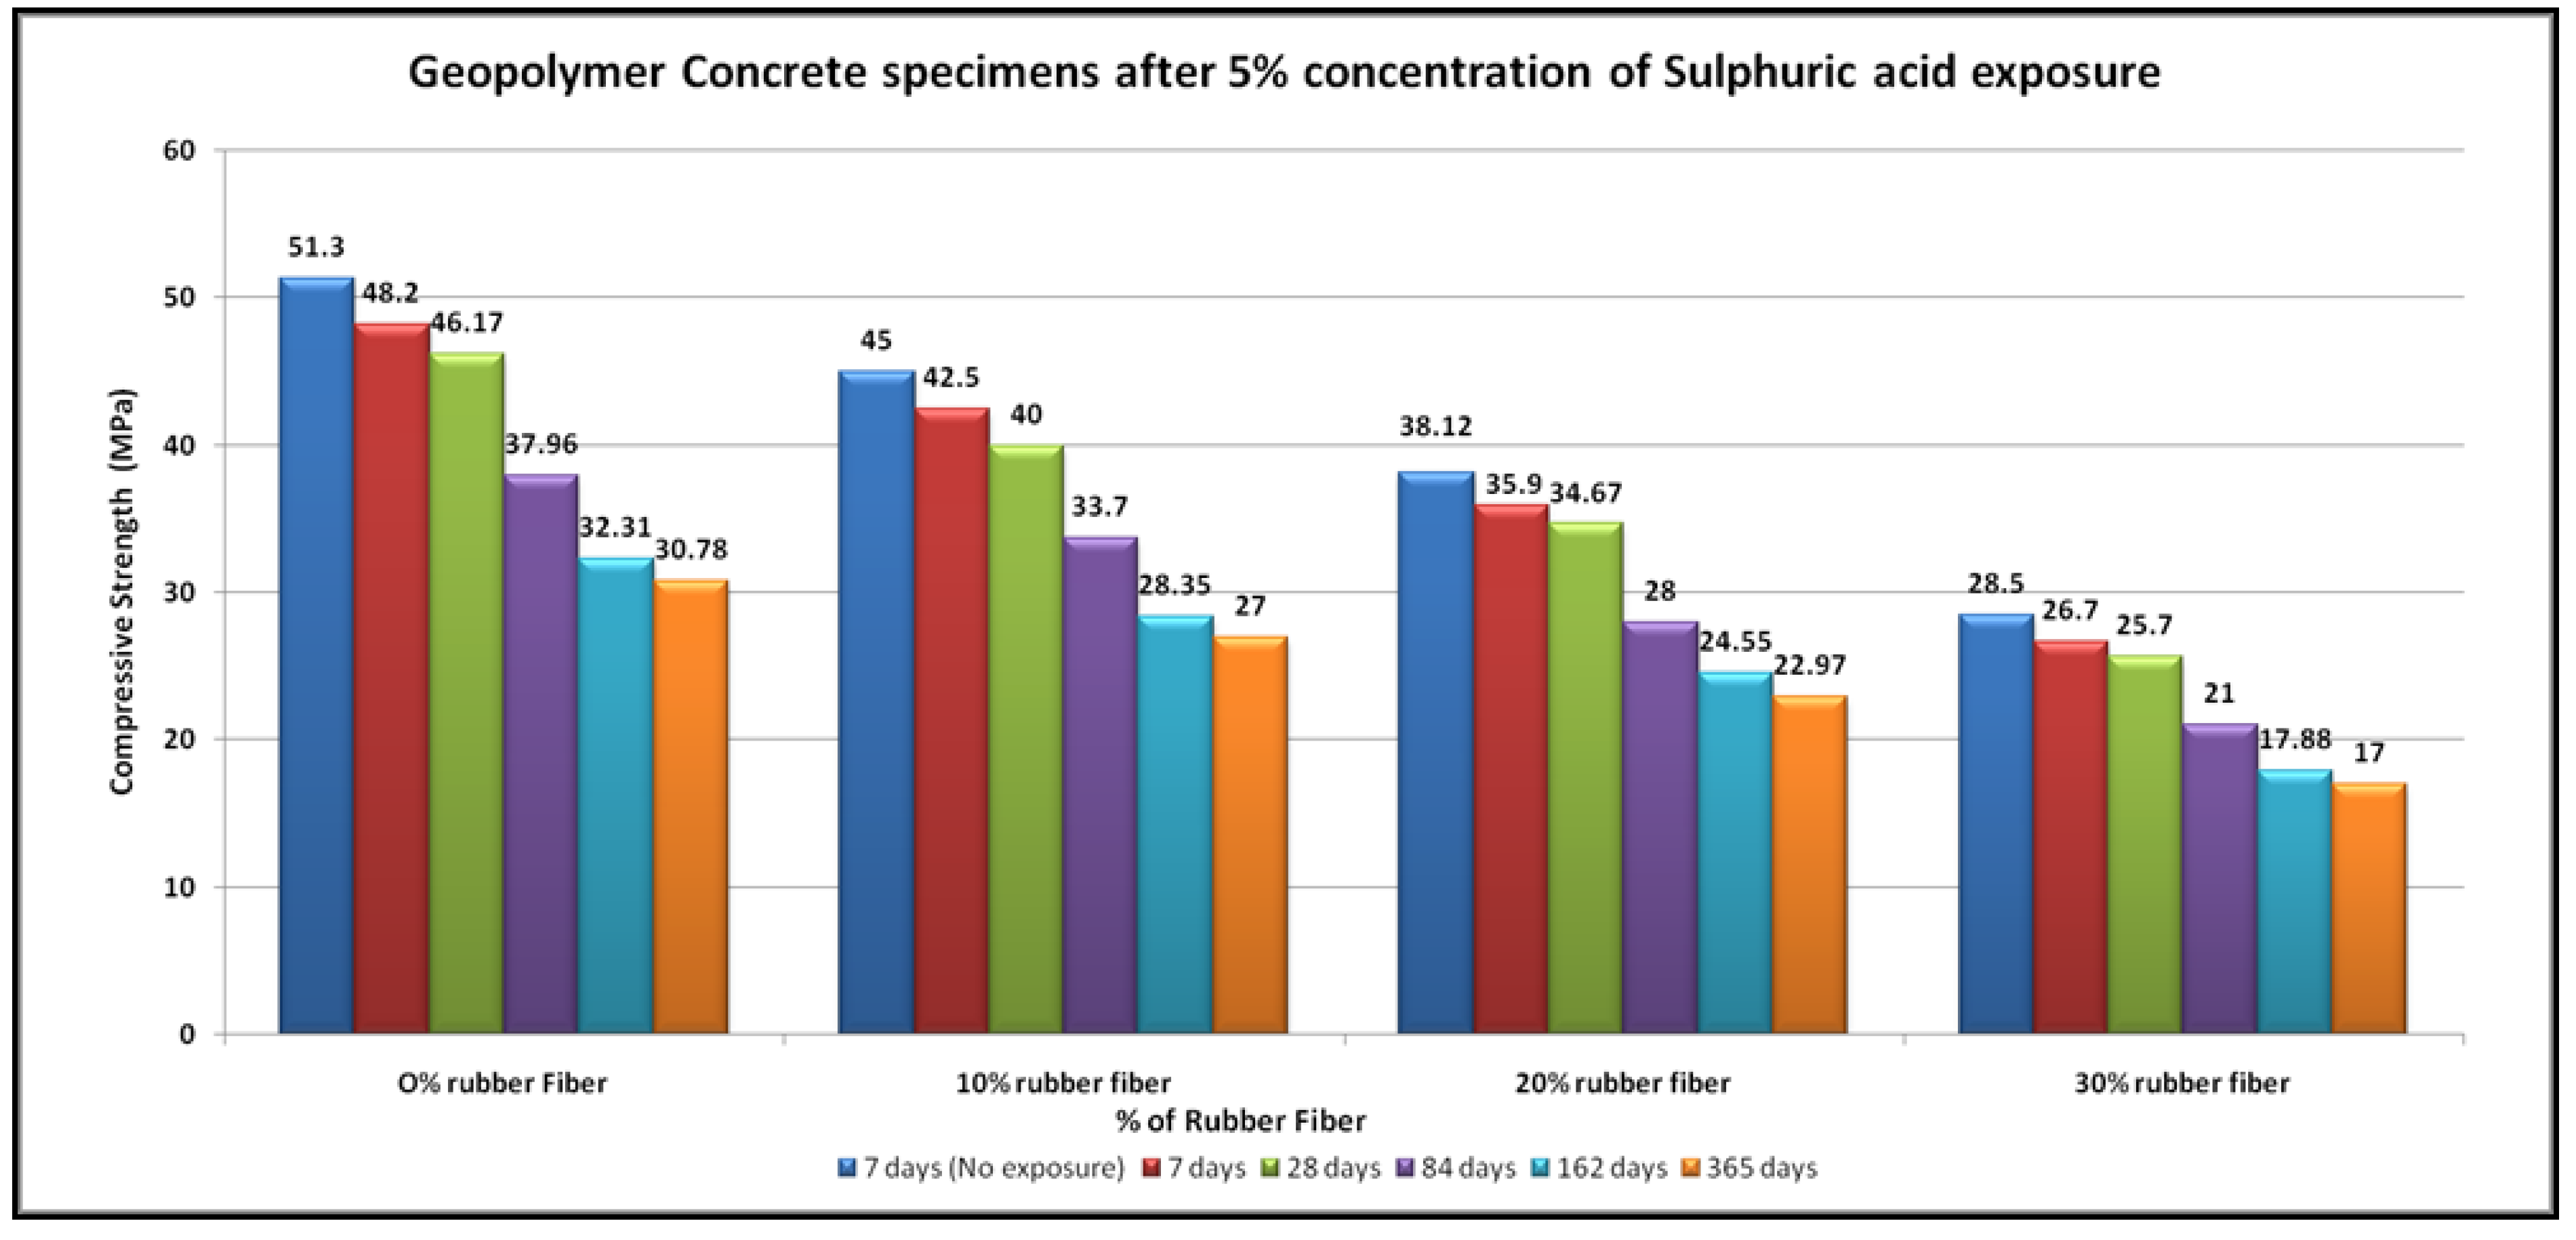
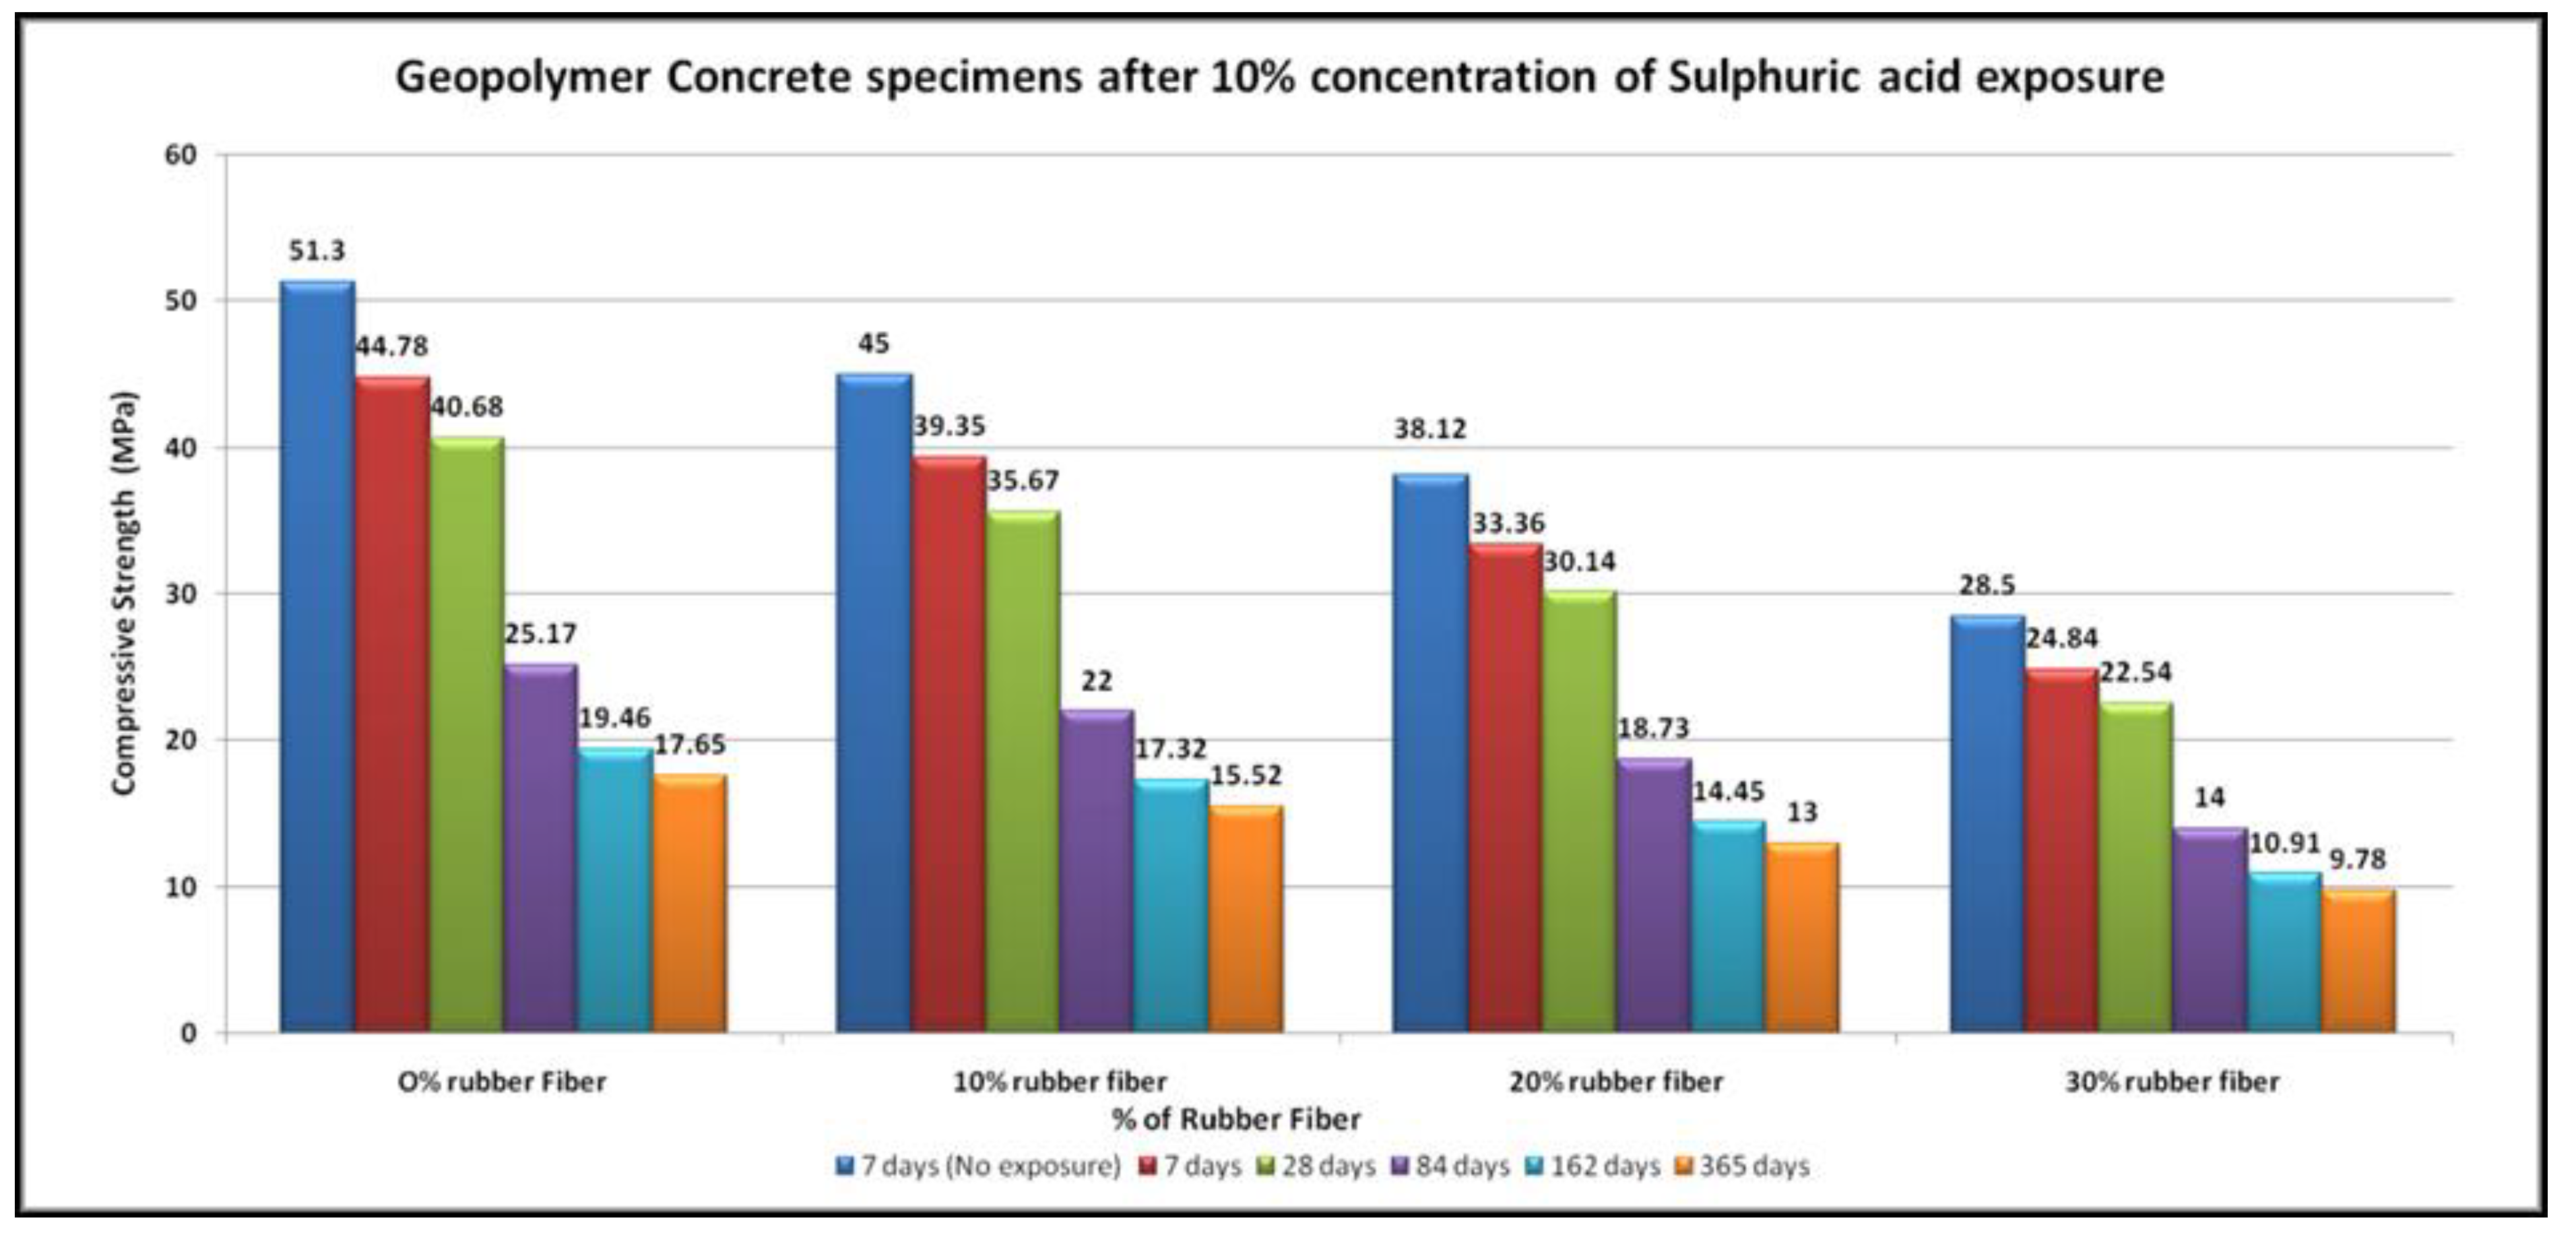
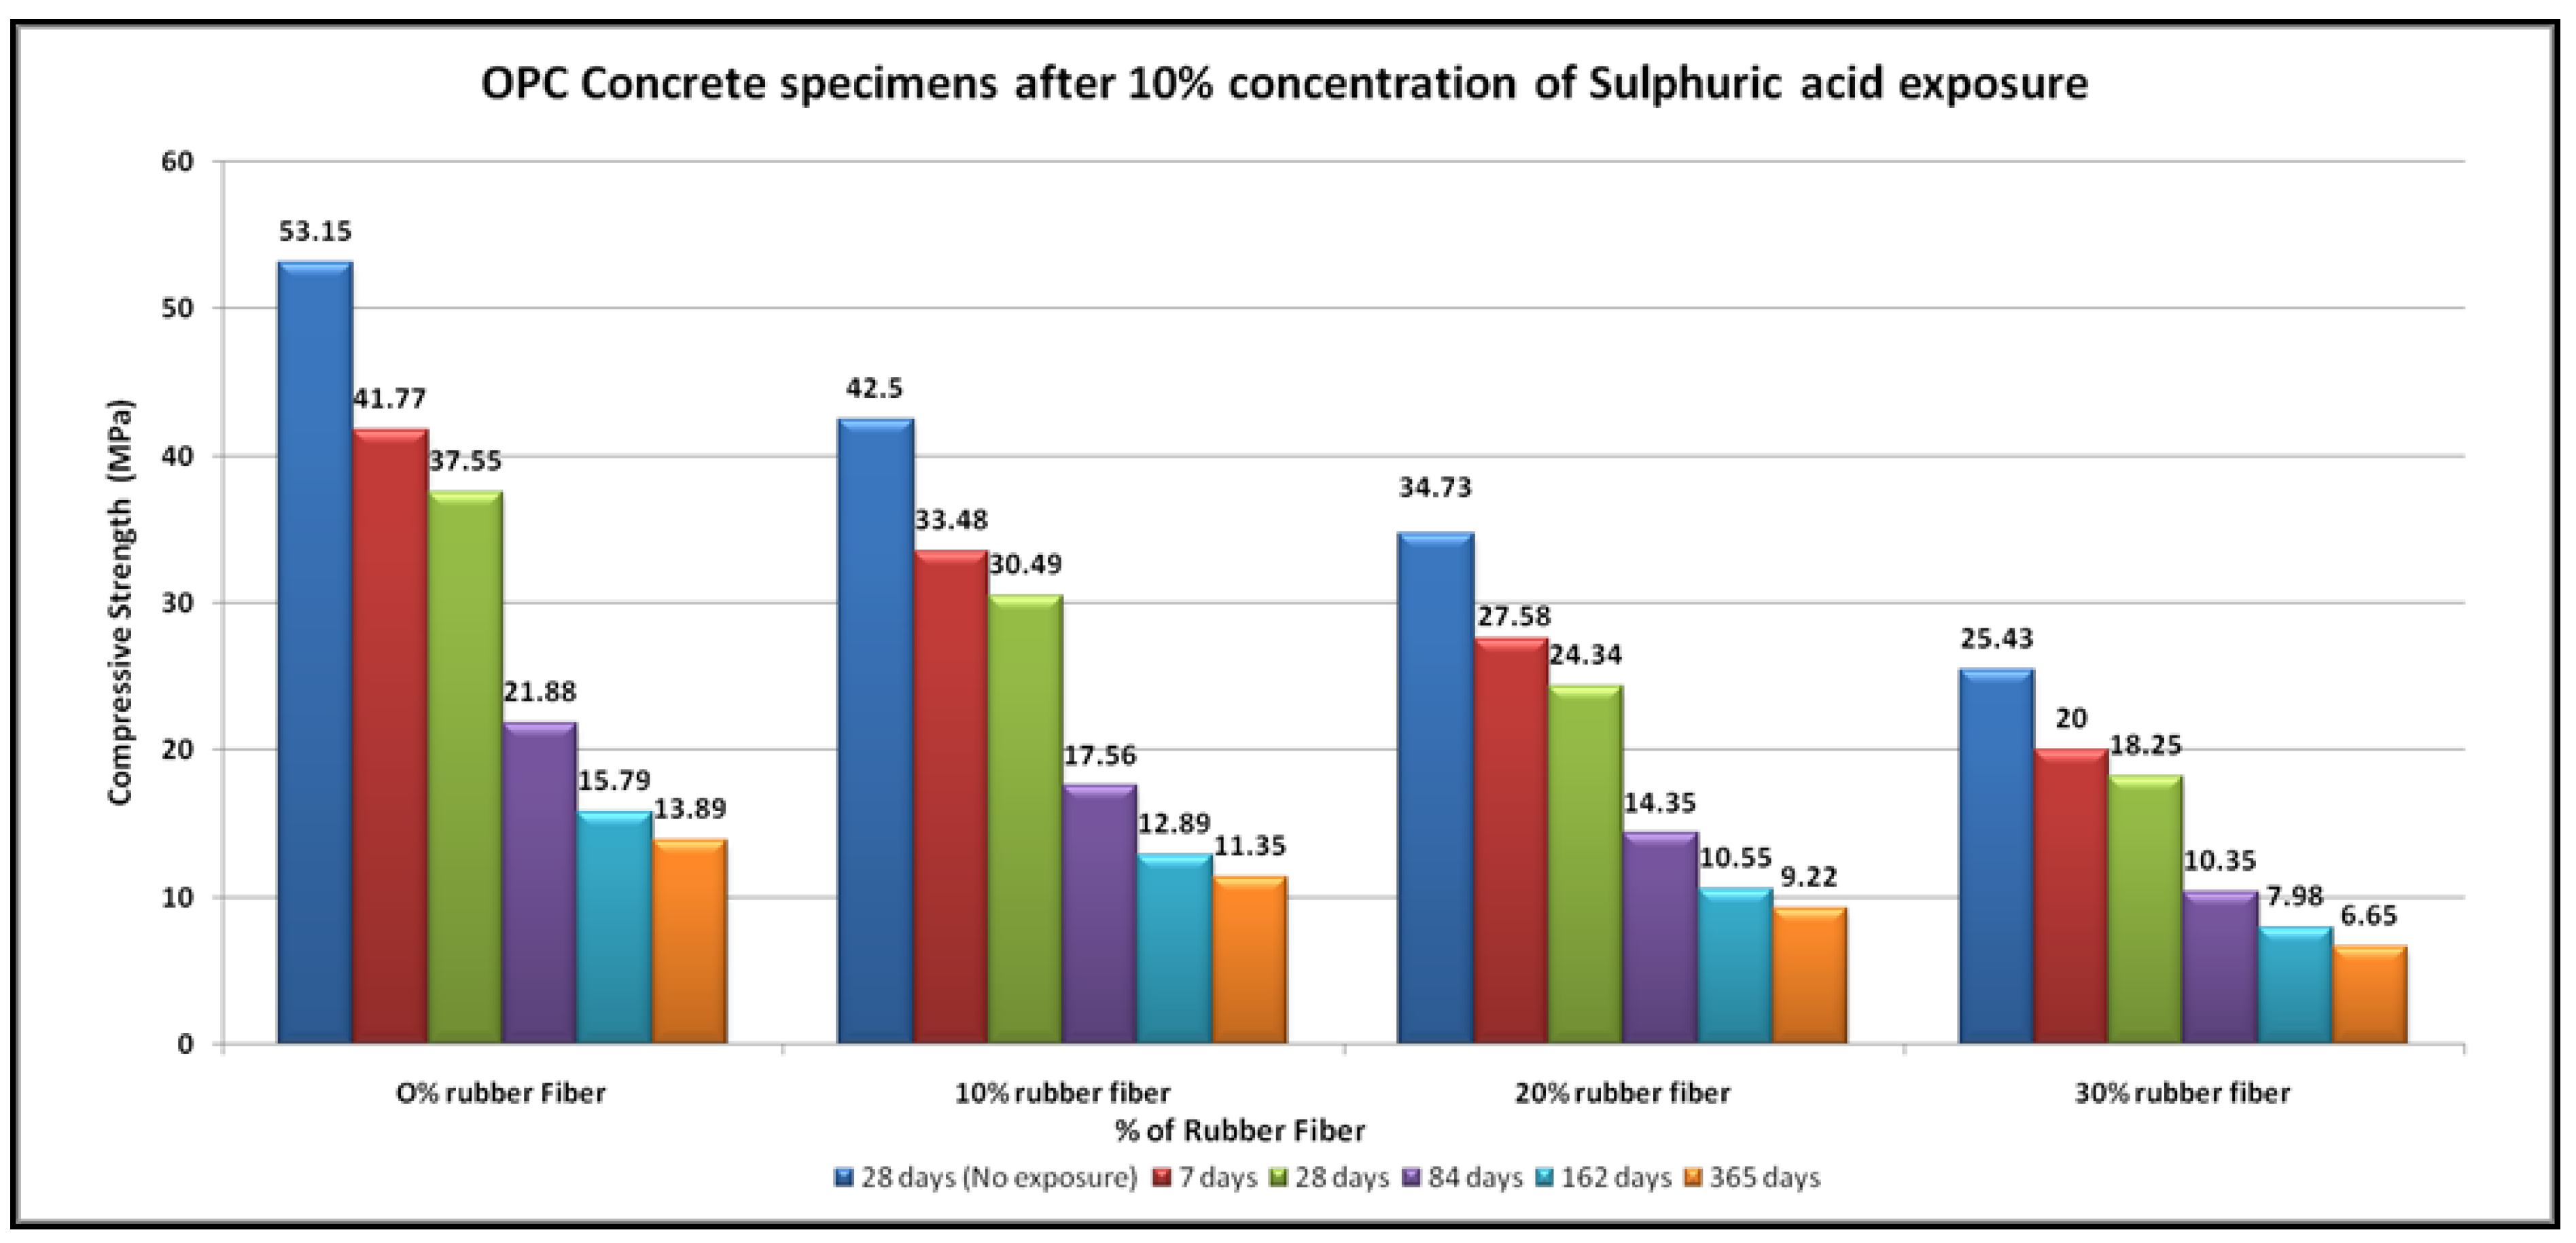
4.4. Acid Resistance
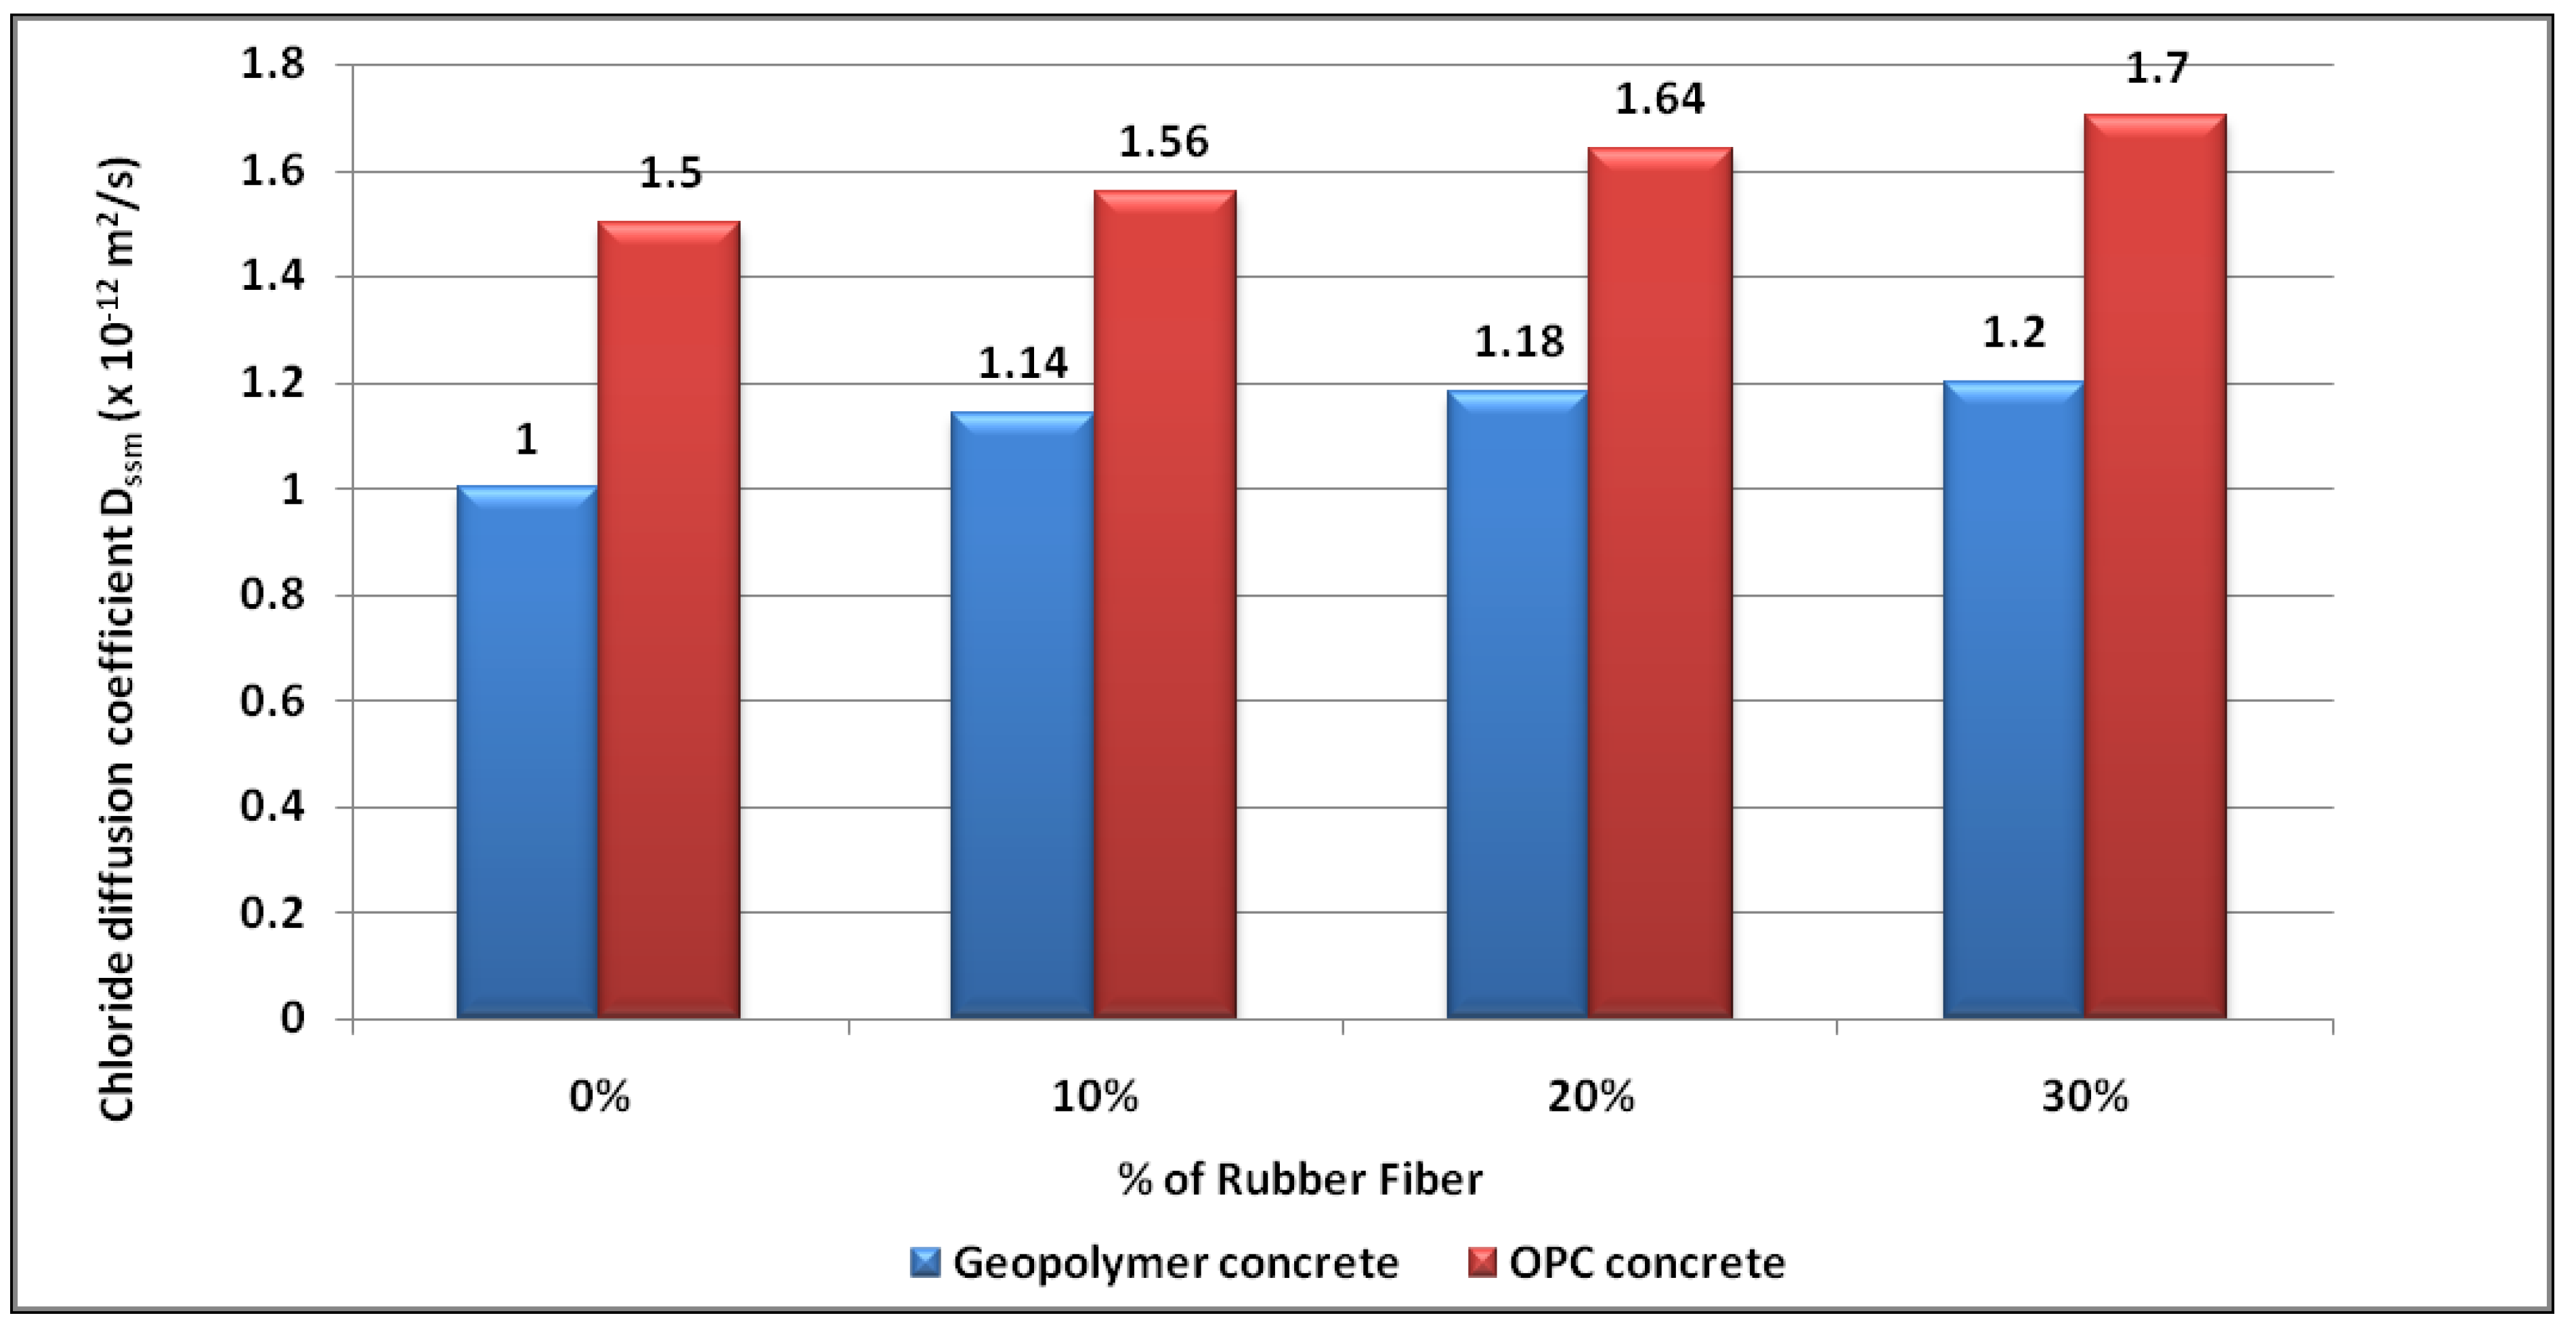
4.5. Chloride Diffusion
4.6. Corrosion Resistance
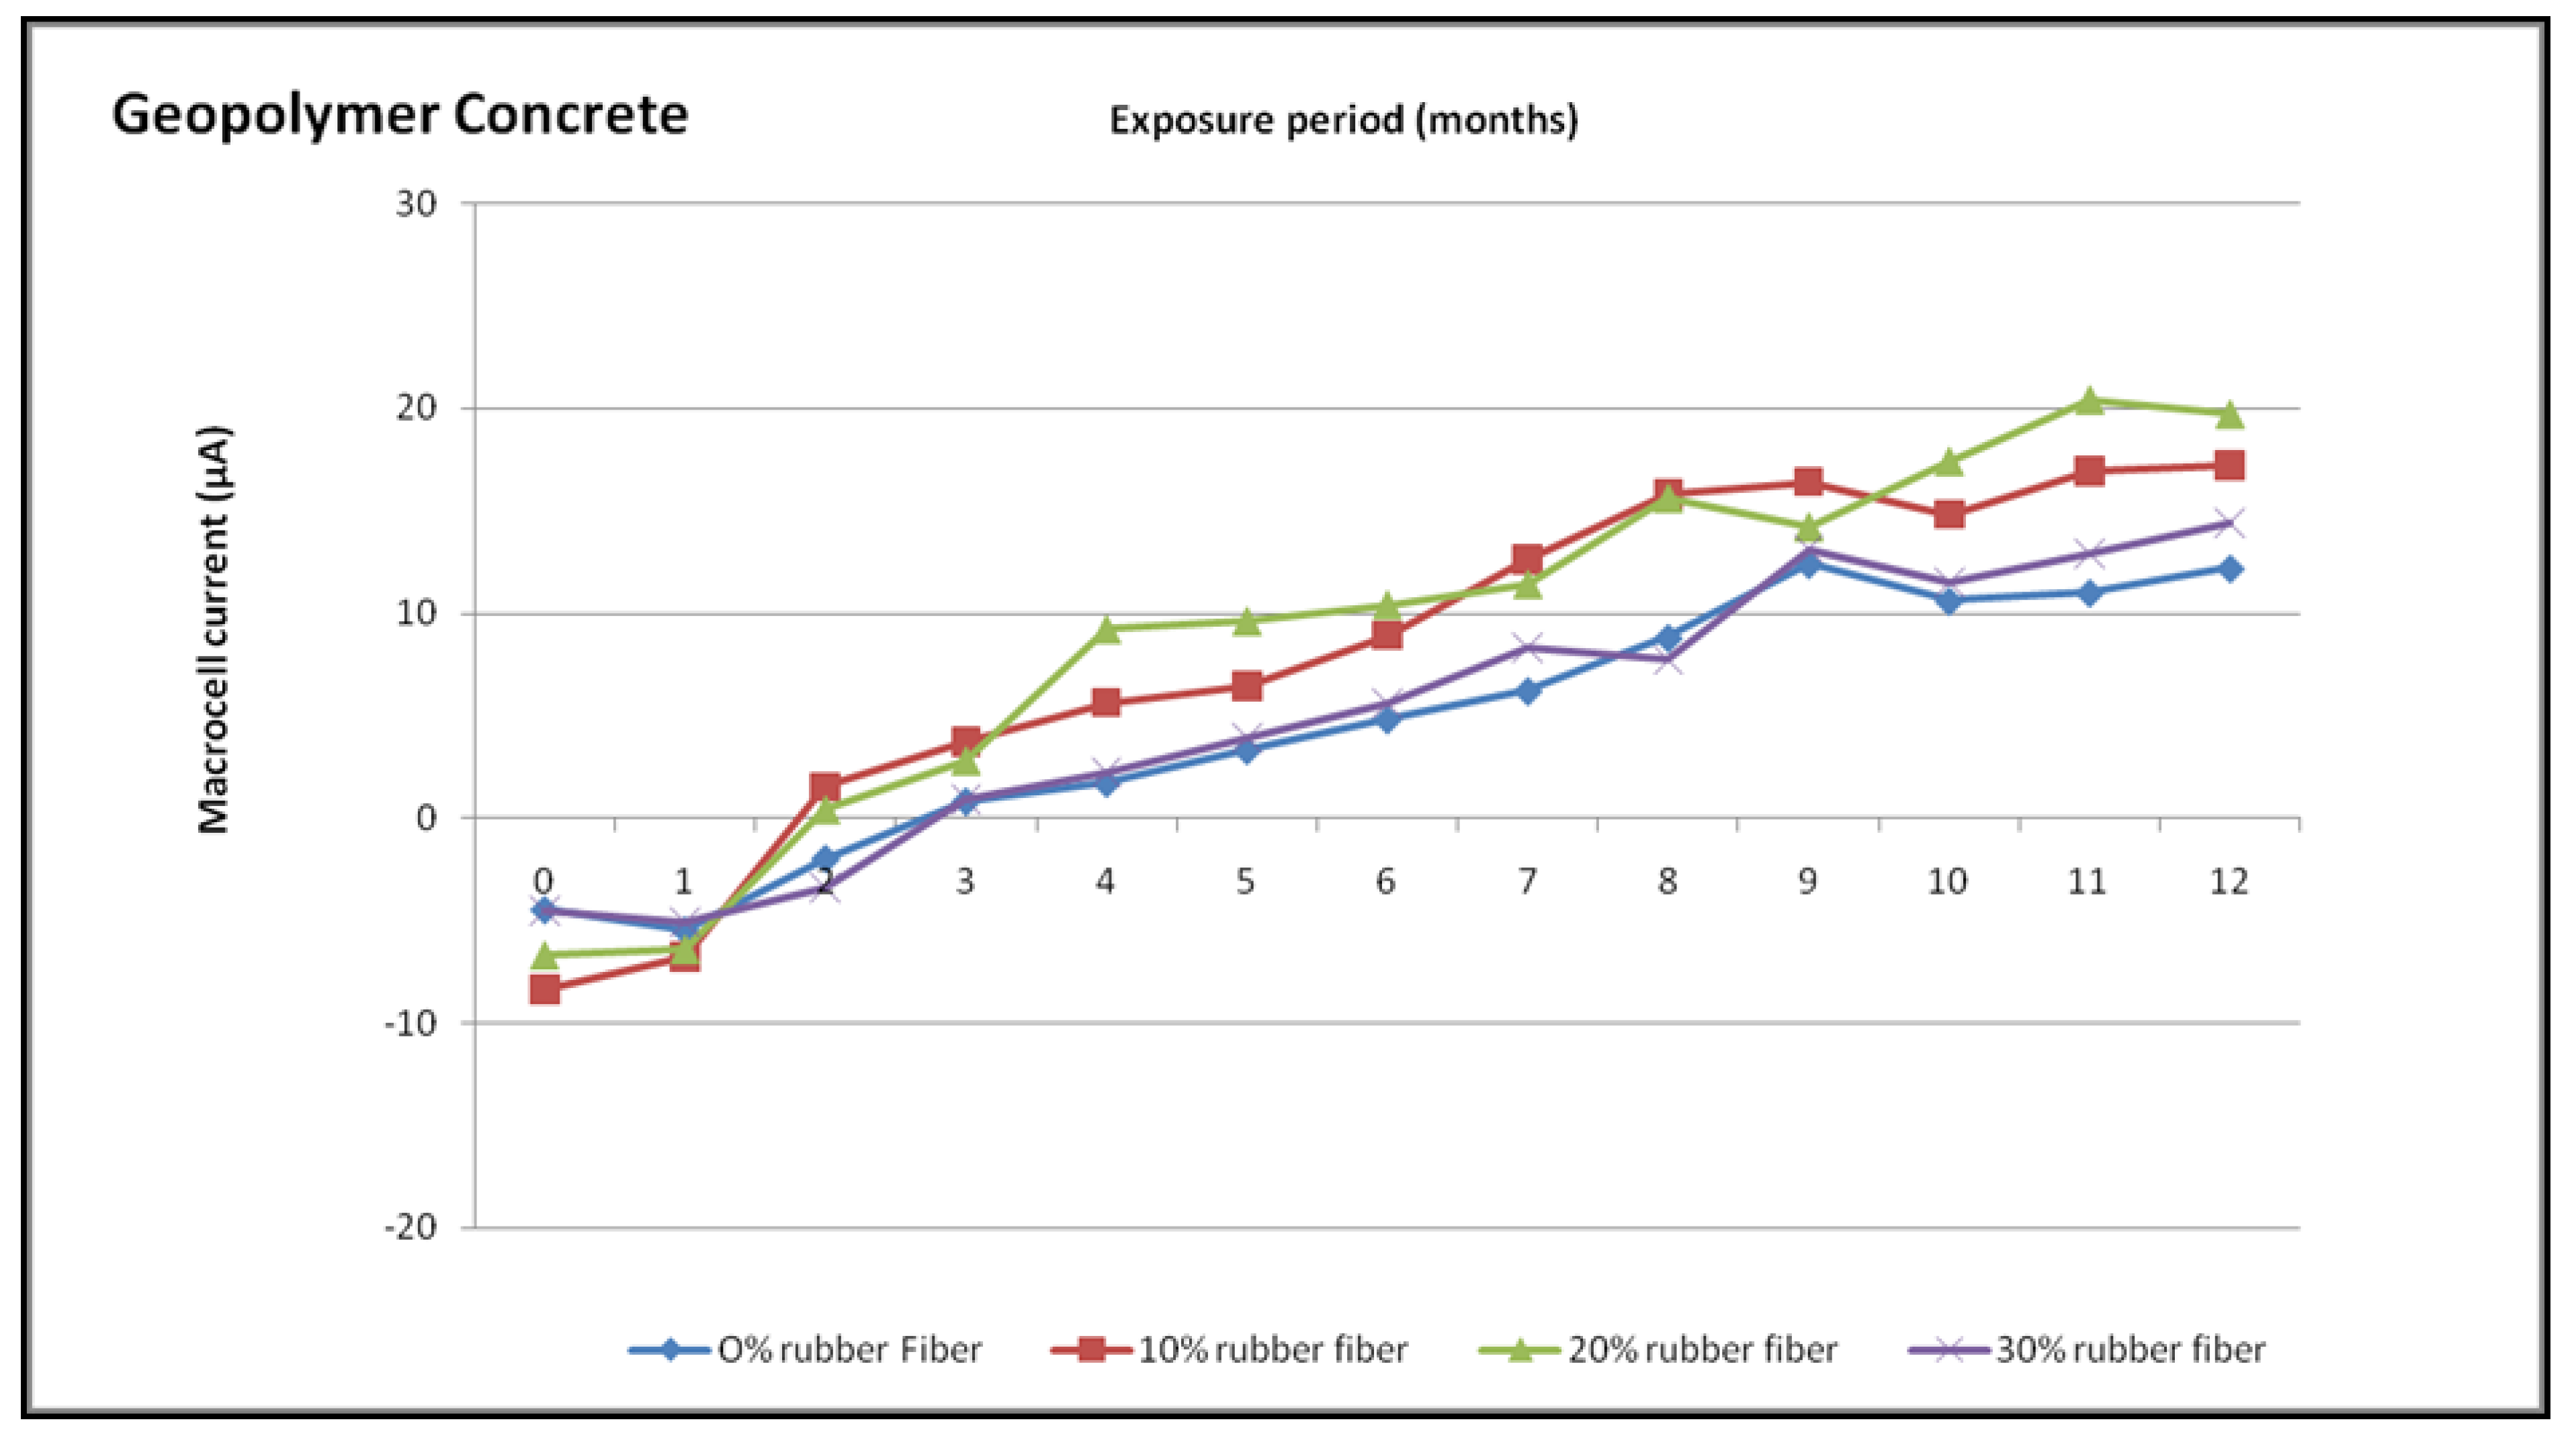
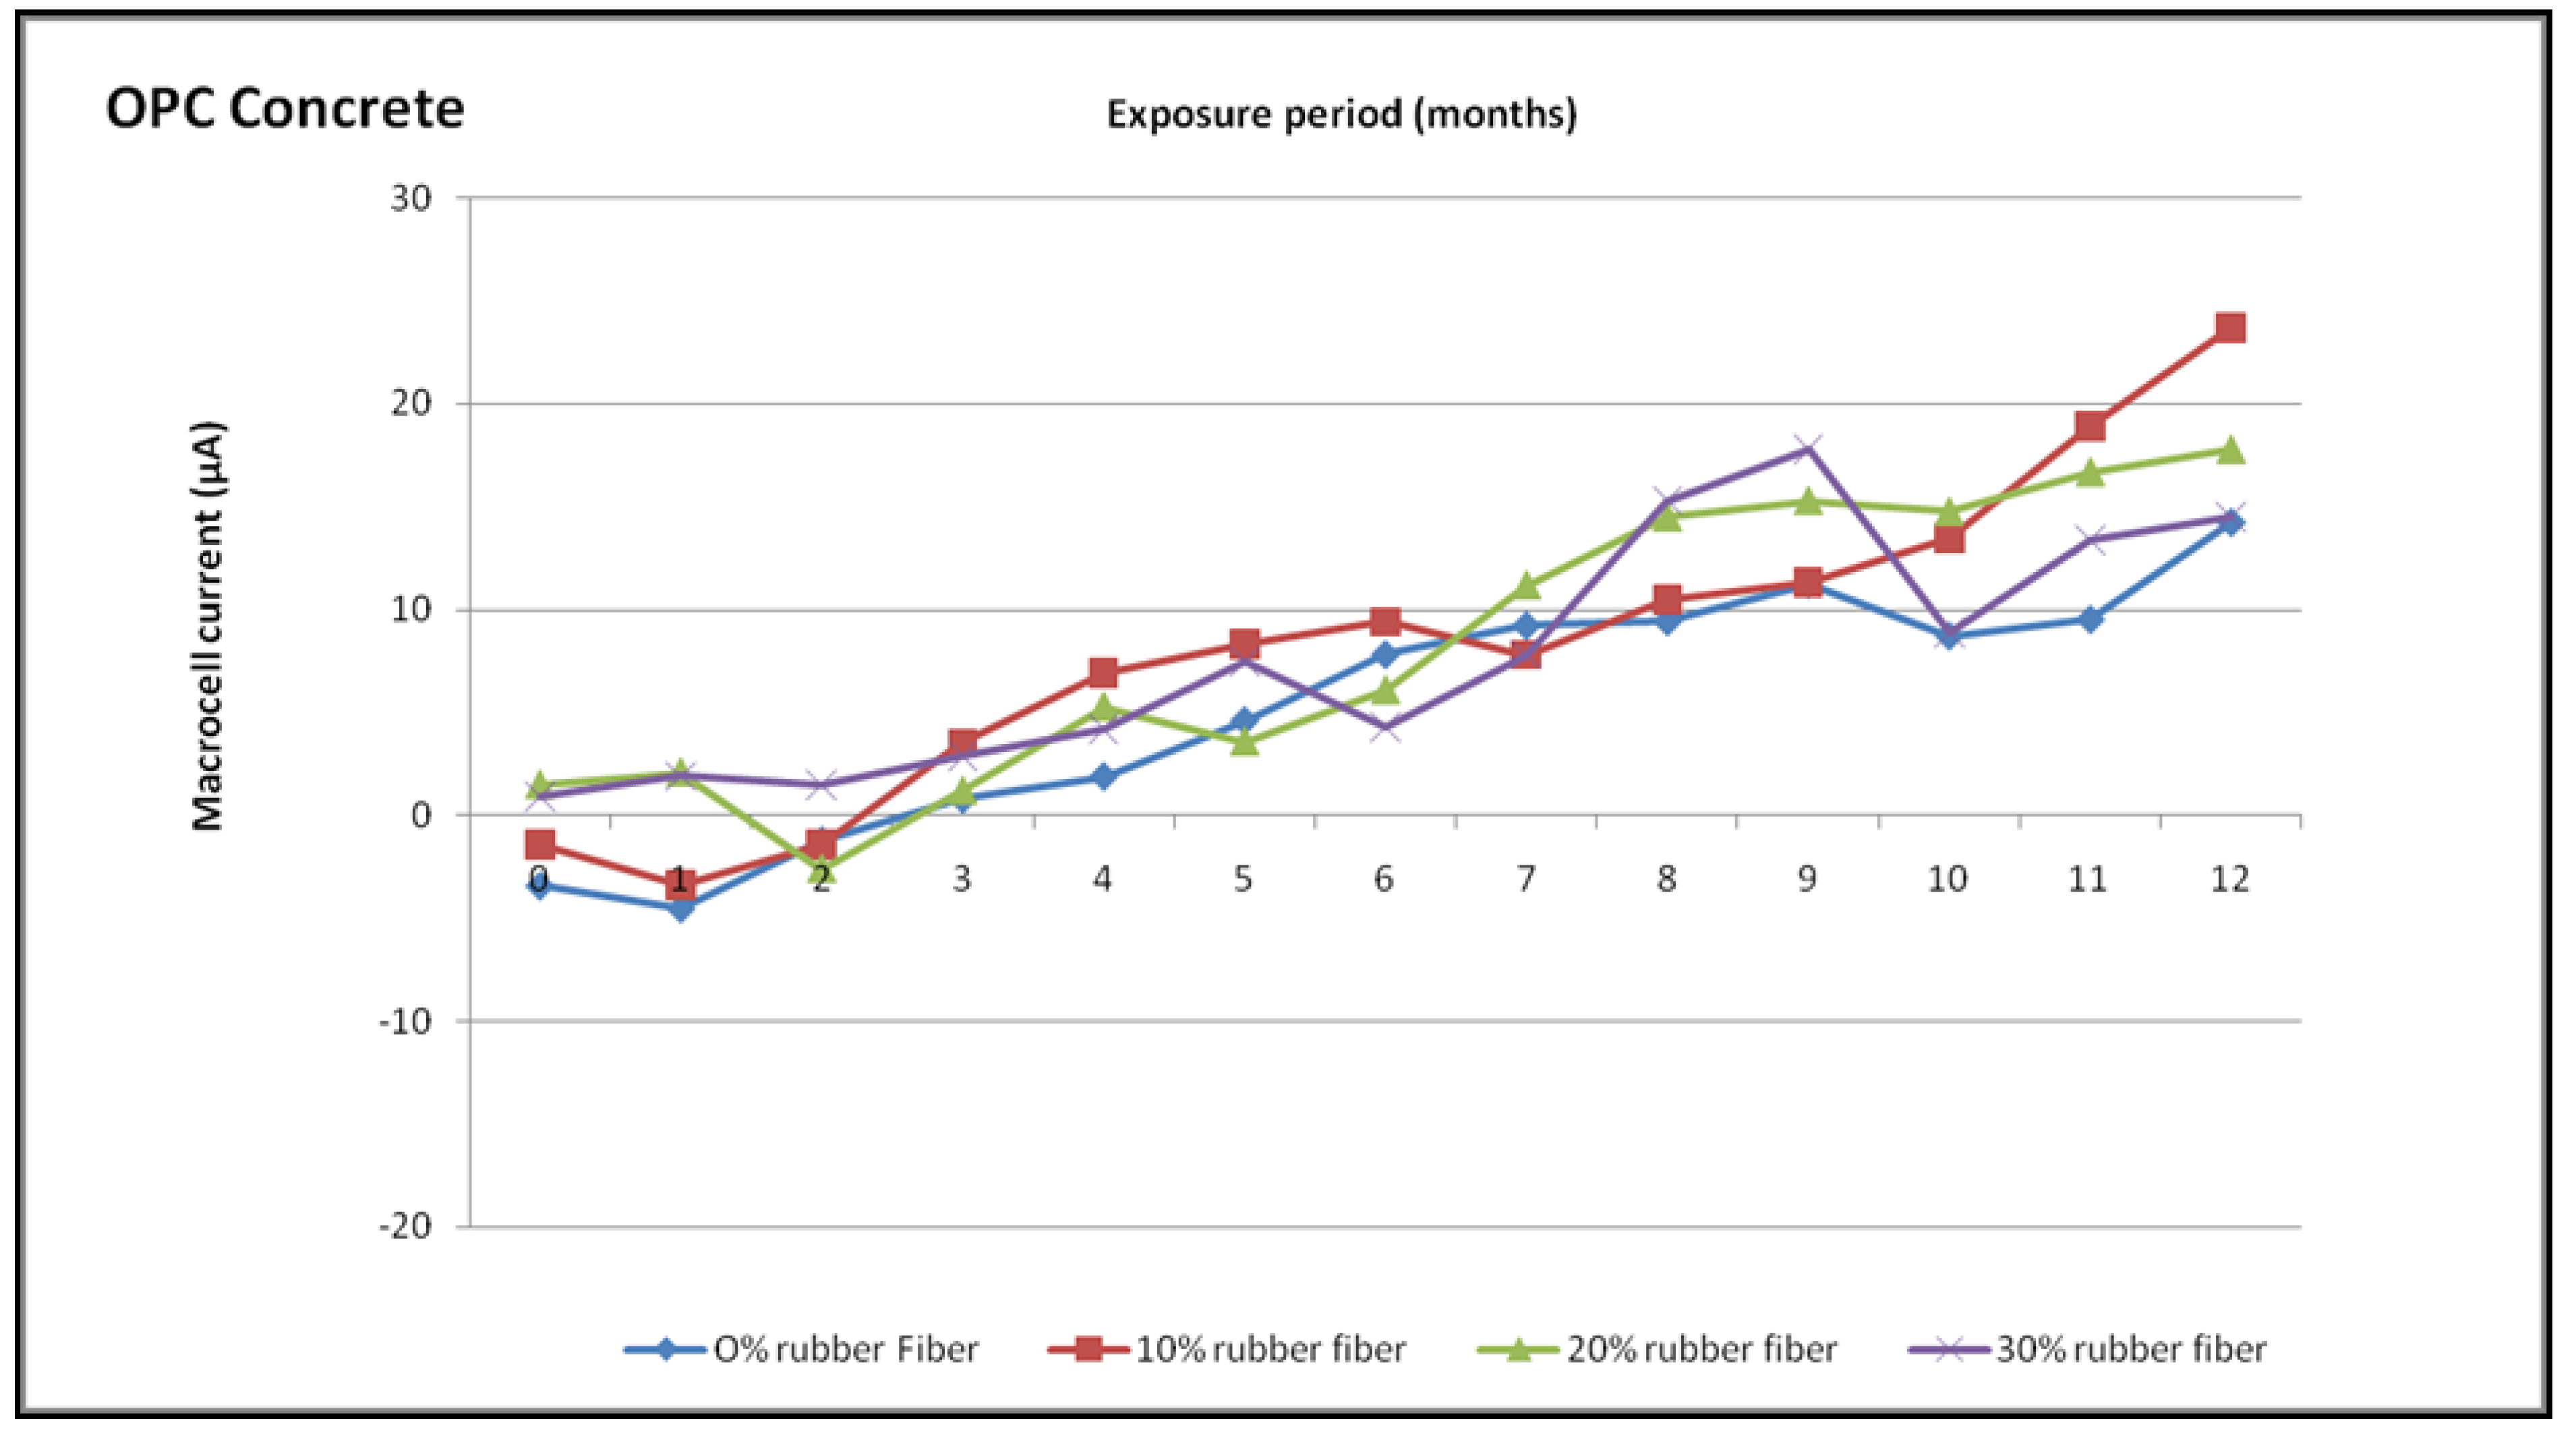
4.6.1. Macrocell Current Measurements
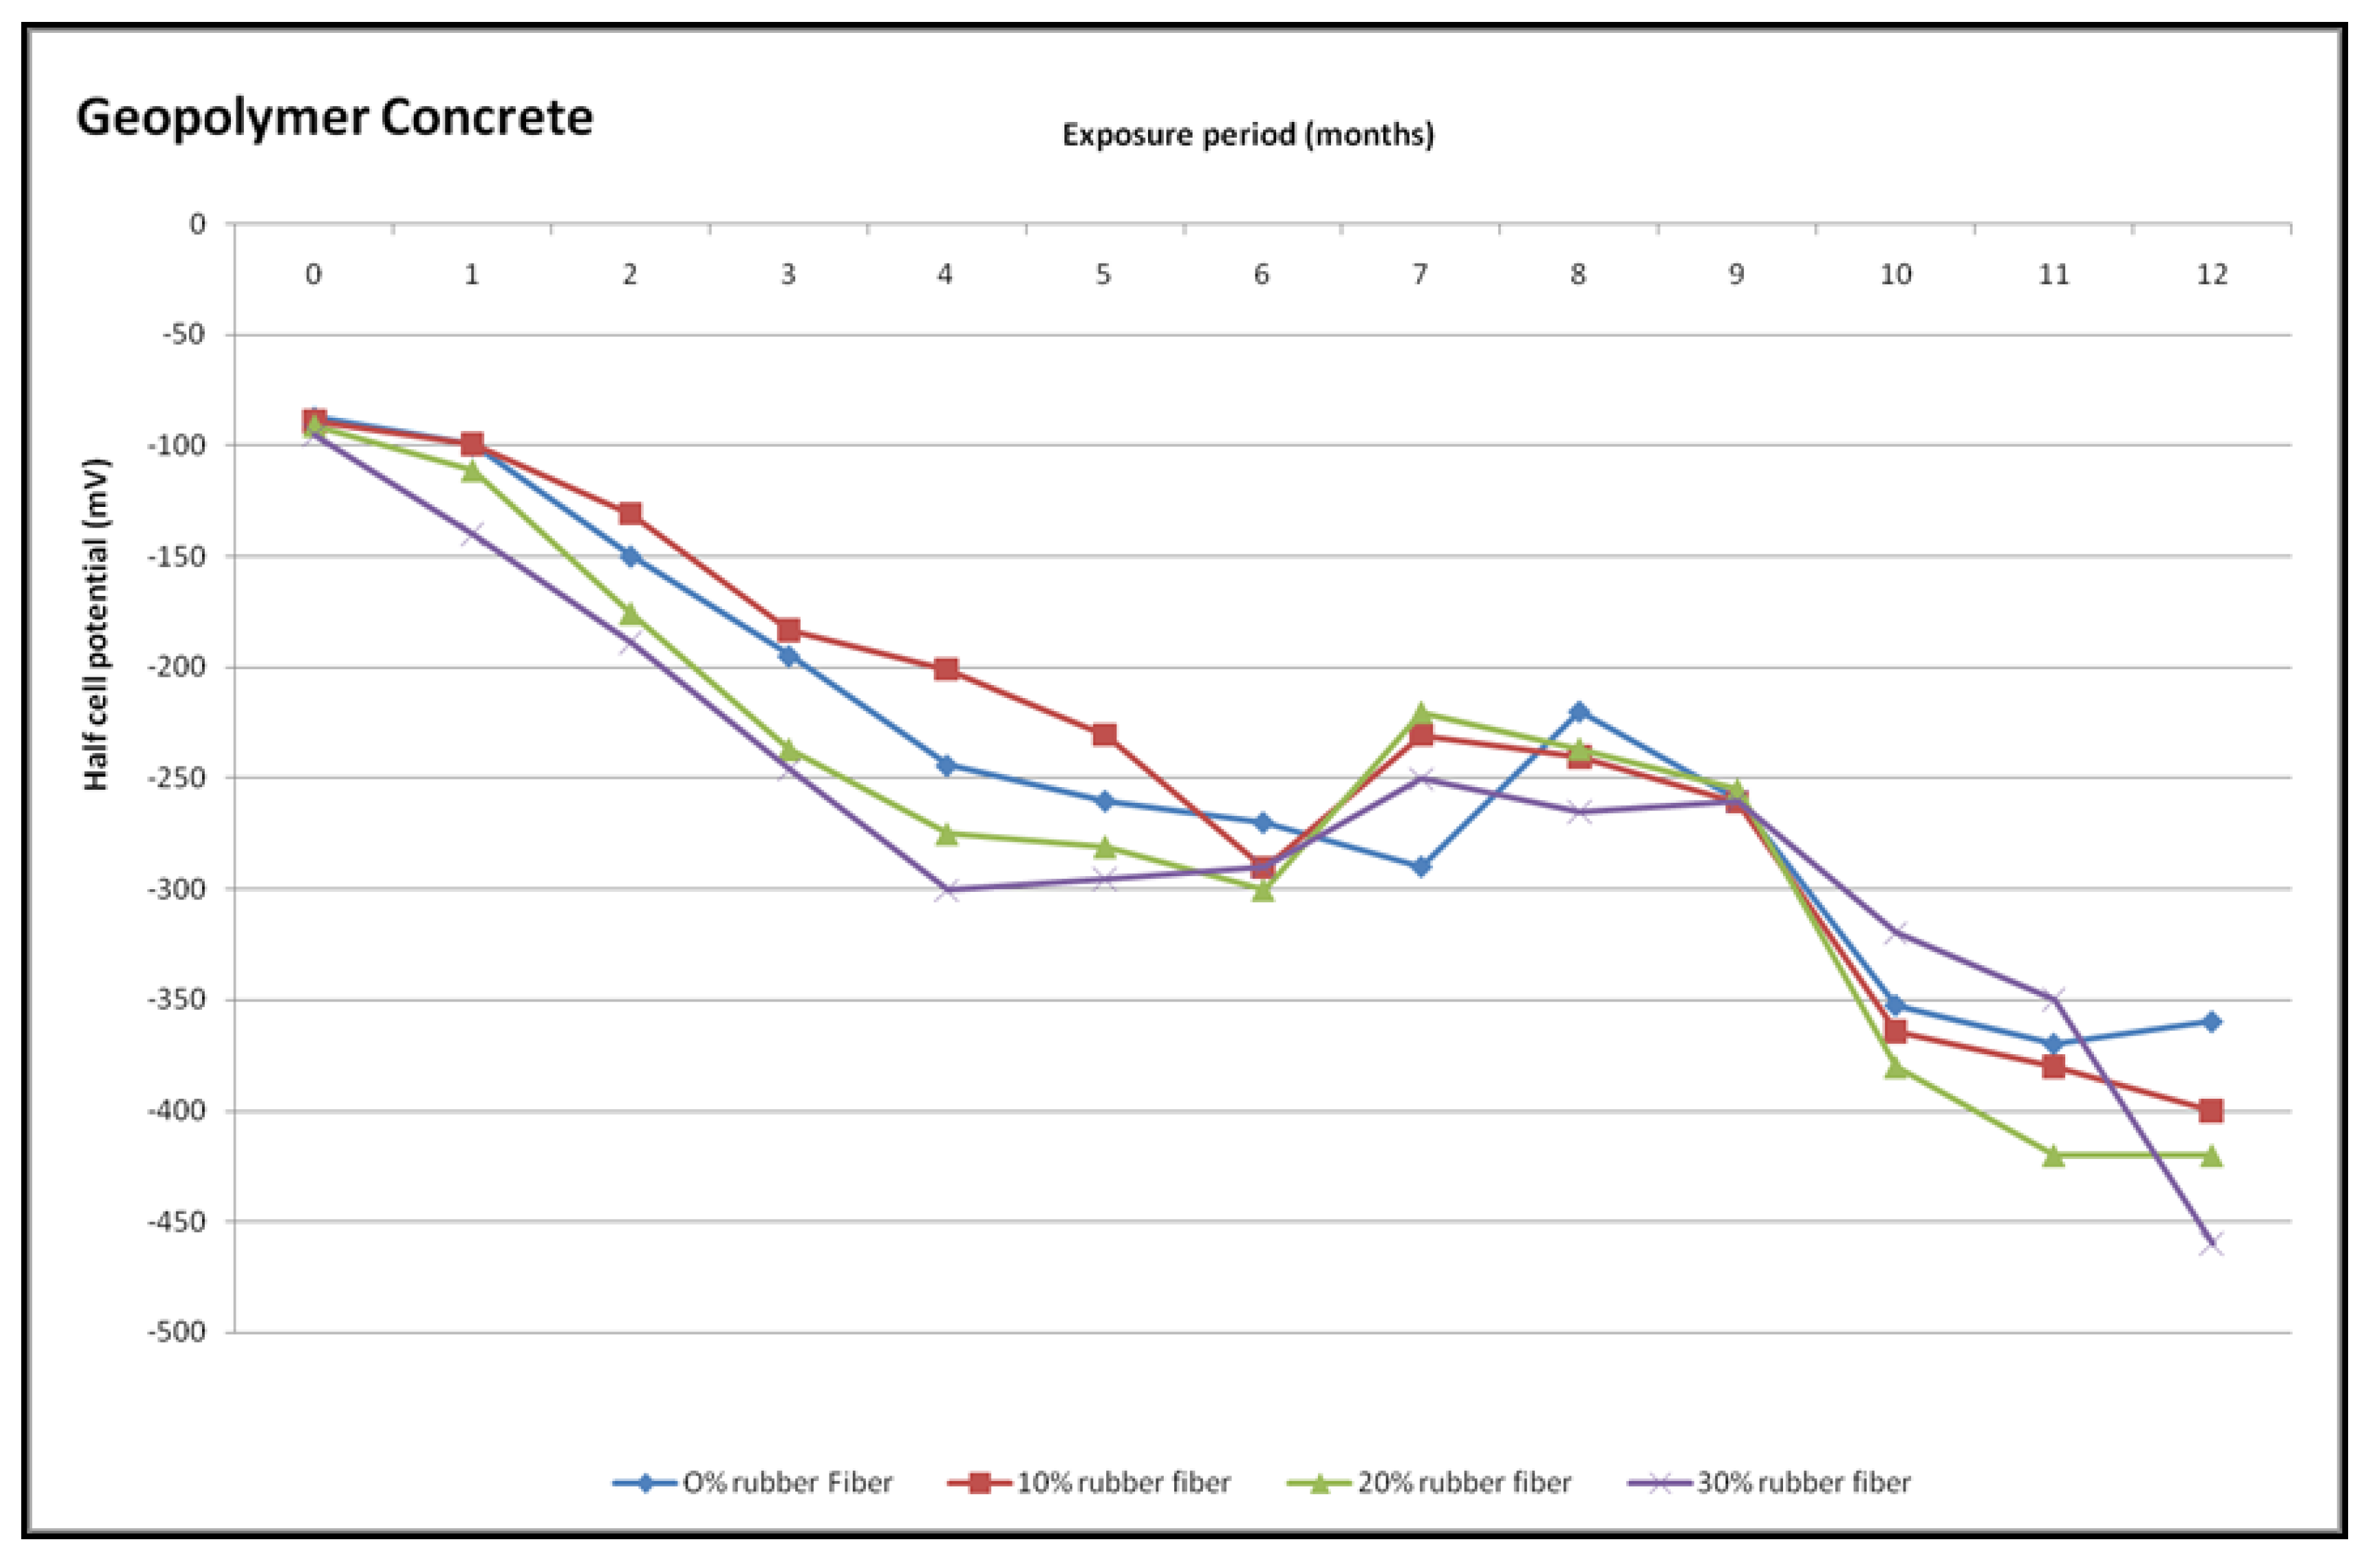
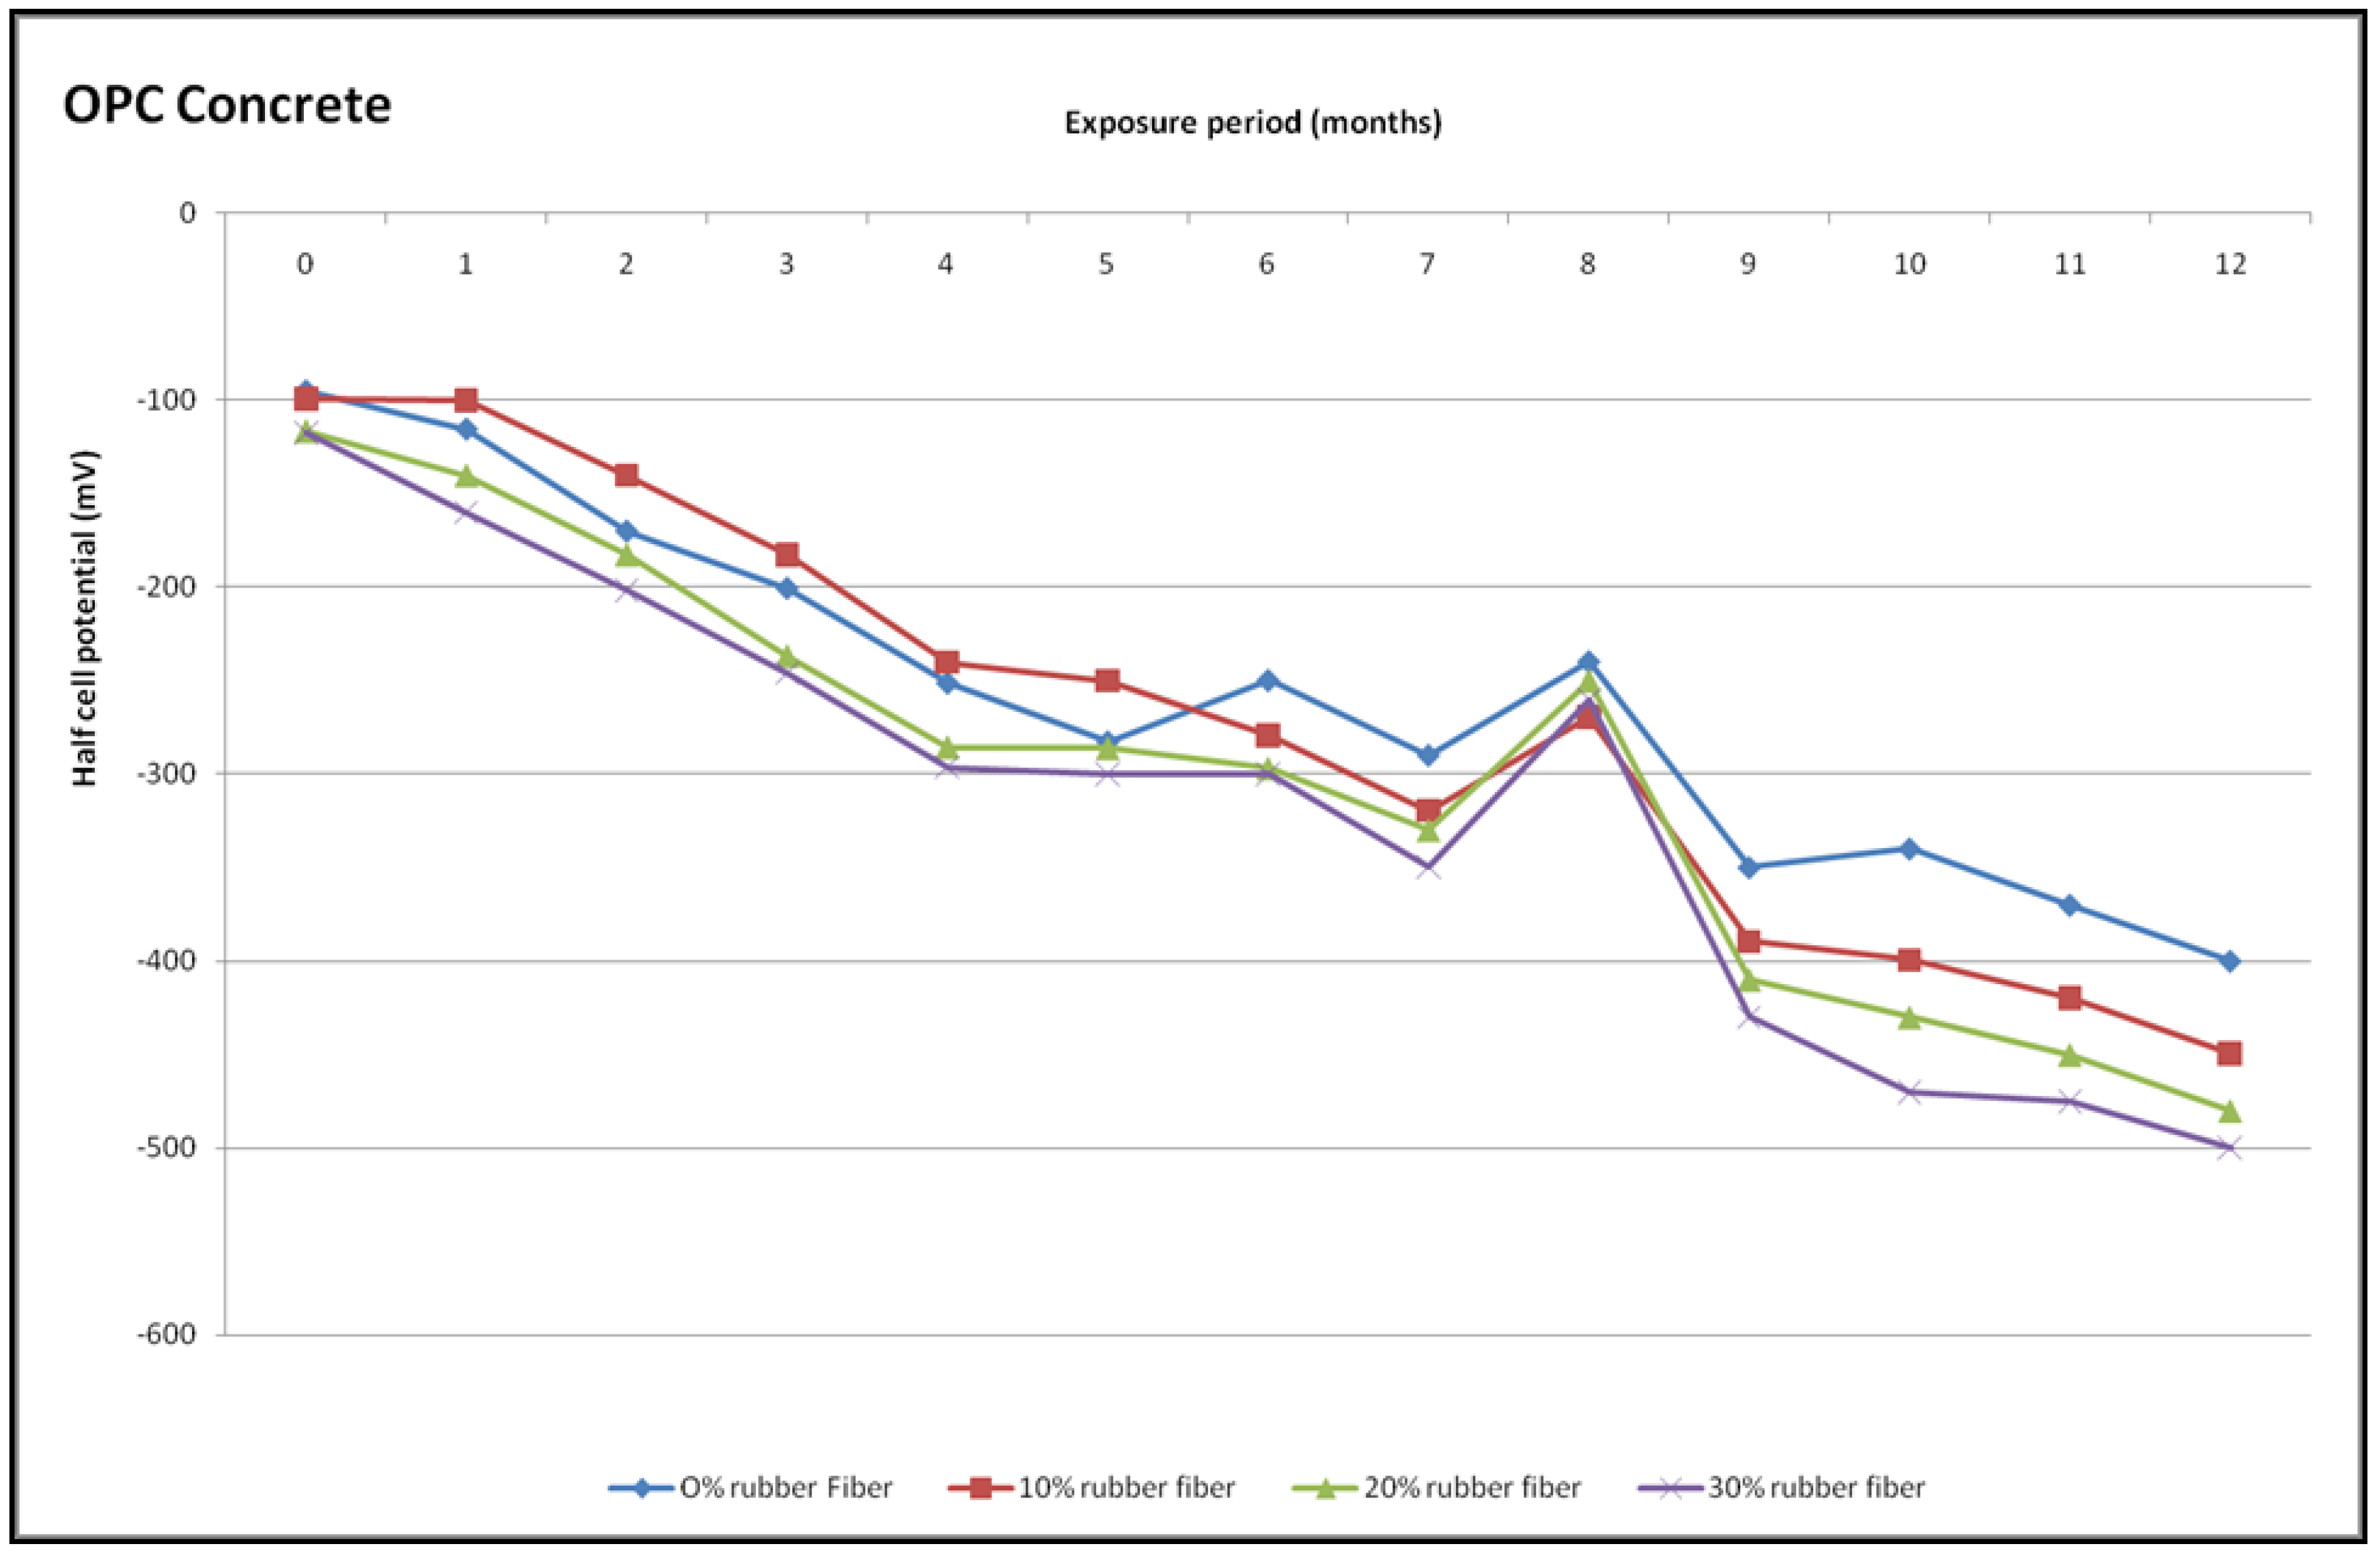
4.6.2. Half-Cell Potential Measurements
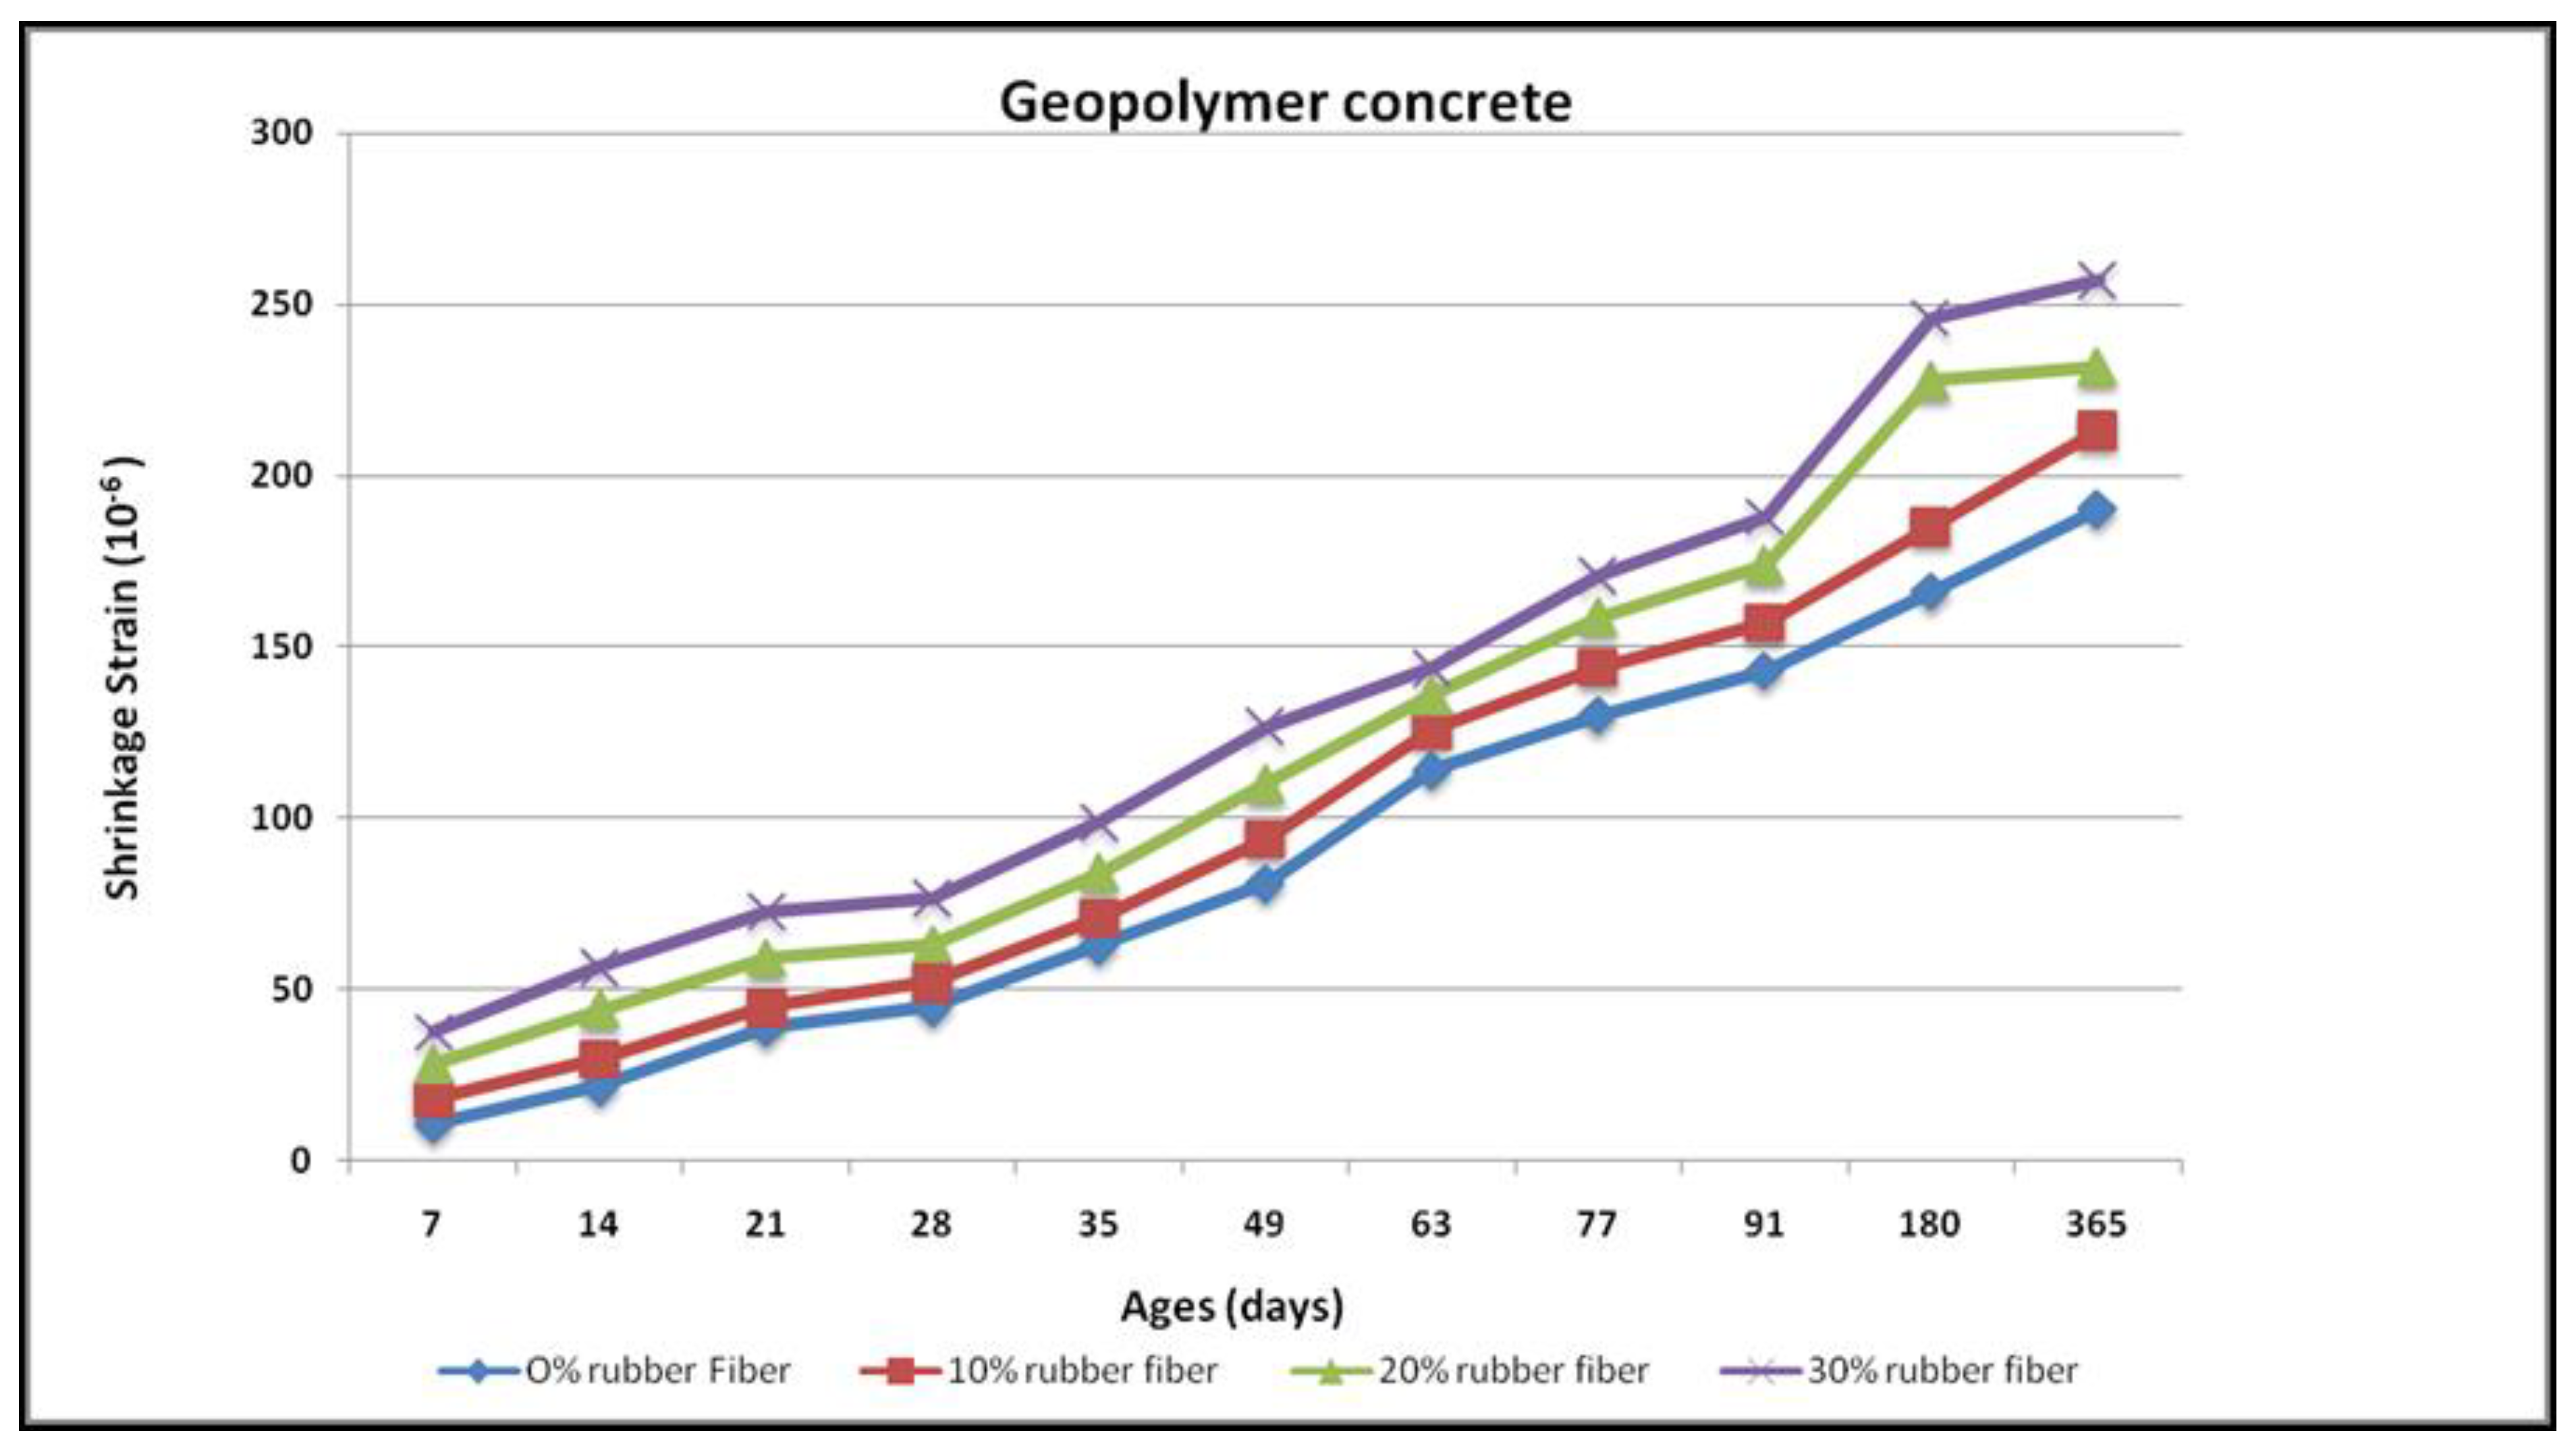
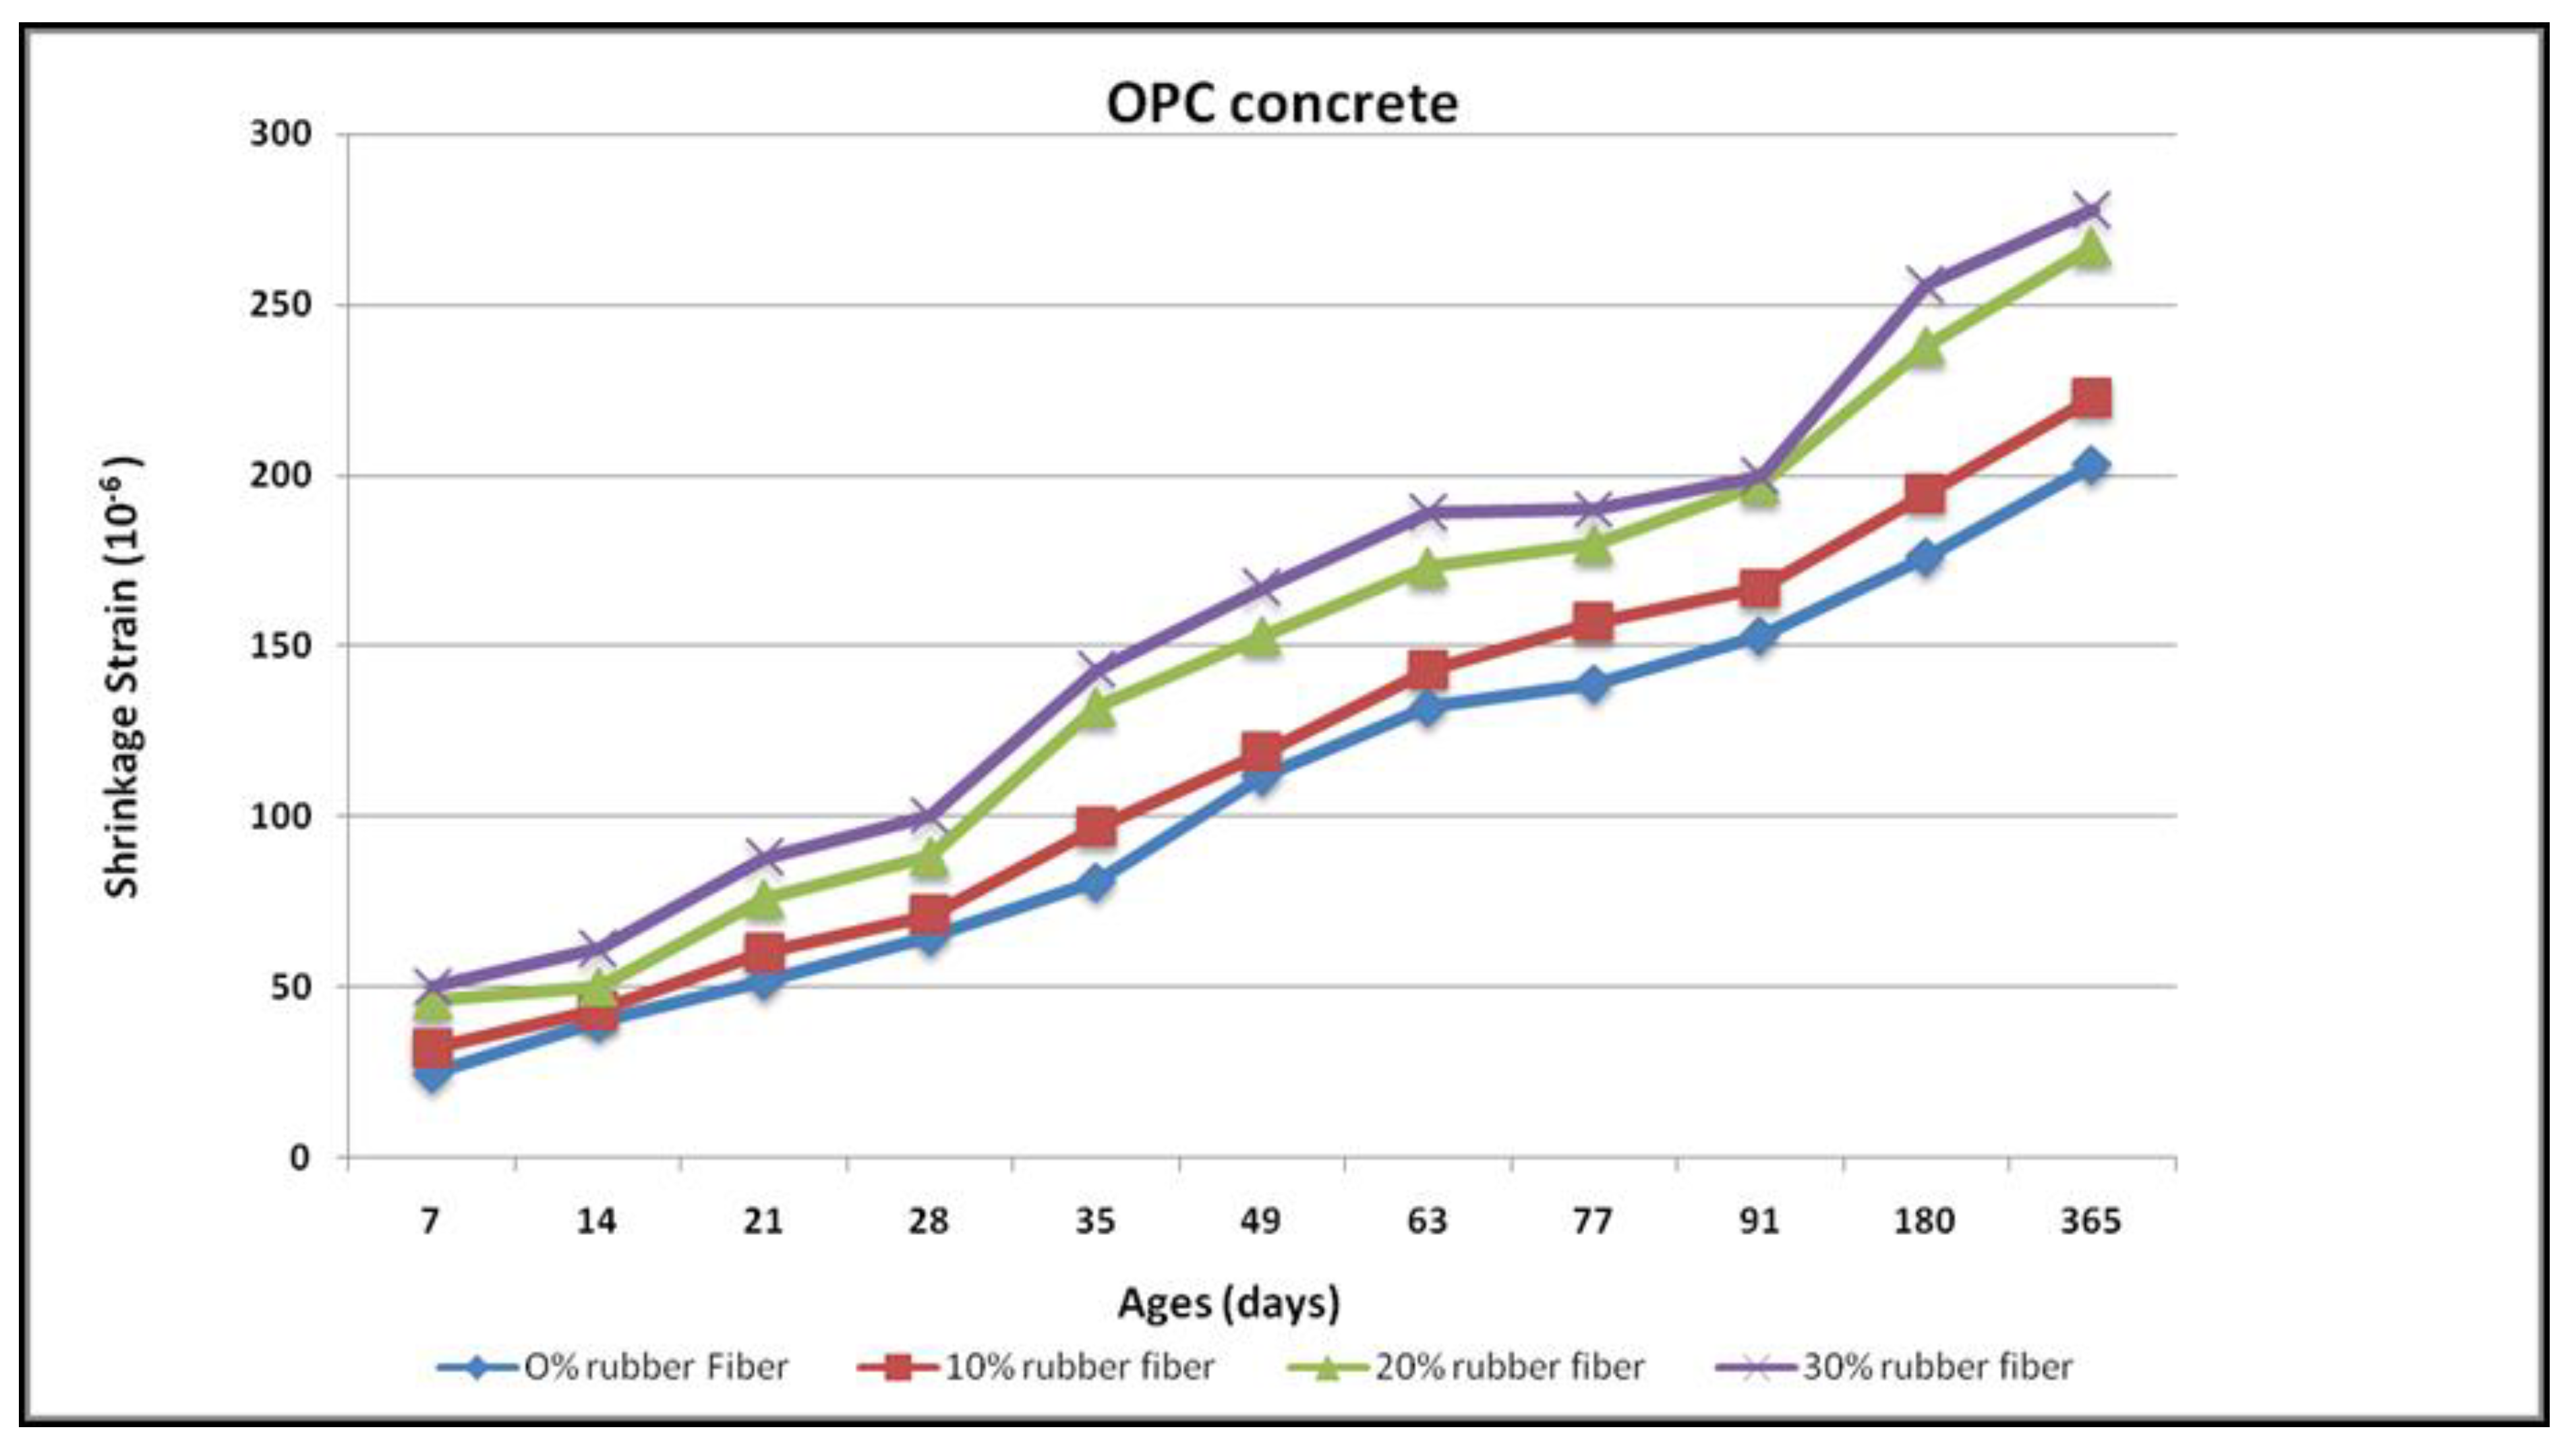
4.7. Drying Shrinkage
4.8. Carbonation Resistance
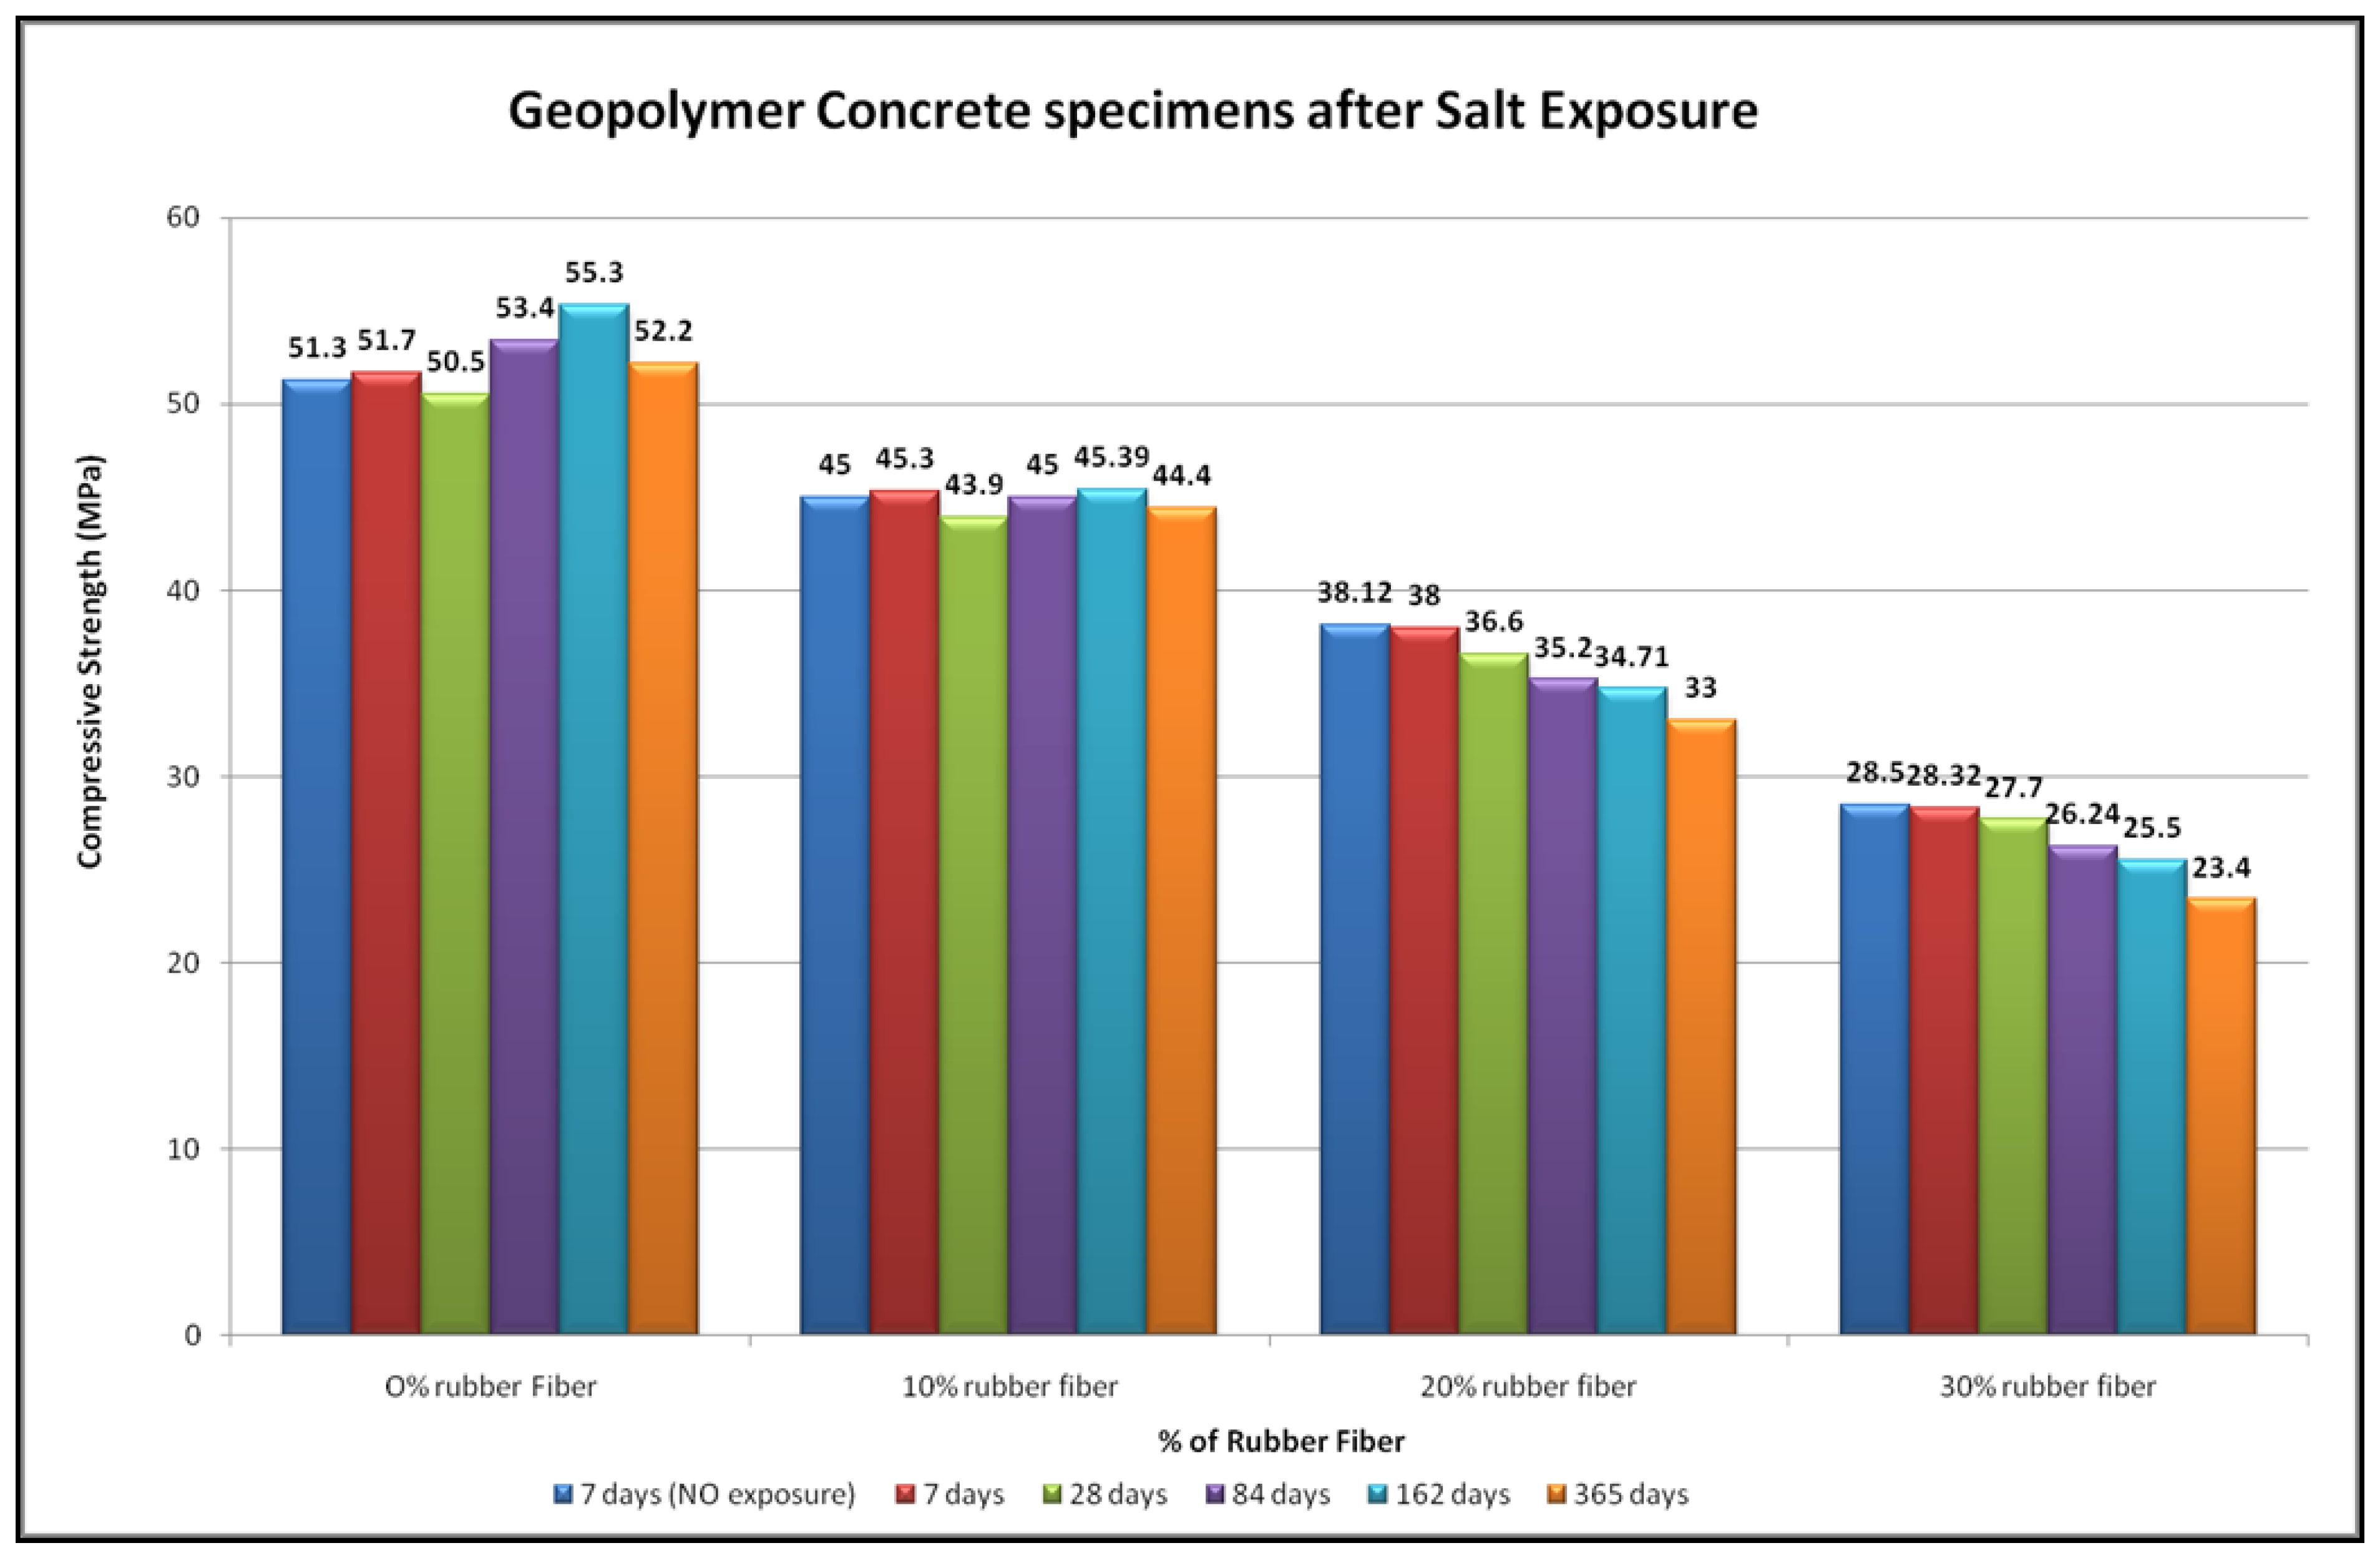
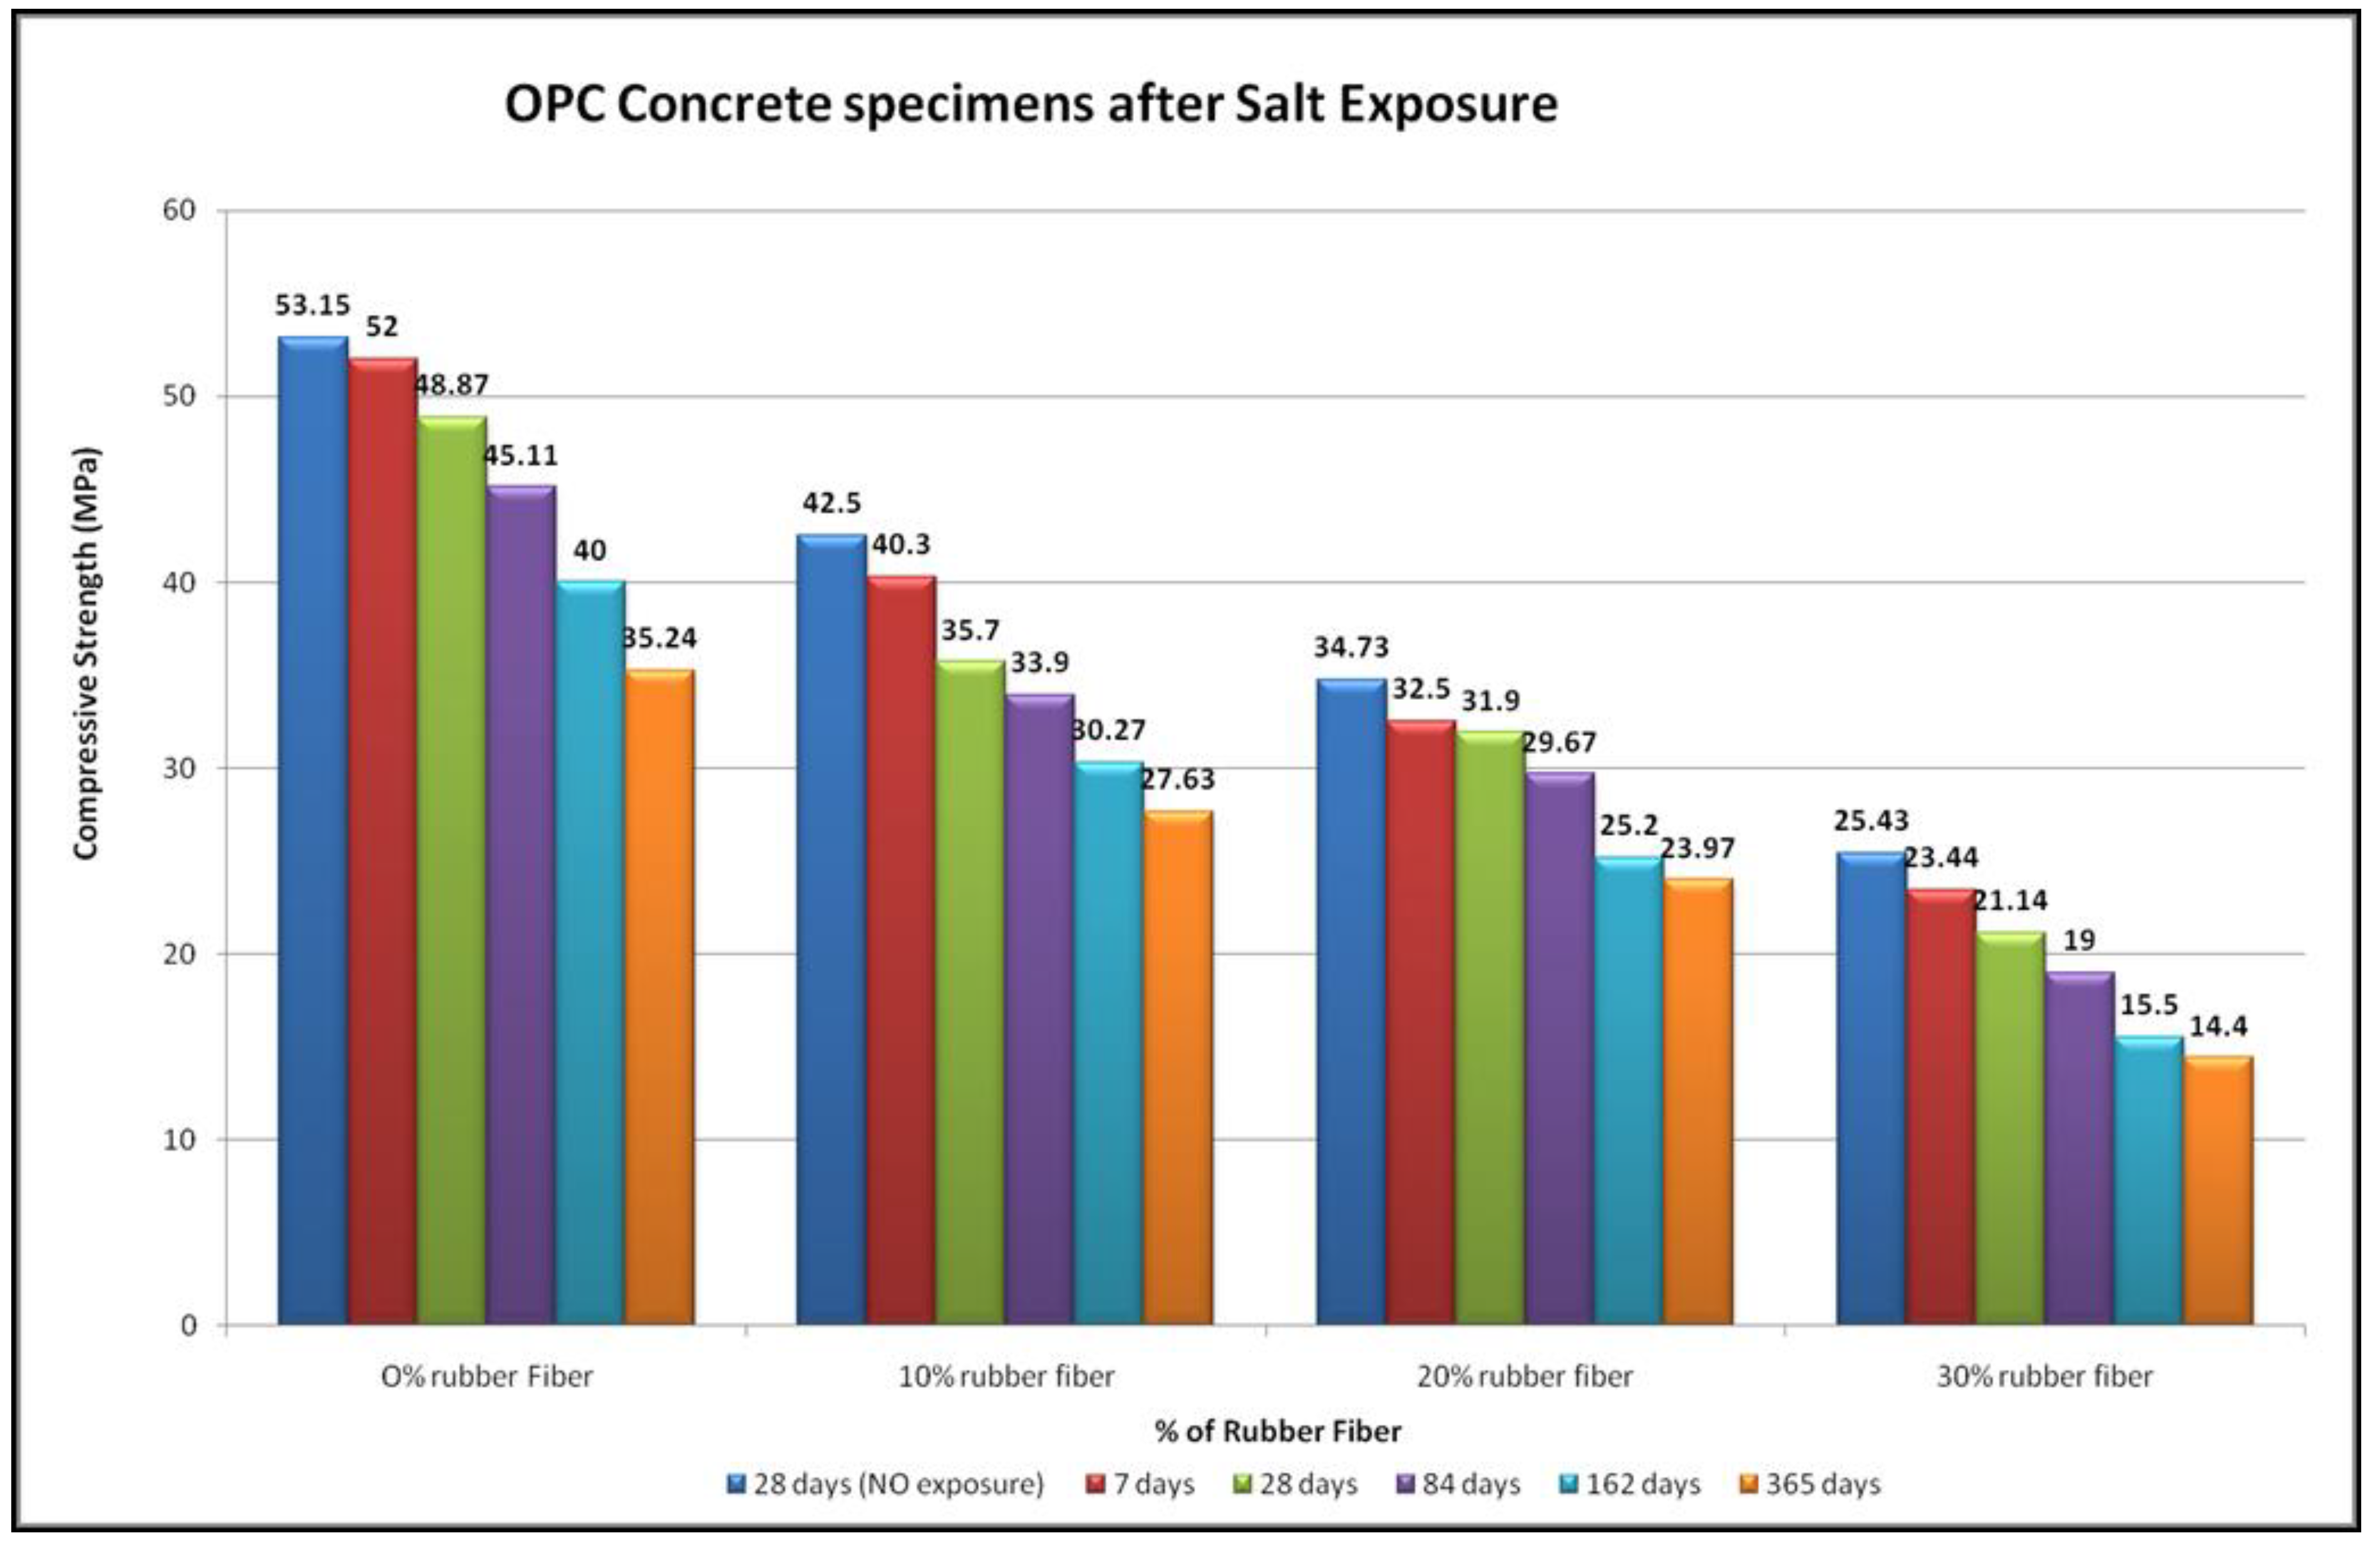
4.9. Salt Resistance
5. Conclusions
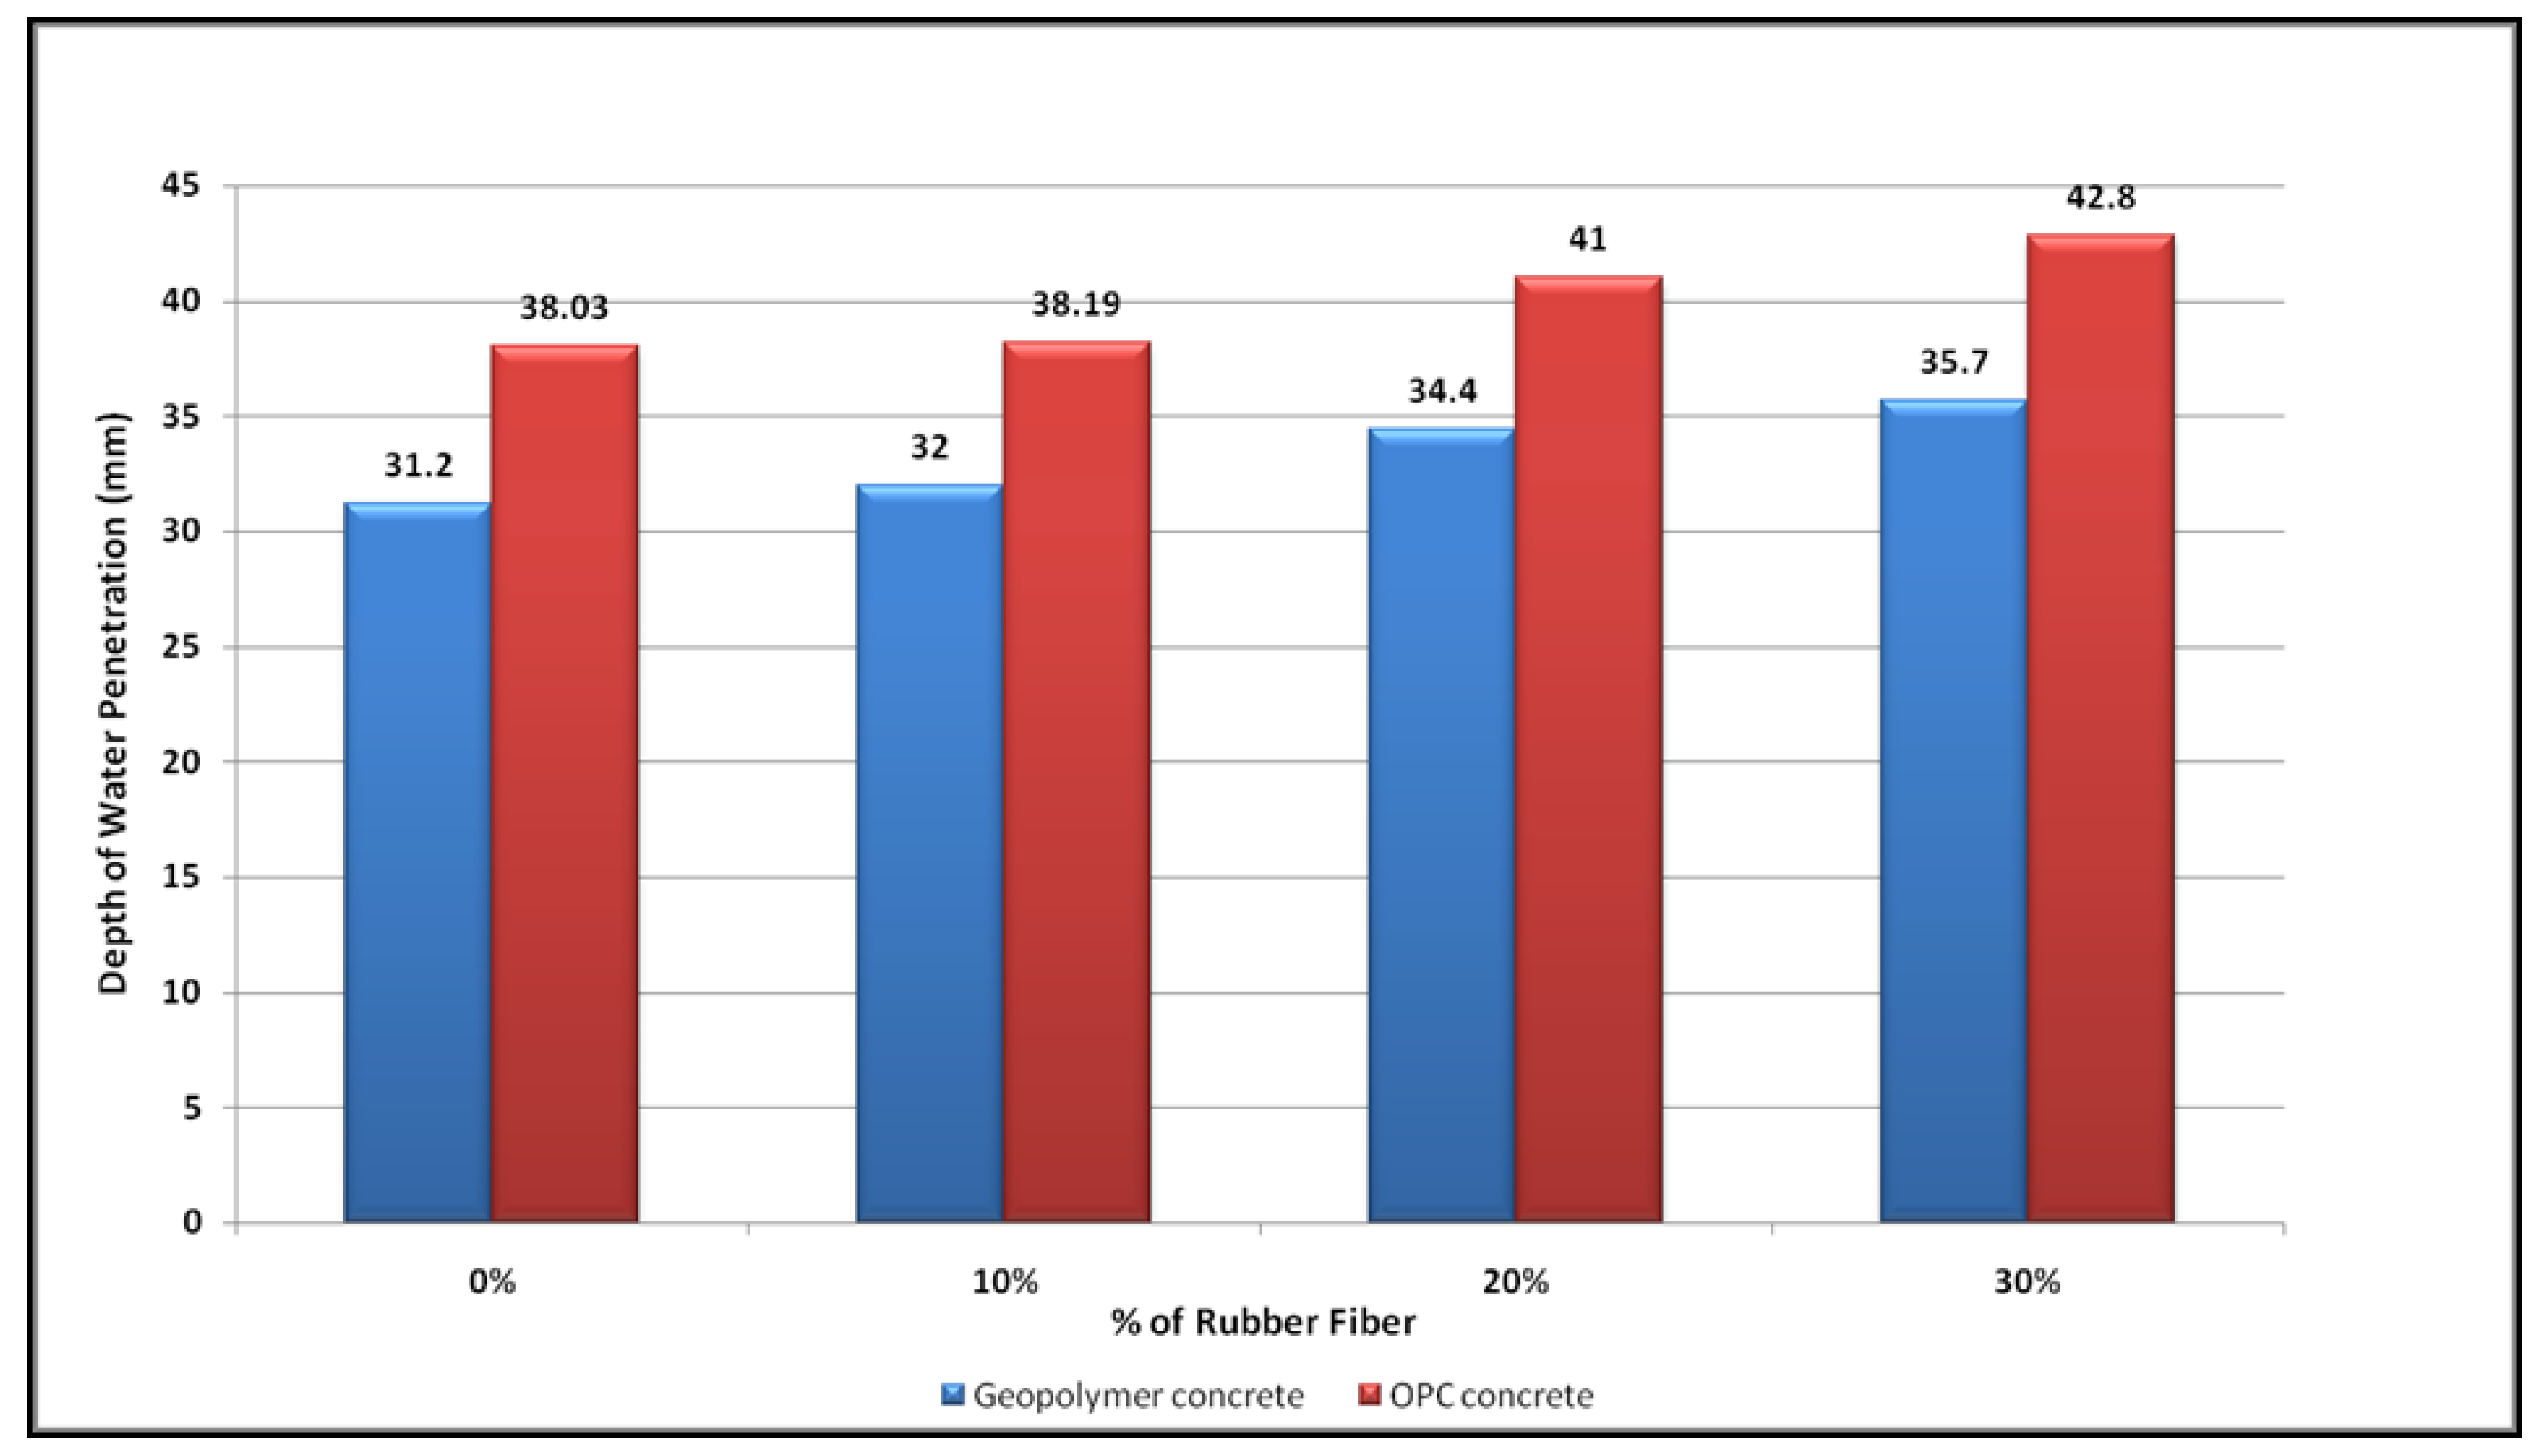
- The depth of water penetration rises with enhanced rubber fibre. In geopolymer concrete, the water penetration depth is smaller than in OPC concrete. The rise of the depth of penetration can be explained by the increased porosity of concrete, as is apparent at greater rubber fibre substitution concentrations.
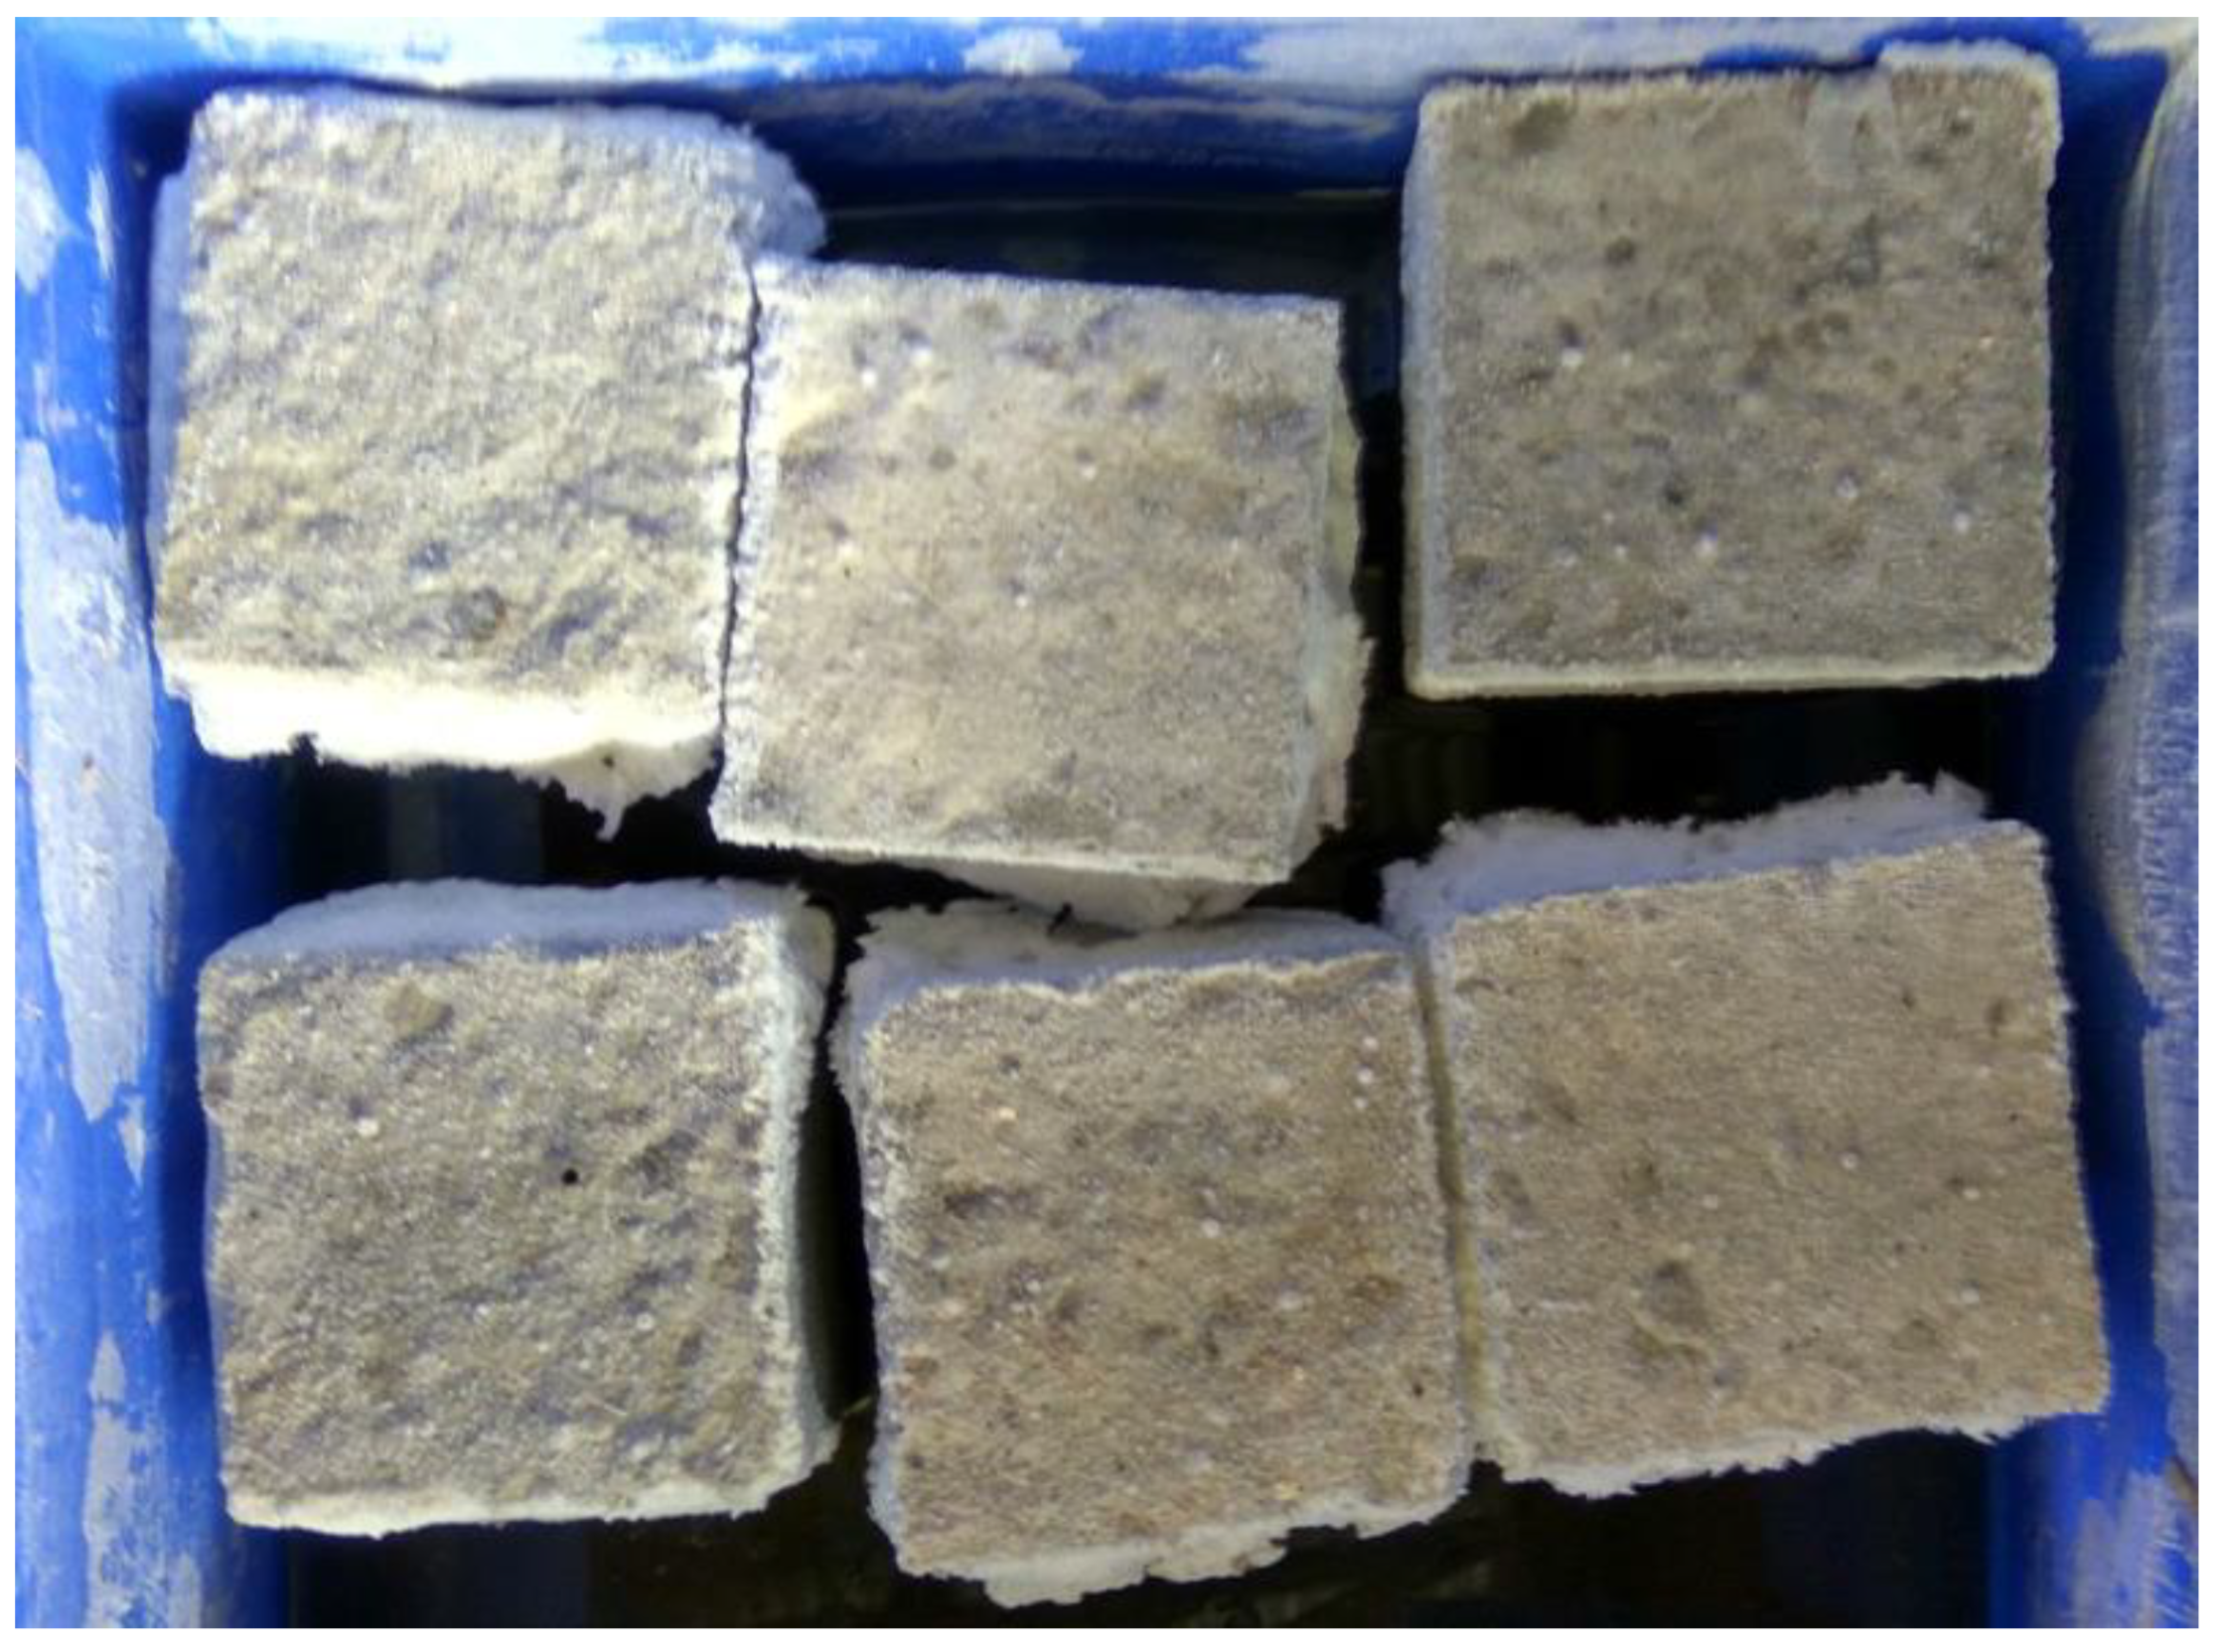
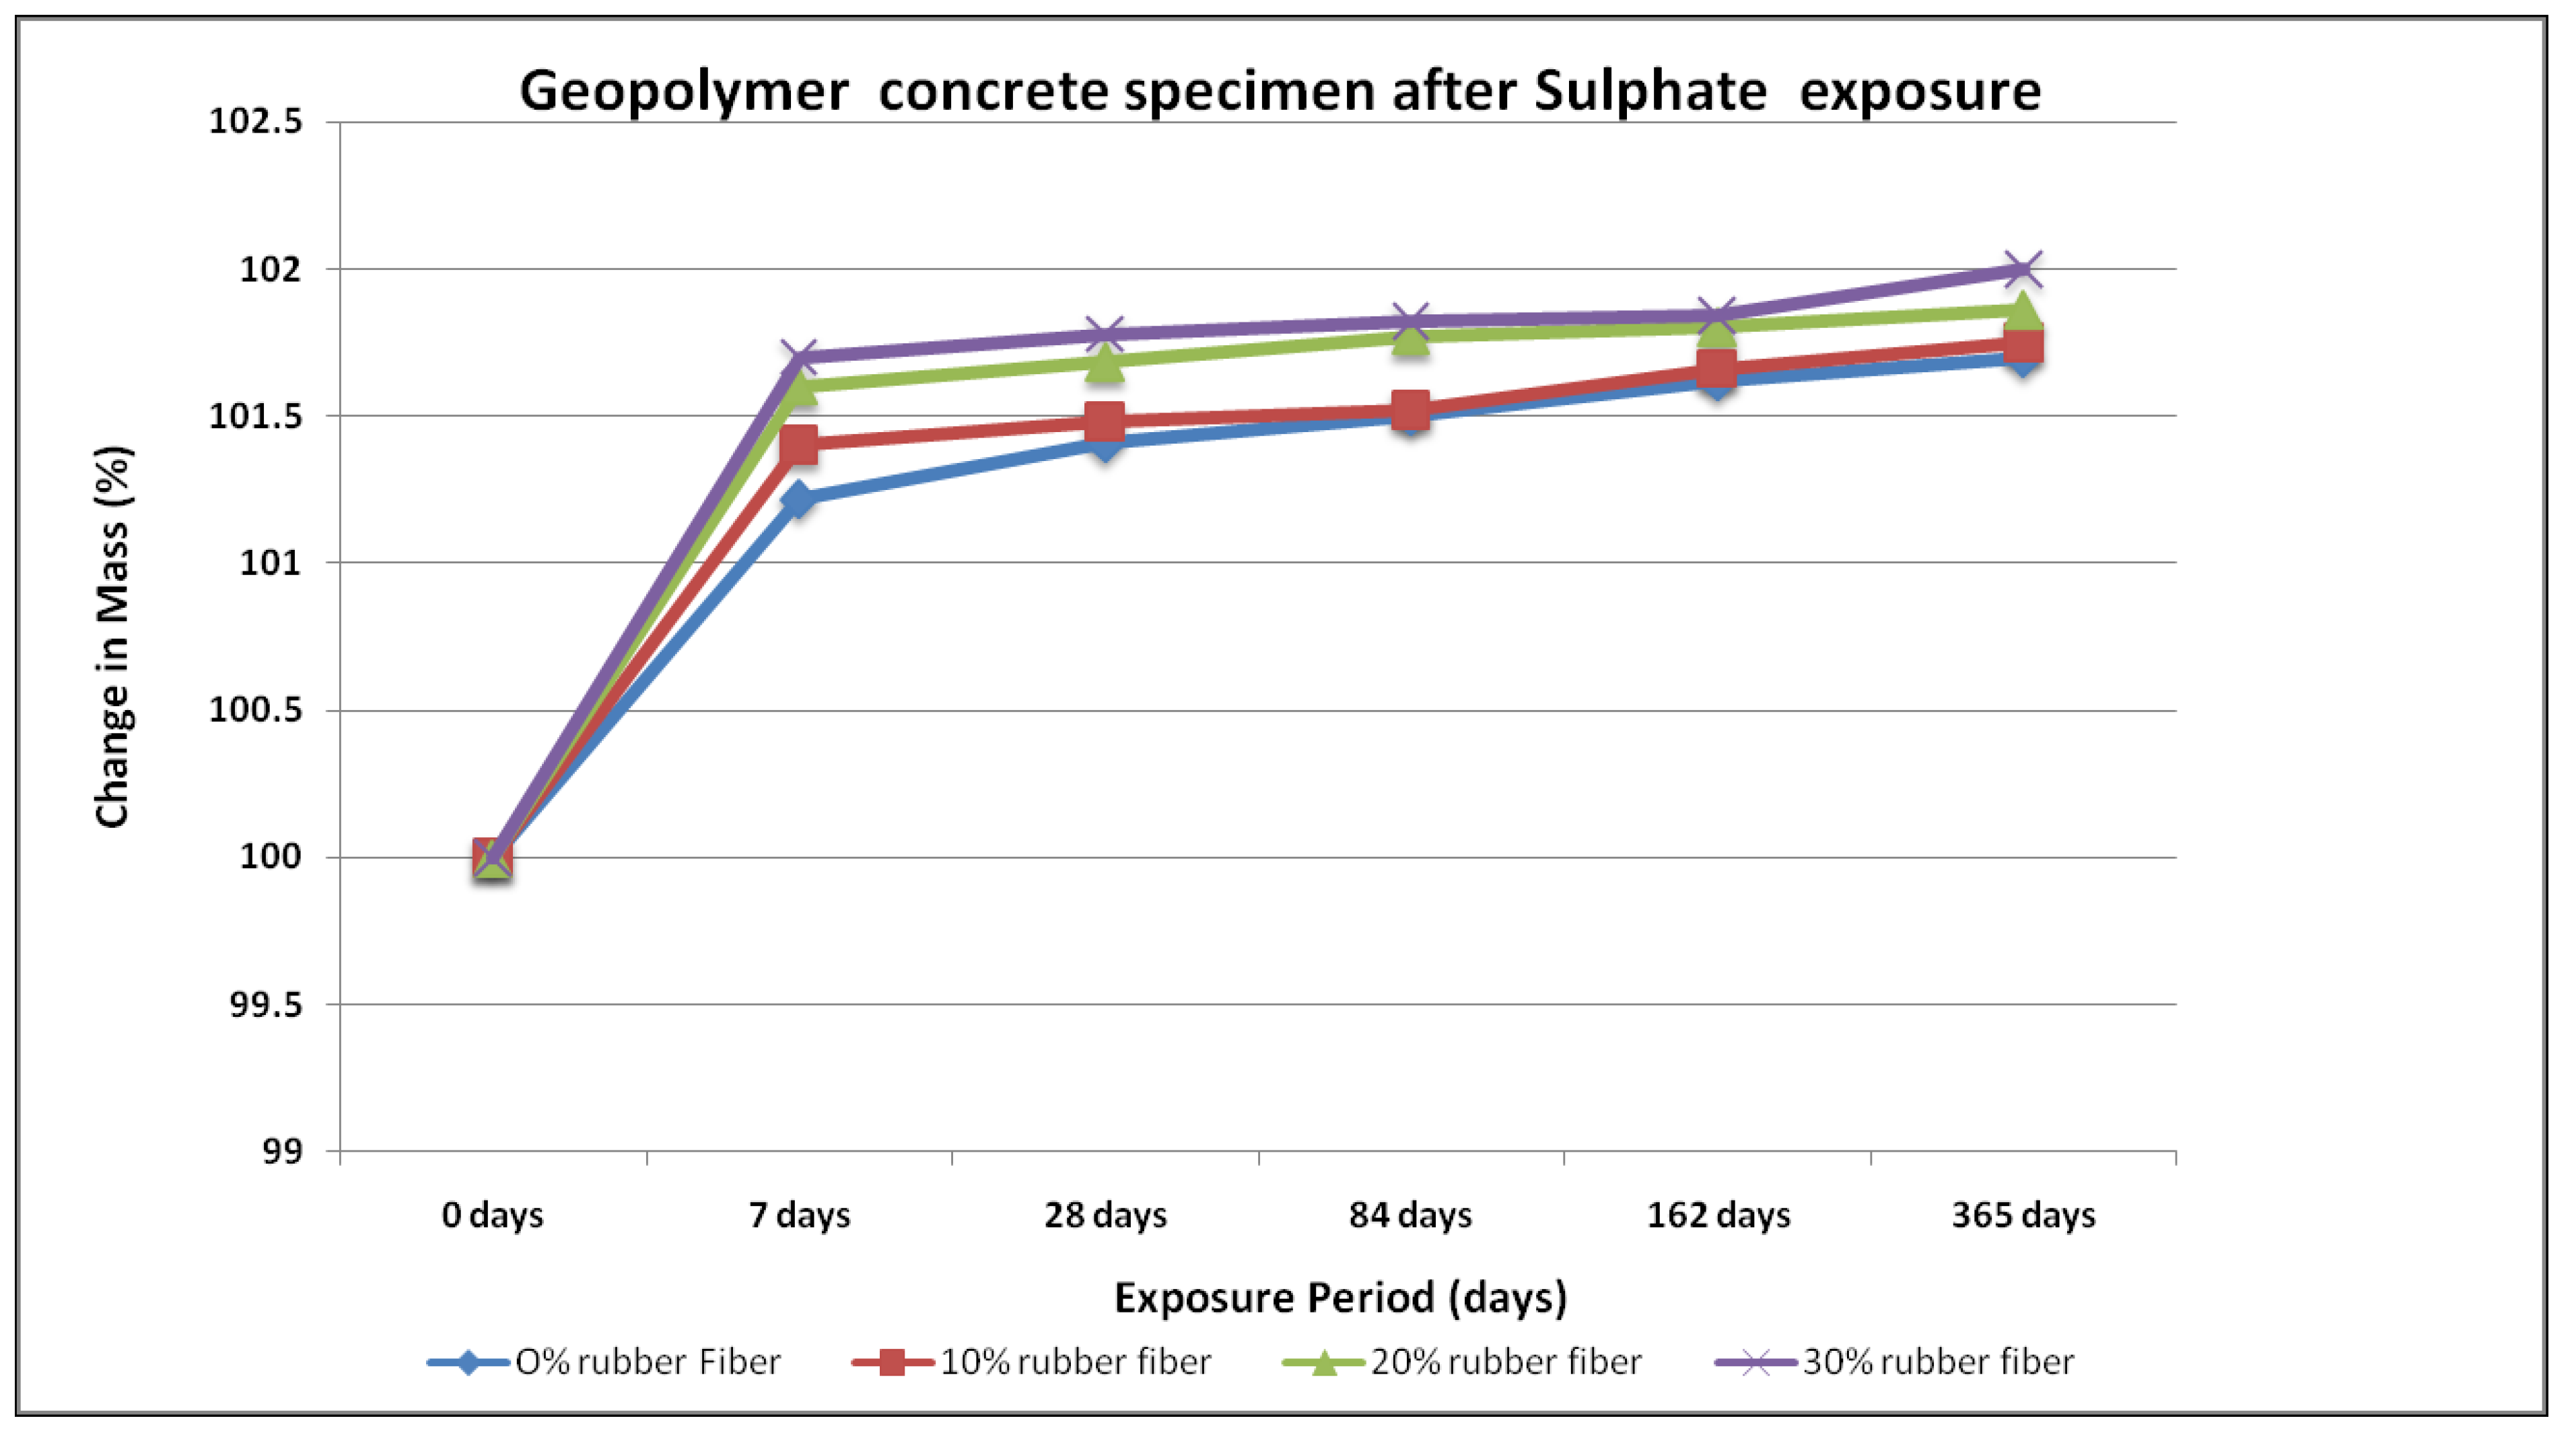
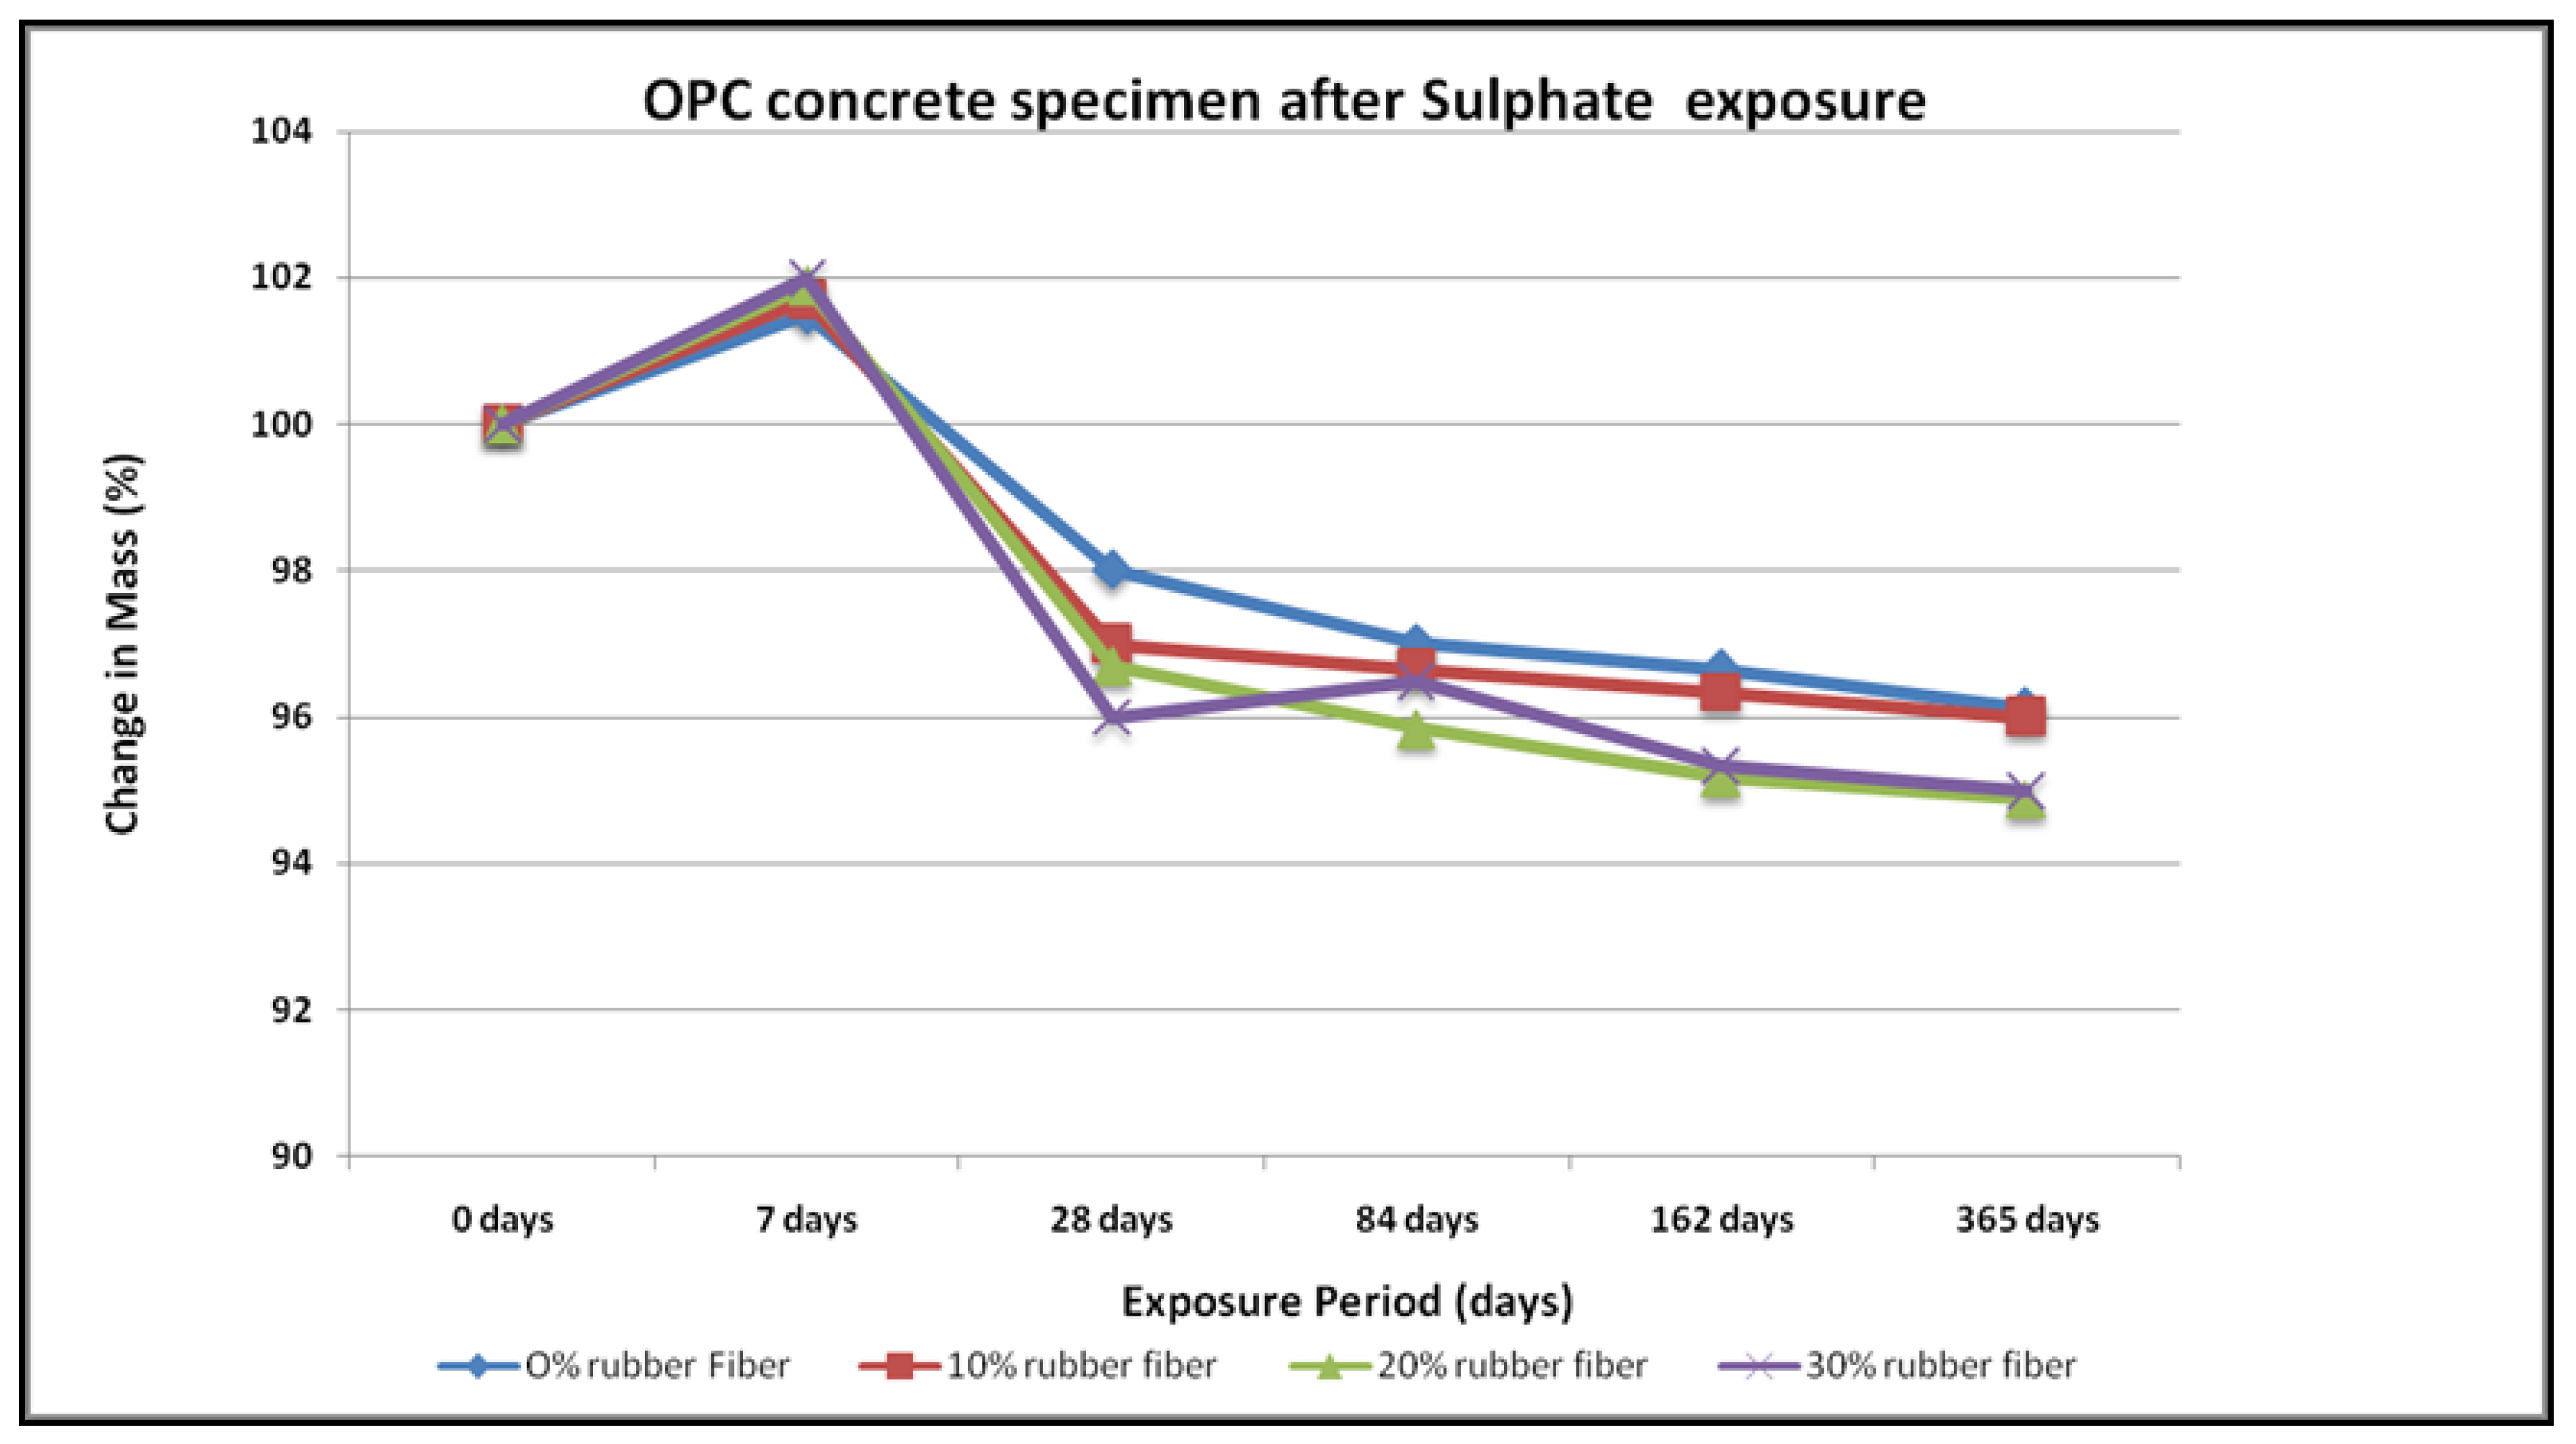
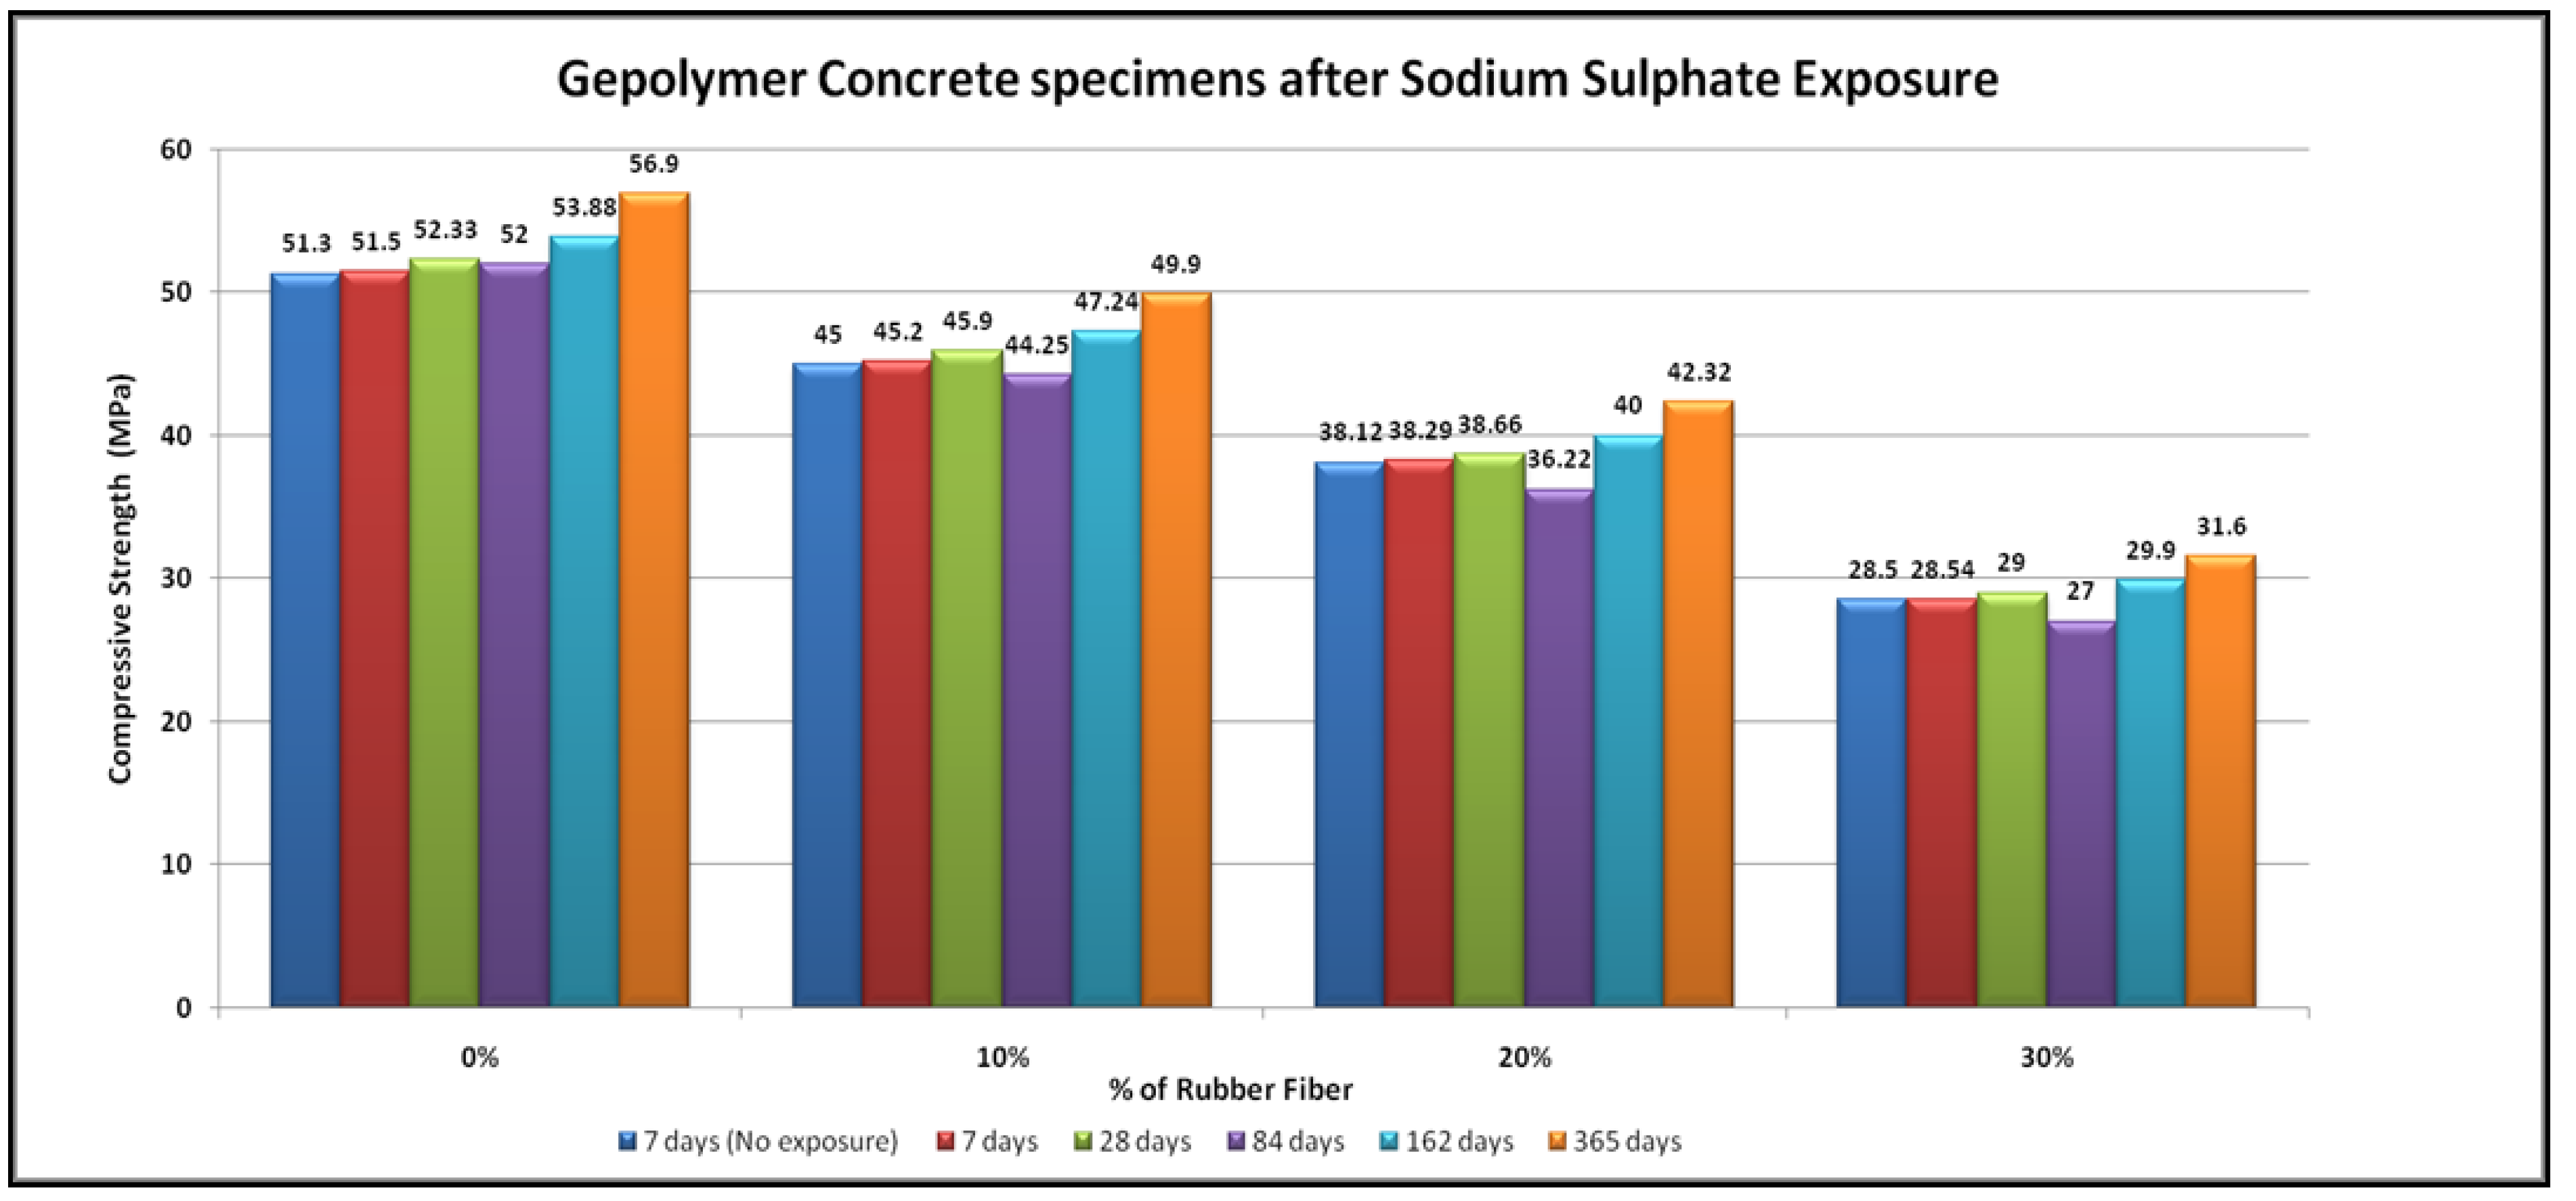
- No physical modifications in the geopolymer samples were noted after exposure to sodium sulphate for up to a year. These specimens did not exhibit any change in shape, and no cracking or spalling. In contrast, the OPC concrete specimen had expanded and suffered from frequent random cracking. After exposure in the geopolymer samples, there were substantial changes in compressive strength, whereas OPC concrete samples showed lower compressive strength.
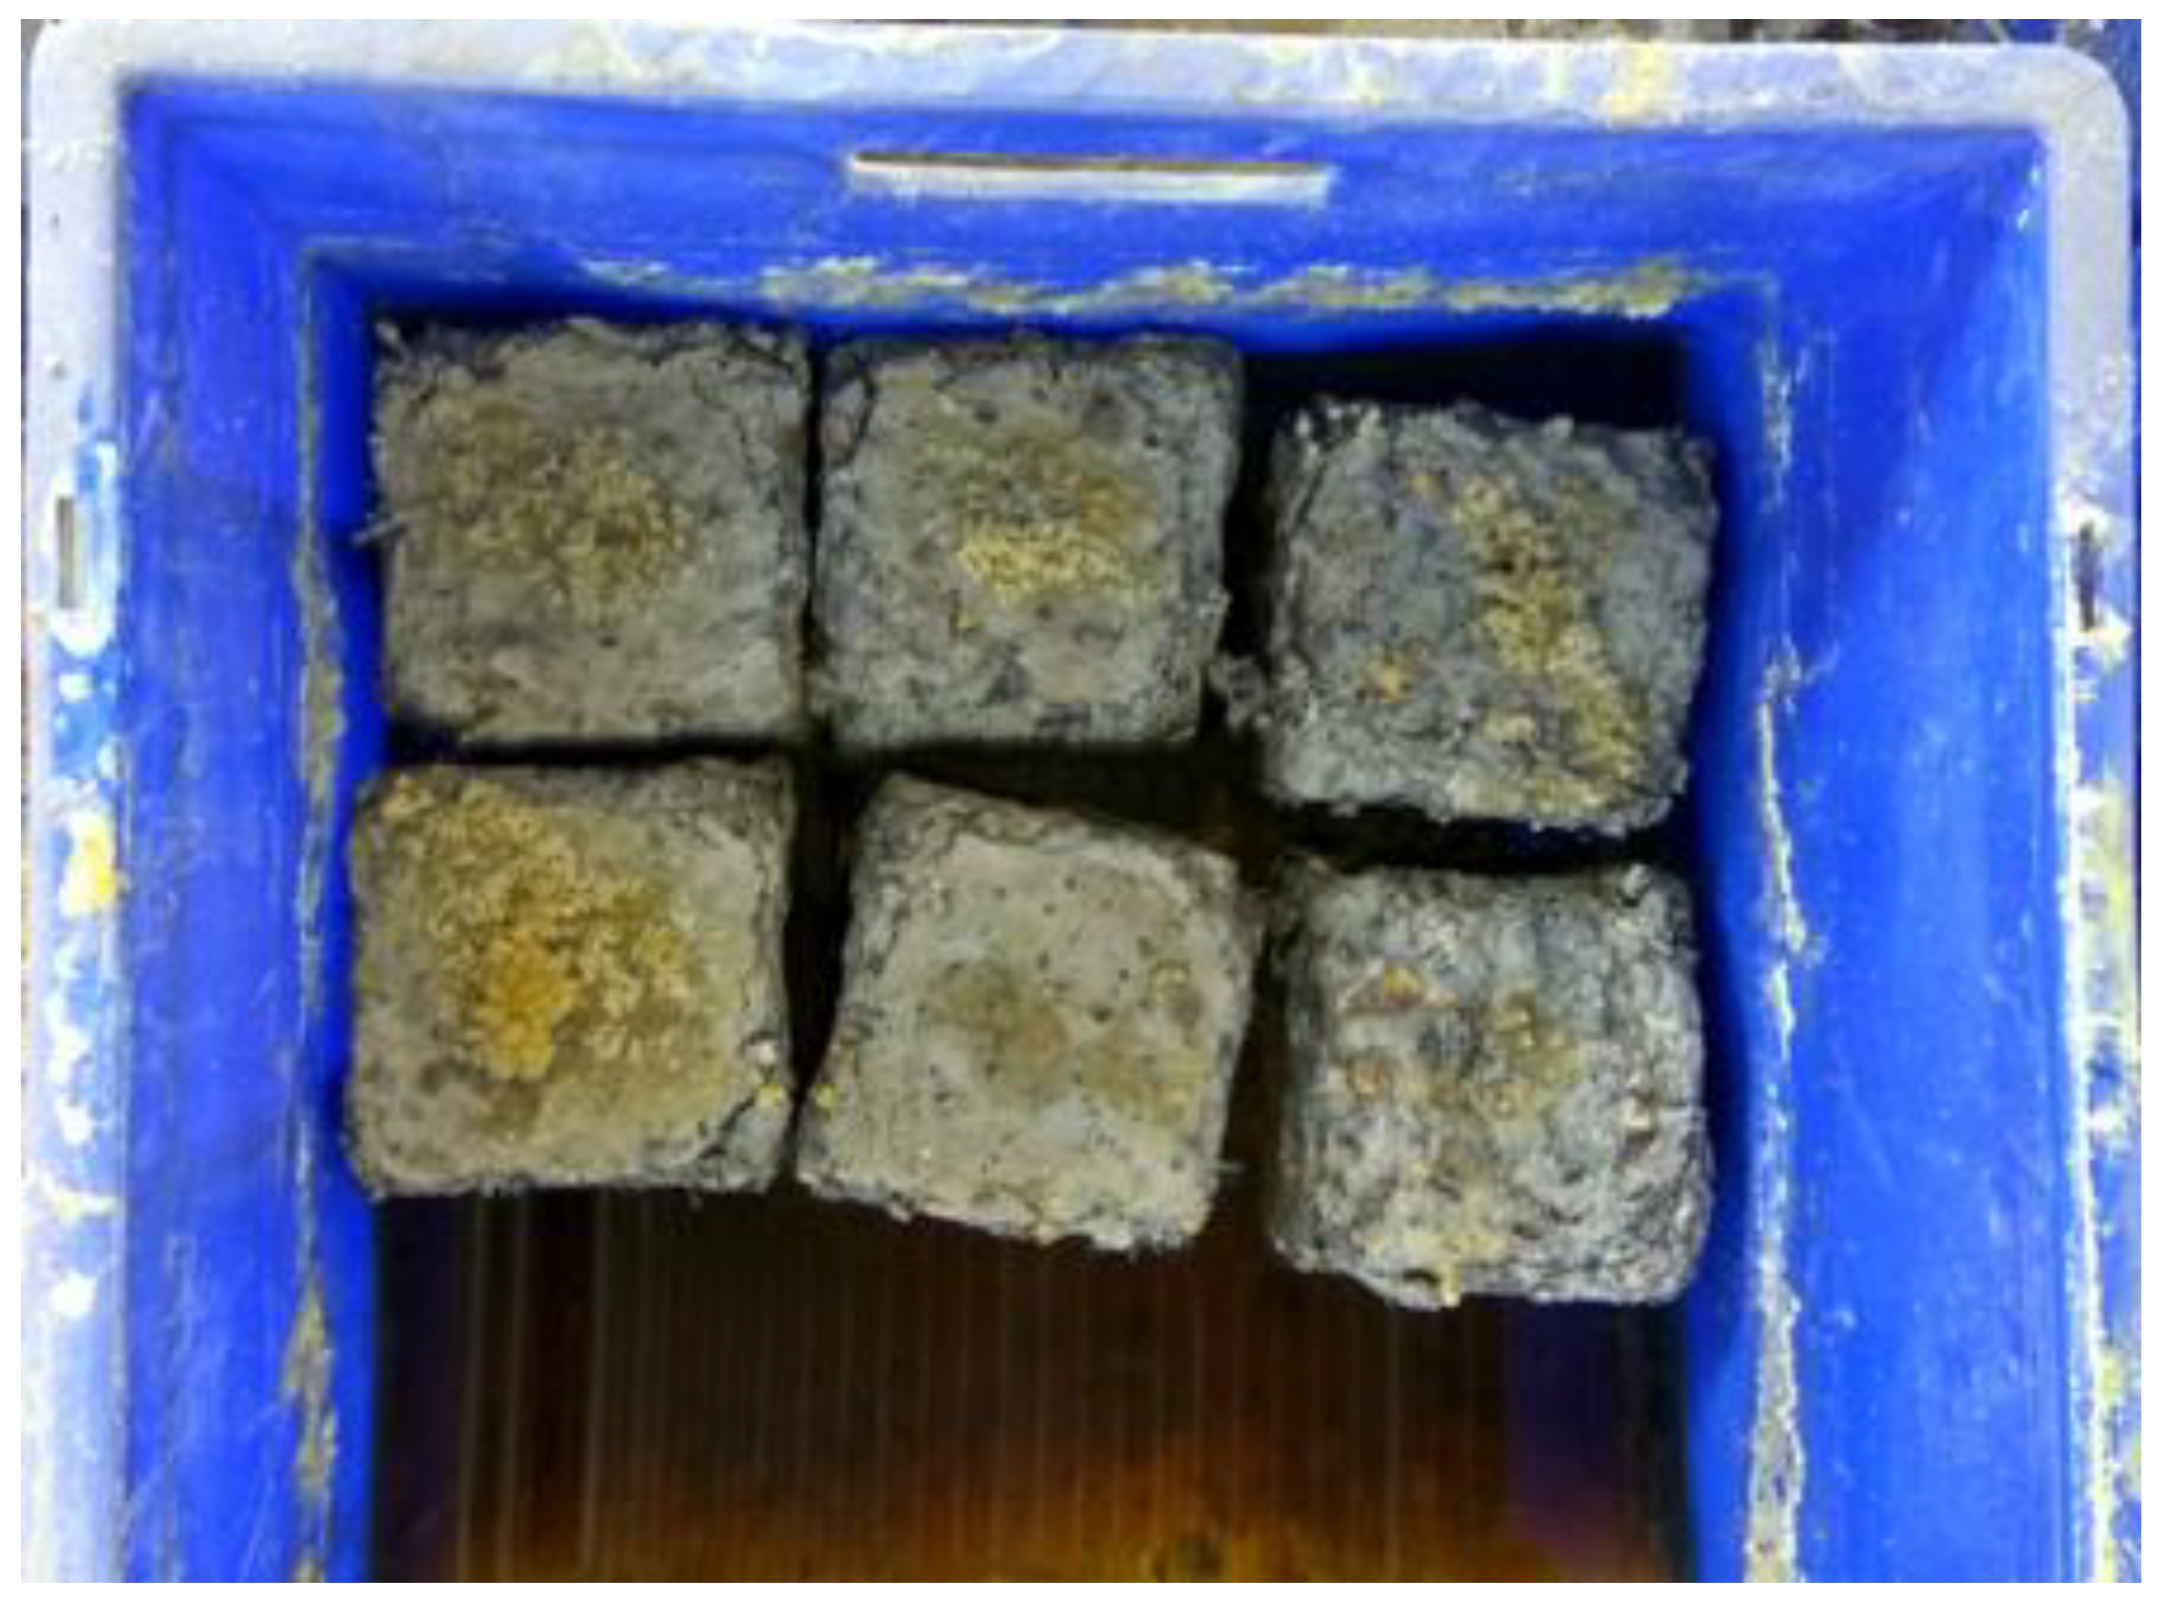
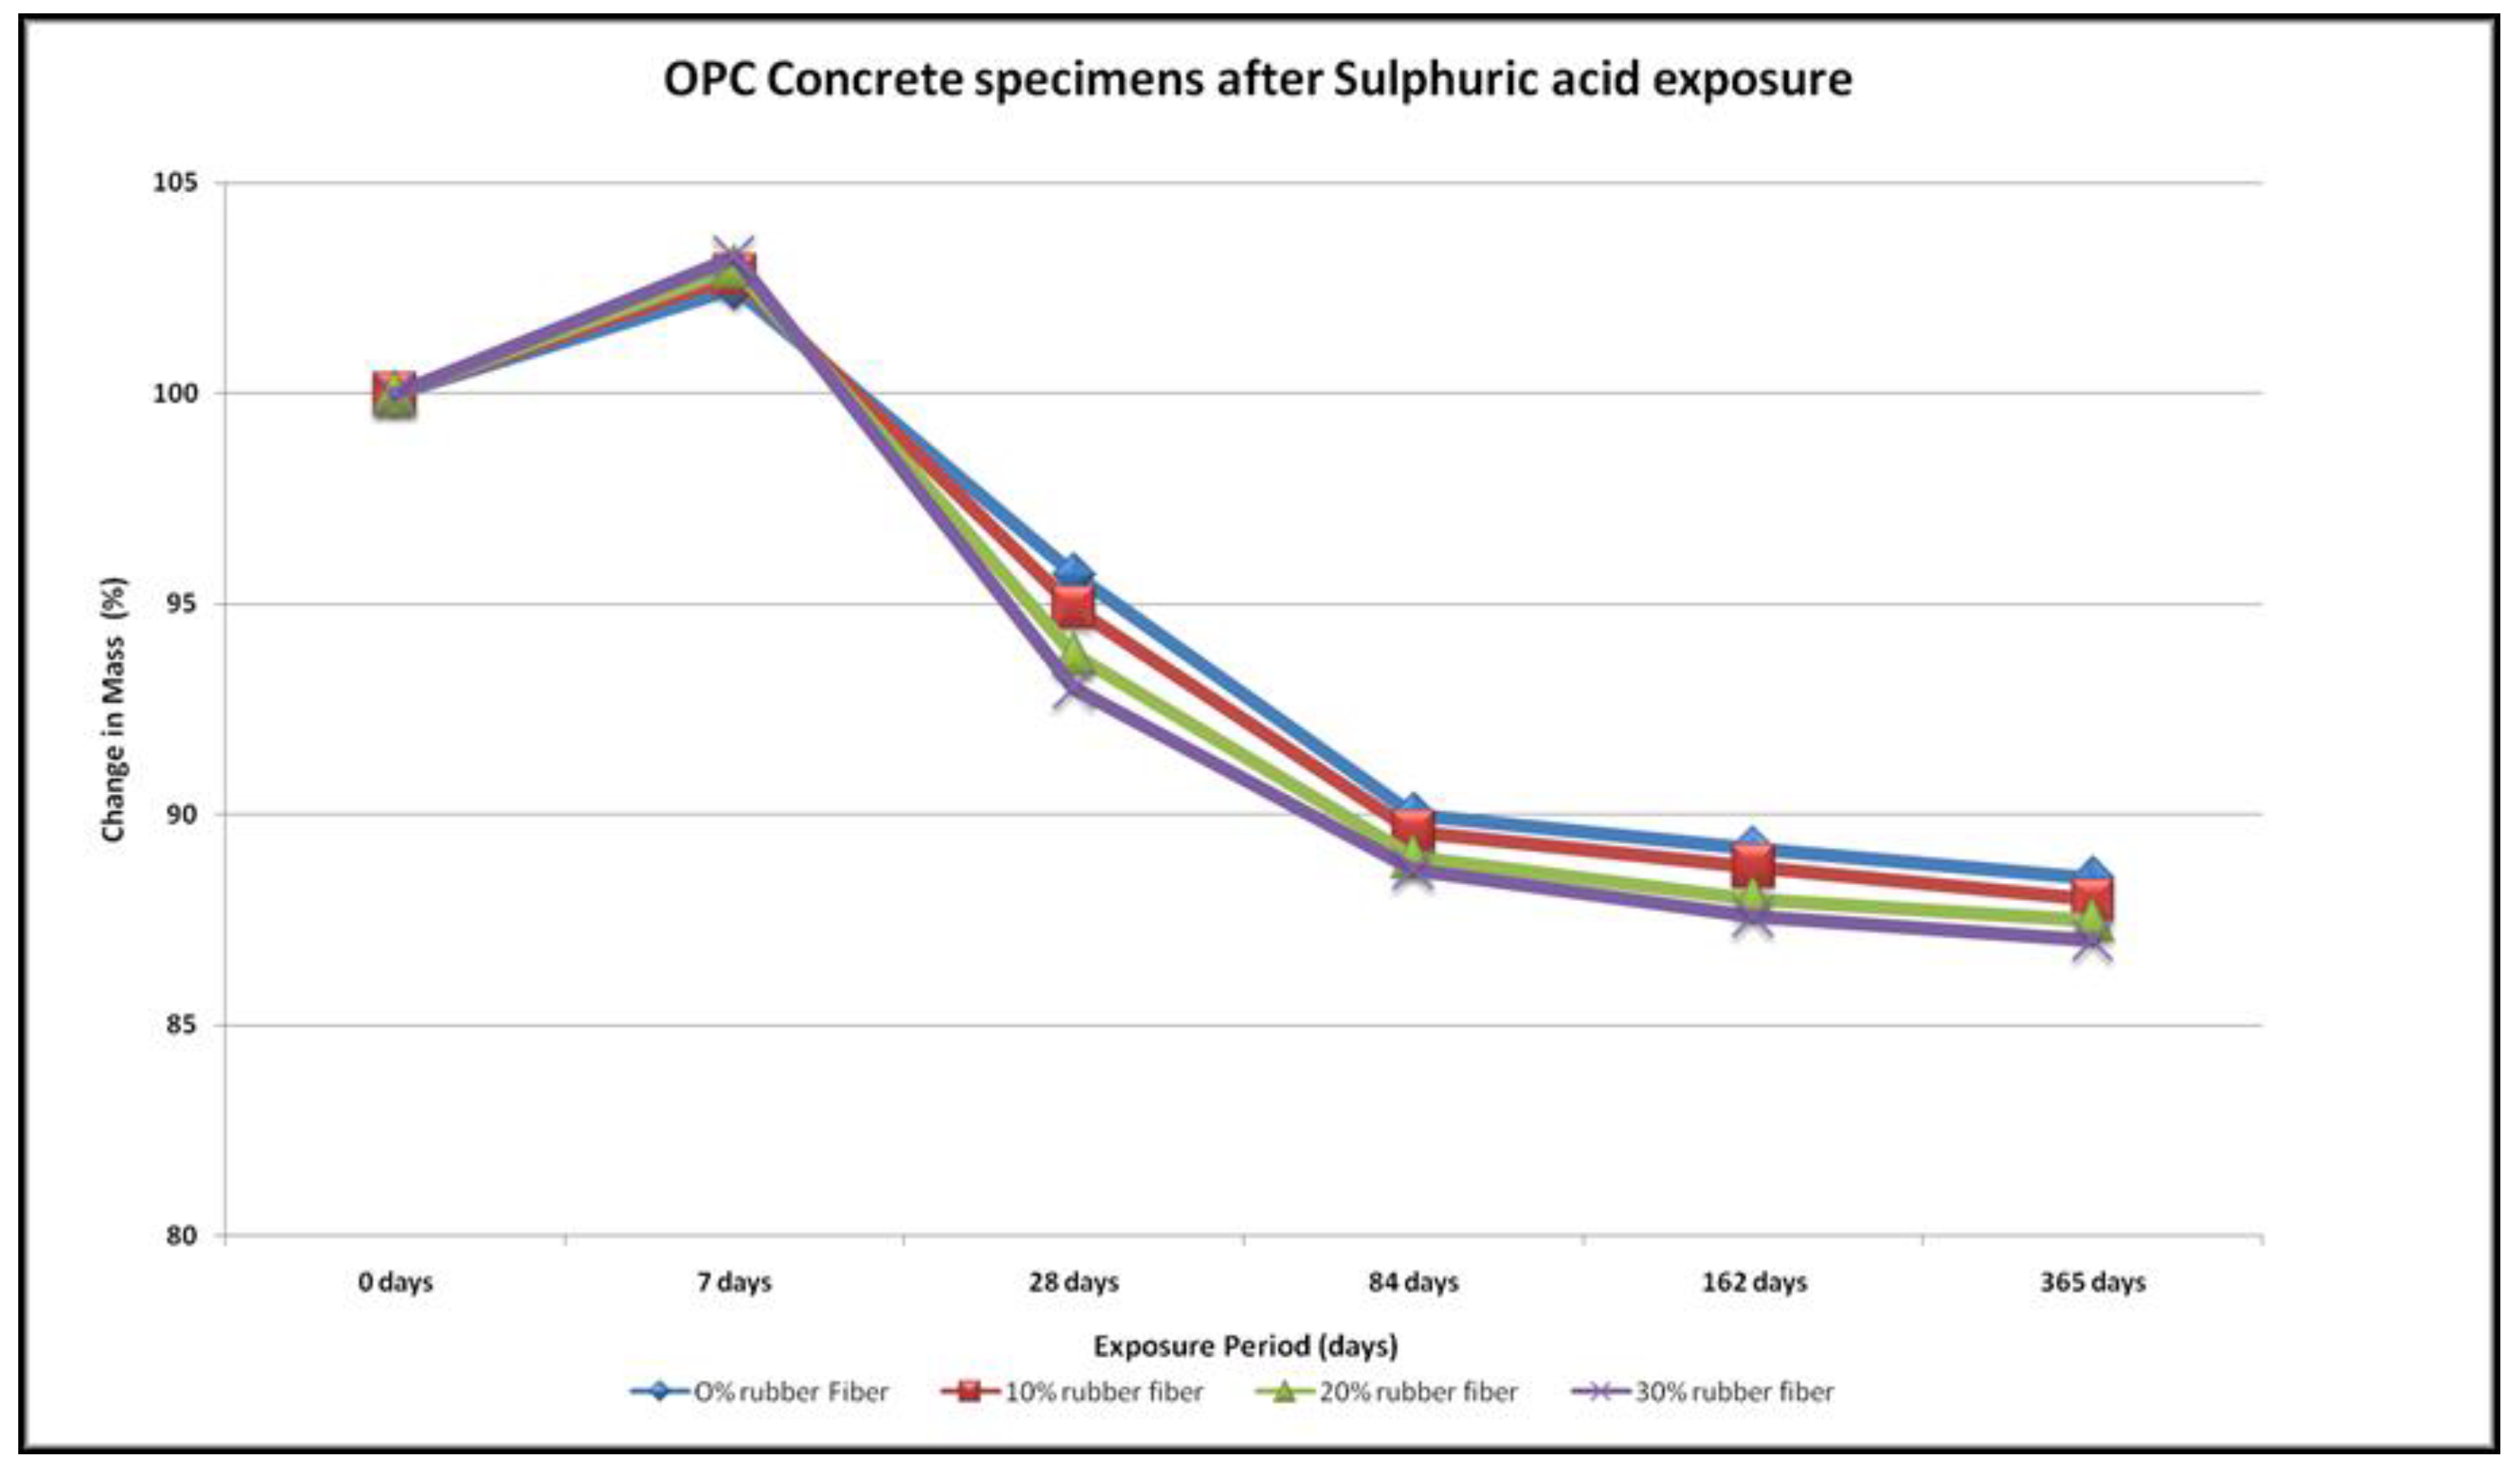
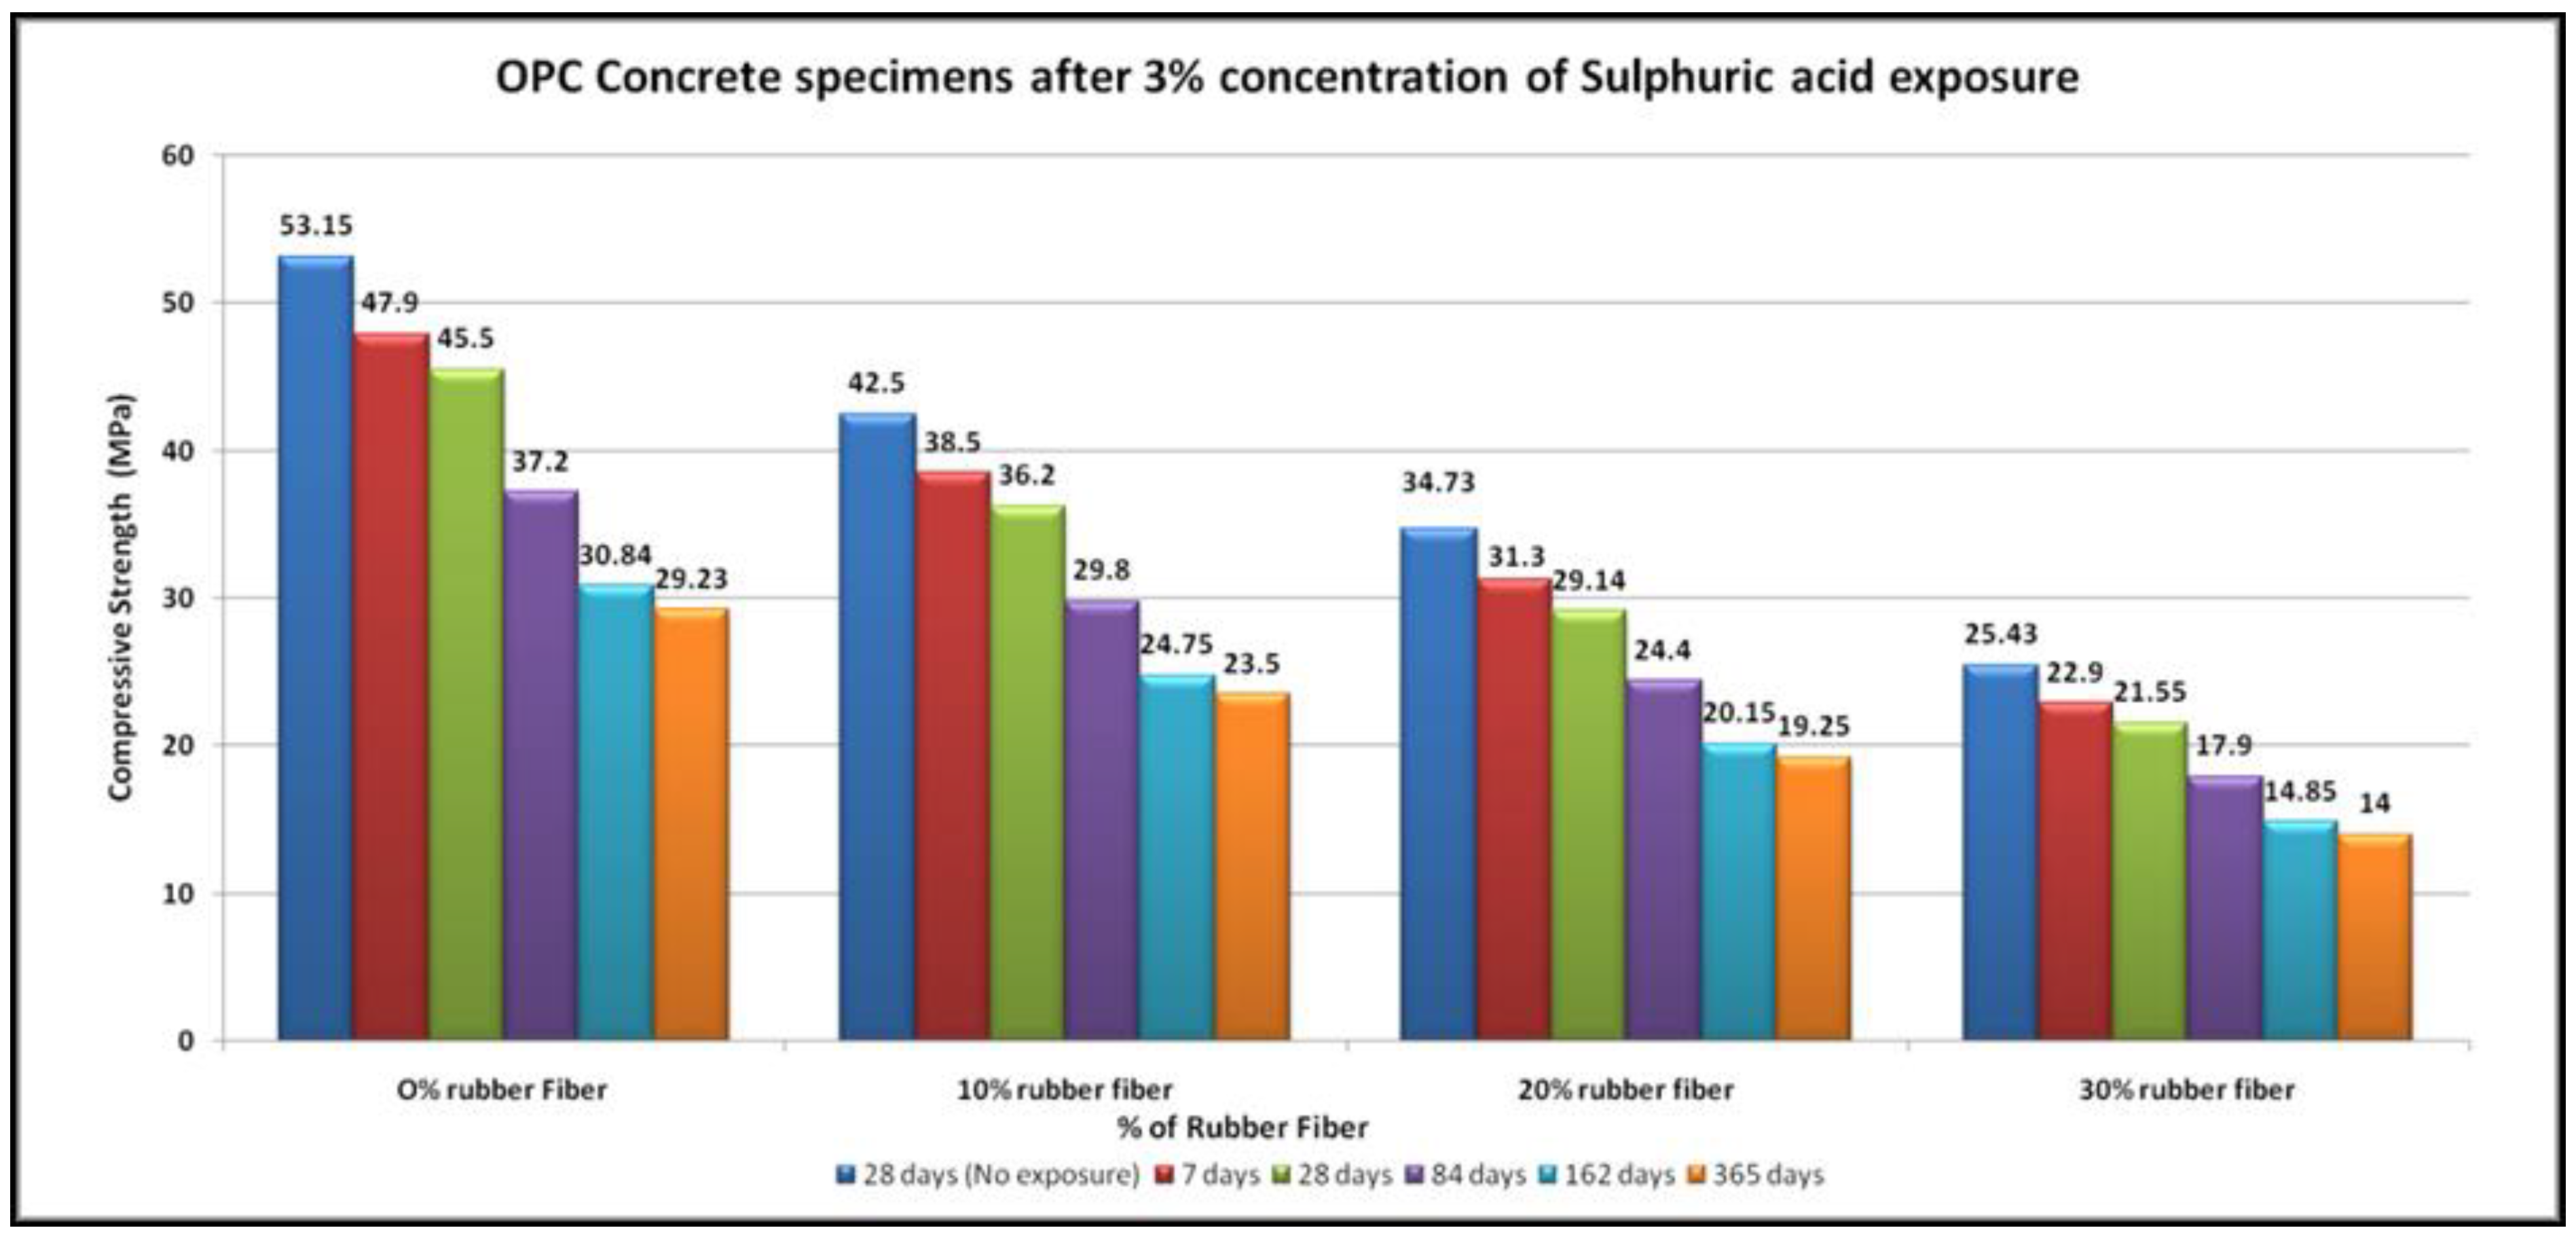
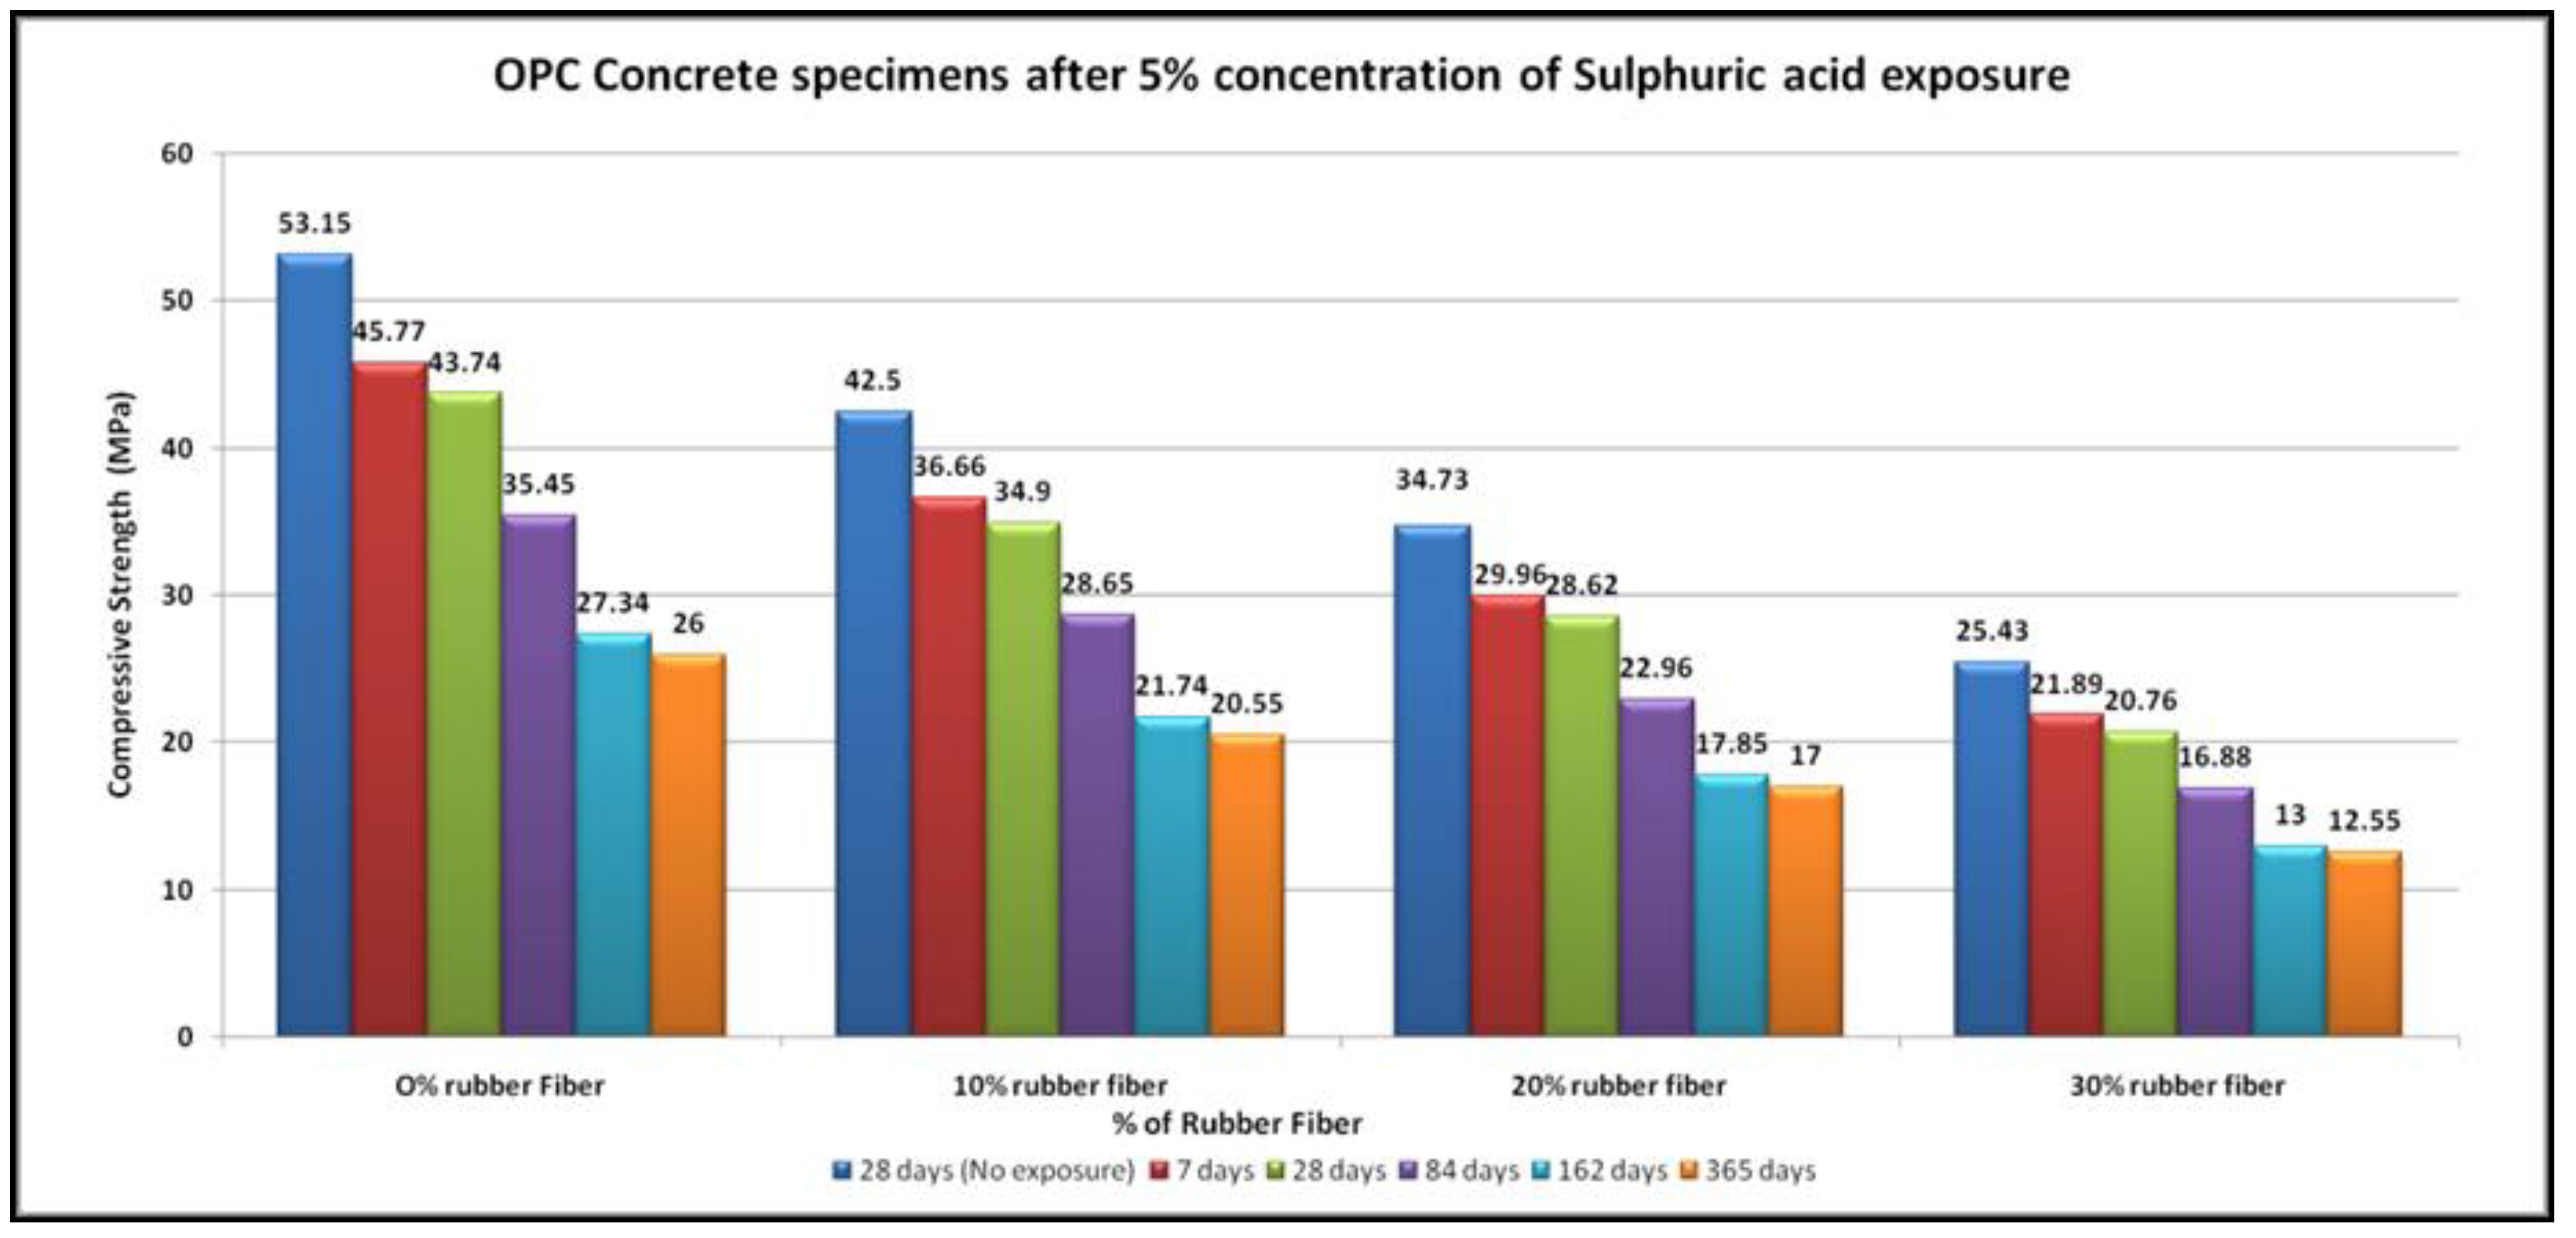
- The specimens of all mixtures undergo erosion after exposure to acid. The damage to the concrete surface increases as the sulfuric acid becomes stronger. It was found that higher concentrations of sulfuric acid result in greater deterioration, resulting in greater loss of strength.
- Geopolymer concrete has greater reduced diffusion coefficients of chloride than OPC concrete. The chloride diffusion coefficients increase with the rubber fibre content in both types of concrete.
- The macrocell current was greater than that for the control concrete at all ages for the rubberized concrete mixtures. The current for OPC concrete used is 10 μA for mixes at 8 months to 12 months. The incorporation of rubber waste fibre improves the likelihood of corrosion in both kinds of concrete at an early stage.
- The half-cell potential for the geopolymer and OPC concrete with waste fibres was greater than for the control geopolymer and OPC concrete. There recorded more negative than −350 mV in context to rubberized geopolymer concrete from the 10th month to the 12th month, while in the 9th month to the 12th month rubberized OPC concrete potential was higher than −350 mV.
- With the increase in the rubber fibre content and an increase in time for both cases, the drying shrinking has increased. Porosity increases due to the reduction of the shrinkage rate owing to rubber particles.
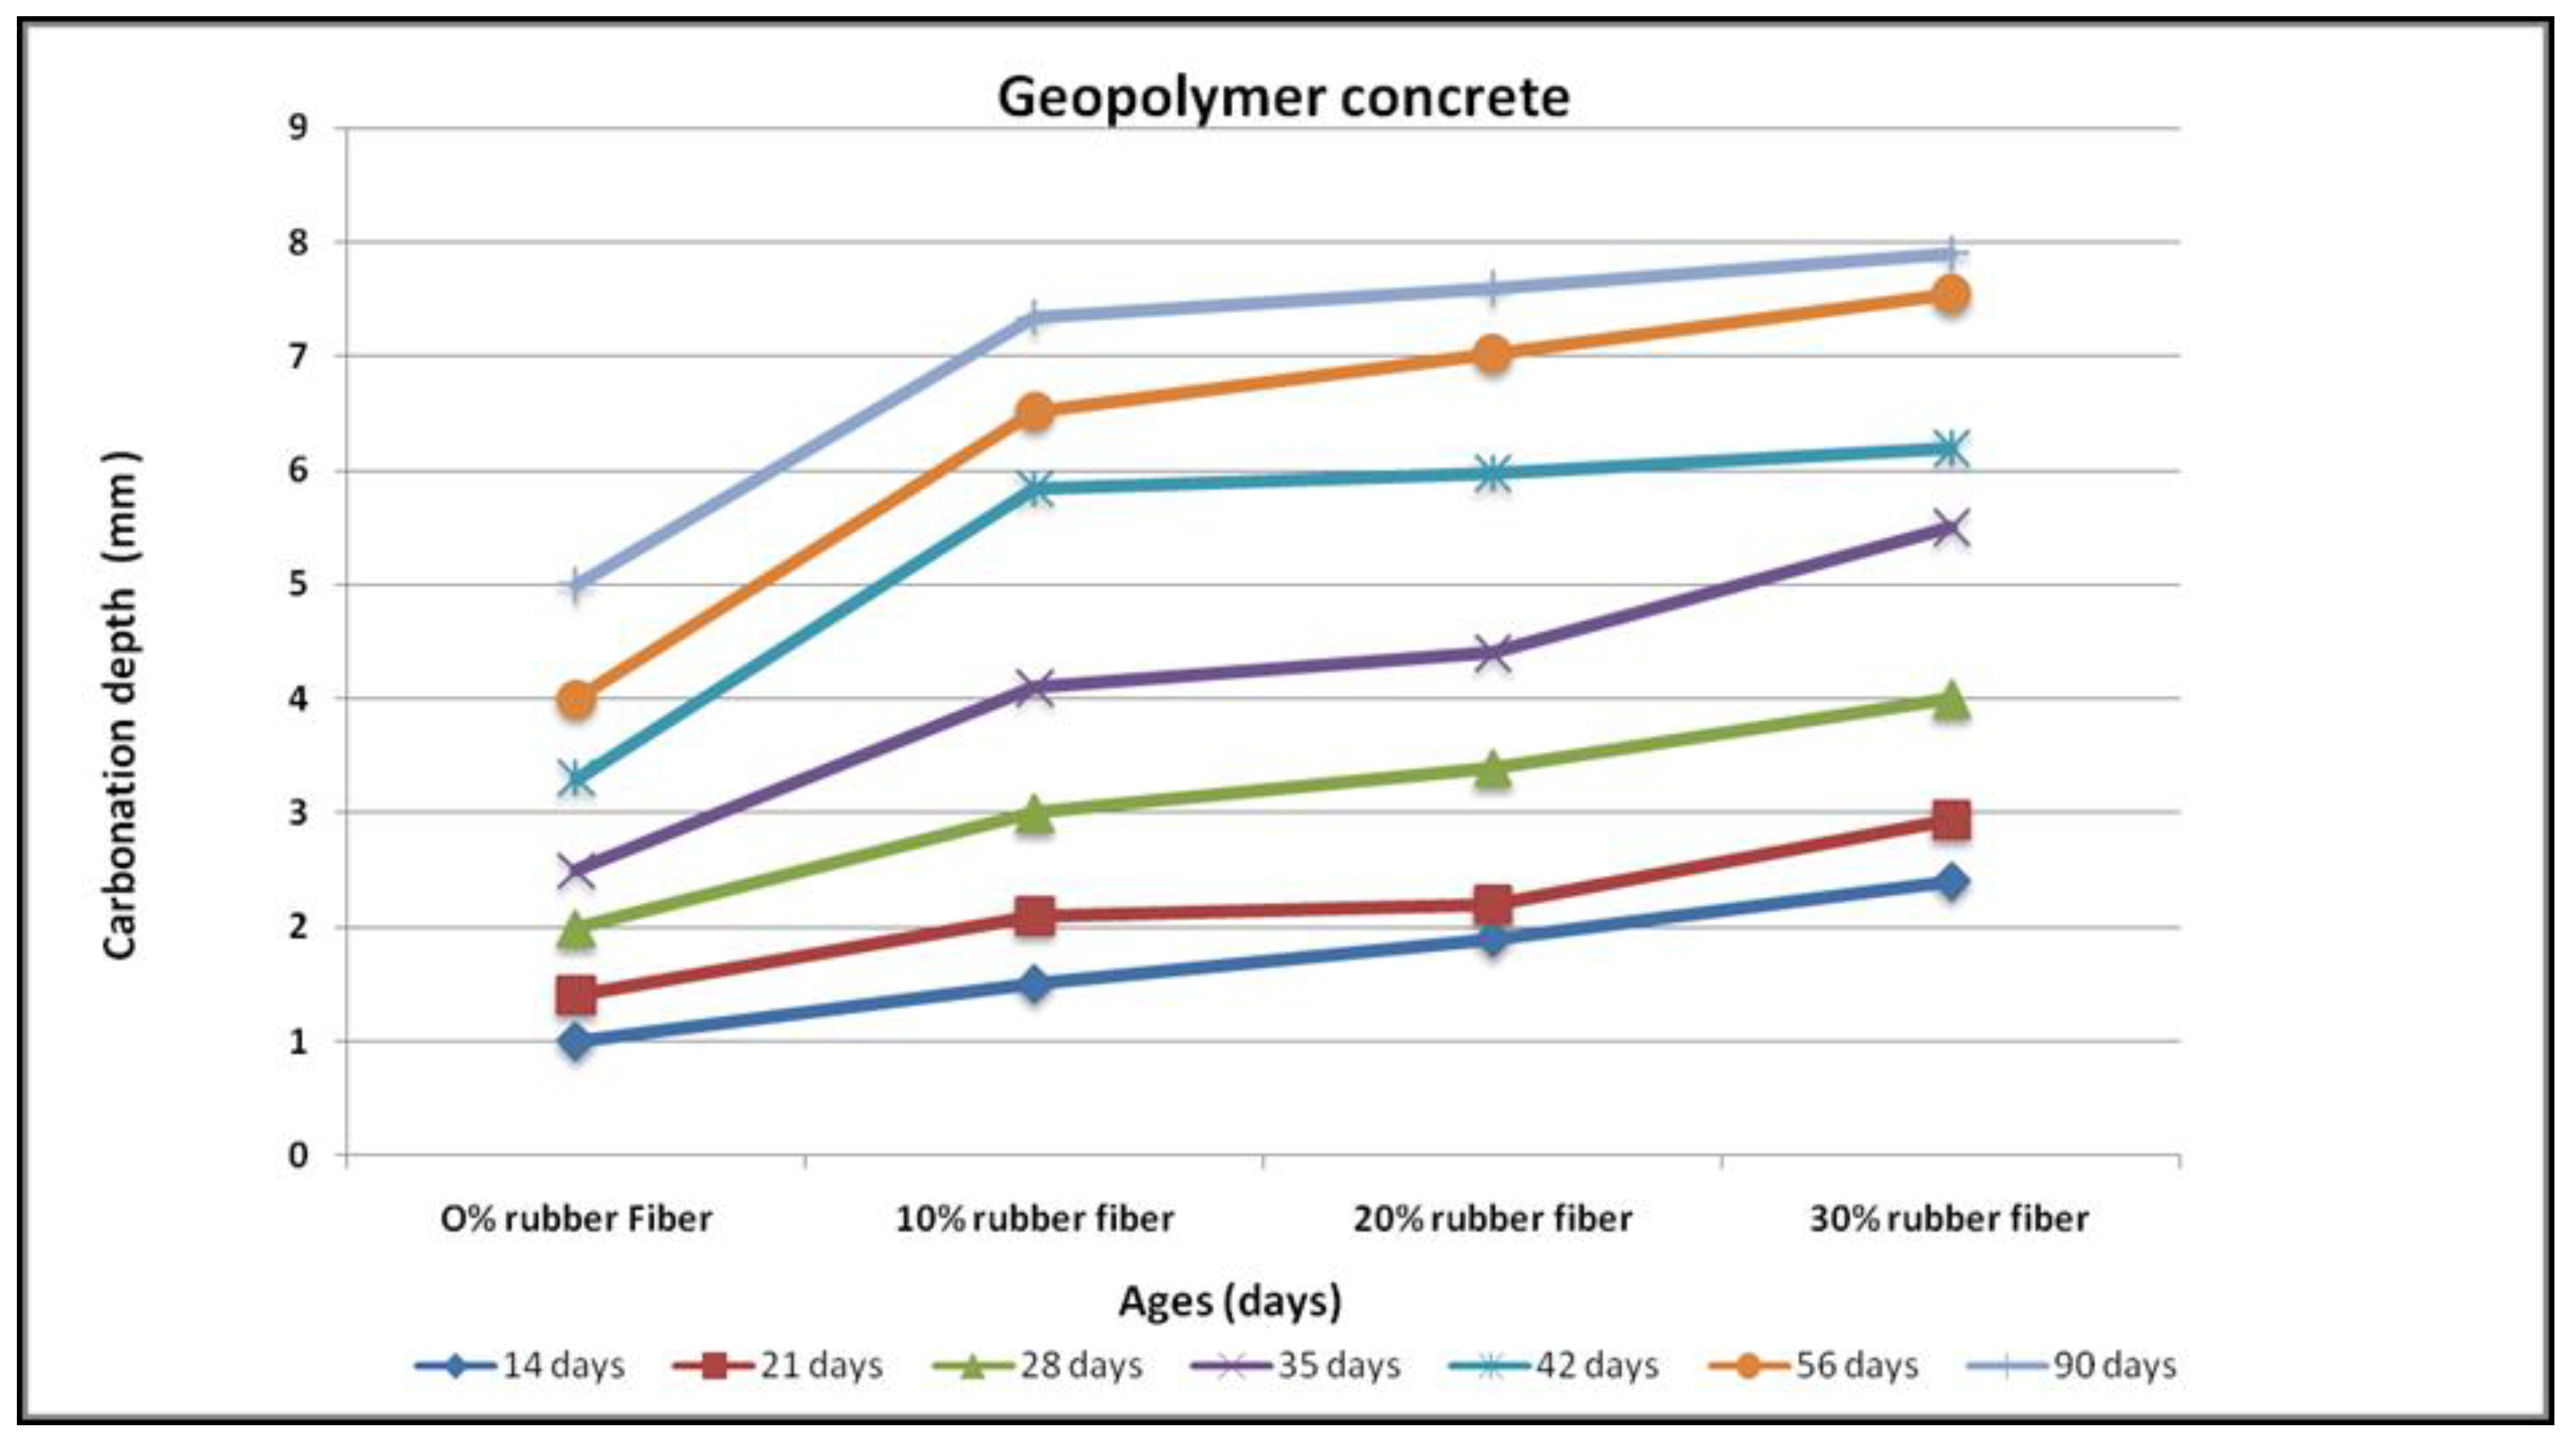
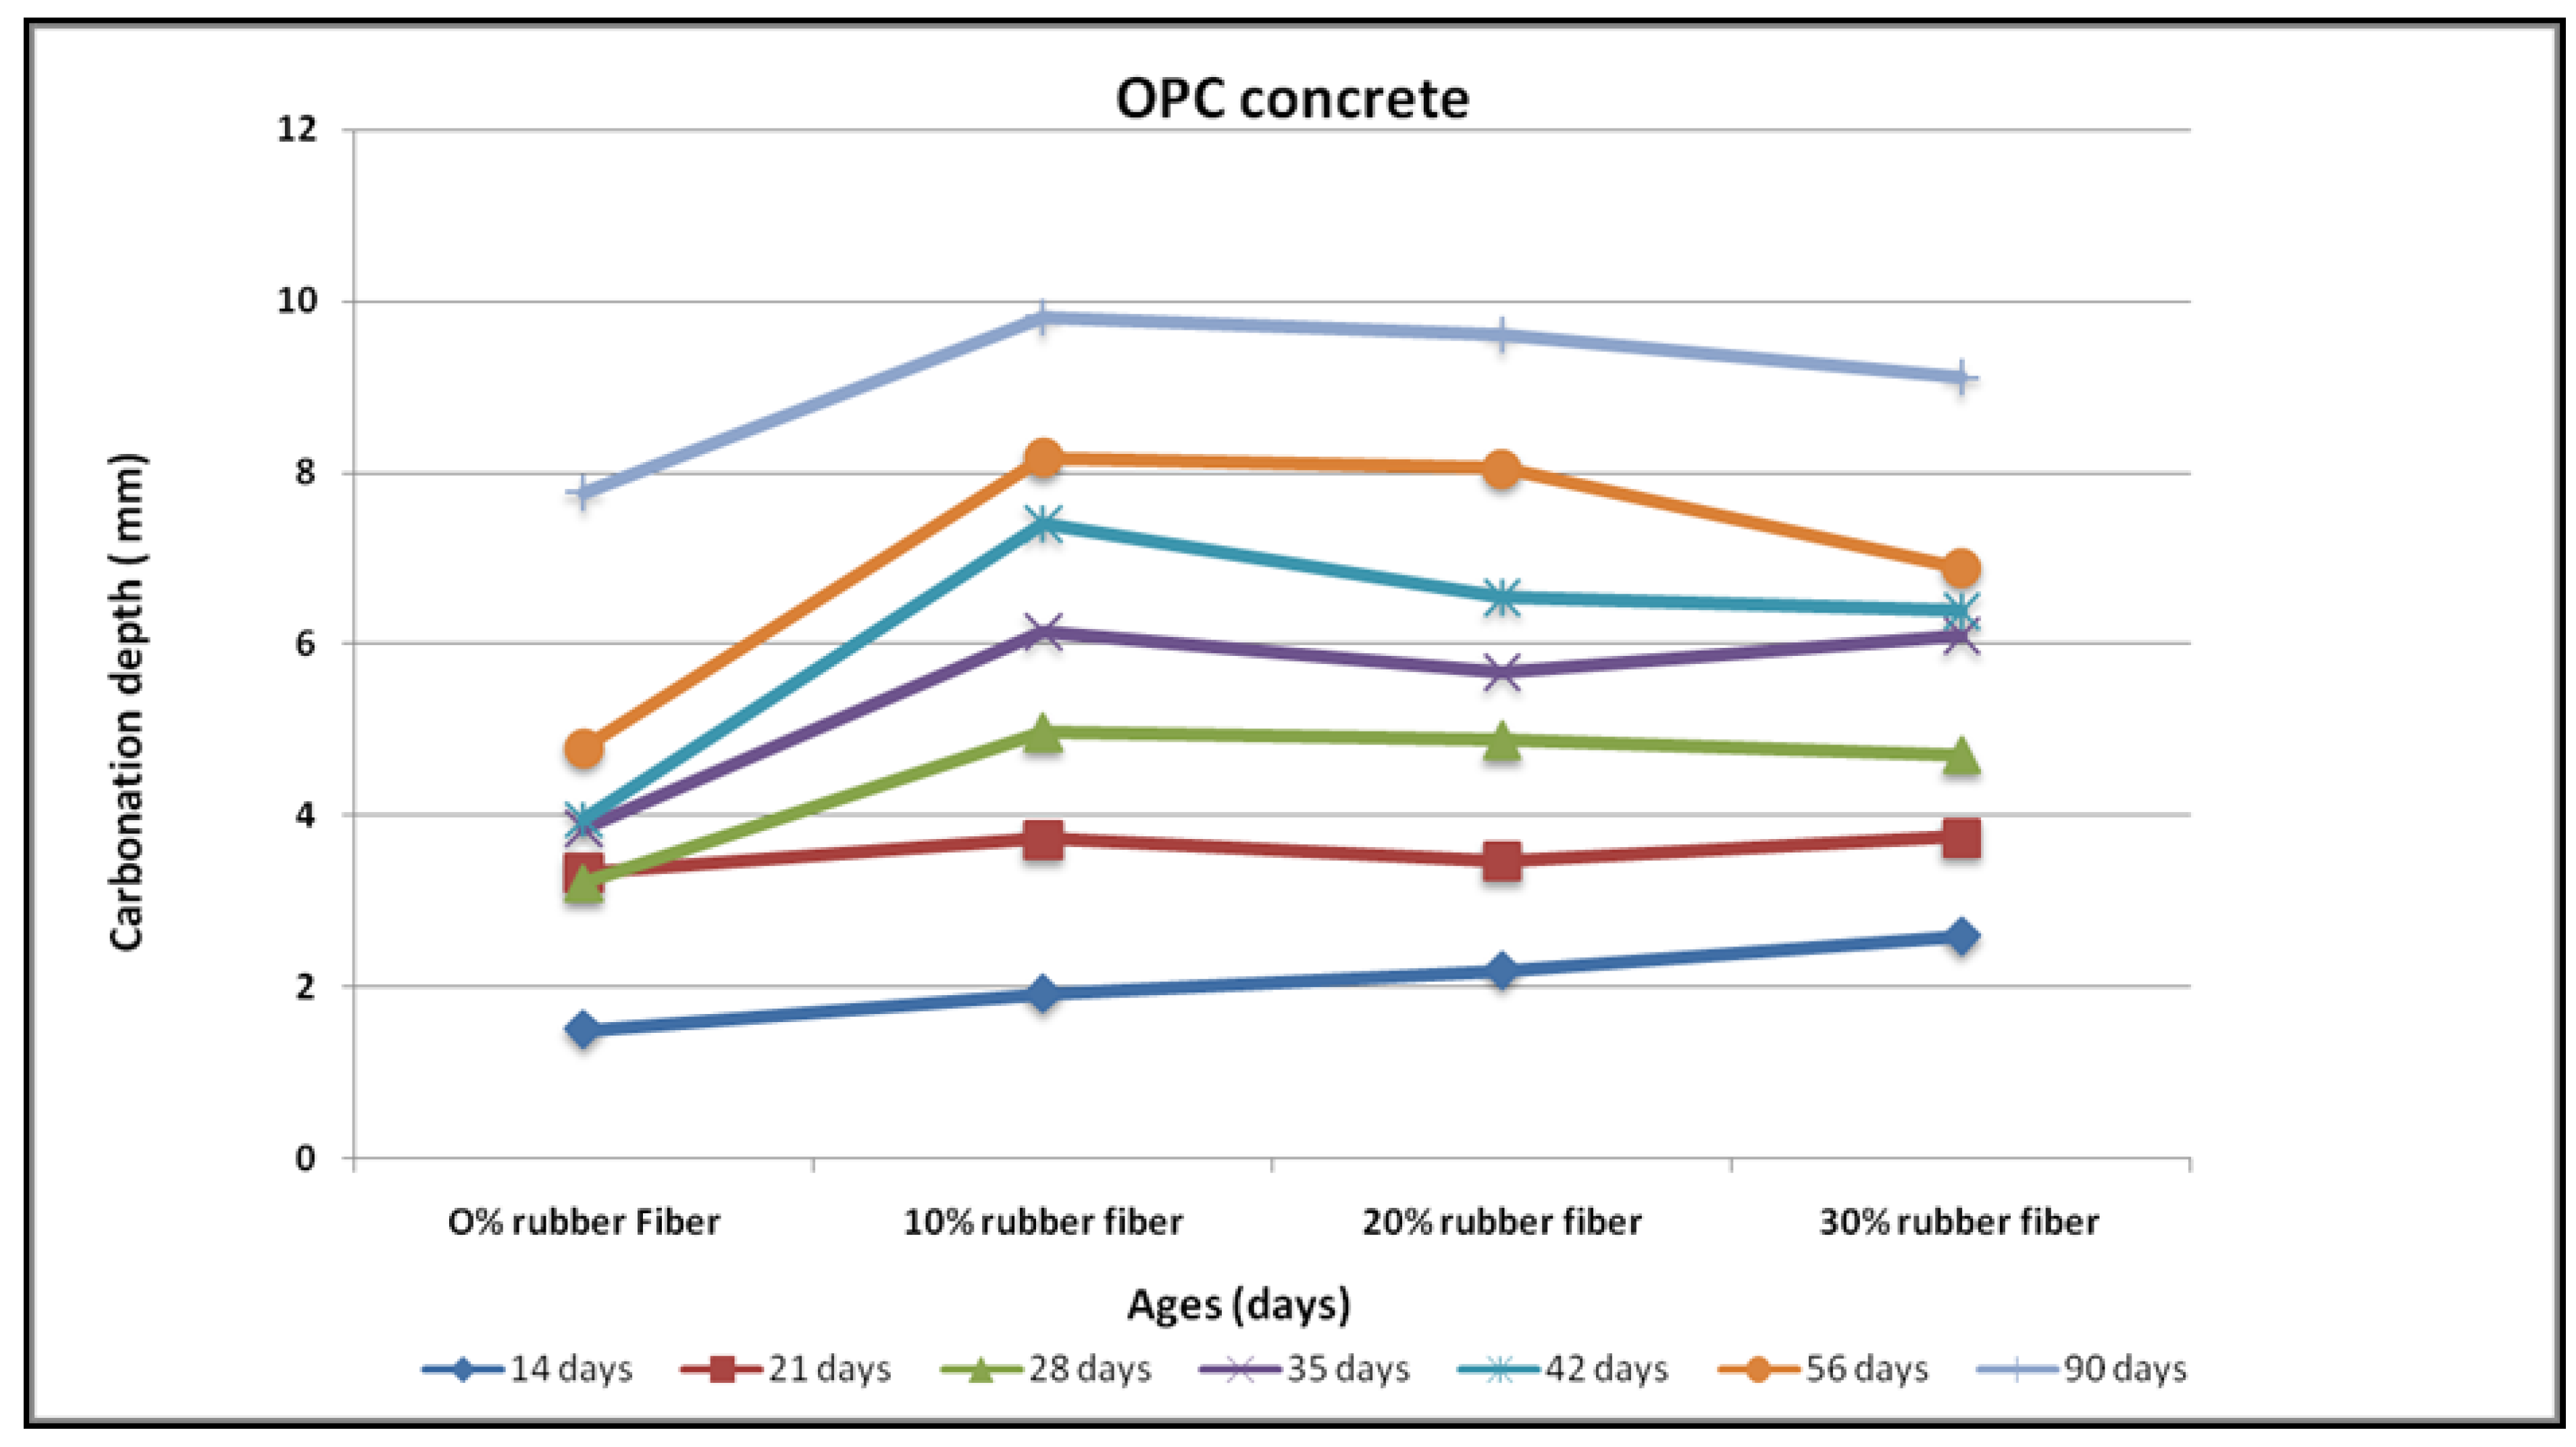
- Carbonation depth decreased with an increase in rubber content for any substitution level of fine aggregates by a rubber fibre. For geopolymer concrete with 30% fine aggregate replacement levels, a peak carbonation depth of 8.0 mm has been noted, whereas for OPC concrete at 90 days of exposure, a carbonation depth of 9.0 mm was observed on the same replacement level.
Author Contributions
Funding
Data Availability Statement
Conflicts of Interest
References
- Luhar, S.; Cheng, T.W.; Nicolaides, D.; Luhar, I.; Panias, D.; Sakkas, K. Valorisation of glass wastes for the development of geopolymer composites–Durability, thermal and microstructural properties: A review. Constr. Build. Mater. 2019, 222, 673–687. [Google Scholar] [CrossRef]
- Davidovits, J. Geopolymer Chemistry and Applications, 4th ed.; J. Davidovits: Saint-Quentin, France, 2015. [Google Scholar]
- Aly, A.M.; El-Feky, M.S.; Kohail, M.; Nasr, E.S.A. Performance of geopolymer concrete containing recycled rubber. Constr. Build. Mater. 2019, 207, 136–144. [Google Scholar] [CrossRef]
- Pacheco-Torgal, F. Introduction to handbook of alkali-activated cements, mortars and concretes. In Handbook of Alkali-Activated Cements, Mortars and Concretes; Woodhead Publishing: Cambridge, UK, 2015; pp. 1–16. [Google Scholar]
- Chen, R.; Li, Q.; Zhang, Y.; Xu, X.; Zhang, D. Pyrolysis kinetics and mechanism of typical industrial non-tyre rubber wastes by peak differentiating analysis and multi kinetics methods. Fuel 2019, 235, 1224–1237. [Google Scholar] [CrossRef]
- Fan, Y.; Fowler, G.D.; Zhao, M. The past, present and future of carbon black as a rubber reinforcing filler—A review. J. Clean. Prod. 2020, 247, 119115. [Google Scholar] [CrossRef]
- Why Source from Malaysia? Retrieved from Malaysian Rubber Export Promotion Council. 2014. Available online: http://www.mrepc.com/industry/industry.phpon (accessed on 12 November 2014).
- Natural Rubber Statistics 2014. Retrieved from Lembaga Getah Malaysia. Available online: www.lgm.gov.my/nrstat/nrstats.pdf (accessed on 12 November 2014).
- Rubber Statistical Bulletin. Rubber Statistical Bulletin, Rubber Board October–December 2017; Ministry of Commerce and Industry, Government of India: New Delhi, India, 2017.
- Shulman, V.L. Tire recycling. In Waste; Elsevier Inc.: Brussels, Belgium, 2019; pp. 489–515. [Google Scholar]
- ETRMA. End-of-life Tyre Report. Tyre and Rubber Recycling Magazine; European Tyre & Rubber Manufacturers’ Association (ETRMA): Brussels, Belgium, 2015; ELT management. [Google Scholar]
- Diaz, R.; Colomines, G.; Peuvrel-Disdier, E.; Deterre, R. Thermo-mechanical recycling of rubber: Relationship between material properties and specific mechanical energy. J. Mater. Process. Tech. 2018, 252, 454–468. [Google Scholar] [CrossRef]
- Yilmaz, A.; Degirmenci, N. Possibility of using waste tire rubber and fly ash with Portland cement as construction materials. Waste Manag. 2009, 29, 1541–1546. [Google Scholar] [CrossRef] [PubMed]
- Parveen, S.D.; Sharma, A. Rubberized Concrete: Needs of Good Environment (Overview). Int. J. Emerg. Technol. Adv. Eng. 2013, 3, 192–196. [Google Scholar]
- Ganjian, E.; Khorami, M.; Maghsoudi, A.A. Scrap-tyre-rubber replacement for aggregate and filler in concrete. Constr. Build. Mater. 2009, 23, 1828–1836. [Google Scholar] [CrossRef]
- Thokchom, S.; Ghosh, P.; Ghosh, S. Performance of Fly ash Based Geopolymer Mortars in Sulphate Solution. J. Eng. Sci. Technol. Rev. 2010, 3, 36–40. [Google Scholar] [CrossRef]
- Luhar, S.B.; Chaudhary, S.; Dave, U.V. Effect of different parameters on the compressive strength of rubberized geopolymer concrete. In Multi-Disciplinary Sustainable Engineering: Current and Future Trends; CRC Press: Boca Raton, FL, USA, 2016; pp. 77–86. [Google Scholar]
- Luhar, S.; Chaudhary, S.; Luhar, I. Thermal resistance of fly ash based rubberized geopolymer concrete. J. Build. Eng. 2018, 19, 420–428. [Google Scholar] [CrossRef]
- Luhar, S. Performance Evaluation of Rubberized Geopolymer Concrete and Fly Ash Based Geopolymer Mortar. PhD Thesis, Malaviya National Institute of Technology, Jaipur, India, 2018. [Google Scholar]
- Luhar, S. Fly Ash and Slag Based Geopolymer Concrete, Experimental Facts; Lambert Acedamic Publication, Europe: Chisinau, Republic of Moldova, 2015. [Google Scholar]
- IS: 3812-1981. Specification for y Ash for Use as Pozzolana and Admixture; Bureau of Indian Standards: New Delhi, India, 1981. [Google Scholar]
- Luhar, S.; Chaudhary, S.; Luhar, I. Development of rubberized geopolymer concrete: Strength and durability studies. Constr. Build. Mater. 2019, 204, 740–753. [Google Scholar] [CrossRef]
- IS: 383-1970. Specification for Coarse and Fine Aggregate from Natural Sources for Concrete; Bureau of Indian Standards: New Delhi, India, 1970. [Google Scholar]
- IS 10262-2009. Concrete Mix Proportioning—Guidelines; Bureau of Indian Standards: New Delhi, India, 2009. [Google Scholar]
- DIN 1048. Testing Concrete. Water Permeability; Part 5, Section 36; German Standards: Berlin, Germany, 1991. [Google Scholar]
- ASTM C1585—04. Standard Test Method for Measurement of Rate of Absorption of Water by Hydraulic-Cement Concretes; ASTM Standards: West Conshohocken, PA, USA, 2004. [Google Scholar]
- ASTM G109—07. Standard Test Method for Determining Effects of Chemical Admixtures on Corrosion of Embedded Steel Reinforcement in Concrete Exposed to Chloride Environments; ASTM Standards: West Conshohocken, PA, USA, 2013. [Google Scholar]
- ASTM C876—15. Standard Test Method for Corrosion Potentials of Uncoated Reinforcing Steel in Concrete; ASTM Standards: West Conshohocken, PA, USA, 2015. [Google Scholar]
- Olivia, M. Durability Related Properties of Low Calcium Fly Ash Based Geopolymer Concrete. PhD Thesis, Curtin University of Technology, Australia, 2011. [Google Scholar]
- Provis, J.L.; Deventer, J.S.J. Geopolymers, Structure, Processing, Properties and Industrial Applications; Woodhead Publishing Limited: Oxford, UK, 2009. [Google Scholar]
- Papworth, F.; Grace, W. Designing for Concrete Durability in Marine Environs, Concrete 85 Conference: The Performance of Concrete and Masonry Structures Brisbane; Institution of Engineers, Australia: Barton, ACT, Australia, 1985. [Google Scholar]
- Adam, A.A.; Molyneaux, T.C.K.; Patnaikuni, I.; Law, D.W. Strength, sorptivity and carbonation of geopolymer concrete. In Challenges, Opportunities and Solutions in Structural Engineering and Construction; CRC Press: Boca Raton, FL, USA, 2009. [Google Scholar]
- Rangan, B.V.; Wallah, S.E. Low Calcium y Ash Based Geopolymer concrete: Long-Term Properties; Research Report GC2; Faculty of Engineering Curtin University of Technology: Perth, Australia, 2006. [Google Scholar]
- Olivia, M.; Nikraz, H. Durability of Low Calcium Fly Ash Geopolymer Concrete in Chloride Solution. In Proceedings of the 6th Asian Symposium on Polymers in Concrete, Shanghai, China, 29–30 October 2009; pp. 153–161. [Google Scholar]
- Bakharev, T. Durability of geopolymer materials in sodium and magnesium sulfate solutions. Cem. Concr. Res. 2005, 35, 1233–1246. [Google Scholar] [CrossRef]
- Rilem Technical Committee 32-RCA, Seawater attack on concrete and Precautionary Measures. Mater. Struct. 1985, 18, 223–226. [CrossRef]
- Tikalsky, P.J.; Carrasquillo, R.L. Inuence of Fly Ash on the Sulfate Resistance of Concrete. ACI Mater. J. 1992, 89, 69–75. [Google Scholar]
- Lea, F.M.; Hewlett, P.C. The Chemistry of Cement and Concrete; Edward Arnold: London, UK, 1970. [Google Scholar]
- Neville, A.M.; Dilger, W.H.; Brooks, J.J. Creep of Plain and Structural Concrete; Construction Press: Loandon, UK, 1983. [Google Scholar]
- Reda, T.M.; El-Dieb, A.S.; Wahab, M.E.; Abdel, H. Mechanical, fracture and micro structural investigations of rubber concrete. J. Mater. Civ. Eng. 2008, 20, 640–649. [Google Scholar] [CrossRef]
- Davidovits, J. Properties of Geopolymer Cements, First International Conference on Alkaline Cements and Concretes; Scientific Research Institute on Binders and Materials, Kiev State Technical University: Kyiv, Ukraine, 1994; pp. 131–149. [Google Scholar]
- Gourley, J.T.; Johnson, G.B. Developments in Geopolymer Precast Concrete; The International Workshop on Geopolymers and Geopolymer Concrete: Perth, Australia, 2005. [Google Scholar]
- Song, S.; Jennings, H.M. Pore solution chemistry of alkali-activated ground granulated blast-furnace slag. Cem. Concr. Res. 1999, 29, 159–170. [Google Scholar] [CrossRef]
- Bakharev, T.; Sanjayan, J.G.; Cheng, J.B. Resistance of alkali-activated slag concrete to acid attack. Cem. Concr. Res. 2003, 33, 1607–1611. [Google Scholar] [CrossRef]
- Sofi, M.; Deventer, J.S.J.; Mendis, P.A.; Lukey, G.C. Engineering properties of in-organic polymer concretes (IPCs). Cem. Concr. Res. 2007, 37, 251–257. [Google Scholar] [CrossRef]


| Sr. No. | Composition | Unit | Obtain Value |
|---|---|---|---|
| 1 | Specific Surface area | m2/kg | 428 |
| 2 | Autoclave Expansion | % | 0.024 |
| 3 | Moisture Content | % | 0.23 |
| 4 | Reactivity of Lime | N/mm2 | 6.60 |
| 5 | Chemical Analysis | ||
| Ignition Loss | % | 0.94 | |
| Addition of Silica, Alumina, and ferric oxide content | % | 92.26 | |
| Silica | % | 58.88 | |
| Magnesium oxide | % | 1.64 | |
| Sulfur trioxide | % | 0.74 | |
| Sodium oxide | % | 0.50 | |
| Total content of Chlorides | % | 0.025 |
| Sr.No | Parameters | Value |
|---|---|---|
| 1. | Sodium silicate -Sodium hydroxide ratio | 2.5 |
| 2. | Additional water content | 5% |
| 3. | Curing time | 48 h |
| 4. | Alkaline liquid to fly ash ratio | 0.4 |
| 5. | Sodium hydroxide Concentration | 14 M |
| 6. | Rest period | 1 day |
| 7. | Admixture dosage | 2% |
| 8. | Curing temperature | 90℃ |
| Mix Praportion | Rubber Fiber | Fine Aggregate kg/m3 | Fly ash kg/m3 | Cement kg/m3 | Coarse Aggregate kg/m3 | NaOH kg/m3 | Na2SiO3 kg/m3 | Admixture kg/m3 | Water Content kg/m3 | |
|---|---|---|---|---|---|---|---|---|---|---|
| 20 mm | 10 mm | |||||||||
| GP-0 | 0.0 | 656.25 | 446.43 | -- | 731.25 | 487.5 | 51.02 | 127.55 | 8.93 | 22.32 |
| GP-10 | 26.9 | 629.35 | 446.43 | -- | 731.25 | 487.5 | 51.02 | 127.55 | 8.93 | 22.32 |
| GP-20 | 53.80 | 602.55 | 446.43 | -- | 731.25 | 487.5 | 51.02 | 127.55 | 8.93 | 22.32 |
| GP-30 | 80.71 | 575.64 | 446.43 | -- | 731.25 | 487.5 | 51.02 | 127.55 | 8.93 | 22.32 |
| CC-0 | 0.0 | 656.25 | -- | 446.43 | 731.25 | 487.5 | -- | -- | 8.93 | 160.71 |
| CC-10 | 26.9 | 629.35 | -- | 446.43 | 731.25 | 487.5 | -- | -- | 8.93 | 160.71 |
| CC-20 | 53.80 | 602.55 | -- | 446.43 | 731.25 | 487.5 | -- | -- | 8.93 | 160.71 |
| CC-30 | 80.71 | 575.64 | -- | 446.43 | 731.25 | 487.5 | -- | -- | 8.93 | 160.71 |
| Properties Evaluation | Experiments | Age of Testing (Days) | Standards |
|---|---|---|---|
| Durability Properties | Water Permeability | 28 | DIN-1048 |
| Shrinkage | 7,14,21,28,35,49,63,77,91,180,365 | -- | |
| Sorptivity | 28,90,365 | ASTM C 1585-04 | |
| Carbonation resistance | 14,21,28,35,42,56,90 | CPC-18 RILEM | |
| Salt attack resistance | 7,28,84,162,365 | Past literature | |
| Sulphate attack resistance | 7,28,84,162,365 | Past literature | |
| Acid attack resistance | 7,28,84,162,365 | Past literature | |
| Corrosion resistance | 30,60,90,120,150,180, 210,240,270,300,330,360 | ASTM G-109 ASTM C 876-15 | |
| Chloride Diffusion | 28 | ASTMC-1556 |
Publisher’s Note: MDPI stays neutral with regard to jurisdictional claims in published maps and institutional affiliations. |
© 2021 by the authors. Licensee MDPI, Basel, Switzerland. This article is an open access article distributed under the terms and conditions of the Creative Commons Attribution (CC BY) license (https://creativecommons.org/licenses/by/4.0/).
Share and Cite
Luhar, S.; Luhar, I.; Nicolaides, D.; Gupta, R. Durability Performance Evaluation of Rubberized Geopolymer Concrete. Sustainability 2021, 13, 5969. https://doi.org/10.3390/su13115969
Luhar S, Luhar I, Nicolaides D, Gupta R. Durability Performance Evaluation of Rubberized Geopolymer Concrete. Sustainability. 2021; 13(11):5969. https://doi.org/10.3390/su13115969
Chicago/Turabian StyleLuhar, Salmabanu, Ismail Luhar, Demetris Nicolaides, and Rajesh Gupta. 2021. "Durability Performance Evaluation of Rubberized Geopolymer Concrete" Sustainability 13, no. 11: 5969. https://doi.org/10.3390/su13115969
APA StyleLuhar, S., Luhar, I., Nicolaides, D., & Gupta, R. (2021). Durability Performance Evaluation of Rubberized Geopolymer Concrete. Sustainability, 13(11), 5969. https://doi.org/10.3390/su13115969