Abstract
This paper presents a methodology to study the connectivity that livestock trails can offer to guarantee the transit of organisms and access to pasturelands. In this regard, a connectivity analysis was carried out in two scenarios: Basic Scenario (Scenario 1: pasture) and Extended Scenario (Scenario 2: pasture + livestock trails) by using the Morphological Spatial Pattern Analysis (MSPA). The result of structural connectivity analysis, MSPA, showed that livestock trails reduce the fragmentation of the optimal terrain (pasturelands) for livestock activity, since the effective corridors are more numerous, and the edge effect is also reduced. Therefore, MSPA analysis allows the classification of any landscape typology at the pixel level and mapping of corridor structures (connecting elements) and other categories of spatial patterns on a continental scale. The results of the study show the importance of carrying out this type of analysis in different times of the year, detecting the evolution of connectivity throughout the year. Spring months and larger areas of pastureland offer the best conditions for the movements of organisms. This study aims to provide useful information for landscape or territorial planning, and it could be used to improve the management of wildlife dependent on high quality pastures, as well as to promote the management of semi-extensive livestock.
1. Introduction
Nowadays, landscape is highly fragmented as a consequence of anthropogenic impacts over the last decades [1,2]. As a result of this fragmentation, many portions of land remain isolated from other portions of land, dividing ecosystems. This implies a reduction in natural resource transference and species dispersion [3]. It is essential to avoid isolated patches in order to maintain their ecosystem sustainability. Hence, the definition and application of connectivity criteria is one of the most powerful tools used for nature conservation. In this sense, and following Gurrutxaga and Lozano [4], the capacity of the land to allow the displacement of organisms between land patches with resources is called structural connectivity. Ecological corridors make this connectivity possible and should be considered as an essential resource in the evaluation of biodiversity and biological conservation [5]. In addition, ecological corridors provide transference of natural resources and organisms necessary to ensure ecosystem sustainability [6].
Grazing land detection is essential to establish correct landscape planning for pasturelands, as they are considered as beneficial or essential for certain species of wild flora and fauna [7]. In fact, previous research, such as that carried out by Šálek et al. [8,9], have shown the role played by trails for fauna to carry out intra- and interspecific relationships, and therefore for the functioning of the ecosystem. The establishment of a network that communicates pasturelands may connect wild species in order to disperse [10,11]. In addition, this correct planning of pastures can be used in the management of livestock in a semi-extensive regime, reducing the current high energy costs derived from the development of this type of activity which seriously compromises its future. Due to this fact, there has been a proliferation of studies and research [12,13,14,15,16,17,18,19] on agro-ecological models for livestock management that sustainably promote and encourage rural development and other social purposes, biodiversity, environmental and landscape protection, traditions and culture. Therefore, it is absolutely necessary to carry out adequate management of those pasturelands that can be used for the dispersal of species that depend on this type of habitat, ensuring ecosystem sustainability [20].
MSPA connectivity analysis provides information on the different morphological classes that make up a territory in terms of structural connectivity [21]. In addition, MSPA connectivity analysis considers the network components and the node/connector analysis through indexes that reveal information on the functional connectivity of the territory. This functional connectivity can be defined as “the land’s ability of the land to allow the movement of organisms among patches with resources” [4]. Through connectivity analysis and fragmentation of grasslands, it is possible to define their conservation status [22] as well as contribute to their survival [23]; where the spatial resolution of the mapping information used as a basis is extremely important as it can influence the results of MSPA analysis and the PC index [24]. Despite the fact that remote sensing has been used for decades in the identification of grasslands [25], the production of high resolution satellite images that can be used as inputs in studies of this type is currently the most common practice [26]. Previous research has used remote sensing for pasture management and fragmentation [27,28,29] According to Vogt et al. [5], land cover maps obtained from remote sensing are widely used to assess and compare landscape patterns and connectivity elements across broad geographic regions.
In this study, we provide useful information for landscape or territorial planning in order to improve wildlife management dependent on high quality pastures, as well as to promote the management of semi-extensive livestock. Specifically, we aim: (1) to identify and characterize pastureland areas; (2) to analyze the connectivity of the territory through livestock routes in order to guarantee the dispersion and accessibility to pastureland areas of those species that require this type of habitat to survive. Through the methodology presented in this paper, we evaluate how livestock trails can guarantee the transit of organisms and access to pasturelands. This provides useful information for landscape or territorial planning, and it could be used to improve the management of wildlife dependent on high quality pastures, as well as to promote the management of semi-extensive livestock. Therefore, knowing the best connectivity between pasturelands, livestock management may be improved, and the optimal ecosystem sustainability may be ensured.
2. Material and Methods
2.1. Study Area
The study was developed within the Spanish province of Málaga in south Spain (Andalusia region), which covers a total area of 7306.34 km2.
The province of Málaga is one of the Spanish provinces with the highest quantity and quality of pastureland. For this reason, Málaga has an enormous richness of fauna that depends on this type of habitat to survive. Furthermore, the study area has important portions of land with pastures of great quality that have been used from ancient times to develop a breed of native goat, called the Malagueña goat. Nowadays there are more than 1500 farms of this native goat in the study area (SIGGAN, 2019), as shown in Figure 1.
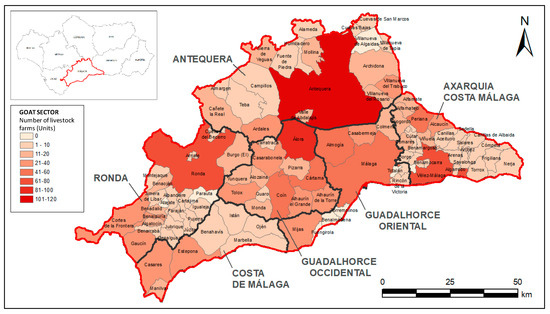
Figure 1.
Number of goat farms by municipal term in the province of Málaga. From: Identification and registration database Andalusia-SIGGAN (2019).
2.2. Material
The following cartographic material has been used as a starting point for this study:
- CORINE Land Cover Cartography (CLC): Most recent land cover map in Spain (year 2018). This cartography recognizes a total of 44 classes in its nomenclature.
- SIOSE: Detailed cartography at a scale of 1:10,000 produced within the framework of the SIOSE-Andalusia project in 2013.
- Andalusian livestock trails: it is a linear vectorial layer that is updated periodically. A total of 7 classes of livestock trails are recognized in Andalusia, distributed among main typologies, secondary and other categories, which are shown in Figure 2.
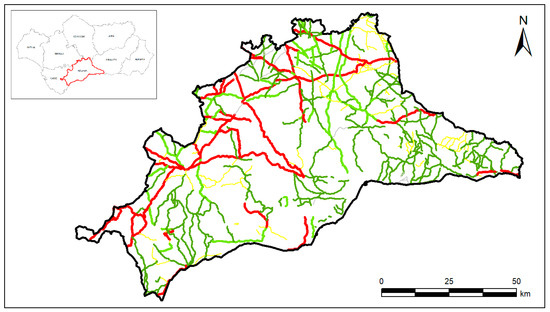 Figure 2. Málaga livestock trails network. From: Ministry of Environment and Territorial Planning-Government of Andalusia (2015).
 - SENTINEL 2A: each satellite image used in this work covers 100 × 100 km2. Between 4 and 5 images were needed to cover the entire area in each time interval, and must meet the following criteria: geographical area (Málaga province), date of image capture (April 2016, October 2016, May 2017, October 2017, May 2018), satellite mission (Sentinel 2a), cloudiness percentage (<5%). Considering the seasonal variability of the pastures, it is important to highlight that the search for images with less cloudiness has been focused on the spring (corresponding with the grassland peak production) and autumn periods, as this is when they are most available [10,15,30,31].
- National Plan of Aerial Orthophotography (PNOA): orthophotographs created in the year 2016 have been used: north zone of Andalusia (resolution 0.5 m/pixel—distribution of sheets 1:10,000) and south zone (resolution 0.25 m/pixel—distribution of sheets 1:5000).
2.3. Methods
The general procedure of this paper is represented in the following flowchart (Figure 3). In this general methodology, all the phases are described, starting from (1) the analysis of types of land uses optimal for fauna, (2) the detection of the types of land uses selected with remote sensing techniques, (3) the connectivity assessment for these types of land uses and (4) the evaluation of livestock pathways in terms of their connector function for these types of land uses favorable for the dispersion of fauna along the territory.
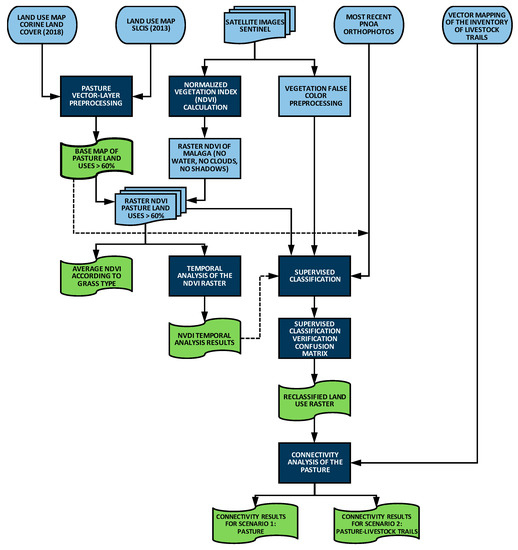
Figure 3.
Processing data flowchart.
The first step of the followed methodology was the pre-processing of land uses defined and mapped as pasture according to Corine Land Cover (2018) and the Spanish Land Cover Information System (2013). Integrating these maps, the Base Map of areas with a pasture content >60% was generated.
On the other hand, satellite images of Spring (April–May) and Autumn (October) of the period 2016–2018 in the province of Málaga were used to calculate the Normalized Vegetation Index (NDVI). Likewise, NDVI values were calculated from randomly selected training samples according to the soil type in the study area, so that it was possible to determine an average NDVI according to grass type.
A temporal analysis of the NDVI raster was then carried out to identify possible significant alterations in land uses between the periods studied, and to determine the optimum time to carry out the supervised classification of land uses. Likewise, with the initial satellite images, their pre-processing allowed the obtainment of a false color composition that highlights the vegetation.
The next step was to carry out the supervised classification of the false color satellite images from regions of interest (ROIs) or patterns created by the visual observation and analysis of the most recent PNOA orthophotos and land use base map. The results were then verified, and the reliability determined using a confusion matrix. In this way it was possible to obtain the reclassified land use map, which served as the basis for the subsequent connectivity analysis of the study area.
The MSPA connectivity analysis of the pasture categories was carried out for two possible scenarios: Basic Scenario (Scenario 1: Pasture) and Extended Scenario (Scenario 2: Pasture + Livestock trails). The obtained result reflects the segmentation of the elements that make up the landscape of land with high grass content (>60%) in the study area.
In addition, the connectivity of livestock trails was analyzed, quantifying the contribution of livestock trails to land connectivity. Area statistics were determined based on the results of the analysis of nodes/connectors of this process, defining the index of importance of connectivity PC (%) for each of the livestock trails considered.
2.3.1. Base Map of Uses Soils with Grass Content >60%
The areas with ideal pasture use are those with a pasture content of >60%. These areas should have a tree density of <40% [32], so that the trees do not limit the use of the animals [33]. In addition, areas with pasture content >60% have feeds with higher energy value and nutritional quality.
To obtain the Base Map of Land Uses with pasture content >60%, two maps were taken as a basis. On the one hand, the Corine Land Cover—CLC—Year 2012 (EEA, 2016) was considered, from which the 10 classes selected in the study [30] were taken as a basis. On the other hand, the cartography of the Information System on Soil Occupation of Spain—SIOSE-Andalusia—Year 2013 (Junta Andalucía, 2018) was used, which identified 22 classes of pasture potential (pasture content >60%).
By means of an intersection of the Corine Land Cover map and the SIOSE map, a mapping of land uses with a percentage of pasture >60% was obtained.
2.3.2. NDV Index: NDVI Average by Soil Class and NDVI Temporal Analysis
The Normalized Differential Vegetation Index (NDVI) was calculated from the reflectance values of the red band (RED-Band 04) and Near Infrared (NIR-Band 08) of the Sentinel 2A multispectral images, applying the expression of Rouse et al. [34] (Equation (1)):
This procedure was carried out independently and repeated in its entirety for each of the dates of interest considered in this study. To cover the entire study area, a composition of four–five Sentinel 2A satellite images was required for each date (April 2016, October 2016, May 2017, October 2017, May 2018). Also, each composition was made in duplicate and independently, for band 04 and band 08 respectively. The final result of the procedure was a set of raster files containing NDVI index information for the high grass content soils (>60%), for each date of the study.
Through the tool “Zonal statistics as a table” of the ArcMap 10.5 software, the statistical averages of the NDVI were calculated according to the date and land use category of the CLC (2012) and SIOSE (2013) classification: maximum values, minimum values, average values, and standard deviation.
For the NDVI temporal analysis, two raster files taken at different times were compared, and the results were reflective of changes in vegetation and/or land use during the time period under consideration. According to San Miguel-Ayanz [10], the predominant grasses in the study area are terophytic and xero-mesophytic, which present production peaks in spring and to a lesser extent in autumn; being very low and/or null in summer and winter. For this reason, the periods of spring and autumn were taken as a reference.
The space-time analysis was carried out from two independent approaches:
- Spatial-temporal analysis of NDVI changes (spring-autumn): quantifies differences between pairs of values in the time series and allows their comparison. It aims to analyse the evolution of the intervals with high availability of grass during the period considered.
- Space-time analysis of NDVI changes (spring): quantifies the annual changes produced between pairs of values exclusively from the spring season. It tries to study the patterns of the interval where land uses (>60% grass) register great differences between them.
The results of the spatial-temporal analysis of the NDVI index provide valuable information for land use typification during the supervised classification process of satellite images, as well as for their interpretation.
2.3.3. Supervised Digital Classification of Images and Verification of Digital Classification Using the Confusion Matrix
The methodology used was an adaptation of the one proposed by García Abril, et al. [35], which considers that chlorophyll pigments absorb most of the electromagnetic radiation in the visible spectrum (400–700 nm), especially 430 nm (Blue) and 660 nm (Red), which means a lower reflectance registered in those bands [36]. In contrast, plants show their highest reflectance in the Near Infrared (NIR) region at 700–1300 nm [37]. The false color composition of the Sentinel bands (8A, 4, 3) allows the areas with the most vegetation to be highlighted in reddish tones of greater or lesser intensity [38,39].
Figure 4 shows the combination of bands used in the study, being the most appropriate resolution to identify pastureland of R = 10 m.
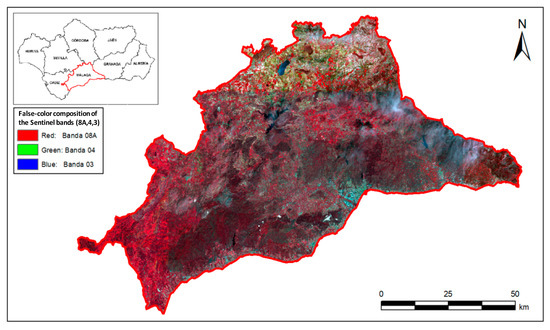
Figure 4.
Identification of grasslands in Málaga province through of García Abril’s methodology (May 2018).
Examples of formation (polygons delimiting homogeneous zones with spectral signature values representative of each land cover class) were then collected in order to identify samples of each land cover category. Depending on the number of bands in the image (n), the optimal number of pixels for each formation example is between 10 n and 100 n [40]. The classes were then edited, a process that allowed for evaluation of the robustness of the supervised classification using the Kappa index, according to the scale of Landis & Korch [41].
The next step was the creation of the signature file that served as the basis for the final geoprocessing using the Maximum Likelihood Classification [40]. This maximum likelihood method is the most sophisticated and widely used method in the field of remote sensing with satellite images of Mediterranean landscapes [42,43,44]. The reclassified raster image obtained should be cleaned by post-processing mechanisms [45].
The configuration that showed the best results in the study area, and therefore was applied, was: number of neighbors (n = 8) and threshold of replacement by majority (5/8 of contiguous cells with equal value). The accuracy of the spatial data derived from the use of remote sensing techniques and analysis with Geographic Information Systems (GIS) [46] requires evaluation, since the final quality of a classification method can be determined from a precision coefficient [44]. In this sense, the confusion matrix is considered to be the most appropriate method for the present study, since it has been previously used in other similar studies [35,42]. According to Darpan et al. [47], the confusion matrix method evaluates, on the basis of a comparison between classes, the relationship between a series of reference data and the corresponding values resulting from the classification (“accuracy assessment points”).
First, a total of n = 500 accuracy assessment points were created, and randomly distributed among the different soil classes [48] in such a way as to comply with the recommendation of Congalton, Oderwald & Mead [49], which establishes a minimum threshold of 50 pixels for each soil category. In addition, the reliable value (“ground truth”) was incorporated and assigned individually for each point [35].
The classification field of the output table was then updated with the land use values generated by the supervised classification. The output file obtained was used to calculate the confusion matrix. The result is a table indicating the accuracy for the determination of values in each of the classes, as well as the Kappa index [46], which provides an overall assessment of the accuracy of the classification with respect to a totally random classification. In addition, the confusion matrix shows the precision obtained for each category and the conflicts between them [44,50].
2.3.4. Connectivity Analysis and Assessment
Structural Connectivity Analysis (MSPA)
The connectivity analysis was performed using the MSPA (Morphological Spatial Pattern Analysis) tool integrated in the Guidos Toolbox 2.8 software [51]. The MSPA consists of a sequence of mathematical morphological operators adjusted to the description of the geometry and connectivity of the components of an image [52,53].
The “Soil Classification Raster Map” obtained in the supervised classification of images was taken as a starting element. The classification process of the MSPA is governed by a single edge width parameter or parameters and, in this sense, Vogt [54] considers it acceptable to use an arbitrary scale analysis; which implies not defining edge width (n = 1).
The analysis of the network components was carried out using the Network Component Analysis tool, available in the Guidos 2.8, which creates a Network composed of Nodes and Links, grouping into components those that are interconnected.
Connectivity Index (PC)
At the same time, a connectivity evaluation was carried out using the Conefor Sensinode 2.6 software [55] which allows the importance of habitat areas (pastureland, in this specific case), and the different connecting elements, to be quantified with respect to maintenance and improvement through the PC index, selected as the reference indicator in this study.
The connectivity analysis was carried out for two scenarios: Basic Scenario (Scenario 1: Pasture) and Extended Scenario (Scenario 2: Pasture + Livestock trails).
Saura & Pascual-Hortal [56] define the connectivity probability index (PC) as the probability of two individuals randomly located in the landscape falling into habitat areas that are passable (interconnected) given a set “n” of habitat fragments and connections (pij) between them. They also consider this to be the index that best identifies the most critical elements of the landscape to maintain its connectivity from the perspective of habitat availability.
The connectivity probability index (PC) is a graphical method based on the availability measurement that quantifies functional connectivity [57]. In general, the PC index is considered to be a sufficiently suitable method to adapt to a wide range of situations with different levels of detail and data availability in connectivity analysis, both to characterize the connections between habitat fragments and to determine their attributes [56].
The hierarchy and classification of landscape elements (fragments and connecting elements), based on their contribution to the overall availability of habitat and connectivity, can be calculated from the percentage of variation (dPCk) experienced by the PC index, originated by the removal of each individual element (“k”) of the landscape [56,58,59].
Saura and Rubio [56] propose the disaggregation of the dPCk index according to the ways in which a given habitat fragment (“patch”) contributes to its connectivity and availability in the landscape; resulting in the following fractions (Equation (2)):
The analysis of livestock pathways that allows the evaluation of their contribution to the connectivity of the pastures of interest in the study area was based on the percentage of variation (dPCk) experienced by the PC index. In this way, the importance of each element in maintaining the overall accessibility of the habitat is weighted using the spatial analysis tools (“spatial analyst”) available in the desktop version ArcMap 10.5 (ArcGIS) software.
The calculation of the importance of connectivity based on the PC-infinite index is analyzed assuming that movement through the Links is always possible regardless of their length, since we are working with a wide spectrum of livestock species with very different movement capacities [23,55].
3. Results and Discussion
3.1. Base Map of Land Uses
The province of Málaga offers a potential area of pasturelands (>60%) of 48,562.73 ha, equivalent to 6.65% of the total provincial area. The percentage distribution according to livestock regions is concentrated in Ronda (40.1%), Antequera (19.2%) and Costa de Málaga (15.7%). In these areas, there are many mountainous areas with environmental protection, as well as a lesser presence of intensive/irrigated agriculture compared to the regions of Guadalhorce Occidental and Guadalhorce Oriental, where there are many orchards of citrus fruits, vegetables, vineyards, olive groves, cereals and even tropical crops or stone fruits.
The region of La Axarquia recorded the lowest percentage of suitable area (5.3%). This is explained by the fact that, in recent decades, irrigated agriculture has greatly intensified in the area, being devoted to the cultivation of tropical fruits (avocado, mango, custard apple, papaya), horticulture and, to a lesser extent, stone fruits and vineyards. Figure 5 shows the distribution of pastures >60% on the vectorial base map of land cover by livestock regions.
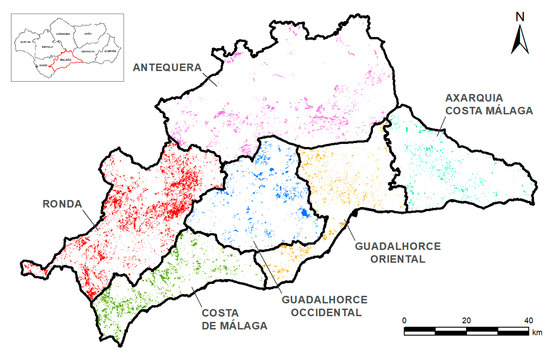
Figure 5.
Surfaces suitable for grazing in the different regions of the study area (Málaga).
As for the land uses, it can be generalized that the province of Málaga has two basic uses of the land: pastureland and brushland, which admit different combinations: with or without trees and with or without the presence of clearings, rock and bare soil.
3.2. NDVI Index
3.2.1. Average NDVI Index by Soil Class
The highest averages of NDVI were seen in the categories of land uses containing tree stands (NDVIMáx. > 0.5) both in agroforestry and/or forest systems (CLC, 2012) and in the different types of wooded pastures (SIOSE, 2013); with the exception of scattered coniferous wooded pastures (NDVIMáx. = 0.43). The lowest averages of NDVI were seen in the categories of land uses with less vegetation (NDVIMin. < 0.3): rocky, agricultural land with natural vegetation spaces, sparse vegetation spaces (CLC, 2012) or grassland and/or brushland with rock and soil clearings (SIOSE, 2013).
Land devoted to grazing (including meadows and pastures) at times of maximum vigour, of a general nature, presents a higher NDVI value than land devoted to brushland, in any of the subcategories. Chlorophyll pigments absorb a high amount of electromagnetic radiation in the visible spectrum at wavelengths of 430 nm (blue) and 660 nm (red), dissipating less reflectance in these bands [36].
There are empirical models that demonstrate a strong statistical relationship between chlorophyll activity and leaf area index (LAI) and water content of grass covers, which do not occur in other vegetation types such as trees and shrubs [60]. From the expression of the NDVI [34], it follows that vigorous grasses (high chlorophyll content) with low values in the 04 band (red) offer high NDVI.
The temporal evolution of the NDVI values between spring and autumn shows a high seasonality of grasses. In the study area, there is a high availability in spring while the supply of grasses decreases significantly in autumn, in accordance with the characterization of the grasses in the study area by Castel et al. [13]; Mena et al. [14]; among others. It should also be noted that the seasonal dynamics obtained coincide with the modulation foreseen by San Miguel-Ayanz [10] for terophytic and xero-mesophytic grasses. The results confirm that the NDVI values recorded in the spring are much higher (+30–50%) than those obtained in the autumn during the period 2016–2018 in all the land cover categories considered.
Theoretically and at the global level of the study area, it is estimated that land with grass content >60% offers the greatest reserve during the spring. However, there are numerous uncertainties that suggest that the above statement should be considered with caution. Detailed information is not available on a small scale with statistical treatment of other variables (rainfall, orientation, sunshine, altitude, etc.), which could reveal exceptions, especially in high mountain areas. Also, the time period considered is too short; however, there are no previous Sentinel 2A satellite images (R = 10 m) to determine the NDVI.
It should also be noted that the average NDVI values obtained in the autumn are very similar, and it is difficult to distinguish between them. For this reason, the spring NDVI values are the only ones consulted during the supervised image classification process for the assignment of soil typologies, since they show significant differences between them.
3.2.2. Temporary NDVI Analysis
The spatial–temporal analysis of the NDVI indexes calculated from satellite images, taken at different dates in the period 2016–2018, allows the identification and quantification of changes in land use coverage.
Table 1 presents data on the area (ha) and percentage (%) computed at each level of the spatial–temporal analysis of variations in the NDVI index between pairs of dates in the period 2016–2018.

Table 1.
Space–time analysis of NDVI index variations during period April 2016–May 2018.
This table shows that globally in the study area there are differences in the available grass reserve in spring and autumn in the period 2016–2018. Between 28.4% and 36.1% of the grazing area undergoes a moderate change, while another relevant portion (13.8% and 26.0%) undergoes serious variations. Nevertheless, it should be noted that the percentage of surface area of areas presenting no and/or very slight changes was between 37.1% and 57.8% of the total surface area. The interannual comparison carried out in spring shows few really significant changes affecting grass availability, which denotes a certain homogeneity of NDVI values. This implies that the images corresponding to the spring period can be used to classify land use since it shows little variability during that period.
The following Figure 6 shows the maps of variations in the NDVI index in lands with grass content >60% during the period 2016–2018, according to the type of change.
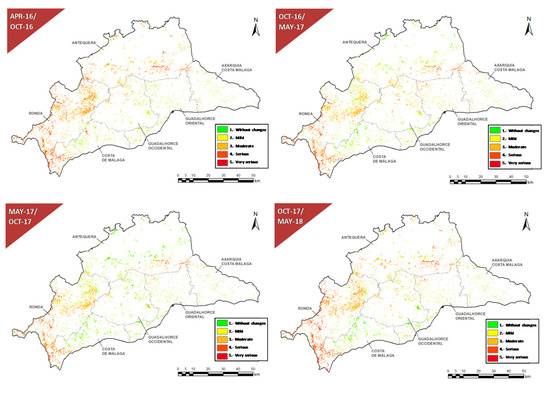
Figure 6.
NDVI index variation maps from April 2016 to May 2018.
In Figure 6, above, it can be seen graphically that the distribution of variations in pasture availability are mainly concentrated in the north and west of the study area. Phytoclimatological factors (thermotype, altitude, exposure, latitude, wind, etc.), and even the Foehn effect, have an effect on the typology, structure and functioning of the pastures [10]. Therefore, the different bioclimatic conditions of the mesomediterranean floor [61,62] that register the areas located in the northwest of the province of Málaga could be one of the main causes that define the trend in pasture availability.
Once the analysis of livestock regions was carried out, it was possible to verify that the regions of Ronda, Antequera and, to a lesser extent, the coast of Málaga, showed changes in the NDVI index that were moderate (73.2–78.6%) and severe (87.3–94.6%). Likewise, it was observed that the northern and western areas of the province of Málaga show the greatest seasonality of pastures with the highest differences in availability throughout the year, although they register the greatest area and reserves.
Finally, it should be noted that the composition of May 2017 is taken as the starting point for the supervised classification of images because it is the most balanced campaign of the time series (2016–2018), accumulating the lowest percentage of changes in values of NDVI of high significance.
3.3. Supervised Maximum Likelihood Classification of Land Cover
The supervised classification of land with grass content >60%, which occupies an area of 48,562 ha, reveals that there are four main categories of land cover: grassland-brushland (11,103 ha); grassland-brushland with little vegetation (20,899 ha); grassland-brushland with trees (13,318 ha); rock and/or bare ground (3342 ha). Table 2 shows the surface data (ha) for each of the livestock districts, which allows for the interpretation and comparison of the results obtained for each soil category between the different areas of the study area.

Table 2.
Supervised classification surface (ha) by category and region.
At a global level, the majority of land use is made up of the grassland-brush categories without trees (65.9%); although a significant proportion (43%) of this presents areas of scarce vegetation that may mean less food reserves (quantitative level).
Figure 7, below, shows the map of land cover distribution according to categories of the supervised classification of images by maximum likelihood.
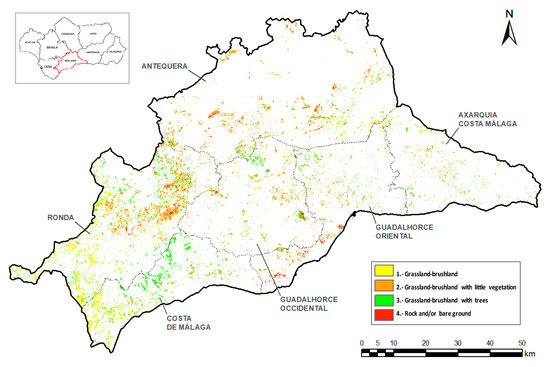
Figure 7.
Grassland distribution map according to supervised classification categories and Málaga livestock regions.
The zonal analysis of the distribution of the targeted land cover according to the livestock regions of the study area reveals that there are two distinct blocks in the Province of Málaga. On the one hand, the north-western block: Antequera, Ronda and Málaga Coast; on the other, the south-eastern block: Guadalhorce Occidental, Guadalhorce Oriental and Axarquia.
It should be noted that the north-eastern block (36,418 ha) offers a greater availability of land with pasture content >60%, constituting 90.3% of the land dedicated to pasture-brush (10,023 ha) in the study area, as well as 68.8% of the pasture-brush with scarce vegetation (14,392 ha). In the same way, it occupies the largest area of pasture-brush with trees (9954 ha), which represents 74.8% of the total study area. Finally, it should be noted that the region of Ronda has a total area of land with pasture content >60% (19,841 ha), which is much larger than the rest of the regions.
As for the south-eastern block (12,144 ha), pasture-brush with scarce vegetation (6507 ha) represents the majority of the area. This demarcation presents less seasonality of pastures (spring–autumn) due to the homogeneous distribution of land uses with less presence of pastures and little variation throughout the year.
Verification of Digital Classification Using the Confusion Matrix
Table 3 shows the results of the confusion matrix generated from the accuracy validation points (n = 500) randomly distributed in the study area. The sample size is sufficient to ensure a margin of error <5% with a 95% confidence interval, as per the Cochran formula variation for simple random sampling [63].

Table 3.
Results of the supervised classification using the confusion matrix.
As can be deduced from the Kappa index (Kappa = 0.783), the supervised classification by maximum likelihood made for the study area shows good precision according to Landis & Korch [41], close to very good (Kappa > 0.8).
It should be noted that the user’s accuracy is high, although the typification of brushland with trees (0.65) could be improved. The creation of the spectral signature archive of the land cover categories in the study area by photo-interpretation is complex, especially in areas with tree stands. It is not easy to isolate pixels containing a single land cover category. Interferences and overlaps between soil categories, as well as noise from bare ground and/or rock, worsen the accuracy of the results.
On the other hand, the accuracy of the producer is considered adequate, with room for improvement in the categorization of pasture-brush (0.77), rock and/or bare ground (0.71).
3.4. Grassland and Livestock Trails Connectivity
3.4.1. Structural Connectivity Analysis (MSPA)
The results of the MSPA analysis obtained for each of the scenarios considered in this study are shown below. The Guidos software performs a segmentation of the frontal objects (foreground) and calculates statistics on percentages of surface area and number of elements in the MSPA morphological categories.
Table 4 shows the results of the MSPA analysis given for the different morphological categories in the two scenarios considered.

Table 4.
Results of the supervised classification using the confusion matrix.
Figure 8 and Figure 9, below, show the connectivity maps according to the different categories of the MSPA analysis for Scenario 1: Pasture and Scenario 2: Pasture + Livestock trails.
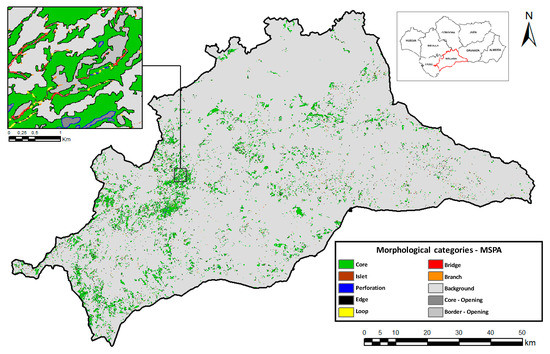
Figure 8.
Connectivity map according to MSPA categories—Scenario 1: Pasture.
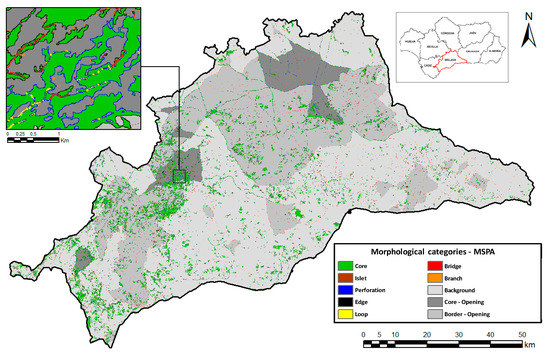
Figure 9.
Connectivity map according to MSPA categories—Scenario 2: Pasture + Livestock trails.
The results of the connectivity analysis of Scenario 1: Pasture and Scenario 2: Pasture + Livestock trails, show that the current network of livestock trails has a favorable influence on the connectivity of the territory, increasing the number of connections and favoring the flow of livestock between spaces with grass content >60%.
The MSPA analysis reveals that there is no excessive fragmentation of the territory with respect to the total amount of pastures, as shown by the categorization of morphological elements of both scenarios with high values of cores (>60%) and low values of islands (<1%). The effect of livestock trails on territorial connectivity in Scenario 2 stands out, which translates into an increase in bridges or very effective corridors (+3.4%), as well as a decrease in borders (−1.2%) and an increase in branches (+1.5%).
3.4.2. Network Analysis
Below are the results of the network connectivity analysis for the components in each scenario. As indicated in the methodology, two parameters are used:
- RCA: Unit of area calculated as the sum of the equivalent connected area of each node/core; in this case it is expressed in hectares (ha).
- ECA_rel: Percentage resulting from the sum of the normalization of each of the above with respect to the maximum value, when all the components are completely connected.
Table 5 shows the results of the connectivity network analysis.

Table 5.
Network Analysis (NW) Data—Scenarios: 1 and 2.
3.4.3. Analysis of the Importance of Nodes/Connectors PC Index
Table 6 shows the results of the analysis of the individual importance for the connectivity of each node (“core”) and connector (“bridge”) that make up the network that Guidos 2.8 generated from a conversion of the MSPA morphological analysis [48].

Table 6.
Surface data (ha) of the network components—Scenarios: 1 and 2.
It should be noted that those cores and bridges that make no contribution to network connectivity (dPC = 0) are not considered in the PC-based network analysis [23].
- Nodes:
A classification of network nodes according to CPD index (%) was obtained, which weighs the importance of these on the connectivity of the territory. As a contextual example, the elimination of a category 1 node means a loss of connectivity of the territory of less than 1%.
In Scenario 1: Pasture, the results showed a predominance of nodes (87 of 99) that produced a smaller effect (CPD < 2%) on the overall connectivity of the territory; the total area occupied by these nodes was 7736.12 ha. In contrast, in Scenario 2: Pasture + Livestock trails, a greater presence of nodes was observed that exert a significant influence (CPD (%) > 5%) on the connectivity of lands with a pasture content >60% of the study area, counting 18 nodes that occupy 7143.88 ha.
- Connectors:
In Scenario 1: Pasture, there was less presence of connectors (“links”) than in Scenario 2: Pasture + Livestock trails; although in both cases, the connectors exert a significantly lower influence (CPD < 5%) on connectivity than that demonstrated by the nodes. In any case, the effect of livestock pathways in Scenario 2 implies an increase of >1.5 times the number of connectors. In terms of surface area, the total land area of Scenario 2 that significantly favours connectivity in the study and transit area is 1042 ha, compared to 55.63 ha in Scenario 1.
3.4.4. Analysis of the Livestock Trail
The following are the results obtained from the livestock pathway analysis performed with the ArcGIS Zone Statistics Tool, based on the output file of the node/connector analysis of Scenario 2: Pasture + Livestock trails.
A classification of livestock pathways according to the range of importance of dPC connectivity (%), detailing the number of elements and accumulated length in each category, is shown in Table 7.

Table 7.
Classification of livestock trails according to importance of dPC connectivity (%).
At a general level, the data reveal that the highest percentage of the total number of livestock trails (410 units) and length (2046.83 km) is in the first category with a lower importance on CPD connectivity (0.00–1.00%); which represents 73.21% and 64.16%, respectively. In contrast, the CPD ranges with the greatest influence on connectivity (CPD > 5%) account for a smaller number (103) than the total, although are of considerable length (823.96 km), representing 25.82% of the total. The individual analysis of the CPD index of the livestock trails revealed the average range of effect that each cattle trail had on the connectivity of the pastureland: CPD gully (20–40%); CPD line (5–20%); CPD trail (0–5%).
On the other hand, the individual analysis of connectivity of livestock trails weighs up the importance that each of these elements offers to guarantee the transit of fauna and access to lands with pasture content >60%. Figure 10 shows the location of the livestock trails with the greatest impact on land to pasture connectivity (>60%) in the study area.
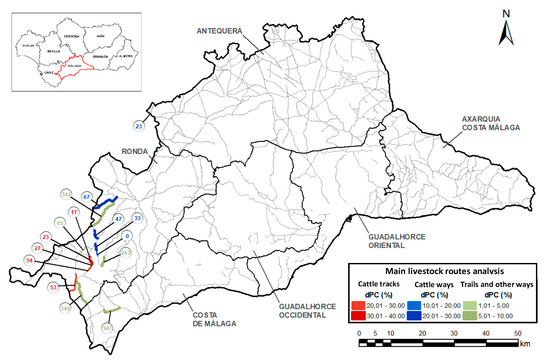
Figure 10.
Map of livestock trails with greater connectivity potential.
The results allowed the identification of those critical elements to maintain the connectivity of the territory [64], corresponding in this case to ravines, mountain ranges and paths in the west of the province of Málaga, mainly in the livestock region of Ronda.
4. Conclusions
Connected pasturelands are essential to maintain and guarantee a sustainable management of livestock activity. This paper has shown a methodology that analyzes the accessibility of these pasturelands through the network of livestock trails. We have been able to identify and characterize pasturelands. The analysis of the structural connectivity of the MSPA revealed that the livestock trails reduce the fragmentation of pasturelands, increasing the number of effective corridors and reducing the edge effect. In this way, they contribute to reducing the fragmentation of the territory and allow the fauna to access land with abundant pasture. Likewise, the functional connectivity analysis showed that the livestock trails strengthen the network of the study area, favoring the dispersion of individuals between areas with abundant pastures.
Of all the types of livestock trails considered in this study, the cattle track was the one with the greatest influence on the overall pastureland connectivity, followed by the cattle way and, thirdly, by the trail. The regions that offer the largest area of pastureland in spring, contain the livestock trails with the most relevance to the connectivity of the study area. On the other hand, the connectivity decreases in areas with an insufficient network of livestock trails.
The results achieved in this study represent very valuable information for territorial planning of the study area, and contribute to its sustainable development through adequate management of the territory. This study provides useful information for landscape or territorial planning, and it could be used to improve the management of wildlife dependent on high quality pastures, as well as to promote the management of semi-extensive livestock. Therefore, knowing the best connectivity between pasturelands, livestock management may be improved, and the optimal ecosystem sustainability may be ensured.
The acquisition and processing of updated remote sensed images, together with a correct definition of land use classes, are the major challenges for the development and implementation of the methodology presented. In addition, the application of connectivity analysis can be carried out focusing on the dispersion ranges of livestock species of interest, and can provide different connectivity results for each species, depending on their characteristics and movement.
Author Contributions
Conceptualization, J.V. and J.R.; methodology, J.V.; validation, J.G., J.R. and A.H.; formal analysis, J.R.; investigation, J.G., J.V. and J.R.; data curation, J.R.; writing—original draft preparation, J.G. and J.R.; writing—review and editing, J.G., J.V., A.H., I.G., F.H., A.L.-S.; visualization, J.R. and J.G.; supervision, A.L.-S. All authors have read and agreed to the published version of the manuscript.
Funding
This research received no external funding.
Institutional Review Board Statement
Not applicable.
Informed Consent Statement
Not applicable.
Data Availability Statement
The data presented in this study are available on request from the corresponding author.
Conflicts of Interest
The authors declare no conflict of interest.
References
- Jongman, R.H.G. Homogenisation and fragmentation of the European landscape: Ecological consequences and solutions. Landsc. Urban Plan. 2002, 58, 211–221. [Google Scholar] [CrossRef]
- Nick, M.; Haddad, L.A.; Brudvig, J.C.; Kendi, F.D.; Andrew, G.; Robert, D.H.; Thomas, E.L.; Joseph, O.S.; Mike, P.A.; Cathy, D.C.; et al. Habitat fragmentation and its lasting impact on Earth’s ecosystems. Sci. Adv. 2015, 1, e1500052. [Google Scholar]
- Lindenmayer, D.B.; Fischer, J. Habitat Fragmentation and Landscape Change. An Ecological and Conservation Synthesis; IslandPress: Washington, DC, USA, 2013. [Google Scholar]
- Gurrutxaga, M.; Lozano, P.J. Criterios para contemplar la conectividad del paisaje en la planificación territorial y sectorial. Investig. Geográficas 2007, 44, 75–88. [Google Scholar] [CrossRef]
- Vogt, P.; Riitters, K.H.; Iwanowski, M. Mapping landscape corridors. Ecol. Ind. 2007, 7, 481–488. [Google Scholar] [CrossRef]
- Vogt, P. MSPA Guide; Institute for Environmental and Sustainability (IES) European Commission; Joint Research Centre (JRC); TP: Ispra, Italy, 2008; Volume 261. [Google Scholar]
- Samways, M.J.; Bazelet, C.S.; Pryke, J.S. Provision of ecosystem services by large scale corridors and ecological networks. Biodivers. Conserv. 2010, 19, 2949–2962. [Google Scholar] [CrossRef]
- Šálek, M.; Svobodová, J.; Zasadil, P. Edge effect of low-traffic forest roads on bird communities in secondary production forests in central Europe. Landsc. Ecol. 2010, 25, 1113–1124. [Google Scholar] [CrossRef]
- Šálek, M.; Kreisinger, J.; Sedláček, F.; Albrecht, T. Do prey densities determine preferences of mammalian predators for habitat edges in an agricultural landscape? Landsc. Urban Plan. 2010, 98, 86–91. [Google Scholar] [CrossRef]
- San Miguel-Ayanz, A. Pastos Naturales Españoles. Caracterización, Aprovechamiento y Posibilidades de Mejora; Coedición Fundación Conde del Valle de Salazar; Mundi-Prensa: Madrid, Spain, 2001; p. 320. ISBN 8471149915. [Google Scholar]
- Herrera, C.M. El monte mediterráneo en Andalucía. In Consejería de Medio Ambiente—Junta de Andalucía; Junta de Andalucía-CSIC: Sevilla, Spain, 2004; p. 207. ISBN 84-933537-4-4. [Google Scholar]
- Castel, J.; Mena, Y.; Delgado-Pertíñez, M.; Camúñez, J.; Basulto, J.; Caravaca, F.; Guzmán-Guerrero, J.; Alcalde, M. Characterization of semi-extensive goat production systems in southern Spain. Small Rumin. Res. 2003, 47, 133–143. [Google Scholar] [CrossRef]
- Castel, J.; Ruiz, F.; Mena, Y.; Sánchez-Rodríguez, M. Present situation and future perspectives for goat production systems in Spain. Small Rumin. Res. 2010, 89, 207–210. [Google Scholar] [CrossRef]
- Mena Guerrero, Y. Situación Actual, Evolución y Diagnóstico de los Sistemas Semi-Extensivos de Producción Caprina en Andalucía Centro-Occidental; de Andalucía, J., Ed.; Universidad de Sevilla: Sevilla, Spain, 2005; p. 222. ISBN 84-8474-160-5. [Google Scholar]
- Mena, Y.; Ruiz, F.A.; Castel, J.M.; García Romero, C.; Hernández, O.; Nahed, J. Nivel de Aproximación al Modelo Ecológico del Caprino Lechero Andaluz: Posibilidades de Mejora; IX Congreso Sociedad Española de Agricultura Ecológica (SEAE); Sociedad Española de Agricultura Ecológica; Spain, 2010; Available online: http://www.agroecologia.net/recursos/publicaciones/publicaciones-online/2010/ix-congreso/cd-actas/p15-produccion-animal-ii/15-5-nivel-mena.pdf (accessed on 16 September 2018).
- Gutiérrez-peña, R. Análisis técnico-económico de las explotaciones caprinas de raza Malagueña: Estrategias de mejora de su viabilidad. In Proceedings of the XVI Jornadas sobre Producción Animal. Asociación Interprofesional para el Desarrollo Agrario (AIDA), Zaragoza, Spain, 19–20 May 2015; pp. 54–56. [Google Scholar]
- Torremocha, E.; Di Paula, V. Un sistema de Producción Ganadero eco-Innovador; Unidad de recursos europeos. Diputación de Málaga; Diputación de Málaga: Málaga, Spain, 2011; p. 51. [Google Scholar]
- Roman, M.; Roman, K.; Roman, M. Spatial Variation in Particulate Emission Resulting from Animal Farming in Poland. Agriculture 2021, 11, 168. [Google Scholar] [CrossRef]
- Yunes, M.C.; Osório-Santos, Z.; von Keyserlingk, M.A.G.; Hötzel, M.J. Gene Editing for Improved Animal Welfare and Production Traits in Cattle: Will This Technology Be Embraced or Rejected by the Public? Sustainability 2021, 13, 4966. [Google Scholar] [CrossRef]
- Colpaert, A.; Kumpula, J.; Nieminen, M. Reindeer Pasture Biomass Assessment Using Satellite Remote Sensing. Arctic 2003, 56, 147–158. [Google Scholar] [CrossRef]
- Velázquez, J.; Gutiérrez, J.; Hernando, A.; García-Abril, A. Evaluating landscape connectivity in fragmented habitats: Cantabrian capercaillie (Tetrao urogallus cantabricus) in northern Spain. Ecol. Manag. 2017, 389, 59–67. [Google Scholar] [CrossRef]
- Numata, I.; Roberts, D.A.; Chadwick, O.A.; Schimel, J.; Sampaio, F.R.; Leonidas, F.C.; Soares, J.V. Characterization of pasture biophysical properties and the impact of grazing intensity using remotely sensed data. Remote Sens. Environ. 2007, 109, 314–327. [Google Scholar] [CrossRef]
- Bârliba, C.; Cojocariu, L. The selective distribution of pasture surfaces situated on administrative territory of Nadrag, Timis county. Res. J. Agric. Sci. 2010, 42, 340–347. [Google Scholar]
- Hernando, A.; Velázquez, J.; Valbuena, R.; Legrand, M.; García-Abril, A. Influence of the resolution of forest cover maps in evaluating fragmentation and connectivity to assess habitat conservation status. Ecol. Ind. 2017, 79, 295–302. [Google Scholar] [CrossRef]
- Ferrer, E.; Torres, V.; San Martini, E. Estudio preliminar sobre la aplicación de la teledetección en la identificación de los pastizales. Rev. Cuba. Cienc. Agrícola 1988, 22, 219–224. [Google Scholar]
- Boschetti, M.; Bocchi, S.; Brivio, P.A. Assessment of pasture production in the Italian Alps using spectrometric and remote sensing information. Agric. Ecosyst. Environ. 2007, 118, 267–272. [Google Scholar] [CrossRef]
- Lezama, F.; Altesor, A.; León, R.J.; Paruelo, J.M. Heterogeneidad de la vegetación en pastizales naturales de la región basáltica de Uruguay. Ecol. Austral 2006, 16, 167–182. [Google Scholar]
- González, F.; Levasor, C.; Pou, A.; Ruiz, M. Reconocimiento de pastizales mediante teledetección y estudios integrados. Pastos 2001, 8, 85–93. [Google Scholar]
- Lara, B.; Gandini, M. Análisis de la fragmentación de pastizales en la pampa deprimida (Argentina). Semiárida 2014, 24, 21–30. [Google Scholar]
- Díaz Garona, C. Estudio de los Pastos en Andalucía y Castilla-la Mancha y su Aprovechamiento Racional con Ganado Ecológico; Asociación Valor Ecológico Ecovalia; CAAE: Sevilla, Spain, 2014; p. 250. ISBN 978-84-606-5836-8. [Google Scholar]
- Iglesias, E.; Báez, K.; Díaz-Ambrona, C.H. Assessing drought risk in Mediterranean Dehesa grazing lands. Agric. Syst. 2016, 149, 65–74. [Google Scholar] [CrossRef]
- Papanastasis, V.P. Silvopastoral Systems and Range Management in the Mediterranean Region. In Western European silvopastoral systems. París (Francia); Institute National de la Reserche Agronomique (INRA): Paris, France, 1996; pp. 143–156. ISBN 978-2738006783. [Google Scholar]
- Ferrer, C.A.S.; Miguel-Ayanz, A.; Olea, L. Nomenclátor básico de pastos en España. Pastos 2011, 31, 7–44. [Google Scholar]
- Rouse, J.W.; Haas, R.H.; Deering, D.W.; Sehell, J.A. Monitoring the Vernal Advancement and Retrogradation (Green Wave Effect) of Natural Vegetation. In Final Report RSC 1978-4. Remote Sensing Center; Texas A&M University: College Station, TX, USA, 1974; p. 114. [Google Scholar]
- García Abril, A.; Cocero, D.; Velázquez, J.; Blanco, E.; Grande, M.A.; Núnez, M.V.; Tejera, R. Aplicación de la teledetección a la gestión silvopastoral. In El Acceso a la Información Espacial y las Nuevas Tecnologías Geográficas; Universidad Granada: Granada, Spain, 2006; pp. 831–842. ISBN 84-338-3944-6. [Google Scholar]
- Chapelle, E.W.; Kim, M.S.; Mcmurtrey, J.E. Ratio analysis of reflectance spectra (RARS): An algorithm for the remote estimation of the concentrations of chlorophyll A, chlorophyll B, and carotenoids in soybean leaves. Remote Sens. Environ. 1992, 39, 239–247. [Google Scholar] [CrossRef]
- Mulla, D.J. Twenty five years of remote sensing in precision agriculture: Key advances and remaining knowledge gaps. Biosyst. Eng. 2003, 114, 358–371. [Google Scholar] [CrossRef]
- Gascón, F. Copernicus Sentinel-2 calibration and products validation status. Remote Sens. 2007, 9, 584. [Google Scholar] [CrossRef]
- Addabbo, P. Contribution of Sentinel-2 data for applications in vegetation monitoring. Acta Imeko. 2016, 5, 44–54. [Google Scholar] [CrossRef]
- ESRI. ArcGIS Desktop: Release 10; Environmental Systems Research Institute: Redlands, CA, USA, 2016. [Google Scholar]
- Landis, J.R.; Koch, G. The measurement of observer agreement for categorical data. Biometrics 1977, 33, 159–174. [Google Scholar] [CrossRef] [PubMed]
- Alrababah, M.A.; Alhamad, M.N. Land use/cover classification of arid and semi-arid Mediterranean landscapes using Landsat ETM. Int. J. Remote Sens. 2006, 27, 2703–2718. [Google Scholar] [CrossRef]
- Elhag, M.; Boteva, S. Mediterranean Land Use and Land Cover Classificaion Assessment Using High Spatial Resolution Data. IOP Conference Series: Earth and Environmental Science; IOP Publishing: Bristol, UK, 2016; p. 042032. [Google Scholar]
- Borràs, J. Clasificación de usos del suelo a partir de imágenes Sentinel-2. Rev. Teledetección 2017, 48, 55–66. [Google Scholar] [CrossRef]
- Mattupalli, C. Supervised Classification of RGB Aerial Imagery to Evaluate the Impact of a Root Rot Disease. Remote Sens. 2018, 10, 917. [Google Scholar] [CrossRef]
- Congalton, R.G.; Green, K. A practical look at the sources of confusion in error matrix generation. Photogramm. Eng. Remote Sens. 1993, 59, 641–644. [Google Scholar]
- Darpan, M. Classification of crops and analyzing the acreages f the field. Int. Res. J. Eng. Technol. 2018, 5, 1965–1969. [Google Scholar]
- Speranza, F.C.; Zerda, H.R. Clasificación digital de coberturas vegetales a partir de datos satelitales multiespectrales. In VIII Congreso Argentino de Ingeniería Rural (CADIR); 2005; p. 6. Available online: https://www.researchgate.net/profile/Hugo-Zerda/publication/228346891_Clasificacion_digital_de_coberturas_vegetales_a_par-tir_de_datos_satelitales_multiespectrales/links/562a7d7008ae04c2aeb1a8bf/Clasificacion-digital-de-coberturas-vegetales-a-partir-de-datos-satelitales-multiespectrales.pdf (accessed on 24 May 2021).
- Congalton, R.G.; Oderwald, R.G.; Mead, R.A. Assessing Landsat classification accuracy using discrete multivariate analysis statistical techniques. Photogramm. Eng. Remote Sens. 1983, 49, 1671–1678. [Google Scholar]
- Chuvieco, E. Fundamentals of Satellite Remote Sensing; CRC Press: Boca Raton, FL, USA, 2009; p. 419. ISBN 978-1-4200-2151-6. [Google Scholar]
- Vogt, P. GuidosToolbox: Universal digital image object analysis. Eur. J. Remote Sens. 2017, 50, 352–361. [Google Scholar] [CrossRef]
- Vogt, P. Guidos: Tools for the assessment of pattern, connectivity, and fragmentation. In Geophysical Research Abstracts, Proceedings of the EGU General Assembly Conference, Vienna, Austria, 7–12 April 2013; 2013; p. 13526. Available online: https://ui.adsabs.harvard.edu/abs/2013EGUGA..1513526V/abstract (accessed on 24 May 2021).
- Vogt, P. User Guide of Guidos Toolbox. Release 2.8; European Comission: Ispra, Italy, 2018; p. 58. [Google Scholar]
- Vogt, P. Mapping functional connectivity. Ecol. Indic. 2009, 9, 64–71. [Google Scholar] [CrossRef]
- Saura, S.; Torne, J. Conefor Sensinode 2.2: A software package for quantifying the importance of habitat patches for landscape connectivity. Environ. Model. Softw. 2009, 24, 135–139. [Google Scholar] [CrossRef]
- Saura, S.; Pascual-Hortal, L. A new habitat availability index to integrate connectivity in landscape conservation planning: Comparison with existing indices and application to a case study. Landsc. Urban Plan. 2007, 83, 91–103. [Google Scholar] [CrossRef]
- Saura, S.; Rubio, L. A common currency for the different ways in which patches and links can contribute to habitat availability and connectivity in the landscape. Ecography 2010, 33, 523–537. [Google Scholar] [CrossRef]
- Keitt, T. Detecting critical scales in fragmented landscapes. Conserv. Ecol. 1997, 1, 16. [Google Scholar] [CrossRef]
- Urban, D.; Keitt, T. Landscape connectivity: A graph-theoretic perspective. Ecology 2001, 82, 1205–1218. [Google Scholar] [CrossRef]
- Mendiguren, G.; Pilar Martin, M.; Nieto Solana, H.; Pacheco-Labrador, J.; Jurdao, S. Seasonal variation in grass water content estimated from proximal sensing and MODIStime series in a Mediterranean Fluxnet site. Biogeosciences 2015, 12, 5523–5535. [Google Scholar] [CrossRef]
- Rivas Martínez, S. Pisos bioclimáticos de España. Lazaroa 1983, 5, 33–44. [Google Scholar]
- Chazarra, A. Mapas Climáticos de España (1981–2010) y ETo (1996–2016); Ministerio para la Transición Ecológica: Madrid, Spain, 2018; NIPO: 014-18-004-2. [Google Scholar]
- Osuna, J.; Ferreras, M.L.; Núñez, A. Inferencia estadística, niveles de precisión y diseño muestral. Rev. Española De Investig. Sociológicas 1991, 54, 139–162. [Google Scholar] [CrossRef][Green Version]
- Saura, S. Key structural forest connectors can be identified by combining landscape spatial pattern and network analyses. For. Ecol. Manag. 2011, 262, 150–160. [Google Scholar] [CrossRef]
Publisher’s Note: MDPI stays neutral with regard to jurisdictional claims in published maps and institutional affiliations. |
© 2021 by the authors. Licensee MDPI, Basel, Switzerland. This article is an open access article distributed under the terms and conditions of the Creative Commons Attribution (CC BY) license (https://creativecommons.org/licenses/by/4.0/).