Article

Spatial–Temporal Heterogeneity and the Related Influencing Factors of Tourism Efficiency in China

1
Institute of County Economic Development & Rural Revitalization Strategy, Lanzhou University, Lanzhou 730000, China
2
School of Economics, Lanzhou University, Lanzhou 730000, China
3
Institute of Geographic Sciences and Natural Resources Research, Chinese Academy of Sciences, Beijing 100101, China
4
Lanzhou Information Center, Northwest Institute of Eco-Environment and Resources, Chinese Academy of Sciences, Lanzhou 730000, China
5
College of Geography and Environment Sciences, Northwest Normal University, Lanzhou 730000, China
*
Authors to whom correspondence should be addressed.
Sustainability 2021, 13(11), 5825; https://doi.org/10.3390/su13115825
Submission received: 21 April 2021 / Revised: 15 May 2021 / Accepted: 19 May 2021 / Published: 21 May 2021
(This article belongs to the Special Issue Urban Climate Change, Transport Geography and Smart Cities)

Abstract

:
Tourism efficiency is an effective index of measuring the development quality of the tourism industry. In this study, the tourism efficiency of 30 provinces in China during the period from 2006 to 2018 was measured with the SBM model and Malmquist index. On the basis of ESDA and GWR models, we explored the spatial pattern of China’s tourism efficiency and the spatial heterogeneity of the influencing factors in depth. The results revealed that China’s tourism efficiency has been constantly enhanced with an increasingly balanced pattern. Meanwhile, the utilization degrees of various input factors have constantly been improving. Both technological efficiency and technological progress jointly promote rapid growth of total-factor productivity. Accompanied with constant enhancement of the spatial agglomeration effect, the local spatial pattern also showed obvious differentiation. In general, low-efficiency regions were mainly concentrated in northern China, while high-efficiency regions were concentrated in southern China. The distinct spatial–temporal differentiation characteristics of tourist economic efficiency can be attributed to different influencing strengths of various factors in various regions and different action tendencies. The level of economic development, traffic conditions, the professional level of tourism, and openness degree can significantly promote tourism efficiency. Tourism resource endowment and environmental cost impose slight effects and differ in action direction, thereby inhibiting the tourism efficiency of many regions.

1. Introduction

The tourism industry serves as pillar industry of the national economy and plays an irreplaceable role in promoting economic and social development and enhancing popular happiness. As is known, China has vast territory, a long history, splendid culture, diversified ethnic minorities, and extremely abundant tourism resources, which lay a solid foundation for the prosperity and development of the tourism industry in China. In 2019, the tourism industry contributed 8.9 trillion dollars to the global GDP, with a proportion of 19.3% of GDP gross, which simultaneously provided employment for 330 million people, occupying 10% of total jobs [1]. The contribution of the tourism industry to the global GDP has increased most rapidly in the Asia-Pacific region, in which China ranks the first in terms of GDP and employment scale. In China, the overall contribution of the tourism industry to GDP is 10.94 trillion yuan, taking up 11.05% of the GDP; employment of 798.7 million people is indirectly and directly related to the tourism industry, accounting for 10.31% of the total employed population [2]. Rapid development of China’s tourism industry has made a remarkable contribution to the global tourism growth. In 2019, China made a quarter of the contributions to the growth of the global tourism industry; the number of China’s outbound tourists and the total outbound consumption reached up to 155 million visits and USD 300 billion, respectively, which makes it the greatest tourist-generating and tourism consumption country in the world. With constant economic development and scientific progress, diversification has become the theme in China’s tourism industry development. To be specific, further refinement of tourist groups, constant innovation of tourism projects, continuous enrichment of the tourism theme, constant change of tourism types, increasingly diverse travel modes, and constantly expanded and upgraded market requirements will inevitably promote the development and growth of the tourism industry. However, China’s tourism economy shows a series of problems including unbalanced development, excess invalid input, and insufficient effective supply. It is urgent to evaluate the tourist industry efficiency for promoting balanced and high-efficiency development of the tourism economy in China.
Specifically, the economic efficiency of an industry is equal to the capability of obtaining the maximum output from the specific input [3]. Tourism efficiency refers to the property wherein the unit factor input can achieve the maximum output within a certain period during the development of the tourism industry [4], which can reflect the ratio of the input of resource factors to the output utility in tourism economic activities and is an effective index of measuring the quality of tourism development. Gaining in-depth knowledge of spatial–temporal evolutional rules of tourism efficiency and the related influencing factors is of great significance to formulating the tourism development plans, adjusting the tourism supportive policies, and promoting sustainable development of the tourism industry.
Currently, scholars have mainly investigated tourism efficiency in some specific fields, particularly in the three pillars of modern tourism industry, i.e., travel agencies, hotels, and tourism traffic [5,6,7]. Tourism agencies serve as the medium organizations for integrating tourism resources and forming tourism productions, which usually arouse much attention. Koksal et al. analyzed the operating efficiency of the international travel agencies in Turkey and found that many travel agencies have low operating efficiency in rush tourism seasons [5]. Ramon et al. analyzed the relative efficiencies of 22 travel agencies in Alicante, Spain; proposed the corresponding improvement measures; and finally concluded that geographic position is the most important factor that affects efficiency by using the Mann–Whitney U test [8]. Hotels are important parts of the tourism industry, and are also the research hotspots. Assaf et al. evaluated the operating efficiency of hotels in the Asia-Pacific region and concluded that scale, ownership, and classification all significantly affect hotel efficiency [9]. Barros et al. found that most of Portugal’s hotels were poor in efficiency and severe in terms of waste of resources, and the authors put forward some improvement measures such as enhancing productivity and attracting foreign investment [10]. Corne et al. analyzed the technical efficiency of the hotel industry in France and pointed out that economical hotels exceed in efficiency but are poor in income, which can explain the paradox in the French hotel industry [11]. Tourism traffic is also quite important and simultaneously raises great concern. Ripoll-Zarra et al. adopted stochastic frontier analysis for estimating the technical efficiency of Spanish airports and found that some airports are low in efficiency; the management mode, geographic position, and accommodation type can all significantly affect the airport efficiency [12]. Lo Storto et al. measured the efficiency of Italian airports on the basis of the NSBM-DEA model and concluded that the NSBM-DEA model is more effective than the traditional DEA model; the related results can provide insightful understanding for policymakers in terms of performance improvement and management [13]. As scholars have performed increasingly in-depth studies on tourism economy efficiency, they expanded their objectives to many aspects such as tourism attractions and tourism destinations [14,15,16]. Baggio used a network analysis approach towards digital ecosystems in order to study the relationship between technological tools and physical entities in a destination and how these tools and their combinations affect the efficiency of the system at the local and global levels [17]. Tiziana analyzed the efficiency of cultural heritage on the United Nations Educational Scientific and Cultural Organization (UNESCO) World Heritage List in Italian regions and found that UNESCO sites exert opposite effects on the performance of these sites of cultural heritage [18]. Currently, there are two common methods for the estimation of tourism efficiency, i.e., data envelope analysis (DEA) and stochastic frontier analysis (SFA) [19,20,21]. DEA is a useful and effective technique and is extensively applied in various industries owing to the use of Pareto efficiency that compares the decision units with the other decision units [3]. For example, Sharon et al. analyzed and compared the tourism efficiencies of 105 countries on a macro level [3], and Barros employed DEA for estimating the total-factor productivity of a state-owned chain of hotels in Portugal [22]. By contrast, Chinese scholars have conducted related studies on multiple levels from macroscopic national tourism to microscopic tourism enterprises [23,24,25], regarding diversified topics such as tourism ecological efficiency, rural tourism efficiency, poverty alleviation efficiency through tourism, and tourism management efficiency [26,27,28,29,30]. Moreover, the research perspectives become increasingly wide and cover the mechanism of tourism efficiency, spatial–temporal difference, literature review, and the analysis of influencing factors [31,32,33,34]. With their improvement, the DEA model, super-efficiency model, three-phase DEA model, and bootstrap DEA model have now been gradually popularized in practical applications [35,36,37,38].
The existing studies on tourism efficiency are still limited to date. Firstly, in previous studies, scholars mainly focused on the estimation at a single time point or on a single department while neglecting spatial–temporal evolutions of multiple department combinations in long time series. Meanwhile, the previous studies mainly adopted traditional DEA models, whereas dynamic analysis of tourism efficiency by combining super-efficiency DEA model and the Malmquist index is especially rare. Scholars have mainly investigated the influencing factors via qualitative analysis and have not taken the effects of spatial effect into account, which cannot effectively reveal the spatial heterogeneity of the influencing factors. In addition, there is a lack of consideration of the local spatial regression model. On account of spatial flow characteristics of both tourism service and products, it is of great significance to analyze the driving factors under spatial distribution rules [39]. For this reason, this study selected the SBM–Malmquist model to measure the tourism efficiencies of various provinces in China and explored the spatial–temporal heterogeneity among different provinces with ESDA method. By taking the spatial effect into account, we classified the influencing factors with the GWR econometric model. The research results can provide reference for other similar regions or countries with rapid development of tourism in the world.

2. Materials and Methods

The measurement and evaluation of efficiency generally include input and output indexes and aim to gain maximum output with minimum resource investment. In this study, both the input and output indexes were involved in the measurement of tourism efficiency, and the tourism efficiencies of 30 provinces, cities, and autonomous regions in China were evaluated by establishing the super-efficiency SBM model. Then, the spatial agglomeration characteristics of tourism efficiency in China were analyzed using the ESDA method. Finally, the driving factors of tourism efficiency were identified on the basis of the GWR model.

2.1. Super-Efficiency SBM Model

The non-radial and non-angle SBM model, proposed by Tone [40] on the basis of slack variables, can be described as
M i n ρ = 1 1 m i = 1 m s i / x i k 1 + 1 s r = 1 s s r + / y r k
s . t . { j = 1 , j k n λ j x i j s i = x i k ,     i = 1 , 2 , , m ; j = 1 , j k n λ j y i j s r + = y r k ,     r = 1 , 2 , , s ; λ j , s , s + 0   ,       j = 1 , 2 , , n ( j k ) ;
where ρ denotes the relative efficiency, with a range of 0–1. When ρ = 1 , the decision-making unit (DMU) is relatively effective; however, many effective decision units may appear. In order to further determine the efficiency of these effective decision units, Tone et al. proposed a super-efficiency SBM model to solve the ranking of these effective units. The model can be described as
M i n ρ = 1 m i = 1 m x ¯ i / x i k 1 s r = 1 s y ¯ r / y r k
s . t . { x ¯ j = 1 , j k n λ j x j ; y ¯ j = 1 , j k n λ j y j ; x ¯ x k ; y ¯ y k ; λ j 0       j = 1 , 2 , , n ( j k ) ;
where n denotes the number of DMUs; m denotes the number of input indexes; s denotes the number of output indexes; s and s + are the input and the output relaxation variables, respectively; λ denotes the weight vector; and x i k and y rk denote the i-th input and the r-th output of the k-th DMU, respectively. A larger value of ρ is indicative of higher efficiency.

2.2. Malmquist Index Model

The Malmquist index, proposed by Malmquist [41], can adequately reflect the structural motive of efficiency change. Therefore, under the constant condition of returns to scale, the total-factor productivity can be decomposed into the change of technological progress and technological efficiency. Then, the Malmquist productivity index from t-th period to (t + 1)-th period can be written as
M I = [ D t ( x t + 1 , y t + 1 ) D t ( x t , y t ) × D t + 1 ( x t + 1 , y t + 1 ) ) D t + 1 ( x t , y t ) ] 1 / 2
= D t + 1 ( x t + 1 , y t + 1 ) D t ( x t , y t ) × [ D t ( x t + 1 , y t + 1 ) D t + 1 ( x t + 1 , y t + 1 ) × D t ( x t , y t ) D t + 1 ( x t , y t ) ] 1 / 2
where MI denotes the total-factor productivity, D t ( x t , y t ) denotes the efficiency in the t-th period, and ( x t , y t ) denotes the input–output in the t-th period. D t ( x t + 1 , y t + 1 ) denotes the efficiency in the (t + 1)-th period in terms of the base period t, which is also referred to as frontier movement effect. If MI > 1, the relative efficiency increases from t-th to (t + 1)-th efficiency; if MI < 1, the relative efficiency drops. In addition, the first part of the above equation represents the change of technological efficiency (EC), which reflects the evaluating unit’s capability of obtaining the maximum output under given input. If EC > 1, the decision unit is close to the production frontier, with constant improvement of technological efficiency; if EC < 1, the decision units cannot reasonably use the current technologies. The latter part of the equation represents the change of technological progress (TC), which reflects the contribution of the movement of the production frontier on the change of productivity. TC > 1 suggests technological progress while TC < 1 is indicative of technological recession [42].

2.3. Exploratory Spatial Data Analysis (ESDA) Method

ESDA is featured by spatial identification function and is mainly used for detecting spatial correlation and aggregation effect of variables. In this study, by calculating Global Moran’s I and Getis-Ord general G, we analyzed the spatial characteristics of the tourism efficiency of various provinces in China on global and local dimensions, respectively.
(1) Global auto-correlation. Global auto-correlation describes the spatial characteristics of the tourism efficiency on a nationwide scale. Global auto-correlation is generally measured by the global Moran’s index, denoted as I, which can be written as
I = n i = 1 n j = 1 n ( x i x ¯ ) ( x j x ¯ ) i = 1 n j = 1 n w i j ( x i x ¯ ) 2
where n denotes the number of spatial units; x i and x j are the tourism efficiencies at the spatial position i and j, respectively; and w i j is the spatial weight matrix. The global Moran’s index is in the range of [−1,1]. I > 0 suggests positive correlation while I < 0 suggests negative correlation. A larger value of I suggests more similar attributes and higher accumulation degree. A smaller value of I indicates more different attributes and higher agglomeration degree. There is no spatial auto-correlation when I = 0.
(2) Local auto-correlation. Local auto-correlation is used for measuring the local correlation between a certain region and the neighboring regions. In order for the local accumulation characteristics of tourism efficiency of various regions to be measured, the local Getis-Ord general G, denoted as Gi, can be calculated as
G i = j = 1 n w i j x j j = 1 n x j
Z ( G i ) = G i E ( G i ) V A R ( G i )
where n denotes the number of spatial units; x j denotes the tourism efficiency of the j-th region; E ( G i ) and V A R ( G i ) are the mathematical expectation and variance, respectively;   w i j denotes the spatial weight matrix; and Z ( G i ) denotes the normalized Getis-Ord general G. If Z ( G i ) is significantly positive, the surrounding value of the objective position is relatively higher and exceeds the mean value, suggesting that the objective position is the spatial accumulation region with high tourism efficiency (i.e., the tourism hot spots); otherwise, if Z ( G i ) is significantly negative, the surrounding values of the objective position are relatively lower and below the mean value, suggesting that the objective position is the spatial accumulation region with low tourism efficiency (i.e., tourism cold spots).

2.4. Geographically Weighted Regression (GWR) Model

The GWR model is an extended model that is based on the ordinary linear regression (OLR) model. The GWR model embeds the geographical positions of all sampling points into the regression parameters, and thus it can effectively reflect the spatial dependence among variables. The GWR model can be written as
y i = β 0 ( μ i , ν i ) + k = 1 p β k ( u i , v i ) x i k + ε i        i = 1 , 2 , , n
where y i denotes the tourism efficiency of the i-th region, x i k denotes the k-th explanatory variable in the i-th region, ( u i , v i ) is the coordinates of the i-th region, β k ( u i , v i ) denotes the regression parameter of the explanatory variable k in the i-th region, and ε i denotes the random error of the i-th region.

3. Methods and Data Source

3.1. Selection of Tourism Indexes

As regards the measurement of tourism efficiency, the input indexes mainly include capital, labor, and resource consumption. The investment of capital mainly includes the investments of visible physical assets and invisible tourism attraction. The former investment can be characterized by the fixed total asset investment in the tourism industry, while the latter is mainly generated from tourism resource endowment and tourism services [32]. The tourism resource endowment can be calculated by a weighted sum of all A-class scenic spots (to be specific, the weights of 1A-class to 5A-class scenic spots are 1–5, respectively), while the tourism services are characterized by the total numbers of star-grade hotels and travel agencies. The labor input can be characterized by the number of employees in the tourism industry. Resource consumption is characterized by the total energy resource consumption in the tourism industry. In this study, due to the lack of related statistics of the fixed-asset investment and the energy resource consumption in the tourism industry, we selected the ratio of the tourism revenue to GDP for conversion. As regards the output indexes, the tourism income and the reception number can overall reflect the tourism development level and thus were selected as the output indexes of measuring tourism efficiency. In addition, considering that most of the tourism income can inevitably affect most of the output on that year [43], the effect of hysteresis effect on the measurement of tourism efficiency was neglected in this study.

3.2. Indexes in Geographic Weighted Regression (GWR) Model

The spatial evolution of tourism efficiency is the result under the action of multiple factors. Moreover, various influencing factors differ in direction and strength to varying degrees. It is necessary to further examine the spatial–temporal heterogeneity of various influencing factors of tourism efficiency. By reference to the related results [32,44,45,46], the economic development level (ED), the tourism resource endowment (TRE), the traffic condition (TC), the professional development level of the tourism industry (TS), the openness degree (OD), and the environmental cost (EC) were selected as the independent variables for establishing the GWR model so as to conclude the factors that affect the difference of tourism efficiency among different regions.
Economic development level is inextricably linked to the development of various industries that can affect the development of the tourism industry to a certain degree. In this study, the gross domestic product (GDP) of the region was used for measuring the economic development level. The tourism resource endowment is the foundation of tourism industry development and can be calculated by adding the number of A-class scenic spots and the evaluation grades in a weighted way. Convenient transport facilities and development traffic networks are the premise of both prosperity and development of the tourism industry since they can increase the convenience of tourism activities. The traffic condition can be characterized by the density of roads. The professional level of the tourist industry can be characterized by the location entropy. The location entropy, calculated by the ratio of the proportion of the regional tourism income in the regional GDP to the proportion of the national tourism income in the national GDP, can reflect the agglomeration development level of the tourism industry. The openness degree is tightly related to exit/entry tourism and can be measured by the ratio of the total volume of imports and exports to regional GDP. The environmental cost represents the negative externality with the development of tourism industry and can be measured by the carbon emission from the tourism industry. To be specific, the environmental cost can be calculated by multiplying the proportion of the tourism income in the regional GDP with the total carbon emission. Due to the lack of a special calculation method, this study used the method proposed by Xie et al. [47] for reference and made some simplifications. First, standard carbon emission was converted into the energy consumption of the standard coal; then, CO2 emission was able to be obtained through multiplication with CO2 emission per unit standard coal. In order to ensure the accuracy of the regression results, we standardized the independent variables in this study in order to avoid the interference of dimension on data fitting.

3.3. Data Sources

This study focused on 30 provinces, cities, and autonomous regions in inland China from 2006 to 2018 (not including Hong Kong; Macao; and Taiwan, China), and excluded Tibet on account of data availability. All data were sourced from the China Statistical Yearbook, China Tourism Yearbook, China Energy Yearbook, and other statistical yearbooks and bulletins of various regions.

4. Analysis of Results

4.1. Static Analysis of Tourism Efficiency

Using deasolver pro 8.0 software, we measured the tourism efficiency, as listed in Table 1. By reference to the related results [27], we were able to divide the whole country into high-efficiency, relatively high efficiency, medium-efficiency, and low-efficiency regions, with the values of ρ ≥ 1, 0.8 ≤ ρ < 1, 0.6 ≤ ρ < 0.8, and ρ ≤ 0.6, respectively.
As shown in Table 1, tourism efficiency overall increased steadily from 0.609 in 2006 to 0.807 in 2018 at the national level. The variation coefficient of tourism efficiency overall was large, indicating great differences among various regions. In terms of evolutional trend, the variation coefficient first dropped and then increased gradually, overall showing a U-shaped distribution pattern. It suggests that the difference of tourism efficiency among various regions first dropped and then increased slightly. In terms of the statistics of the number of decision units at different efficiency levels, the number of high-efficiency regions first increased, then remained stable, and finally increased in a fluctuant way, which overall increased significantly from 5 in 2006 to 12 in 2018. The number of relatively high efficiency regions was small and remained below 4, and was even equal to 0 in many years; the number of medium-efficiency regions first increased in a fluctuant pattern and then dropped suddenly from 2017, which was exactly different from the variation tendency of low-efficiency regions and reflected the fact that many regions changed from low-efficiency level to high-efficiency level before 2017. After 2017, the number of low-efficiency regions increased, which further indicated obvious polarization of tourist efficiency at the national level, that is, the difference among regions increased; however, the nationwide tourist efficiency inequality gradually improved.
In order to further analyze the differences in tourism efficiency among various regions, we selected the statistical data of tourism efficiency in 2006, 2012, and 2018, which are listed in Table 2. By dividing the whole country into three parts, i.e., western, central, and eastern parts, we found that the “stronger in the east and weaker in the west” pattern of tourism economy efficiency gradually weakened, and the efficiency in the central and the western regions grew rapidly, suggesting gradual equalization among different regions. To be specific, in eastern China, the tourism efficiency reached up to 0.827 in 2006, and the overall efficiency was at a high level, with gradual enhancement during the research period, while the tourism efficiency in 2018 reached up to 0.919, that is, the tourism industry in eastern China developed towards higher quality. By contrast, the development foundation of the tourism industry in central China was backward. In central China, the tourism efficiency in 2006 reached up to 0.522, suggesting a low-efficiency level in central China; however, the development speed was large and the tourism efficiency increased to 0.814 in 2018, with an overall enhancement of 55.8% (at a relatively high level). The difference between the eastern and the central regions was obviously narrowed. In western China, the tourism industry started relatively late, and the tourism efficiency in 2006 was only 0.454 on account of the gaps on multiple levels such as geographical location, economic development, and social services, which was rapidly enhanced to 0.697 in 2018. In spite of the moderate efficiency level of western China, the gap from eastern China gradually narrowed.
At the provincial scale, only Beijing, Tianjin, Shanghai, Jiangsu, and Guangdong were at a high efficiency level in 2006, and nearly 70% of provinces were at a low efficiency level, with overall low development efficiency all over the country. In 2012, the tourism efficiency of most provinces was significantly enhanced; to be specific, Heilongjiang and Jiangxi, as well as Chongqing, Guizhou, Sichuan, and Yunnan in southwestern China evolved from low-efficiency to high-efficiency regions; Liaoning, Henan, and Hubei became relatively high efficiency regions, and the rest of the provinces originally in medium- and low-efficiency regions were enhanced to varying degrees in terms of tourism efficiency. In 2018, the tourism efficiency of most provinces was further enhanced. Specifically, Liaoning, Fujian, and Shanxi evolved into high-efficiency regions; Anhui, Hunan, and Guangxi entered into the relatively high efficiency regions for the first time; and the rest of the provinces varied slightly. In terms of mean value, there were six high-efficiency regions, i.e., Beijing, Shanghai, Tianjin, Guangdong, Chongqing, and Guizhou. In particular, Beijing, Shanghai, Tianjin, Chongqing, and Guangdong ranked in the top lists of tourism competitiveness and attraction because of national policy inclination and strong economic foundation. Four provinces, namely, Jiangsu, Jiangxi, Henan, and Sichuan, were at relatively high efficiency level, and the rest of the regions were medium- and low-efficiency regions.

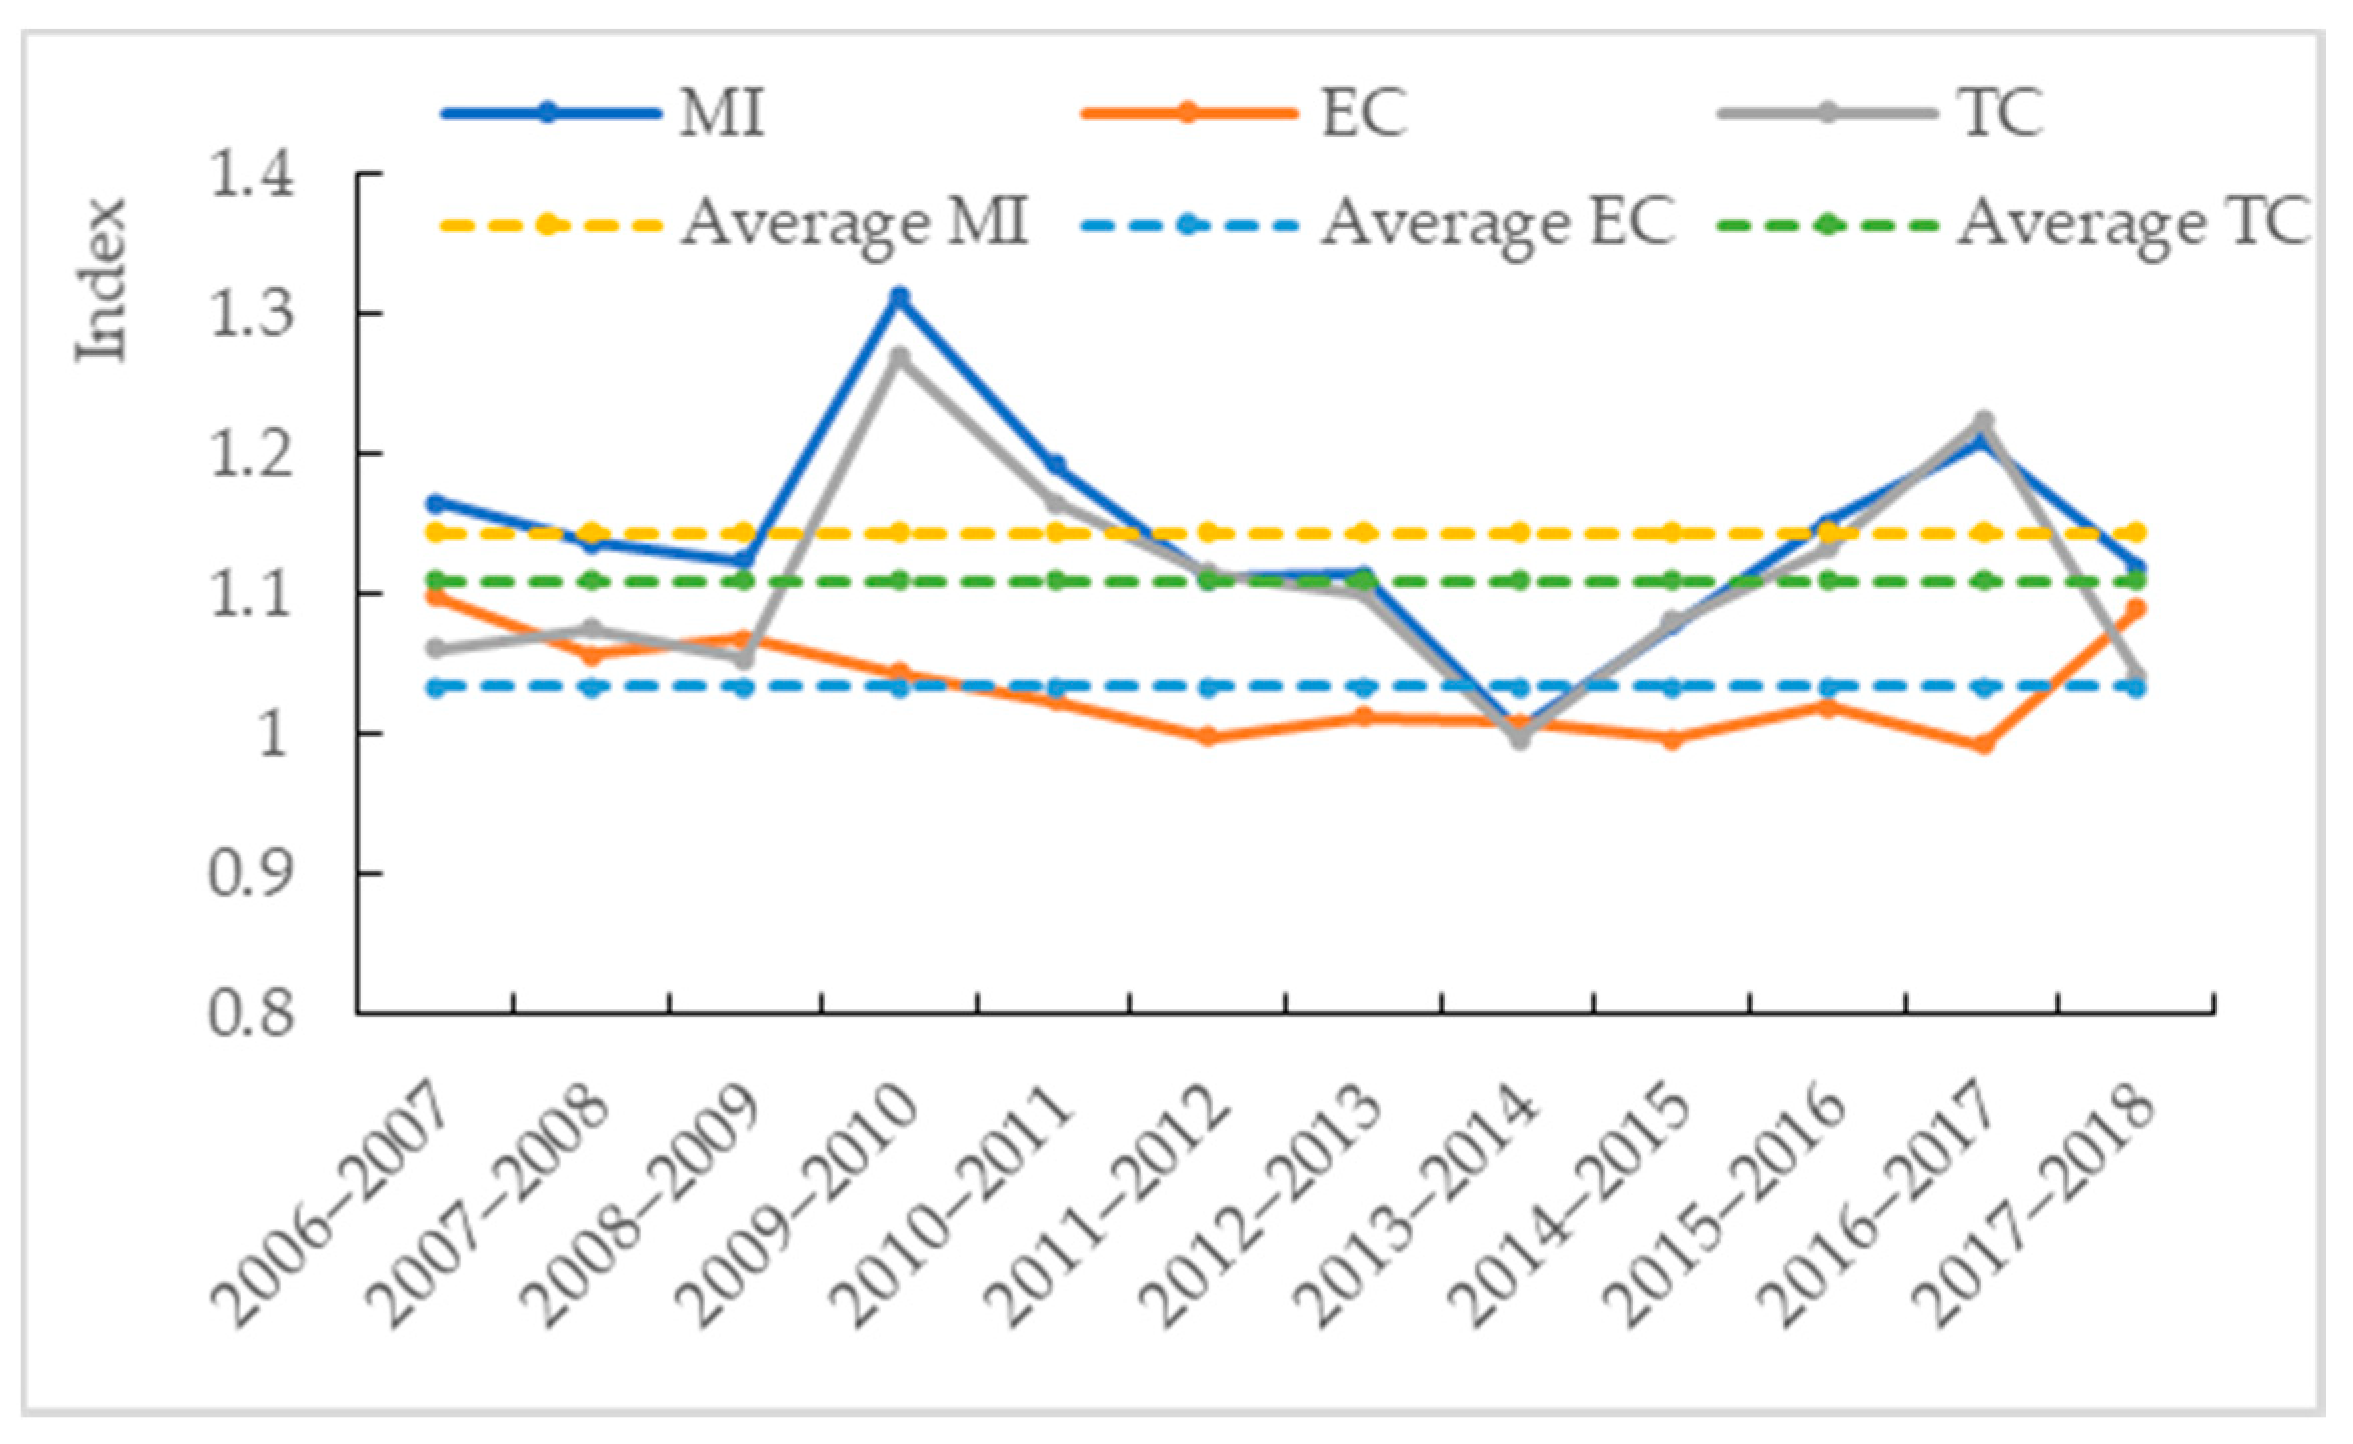
4.2. Dynamic Variation Tendency of Tourism Efficiency

Aiming to explore the intertemporal dynamic change of Tourism efficiency, we calculated the total-factor productivities of 30 provinces in China during the period from 2006 to 2018 using the Malmquist index model, which can be used as the index of measuring tourism efficiency and further decomposed into the change of technological efficiency (EC) and the change of technological progress (TC).
As shown in Figure 1, the mean total-factor productivity index of China’s tourism industry from 2006 to 2018 was 1.143, with an average annual growth rate of 14.3% on a national scale, suggesting gradual improvement of the utilization degree of various input factors with the development in China’s tourism industry. Specifically, the contribution rate of technological efficiency was 3.4%, which indicated a steady enhancement of technological efficiency in the tourism industry. The technological progress contributed nearly 11% and became the main power source of promoting the growth of total-factor productivity. During the whole period from 2006 to 2018, the indexes of the total-factor productivity in each year fluctuated and all exceeded 1, among which the values from 2013 to 2014 were close to 1, indicating a slight growth range in that year. This is tightly connected with the policy environment and the change of requirements in 2013. With the promulgation and implementation of Tourism Law in 2013, traditional tourist agencies faced the challenge of transformation and upgrading. As the transboundary operation and mobile Internet technology grew in popularity, huge capital injection brought about adjustment and transformation of the tourism industry. In spite of the fluctuations in other years, the growth rate generally exceeded 10%, with increasing tourism efficiency year by year. The technological efficiency dropped gradually from 2006 to 2012, which was then stabilized at around 1 from 2012 to 2017 and significantly enhanced from 2017 to 2018. The indexes of technological efficiency during the periods of 2011–2012, 2014–2015, and 2016–2017 all exceeded 1, suggesting poor utilization of the current resources and technologies. The indexes of technological efficiency in the rest of the years all exceeded 1, promoting the enhancement of total-factor productivity. The technological progress was similar to total-factor productivity in variation tendency. The indexes of the technological process in the other years all exceeded 1, except the minima in 2013–2014 with a variation index of below 1, which indicated that the technological progress can contribute to the enhancement of total-factor productivity.
Table 3 lists the results in eastern, central, and western China. The total-factor productivities in different regions showed similar variation tendencies in a fluctuant pattern. Except for the negative growth in central China from 2013 to 2014, the total-factor productivities of the other regions all showed fluctuant increases in the other years. The annual growth rates of the total-factor productivity indexes in the eastern, central, and western regions reached up to 12.3%, 18.8%, and 13.2%, respectively, suggesting constant enhancement of total-factor productivity on the whole. The annual total-factor productivity in central China was the largest, followed by the value in western China and finally by the value in the eastern region. However, the total-factor productivity in central China fluctuated significantly. On that basis, we found that, on the one hand, central and western China developed rapidly in terms of tourism industry; on the other hand, the tourism economic system in central China was vulnerable and the industry development was poor in stability.
According to the decomposition results, the two driving sources, i.e., the change of technological efficiency and the change of technological progress, simultaneously promoted the enhancement of total-factor productivity. For eastern China, the contribution rates of the change of technological efficiency and the change of technological progress were 2.1% and 10.2%, respectively; for central China, the contribution rates of the change of technological efficiency and the change of technological progress were 5.4% and 13.2%, respectively; for western China, the contribution rates of the change of technological efficiency and the change of technological progress were 3.3% and 10.1%, respectively. The results confirmed the constant enhancement of scientific and technological strength and comprehensive management capability of the tourism industry in eastern, central, and western China, effectively promoting the prosperity and development of the tourism industry. By contrast, the enhancement of the total-factor productivity in the tourism industry can mainly be attributed to technological progress rather than the enhancement of technological efficiency. In addition to the further enhancement of the scientific and technological levels of the tourism industry and the promotion of advanced technologies, various regions should still lay emphasis on the application and implementation of advanced management methods, enhance the technological efficiency, and achieve reasonable allocation of resources, thereby further increasing the tourism efficiency.

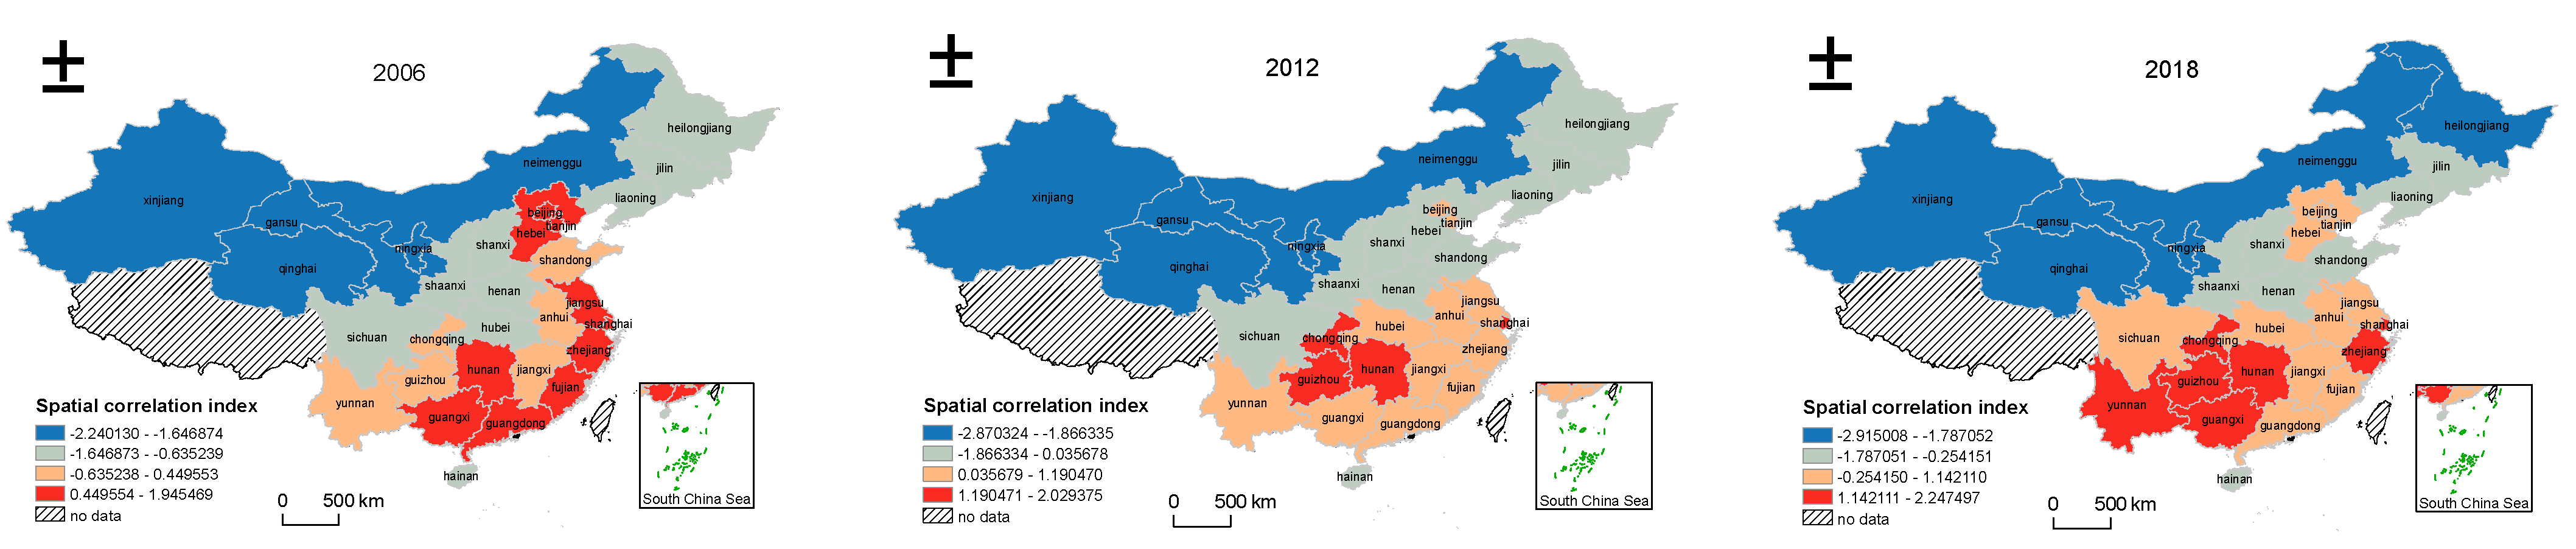
4.3. Spatial–Temporal Differentiation Characteristics of Tourism Efficiency in China

The spatial agglomeration phenomenon and characteristics of China’s tourism efficiency were revealed via exploratory spatial data analysis (ESDA). Using Arcgis 10.6 software, by taking the Queen adjacent matrix as the weight matrix of spatial relation, we calculated the global Moran’s indexes of China’s tourism efficiency from 2006 to 2018, as listed in Table 4. According to the calculated Z-values and p-values, only the results in 2008 and 2009 did not reach statistical significance, the results in 2010 reached 10% significance level, and the results in the rest of the years reached the 5% significance level. Moreover, the global Moran’s indexes in different years were positive, suggesting a positive spatial correlation on the whole. Overall, China’s tourism efficiency showed the characteristics of agglomeration–randomness–agglomeration in spatial distribution during the research period. Since 2010, the Moran’s index increased in a fluctuant pattern, suggesting increasingly significant spatial agglomeration of the regions with similar tourism economic efficiencies.
In order to further analyze the local spatial characteristics of tourism efficiency distribution, we selected the Getis–Ord Gi* index for characterizing local spatial correlation. The Getis–Ord Gi* indexes in 2006, 2012, and 2018 were calculated. Using Jenks natural break-point method, we were able to classify the regions into four types in ascending order of the spatial correlation index of tourism efficiency, i.e., cold-spot, sub-cold-spot, sub-hot-spot, and hot-spot regions. Moreover, the data were visualized for further analysis of spatial–temporal differentiation characteristics of tourism efficiency (Figure 2).
Overall, the tourism efficiency at the three time points was similar in a spatial pattern. The cold-spot regions were concentrated in northern China, while the hot-spot regions were mainly distributed in China’s southeastern coastal regions, with distinct differentiation on the whole. To be specific, the cold-spot regions showed stable variation during the research period, which were mainly distributed on the northwest of Hu’s line. Various provinces in northwestern China and the Inner Mongolia autonomous region remained as cold-spot regions, differing greatly from eastern China due to regional reasons, economic foundation, resource endowment, traffic conditions, and population density, being relatively backward in the development of a tourism industry. In 2018, Heilongjiang in northeastern China also evolved into a cold-spot region. This can mainly be attributed to over-investment in the ice–snow-oriented tourism industry chain and repeated construction, which accelerated the redundancy in input and inhibited the enhancement of economic efficiency to a certain degree [48]. The migration of hot-spot regions was found to be relatively active. There were 10 hot-spot provinces in 2006, which were mainly distributed along the coast and Hunan in the central reaches of the Yangtze River. The hot-spot regions overall showed J-shaped distribution. In 2012, the agglomeration effect weakened and the number of hot-spot regions was reduced to four (Shanghai, Chongqing, Guizhou, and Hunan). In 2018, the hot-spot regions expanded and diffused from the centers of Guizhou and Shanghai towards the surrounding regions. The first-weakened and then-enhanced agglomeration effect corresponded to the variation of the global spatial evolutional pattern. On the whole, the cold-spot regions were concentrated in northern China while the hot-spot regions were concentrated in southern China, with distinct spatial differentiation patterns.

4.4. Analysis of the Influencing Factors of Tourism Efficiency

4.4.1. Validation of GWR Model

The geographical weighted regression (GWR) model was established with the data of the variables that affected the provincial tourist efficiency in 2006, 2012, and 2018. Using the adaptive method, we determined the optimal bandwidth with minimum information criterion (AIC). Before model establishment, we performed a collinearity test on the above indexes so as to avoid the deviation in the regression results because of multicollinearity among variables. Table 5 shows the multicollinearity results of the influencing factors of tourism efficiency. The variance inflation factors of the independent variables in 3 years were all below 10, and the conditional number was lower than 30, suggesting almost no multicollinearity. Since the variance inflation factor of GDP (as an independent variable) in 2012 exceeded 10 and the model’s fitting degree showed no significant enhancement after the addition of GDP, we deleted GDP in the model of 2012.
As shown in Table 6, on the basis of the validation results of the GWR model, we found that the goodness values of fit in the 3 years of 2006, 2012, and 2018 were 0.854, 0.673, and 0.782, respectively, and the local R2 values were 0.794–0.854, 0.524–0.756, and 0.674–0.804, respectively, which were all over 0.5. It indicates that the model can adequately explain the spatial difference in tourism efficiency. In terms of local R2 distribution, the goodness values of fit in northeastern China and eastern coastal regions were low in 2012. On the basis of the validation results of the GWR model, we found that the tourism efficiency of the provinces in these regions was significantly affected by the economic development level. In order to ensure the overall model accuracy, we deleted the economic development level in that year, causing low goodness of fit.

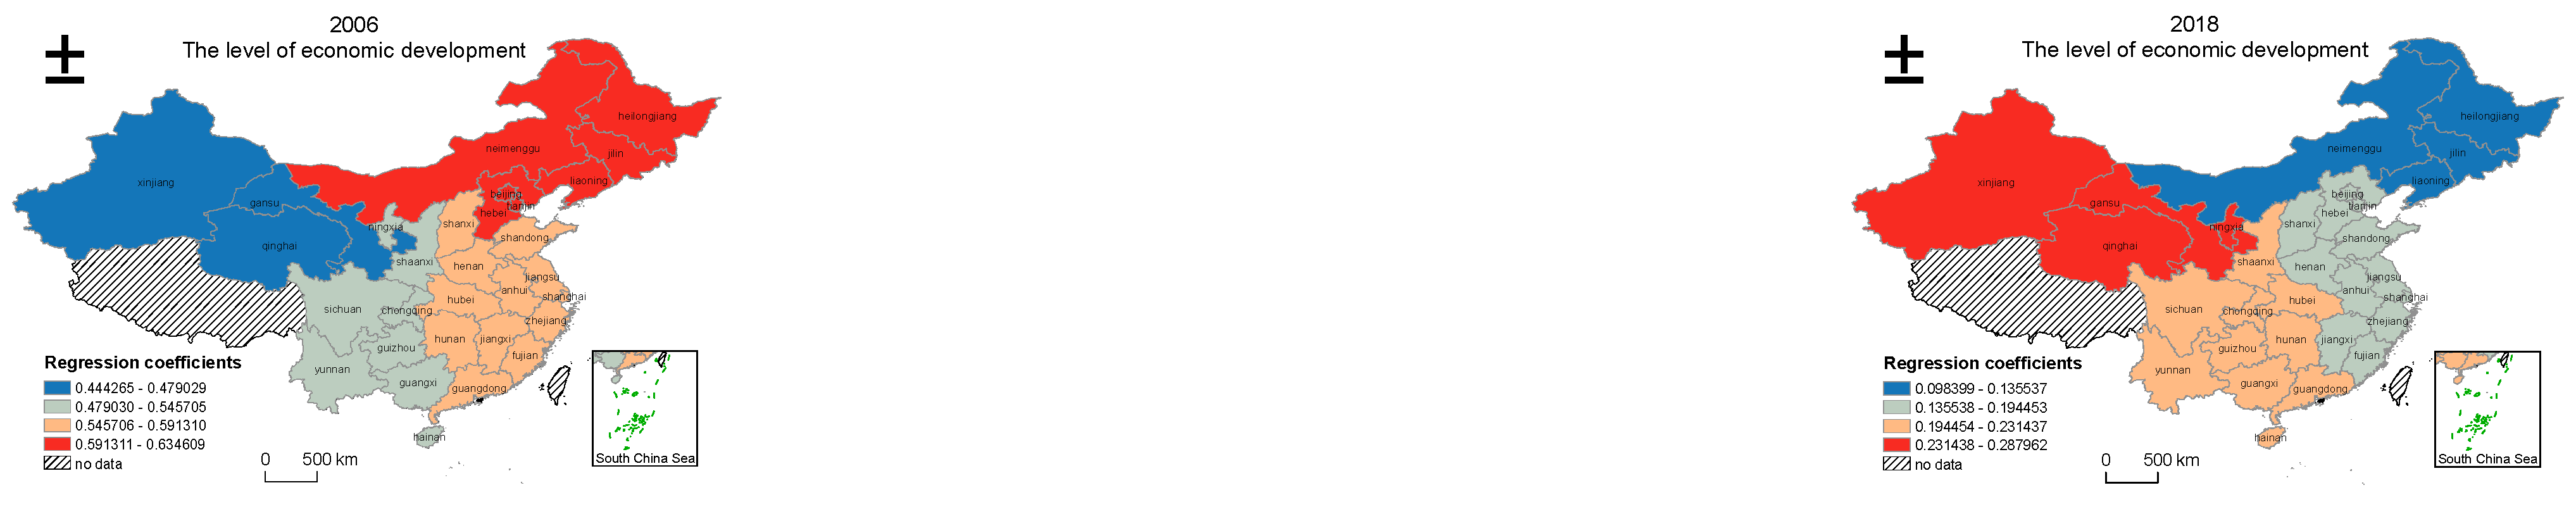
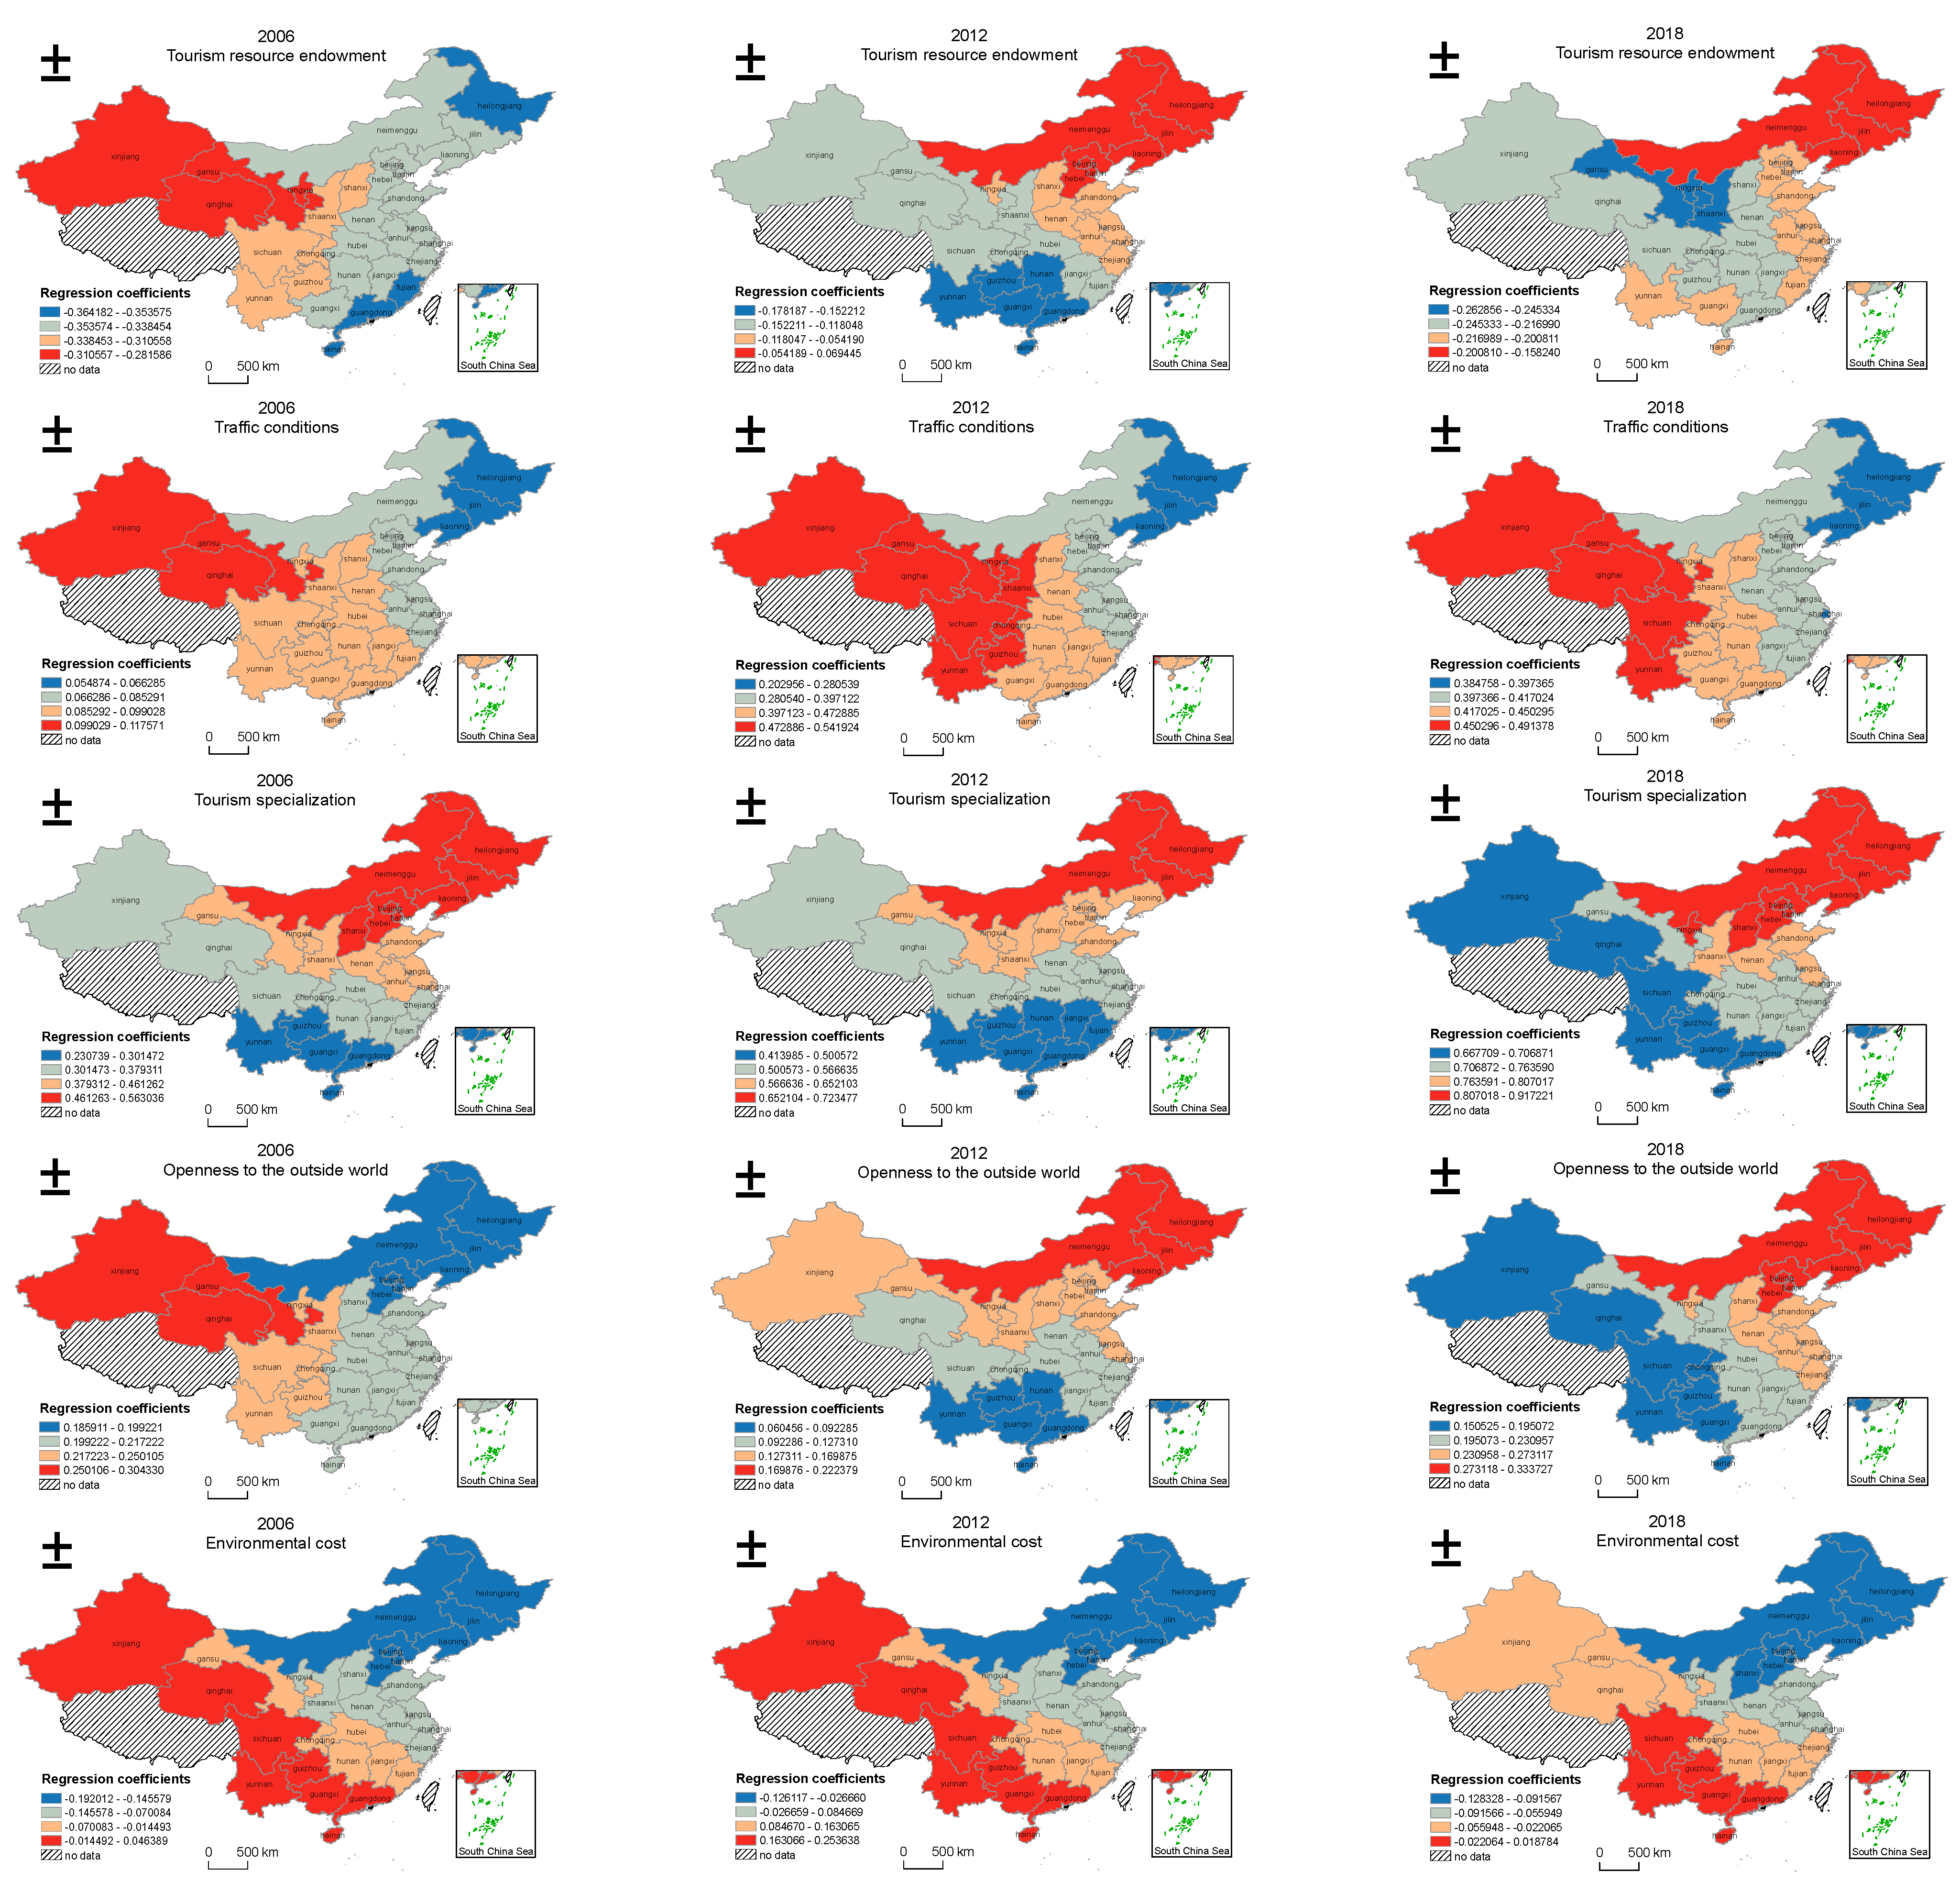
4.4.2. Analysis of the Spatial Heterogeneity of the Influencing Factors

The coefficients of the independent variables in the GWR model for 2006, 2012 and 2018 are visualized as shown in Figure 3. Economic development level is an important factor that affects the enhancement of tourism efficiency. In 2006, economic development level was the most important variable that imposed the most significant effect on tourism efficiency. The tourism efficiency increased with the enhancement of economic development level. In terms of spatial distribution of coefficients, high-influence regions were located in the northeastern China and the Beijing–Tianjin–Hebei Region, overall showing a tendency of gradually dropping from the east to the west. Economic development level imposed the slightest effect on tourism efficiency in northwestern China. In 2018, the influence of economic development level on tourism efficiency dropped significantly and showed a completely opposite spatial distribution pattern. High-influence regions were concentrated in northwestern China, while low-influence regions were mainly distributed in eastern China. Since eastern China with a well-developed economy started early in terms of a tourism industry, the capital utilization efficiency dropped gradually with over-concentration of capital and unceasingly expanding investment scale, thereby leading to diseconomies of scale. The change of consumer demand also greatly affected the enhancement of tourism efficiency. Accompanied with the increase of income, tourists began to generate strong interest in western China with its abundant natural resources. Therefore, the effect of economic development level on the tourism efficiency in western China was greater than that in eastern China.
The influencing degree and direction of tourism resource endowment differed among different regions in different years. In 2006 and 2018, tourism resource endowment was in negative correlation with tourism efficiency; however, high-influence regions differed greatly from low-influence regions. In 2006, high-influence regions were mainly located in eastern China with its abundant tourism resources, suggesting lower tourism efficiency in the region with richer tourism resources. With the increasing tourism resources, the maintenance and management levels of different scenic spots were uneven. Both management and operation of low-level scenic spots may face great challenges and even seriously be in debt, causing serious waste of resources. In 2018, high-influence regions were mainly located in northwestern and central China with relatively poor tourism resources. This may have been because the regions with fewer tourism resources cannot gain popularity among tourists and satisfy their consumer demands with the increase in tourism consumption demand, thereby leading to low tourism efficiency. In 2012, the action tendency changed. Tourism resource endowment in eastern, northern coastal, and northeastern China was positively correlated with tourism efficiency, while the correlation between tourism resource endowment and tourism efficiency was negative in other regions. However, tourism resource endowment imposed a slight effect in most regions. Tourism resource endowment had a great positive influence in Beijing, Tianjin, and Hebei, which can be attributed to high-quality and concentrated tourism resources in these regions. In addition, the great attraction from two central cities, Beijing and Tianjin, can generate a siphonic effect and thereby enhance tourism efficiency.
Traffic condition determines the accessibility of the tourist destination. In terms of the distribution of regression coefficient, traffic condition imposes an increasing effect on tourism efficiency with time. Moreover, the influence strength increased gradually from the east to the west. On the one hand, well-developed traffic network in eastern China can improve the accessibility of the tourism scenic spots. There exists great space for the locational selection of tourism investment activities. By contrast, western China is rich in natural resources but restricts the accessibility of tourism scenic spots. The convenience of traffic conditions also directly determines the development of tourism level. Therefore, the influence of traffic conditions on tourism efficiency in western China is higher than that in eastern China.
The tourism professional level imposed a significantly positive effect on the enhancement of tourism efficiency and gradually became the factor with the greatest influence strength. This was due to the fact that the scale effect generated in the development of regional tourism industry was greater at a higher tourism professional level, accompanied with higher utilization rate of resources. In addition, the increasing professional level of tourism can promote the accumulation of tourism factors and the overflow, such as technological innovation, producing agglomeration effect and radiation effect, thereby effectively enhancing the tourism efficiency. The effects of tourism professional level showed similar spatial distribution at the three time points. High-influence regions were mainly located in the Yellow River basin and northeastern China at a low professional level, while low-influence regions were concentrated in southwestern China at a high professional level. The influence strength dropped steadily from the northeast to the southwest. Moreover, the sensitivity of the region at the higher professional level of tourism was found to be lower, and vice versa.
The degree of openness was positively correlated with tourism efficiency. The enhancement of openness degree can contribute to the absorption of foreign capital and advanced technologies, as well as the introduction of management experiences, thereby promoting the upgrade of the tourism industry structure. Meanwhile, opening to the outside world can stimulate rapid development of entry–exit tourism and can further enhance tourism efficiency. In terms of the spatial distribution of coefficients, high-influence regions were mainly in western China in 2006, while low-influence regions were mainly located in eastern China. In 2012, the spatial distribution changed obviously; high-influence regions were concentrated in northeastern China and low-influence regions were concentrated in southwestern China. The influence strength in 2018 was similar to that in 2012 in terms of spatial distribution, which dropped gradually from the northeast to the southwest.
Overall, the environmental cost can slightly affect tourism efficiency; however, the action direction showed unstable spatial–temporal distributions, with obvious spatial heterogeneity. In 2006, by taking Gansu, Chongqing, and Hunan as the boundary, we found that the environmental cost in the western region was slightly in positive correlation with tourism efficiency, while the environmental cost was significantly in negative correlation with tourism efficiency. In 2012, more and more provinces showed a positive correlation between environmental cost and tourism efficiency, which were mainly distributed in central and western China; furthermore, the action force with positive influence increased while the action with negative influence decreased. As stated above, carbon emission calculated in this study was based on the consumed energy capacity via conversion. Since undertaking the industrial gradient transfer from eastern China, energy consumption in central and western China increased, which was indicative of rapid economic development. This can also account for serious multicollinearity after the addition of economic development level to GWR model as an independent variable. In 2018, all provinces in China showed a slightly negative correlation between environmental cost and tourism efficiency.

5. Conclusions and Discussion

5.1. Conclusions

This study focused on 30 provinces in China and explored spatial–temporal differentiations and the influence factor of tourism efficiency among different provinces by combining the super-efficiency SBM model, Malmquist index, ESDA, and GWR. The main conclusions are described below.
(1) China’s tourism efficiency overall increased gradually during the period from 2006 to 2018, and the spatial pattern of tourism efficiency that was stronger in the east and lower in the west weakened, that is, China’s tourism efficiency grew towards equalization. The tourism efficiency of most provinces was significantly enhanced; however, the provinces with medium- and low-efficiency still occupied a great proportion, with great room for improvement of tourism development. The Malmquist indexes of China and three economic belts and the related decomposition resulted in different periods being calculated. It was observed from the temporal evolution tendency that the utilization degree of various input factors was constantly improved with the development of China’s provincial tourism development, with constant enhancement of economic efficiency. Technological efficiency and technological progress can jointly promote rapid growth of total-factor productivity. By contrast, the enhancement of total-factor productivity in the tourism industry can mainly be attributed to technological progress rather than the increase of technological efficiency. In the future, we should stress the application and implementation of advanced management methods and reasonable promotion and application of advanced technologies so as to achieve reasonable allocation of resources and further enhancement of tourism efficiency.
(2) In terms of national spatial distribution, tourism efficiency in China showed the feature of agglomeration–randomness–agglomeration, with constantly enhanced spatial correlation. In terms of local spatial distribution, there were distinct differentiation characteristics. Northern China, especially northwestern China and Inner Mongolia, were always the cold-spot regions, while some hot-spot regions with Shanghai and Guizhou as the centers expanded gradually towards the surrounding provinces in southern China. Overall, the spatial differentiation characterized by lower tourism efficiency in the north and higher tourism efficiency in the south was gradually formed.
(3) The value of economic efficiency was the result of the interaction of multiple factors. On account of different influencing strengths and action tendencies of various influencing factors among different regions, tourism efficiency showed obvious spatial–temporal differentiation. The level of economic development, traffic conditions, the professional level of tourism, and openness degree were able to significantly promote the enhancement of tourism efficiency. To be specific, the promotion effect of economic development level weakened with time, while both traffic conditions and the professional level of tourism played increasingly important roles. The tourism resource endowment and environmental cost imposed slight effects and varied in action direction, which was able to inhibit the enhancement of tourism efficiency of most regions. Therefore, improving the construction of traffic systems, expanding the openness degree, promoting the agglomeration development of tourism industry, reasonably allocating various resource input factors, protecting the natural ecological environment, and ensuring energy conservation and emission reduction are all effective ways of enhancing tourism efficiency.

5.2. Policy Suggestions

On the basis of empirical analysis results, we can make the following policy suggestions. Firstly, the investment in tourism factors should be reasonably increased; the management level of the administrators should be enhanced; the allocation of resource factors should be rationally optimized; and the problem of redundancy input of many factors including resource, capital, and labor should be effectively addressed, thereby accelerating the transition from resource-dominant to industry-dominant tourism. Secondly, there was a strong spatial correlation of tourism efficiency among various provinces in China. We should strive to overcome the administrative barrier, promote the exchange of technical and management experiences among different provinces, and perfect the tourism competition–cooperation mechanism among provinces. Accordingly, the driving role of high-efficiency regions can be brought into fully play, and the maximization of positive spillover effect of tourism economy can be promoted so as to further narrow the regional gap and achieve high-efficiency balanced development of China’s tourism industry. Thirdly, we should stress the construction of tourism transportation infrastructures and give fully play to the point-to-surface connection role of traffic in regional tourism cooperation, thereby promoting regional agglomeration of the regional tourism industry and accelerating the formation of a novel uniform tourism pattern. Finally, we should reinforce the scientific and technological innovation, promote the deep integration between scientific and technological achievements and the tourism industry, and enhance the technological content of tourism products. Meanwhile, we should strongly advocate for the development and planning of tourism resources and environmental protection, as well as establish and perfect the innovative system of the tourism industry.
China is the greatest tourist source and tourism consumption country in the world. The development status of China’s tourism industry can reflect the development condition of global tourism. The other countries and regions with comparability with China, especially the countries and regions with rapidly developed tourism industries, all face a similar problem, the optimization of tourism efficiency. The technical route and related policy suggestions in this study can provide insightful references for other countries and regions, contribute to a more clear evaluation of tourism efficiency by the administrators in these countries and regions, and promote better and faster development of the domestic tourism industry.

5.3. Limitations and Future Research

The tourism industry is a comprehensive industry integrating many factors including food, shelter, traffic, travel, shopping, and recreation, in which many industries interweave with each other. Gaining in-depth knowledge of spatial–temporal heterogeneity of tourism efficiency and revealing the driving factors can contribute to realizing the full potential of the tourism industry, achieving industrial linkage and promoting regional economic development. Due to the strong correlation in the tourism industry, there are a variety of measurement methods and influencing factors of tourism efficiency. This study adopted the DEA model to measure tourism efficiency, which cannot fully reflect operation and management conditions of regional tourism. Meanwhile, in view of data availability, the selected input/output indexes and the related influencing factors cannot fully reflect the overall performance of the tourism industry. Therefore, more indexes should be taken into overall consideration in future studies. Increasing both influencing factors and the number of regional samples can contribute to revealing the properties and rules during the development of tourism industry so as to further formulate tourism development plans and strategies in a scientific and reasonable way.

Author Contributions

Conceptualization, C.L. (Chengpeng Lu) and J.M.; methodology, Z.L.; formal analysis, Z.L. and D.S.; investigation, C.L. (Chengpeng Lu), Z.L., D.S., H.L. and C.L. (Chenyu Lu); writing—original draft preparation, Z.L. and C.L. (Chengpeng Lu); writing—review and editing, C.L. (Chengpeng Lu). All authors have read and agreed to the published version of the manuscript.

Funding

This research was funded by National Natural Science Foundation of China (41701142, 41971162, 42061054), Fundamental Research Funds for the Central Universities (2020jbkyjc002) and Science and Technology program of Gansu Province (20CX4ZA039, 21JR1RA234).

Institutional Review Board Statement

Not applicable.

Informed Consent Statement

Not applicable.

Data Availability Statement

Not applicable.

Conflicts of Interest

The authors declare no conflict of interest.

References

  1. Organiztion, W.T. UNWTO Annual Report 2019; UNWTO: Madrid, Spain, 2019. [Google Scholar]
  2. Ministry of Culture and Tourism of the People’s Republic of China; Statistical Bulletin of Culture and Tourism Development in 2018; Ministry of Culture and Tourism: Beijing, China, 2019.
  3. Hadad, S.; Hadad, Y.; Malul, M.; Rosenboim, M. The economic efficiency of the tourism industry: A global comparison. Tour. Econ. 2012, 18, 931–940. [Google Scholar] [CrossRef]
  4. Ma, X. Progress and trends of tourism efficiency research home and abroad. Hum. Geogr. 2012, 27, 11–17. [Google Scholar]
  5. Köksal, C.D.; Aksu, A.A. Efficiency evaluation of A-group travel agencies with data envelopment analysis (DEA): A case study in the Antalya region, Turkey. Tour. Manag. 2007, 28, 830–834. [Google Scholar] [CrossRef]
  6. Barros, C.P. Airports in Argentina: Technical efficiency in the context of an economic crisis. J. Air Transp. Manag. 2008, 14, 315–319. [Google Scholar] [CrossRef]
  7. Sarkis, J.; Talluri, S. Performance based clustering for benchmarking of US airports. Transp. Res. Part A Policy Pract. 2004, 38, 329–346. [Google Scholar] [CrossRef]
  8. Fuentes, R. Efficiency of travel agencies: A case study of Alicante, Spain. Tour. Manag. 2011, 32, 75–87. [Google Scholar] [CrossRef]
  9. Assaf, A.; Barros, C.P.; Josiassen, A. Hotel efficiency: A bootstrapped metafrontier approach. Int. J. Hosp. Manag. 2010, 29, 468–475. [Google Scholar] [CrossRef]
  10. Barros, C.P. Analysing the rate of technical change in the Portuguese hotel industry. Tour. Econ. 2006, 12, 325–346. [Google Scholar] [CrossRef]
  11. Aurélie, C. Benchmarking and tourism efficiency in France. Tour. Econ. 2015, 51, 91–95. [Google Scholar]
  12. Ane, E.R.; Josep, M.R. Tourism indicators and airports’ technical efficiency. Ann. Tour. Res. 2020, 80, 102819. [Google Scholar]
  13. lo Storto, C. The analysis of the cost-revenue production cycle efficiency of the Italian airports: A NSBM DEA approach. J. Air Transp. Manag. 2018, 72, 77–85. [Google Scholar] [CrossRef]
  14. Assaf, A.G.; Dwyer, L. Benchmarking international tourism destinations. Tour. Econ. 2013, 19, 1233–1247. [Google Scholar] [CrossRef] [Green Version]
  15. Bosetti, V.; Locatelli, G. A data envelopment analysis approach to the assessment of natural park s economic efficiency and sustainability: The case of Italian natural parks. Sustain. Dev. 2006, 14, 277–286. [Google Scholar] [CrossRef] [Green Version]
  16. Lee, C.K.; Han, S.H. Estimating the use and preservation values of national parks’ tourism resources using a contingent valuation method. Tour. Manag. 2002, 23, 531–540. [Google Scholar] [CrossRef]
  17. Baggio, R.; Micera, R.; Del Chiappa, G. Smart tourism destinations: A critical reflection. J. Hosp. Tour. Technol. 2020, 11, 407–423. [Google Scholar] [CrossRef]
  18. Cuccia, T.; Guccio, C.; Rizzo, I. The effects of UNESCO World Heritage List inscription on tourism destinations performance in talian regions. Econ. Model. 2016, 53, 494–508. [Google Scholar] [CrossRef]
  19. Peypoch, N.; Solonandrasana, B. Aggregate efficiency and productivity analysis in the tourism industry. Tour. Econ. 2008, 14, 45–56. [Google Scholar] [CrossRef]
  20. Goncalves, O. Efficiency and productivity of French ski resorts. Tour. Manag. 2013, 36, 650–657. [Google Scholar] [CrossRef]
  21. Assaf, A.; Agbola, F.W. Total productivity in the Australian hotel industry: Estimating and bootstrapping Malmquist indices. Tour. Anal. 2011, 16, 295–304. [Google Scholar] [CrossRef] [Green Version]
  22. Barros, C.P.; Alves, F.P. Productivity in the tourism industry. Int. Adv. Econ. Res. 2004, 10, 215–225. [Google Scholar] [CrossRef]
  23. Jiang, L.; Shao, H.; Wang, K. A research on space-time heterogeneity of tourism efficiency and influencing factors in China. Tour. Res. 2018, 10, 20–30. [Google Scholar]
  24. Zhang, Y. Spatial and temporal evolution of star-rated hotels’ efficiency in China based on DEA-Malmquist model. Sci. Geogr. Sin. 2017, 37, 406–415. [Google Scholar]
  25. Sun, J.; Zhang, J.; Zhang, J.; Ma, J.; Li, L. Spatial differentiation of efficiency of Chinese regional travel service industry. Sci. Geogr. Sin. 2014, 34, 430–437. [Google Scholar]
  26. Wang, S.; Qiao, H.; Feng, J.; Xie, S. The spatio-temporal evolution of tourism eco-efficiency in the Yellow River Basin and its interactive response with tourism economy development level. Econ. Geogr. 2020, 40, 81–89. [Google Scholar]
  27. Wang, Z.; Liu, Q. The spatio-temporal evolution of tourism eco-efficiency in the Yangtze River Economic Belt and its interactive response with tourism economy. J. Nat. Resour. 2019, 34, 1945–1961. [Google Scholar]
  28. Jiang, Y.; Pan, Z.; Pan, M. Spatial variation and strategic pattern optimization of operation efficiency of rural tourism in Chongqing. Resour. Sci. 2016, 38, 2181–2191. [Google Scholar]
  29. Long, Z.; Du, Q.; Zhou, T. The evolution of time and space differentiation of Wuling Mountain area tourism poverty alleviation efficiency. Econ. Geogr. 2015, 35, 210–217. [Google Scholar]
  30. Wang, H. A research on China’s tourism efficiency: A managerial and environmental perspective. Tour. Sci. 2014, 28, 31–40+53. [Google Scholar]
  31. Fang, Y.; Huang, Z.; Lu, W.; Peng, Q. Spatial differentiation of tourism economy and its mechanism in Chinese cities. Geogr. Geo-Inf. Sci. 2013, 29, 100–104, 110, 129. [Google Scholar]
  32. Wang, Z.; Zhao, S. Temporal and spatial dynamic evolution and influencing factors of tourism efficiency in Hunan Province based on DEA-Malmquist model. Resour. Environ. Yangtze Basin 2019, 28, 1886–1897. [Google Scholar]
  33. Lin, C.; Wen, J. Review and prospect of tourism efficiency research in China. J. Cent. South Univ. For. Technol. (Soc. Sci.) 2017, 11, 61–64, 70. [Google Scholar]
  34. Ji, X.; Qin, W.; Li, S.; Liu, X.; Wang, Q. Development efficiency of tourism and influencing factors in China’s prefectural-level administrative units. Resour. Sci. 2021, 43, 185–196. [Google Scholar]
  35. Gong, Y.; Guo, Z. A study on efficiency and countermeasures of tourism development in Jiangsu Province—Analyses based on super-efficiency DEA and Malmquist index. East China Econ. Manag. 2014, 28, 7–12, 17. [Google Scholar]
  36. Cao, Y.; Ma, L. Evaluation on the efficiency of tourism poverty alleviation in China’s ethnic regions based on the three-stage DEA. East China Econ. Manag. 2017, 31, 91–97. [Google Scholar]
  37. Zhu, C.; Yue, H.; Yan, H.; Li, T. Study on the efficiency of regional tourism industry in China based on stochastic frontline production and cost function estimation. Tour. Trib. 2009, 24, 18–22. [Google Scholar]
  38. You, S.; Lin, Z.; Han, Z. Spatial-temporal characteristics and growth mechanism of urban tourism efficiency in Guangdong Province. Resour. Sci. 2017, 39, 1545–1559. [Google Scholar]
  39. Wang, R.; Xia, B.; Dong, S.; Li, Y. Research on the Spatial Differentiation and Driving Forces of Eco-Efficiency of Regional Tourism in China. Sustainability 2021, 13, 280. [Google Scholar] [CrossRef]
  40. Kaoru, T. A Slacks-Based Measure of Super-Efficiency in Data Envelopment Analysis; Elsevier B.V.: Amsterdam, The Netherlands, 2002; Volume 143. [Google Scholar]
  41. Färe, R.; Grosskopf, S.; Lindgren, B.; Roos, P. Productivity Changes in Swedish Pharamacies 1980-1989: A Non-Parametric Malmquist Approach. Kluwer Acad. Publ. 1992, 3, 85–101. [Google Scholar]
  42. Li, J.; Zhou, C.; Zhang, C.; Liu, F.; Wang, J. Total-factor ecological efficiency of Dongting Lake Ecological and Economic Zone in Hunan Province on the basis of ecological footprint. Econ. Geogr. 2019, 39, 199–206. [Google Scholar]
  43. Ma, X.; Bao, J. Study on the evolution of Chinese primary cities’ tourism efficiency influence factors. Econ. Geogr. 2009, 29, 1203–1208. [Google Scholar]
  44. Han, Y.; Shi, Q.; Feng, W.; Zhou, X.; Li, X. Temporal spatial differences of tourism industry efficiency and the influencing factors in Shanxi province. J. Arid. Land Resour. Environ. 2019, 33, 187–194. [Google Scholar]
  45. Guo, X.; Mu, X.; Ming, Q. Spatial differences and driving factors of tourism efficiency in border regions—A case of Yunnan Province. World Reg. Stud. 2020, 29, 416–427. [Google Scholar]
  46. Deng, H.; Lu, L. The urban tourism efficiencies of cities in Anhui Province based on DEA model. J. Nat. Resour. 2014, 29, 313–323. [Google Scholar]
  47. Xie, Y.; Zhao, Y. Measuring carbon dioxide emissions from energy consumption by tourism in Yangtze River Delta. Geogr. Res. 2012, 31, 429–438. [Google Scholar]
  48. Wu, Y.; Song, Y. Spatio-temporal pattern evolution and driving factors of tourism efficiency in Northeast China. Areal Res. Dev. 2019, 38, 85–90. [Google Scholar]
Figure 1. Malmquist indexes of China’s tourism efficiency during the period from 2006 to 2018 and the related decomposition results.
Sustainability 13 05825 g001
Figure 2. Evolutions of cold-spot and hot-spot regions of tourism efficiency in China.
Sustainability 13 05825 g002
Figure 3. GWR analysis results of the influencing factors of China’s tourism efficiency.
Sustainability 13 05825 g003aSustainability 13 05825 g003b
Table 1. Descriptive statistics of China’s tourism efficiency from 2006 to 2018.
YearMeanCoefficient of Variationρ ≥ 10.8 ≤ ρ < 10.6 ≤ ρ < 0.8ρ ≤ 0.6
20060.6090.48650520
20070.6650.47271418
20080.7010.47490615
20090.7410.451100911
20100.7510.418110910
20110.7660.408104610
20120.7580.39110389
20130.7660.3909489
20140.7600.38693108
20150.7610.403102108
20160.7670.39393117
20170.7710.432122610
20180.8070.416122610
Table 2. Measurement results of tourism efficiency in various provinces of China in 2006, 2012, and 2018.
DMU200620122018MeanDMU200620122018Mean
Beijing1.0351.0451.0681.059Henan0.6850.8380.8210.896
Tianjin1.2791.1821.1551.253Hubei0.4740.8160.8440.728
Hebei0.4590.5070.5220.510Hunan0.5000.7560.8510.739
Liaoning0.5430.8501.0180.765Central region mean0.5220.8220.8140.757
Shanghai1.1251.1711.3291.175Chongqing0.6581.1021.1441.046
Jiangsu1.0071.0141.0150.963Sichuan0.7061.0761.0590.970
Zhejiang0.5290.7050.7640.687Guizhou0.6061.1211.5941.170
Fujian0.6840.6091.0030.711Yunnan0.4380.5750.6850.602
Shandong0.5620.6780.5890.628Shaanxi0.5900.7500.7700.715
Guangdong1.4651.1111.0751.234Gansu0.3010.3740.5190.386
Hainan0.4050.4150.5020.436Qinghai0.2920.2770.2490.273
Eastern region mean0.8270.8440.9130.856Ningxia0.2750.2670.2460.273
Shanxi0.5460.6391.0620.752Xinjiang0.2290.2760.2850.257
Jilin0.4740.5850.5910.587Guangxi0.5680.7440.8580.722
Heilongjiang0.5821.1170.4660.794Inner Mongolia0.3330.3170.2570.319
Anhui0.4690.7740.8460.730Western region mean0.4540.6250.6970.612
Jiangxi0.4501.0471.0310.826
Table 3. Malmquist indexes of China’s tourism efficiency during the period from 2006 to 2018 and the related decomposition results.
YearEastern ChinaCentral ChinaWestern China
MIECTCMIECTCMIECTC
2006–20071.1021.0381.0601.2681.1761.0741.1561.1011.052
2007–20081.0731.0001.0771.2031.1071.0851.1511.0791.067
2008–20091.1121.0301.0801.1421.1151.0251.1231.0721.048
2009–20101.3411.0591.2631.3791.0711.3301.2361.0091.232
2010–20111.1270.9891.1391.2931.0751.2031.1871.0211.163
2011–20121.0760.9781.1041.1581.0231.1341.1141.0011.114
2012–20131.0960.9921.1111.1621.0421.1161.0961.0131.082
2013–20141.0371.0171.0200.9510.9760.9781.0101.0240.987
2014–20151.0841.0141.0691.1390.9971.1431.0280.9811.049
2015–20161.1491.0291.1241.1450.9791.1701.1581.0401.113
2016–20171.1300.9641.1731.3641.0831.2711.1780.9581.242
2017–20181.1431.1461.0091.0501.0071.0611.1471.0941.065
Mean value1.1231.0211.1021.1881.0541.1321.1321.0331.101
Variation coefficient0.0650.0450.0600.1000.0560.0850.0540.0420.067
Table 4. Global Moran’s indexes of tourism efficiency.
Year2006200720082009201020112012201320142015201620172018
Moran’s I0.24070.21040.12770.15260.18790.24500.22860.22610.31920.31550.27710.37250.3170
Z-score2.34242.03461.33391.52961.80222.26712.13422.12022.88062.84722.53923.31532.8901
p-value0.01920.04190.18220.12610.07150.02340.03280.03400.00400.00440.01110.00090.0039
Table 5. Multicollinearity test results of the influencing factors of tourism efficiency.
YearVariance Inflation Factor (VIF)Number of Conditions
EDTRETCTSODEC
20069.273.452.162.953.155.317.18–19.88
20122.262.051.741.582.5911.81–13.09
20184.262.421.62.52.182.7112.65–14.91
Table 6. Validation of GWR model with the influencing factors of tourism efficiency.
Test Items200620122018
R20.8540.6730.782
Adjusted R20.7770.5270.67
Local R20.794–0.8540.524–0.7560.674–0.804
Residual sum of squares0.140.1720.193
Publisher’s Note: MDPI stays neutral with regard to jurisdictional claims in published maps and institutional affiliations.

