
An Assessment of Forest Fires and CO2 Gross Primary Production from 1991 to 2019 in Mação (Portugal)

 , ,
, ,
Abstract
1. Introduction
2. Materials and Methods
3. Results and Discussion
4. Conclusions
Supplementary Materials
Author Contributions
Funding
Institutional Review Board Statement
Informed Consent Statement
Data Availability Statement
Conflicts of Interest
References
- Knorr, W.; Jiang, L.; Arneth, A. Climate, CO2 and human population impacts on global wildfire emissions. Biogeosciences 2016, 13, 267–282. [Google Scholar] [CrossRef]
- Guo, M.; Li, J.; Wen, L.; Huang, S. Estimation of CO2 Emissions from Wildfires Using OCO-2 Data. Atmosphere 2019, 10, 581. [Google Scholar] [CrossRef]
- Escuin, S.; Navarro, R.; Fernandez, P. Fire severity assessment by using NBR (Normalized Burn Ratio) and NDVI (Normalized Difference Vegetation Index) derived from LANDSAT TM/ETM images. Int. J. Remote Sens. 2008, 29, 1053–1073. [Google Scholar] [CrossRef]
- Takayama, N. Monitoring for Circumstance of Wildfire Occurrence in Kalimantan by Using Satellite Remote Sensing Data Based on GIS. JTMB J. Terap. Manaj. Bisnis 2018, 4, 79–86. [Google Scholar] [CrossRef]
- Shvetsov, E.G.; Kukavskaya, E.A.; Buryak, L.V.; Barrett, K. Assessment of post-fire vegetation recovery in Southern Siberia using remote sensing observations. Environ. Res. Lett. 2019, 14, 055001. [Google Scholar] [CrossRef]
- García-Llamas, P.; Suárez-Seoane, S.; Taboada, A.; Fernández-García, V.; Fernández-Guisuraga, J.M.; Fernández-Manso, A.; Quintano, C.; Marcos, E.; Calvo, L. Assessment of the influence of biophysical properties related to fuel conditions on fire severity using remote sensing techniques: A case study on a large fire in NW Spain. Int. J. Wildland Fire 2019, 28, 512–520. [Google Scholar] [CrossRef]
- Ide, R.; Nakaji, T.; Motohka, T.; Oguma, H. Advantages of visible-band spectral remote sensing at both satellite and near-surface scales for monitoring the seasonal dynamics of GPP in a Japanese larch forest. J. Agric. Meteorol. 2011, 67, 75–84. [Google Scholar] [CrossRef]
- Ryu, J.H.; Han, K.S.; Hong, S.; Park, N.W.; Lee, Y.W.; Cho, J. Satellite-Based Evaluation of the Post-Fire Recovery Process from the Worst Forest Fire Case in South Korea. Remote Sens. 2018, 10, 918. [Google Scholar] [CrossRef]
- Mäkelä, A.; Pulkkinen, M.; Kolari, P.; Lagergren, F.; Berbigier, P.; Lindroth, A.; Loustaus, D.; Nikinmaa, E.; Vesala, T.; Hari, P. Developing an empirical model of stand GPP with the LUE approach: Analysis of eddy covariance data at five contrasting conifer sites in Europe. Glob. Chang. Biol. 2008, 14, 92–108. [Google Scholar] [CrossRef]
- Xiao, J.; Zhuang, Q.; Law, B.E.; Chen, J.; Baldocchi, D.D.; Cook, D.R.; Oreng, R.; Richardson, A.D.; Wharton, S.; Ma, S.; et al. A continuous measure of gross primary production for the conterminous United States derived from MODIS and AmeriFlux data. Remote Sens. Environ. 2010, 114, 576–591. [Google Scholar] [CrossRef]
- Semeraro, T.; Vacchiano, G.; Aretano, R.; Ascoli, D. Application of vegetation index time series to value fire effect on primary production in a Southern European rare wetland. Ecol. Eng. 2019, 134, 9–17. [Google Scholar] [CrossRef]
- Pereira, J.M.C.; Carreiras, J.M.B.; Silva, J.M.N.; Vasconcelos, M.J. Alguns conceitos básicos sobre os fogos rurais em Portugal. In Incêndios Florestais em Portugal: Caracterização, Impactes e Prevenção; Pereira, J.S., Pereira, J.M.C., Rego, F.C., Silva, J.M.N., Silva, T.P., Eds.; ISAPress: Lisboa, Portugal, 2006; pp. 133–161. [Google Scholar]
- Pausas, J.G.; Llovet, J.; Rodrigo, A.; Vallejo, R. Are wildfires a disaster in the Mediterranean basin? A review. Int. J. Wildland Fire 2009, 17, 713–723. [Google Scholar] [CrossRef]
- Fernandes, P.M. Combining forest structure data and fuel modelling to classify fire hazard in Portugal. Ann. Forest Sci. 2009, 66, 1–9. [Google Scholar] [CrossRef]
- Marques, S.; Garcia-Gonzalo, J.; Borges, J.G.; Botequim, B.; Oliveira, M.M.; Tomé, J.; Tomé, M. Developing post-fire Eucalyptus globulus stand damage and tree mortality models for enhanced forest planning in Portugal. Silva Fenn. 2011, 45, 69–83. [Google Scholar] [CrossRef]
- Fernandes, P.M.; Guiomar, N.; Rossa, C.G. Analysing eucalypt expansion in Portugal as a fire-regime modifier. Sci. Total Environ. 2019, 666, 79–88. [Google Scholar] [CrossRef] [PubMed]
- Ferreira-Leite, F.; Bento-Gonçalves, A.; Lourenço, L. Grandes incêndios florestais em Portugal Continental. Da história recente à atualidade. Cad. Geogr. 2012, 30–31, 81–86. [Google Scholar] [CrossRef][Green Version]
- ICNF—Instituto da Conservação da Natureza e das Florestas. Available online: http://www2.icnf.pt/portal/florestas/dfci/inc/estat-sgif#list (accessed on 16 April 2021).
- ICNF. 9º Relatório Provisório de Incêndios Florestais de 01 Janeiro a 16 de Outubro; Instituto da Conservação da Natureza e das Florestas, I.P./Departamento de Gestão de Áreas Classificadas, Públicas e de Proteção Florestal: Lisboa, Portugal, 2017; Available online: http://www2.icnf.pt/portal/florestas/dfci/relat/rel-if/2017 (accessed on 16 April 2021).
- CTI. Análise e Apuramento dos Factos Relativos aos Incêndios que Ocorreram em Pedrógão Grande, Castanheira de Pera, Ansião, Alvaiázere, Figueiró dos Vinhos, Arganil, Góis, Penela, Pampilhosa da Serra, Oleiros e Sertã, entre, 17 e 24 de Junho; Comissão Técnica Independente, Assembleia da República: Lisboa, Portugal, 2017; Available online: https://www.parlamento.pt/Documents/2017/Outubro/Relat%C3%B3rioCTI_VF%20.pdf (accessed on 16 April 2021).
- Guerreiro, J.; Fonseca, C.; Salgueiro, A.; Fernandes, P.; Lopez Iglésias, E.; de Neufville, R.; Mateus, F.; Castellnou Ribau, M.; Sande Silva, J.; Moura, J.M.; et al. Avaliação dos Incêndios Ocorridos entre 14 e 16 de Outubro de 2017 em Portugal Continental, Relatório Final; Comissão Técnica Independente, Assembleia da República: Lisboa, Portugal, 2018. Available online: https://www.portugal.gov.pt/pt/gc21/comunicacao/documento?i=avaliacao-dos-incendios-ocorridos-entre-14-e-16-de-outubro-de-2017-em-portugal-continental (accessed on 16 April 2021).
- ICNF. 8º Relatório Provisório de Incêndios Rurais de 01 de Janeiro a 15 de Outubro; Instituto da Conservação da Natureza e das Florestas, I.P./Departamento de Gestão de Áreas Classificadas, Públicas e de Proteção Florestal: Lisboa, Portugal, 2019; Available online: http://www2.icnf.pt/portal/florestas/dfci/relat/rel-if/2019 (accessed on 16 April 2021).
- ICNF. Relatório Anual de Áreas ardidas e Incêndios Florestais em Portugal Continental; Instituto da Conservação da Natureza e das Florestas, I.P./Departamento de Gestão de Áreas Classificadas, Públicas e de Proteção Florestal: Lisboa, Portugal, 2013; Available online: http://www2.icnf.pt/portal/florestas/dfci/relat/rel-if/2013 (accessed on 16 April 2021).
- ICNF. Relatório Anual de Áreas ardidas e Incêndios Florestais em Portugal Continental; Instituto da Conservação da Natureza e das Florestas, I.P./Departamento de Gestão de Áreas Classificadas, Públicas e de Proteção Florestal: Lisboa, Portugal, 2016; Available online: http://www2.icnf.pt/portal/florestas/dfci/relat/rel-if/2016 (accessed on 16 April 2021).
- ICNF. 6º Relatório Provisório de Incêndios Rurais de 01 de Janeiro a 15 de Setembro. Instituto da Conservação da Natureza e das Florestas, I.P./Departamento de Gestão de Áreas Classificadas, Públicas e de Proteção Florestal: Lisboa, Portugal. 2018. Available online: http://www2.icnf.pt/portal/florestas/dfci/relat/rel-if/2018 (accessed on 16 April 2021).
- Conselho Económico e Social (Ed.) Economia da Floresta e Ordenamento do Território. 2017. Available online: https://www.ces.pt/index.php/noticias/artigo/lancamento-do-livro-economia-da-floresta-e-ordenamento-do-territorio (accessed on 16 April 2021).
- Garcês, S.; Nash, G. The relevance of watery soundscapes in a ritual context. Time Mind 2017, 10, 69–80. [Google Scholar] [CrossRef]
- Oosterbeek, L.; Cura, S.; Morais, M.; Pereira, A. Museum of prehistoric art of Mação (Portugal)—Scientific research and social dynamization. In Rock Art and Museum; Dimitriadis, G., Seglie, D., Muñoz, G., Eds.; BAR Publishing: Oxford, UK, 2009; Series 1997; pp. 69–75. [Google Scholar]
- Gonino, G.; Branco, P.; Benedito, E.; Ferreira, M.T.; Santos, J.M. Short-term effects of wildfire ash exposure on behaviour and hepatosomatic condition of a potamodromous cyprinid fish, the Iberian barbel Luciobarbus bocagei (Steindachner, 1864). Sci. Total Environ. 2019, 665, 226–234. [Google Scholar] [CrossRef]
- Mansilha, C.; Duarte, C.G.; Melo, A.; Ribeiro, J.; Flores, D.; Marques, J.E. Impact of wildfire on water quality in Caramulo Mountain ridge (Central Portugal). Sustain. Water Resour. Manag. 2019, 5, 319–331. [Google Scholar] [CrossRef]
- Gough, C.M. Terrestrial Primary Production: Fuel for Life. Nat. Educ. Knowl. 2011, 3, 28. [Google Scholar]
- Fernandez, H.M.; Gomes, C.P.; Martins, F.M.G. Monitorização por satélite da desflorestação da floresta do Maiombe em Cabinda, Angola nos últimos 33 anos. Geama 2020, 6, 81–91. [Google Scholar]
- Da Silva Junior, C.A.; de Medeiros Costa, G.; Rossi, F.S.; do Vale, J.C.E.; de Lima, R.B.; Lima, M.; de Oliveira-Junior, J.F.; Teodoro, P.E.; Santos, R.C. Remote sensing for updating the boundaries between the Brazilian Cerrado-Amazonia biomes. Environ. Sci. Policy 2019, 101, 383–392. [Google Scholar] [CrossRef]
- Climate-data.org. Available online: https://en.climate-data.org/europe/portugal/macao/macao-7092/ (accessed on 18 April 2021).
- USGS—United States Geological Survey—Earth Explorer. Available online: http://earthexplorer.usgs.gov/ (accessed on 16 April 2021).
- USGS—United States Geological Survey—Landsat Missions. Available online: https://www.usgs.gov/core-science-systems/nli/landsat (accessed on 16 April 2021).
- USGS—United States Geological Survey—Modis Overview. Available online: https://lpdaac.usgs.gov/data/get-started-data/collection-overview/missions/modis-overview/ (accessed on 16 April 2021).
- Rouse, J., Jr.; Haas, R.H.; Schell, J.A.; Deering, D.W. Monitoring Vegetation Systems in the Great Plains with ERTS; NASA-1974-0022614; National Aeronautics and Space Administration, Goddard Space Flight Center: Greenbelt, MD, USA, 1974. Available online: https://ntrs.nasa.gov/api/citations/19740022614/downloads/19740022614.pdf (accessed on 16 April 2021).
- Pedras, C.M.G.; Valín, M.I.; Fernandez, H.; Martins, F.M.G. Assessment of Soil Water Content and Remote Sensing Techniques-Case Study of Kiwi Orchard (Portugal). J. Agric. Sci. Techn. A 2014, 4, 33–42. [Google Scholar]
- Weier, J.; Herring, D. Measuring vegetation (ndvi & evi). In NASA Earth Observatory; 2000. Available online: https://earthobservatory.nasa.gov/features/MeasuringVegetation (accessed on 18 April 2021).
- Dalezios, N.R.; Gobin, A.; Tarquis Alfonso, A.M.; Eslamian, S. Agricultural drought indices: Combining crop, climate, and soil factors. In Handbook of Drought and Water Scarcity: Principles of Drought and Water Scarcity; Eslamian, S., Eslamian, F., Eds.; CRC Press, Taylor and Francis Group: New York, NY, USA, 2017; pp. 73–90. [Google Scholar]
- Key, C.H.; Benson, N.C. Landscape assessment (LA). In FIREMON: Fire Effects Monitoring and Inventory System; Lutes, D.C., Keane, R.E., Caratti, J.F., Key, C.H., Benson, N.C., Sutherland, S., Gangi, L.J., Eds.; Gen. Tech. Rep. RMRS-GTR-164-CD; US Department of Agriculture, Forest Service, Rocky Mountain Research Station: Fort Collins, CO, USA, 2006; pp. 1–55. [Google Scholar]
- Rahman, A.F.; Gamon, J.A.; Fuentes, D.A.; Roberts, D.; Prentiss, D.; Qiu, H. Modeling CO2 flux of boreal forests using narrow-band indices from AVIRIS imagery. In Summaries of the Ninth JPL Airborne Earth Science Workshop 23–25 February 2000; Green, R.O., Ed.; Jet Propulsion Laboratory: Pasadena, CA, USA, 2002. [Google Scholar]
- Gamon, J.A.; Penuelas, J.; Field, C.B. A narrow-waveband spectral index that tracks diurnal changes in photosynthetic efficiency. Remote Sens. Environ. 1992, 41, 35–44. [Google Scholar] [CrossRef]
- Silva, S.C.P.D. Modelagem espectral para determinação da concentração e fluxo de CO2 em paisagens naturais e antrópicas na região amazônica. Ph.D. Thesis, University of Brasília-UnB, Brasilia, Brazil, 2014. Available online: https://repositorio.unb.br/handle/10482/17971 (accessed on 18 April 2021).
- Silva, J.S.; Vaz, P.; Moreira, F.; Catry, F.; Rego, F.C. Wildfires as a major driver of landscape dynamics in three fire-prone areas of Portugal. Landsc. Urban Plan. 2011, 101, 349–358. [Google Scholar] [CrossRef]
- Fernandes, P.M.; Rigolot, E. The fire ecology and management of maritime pine (Pinus pinaster Ait.). Forest Ecol. Manag. 2007, 241, 1–13. [Google Scholar] [CrossRef]
- Marchante, H.; Morais, M.; Freitas, H.; Marchante, E. Guia prático para a identificação de Plantas Invasoras em Portugal; Imprensa da Universidade de Coimbra: Coimbra, Portugal, 2014. [Google Scholar] [CrossRef]
- Decree-Law No. 124/2006, June 28. Diário da República no. 123, I Series A: 4586–4599. Available online: https://dre.pt/pesquisa/-/search/358491/details/maximized (accessed on 16 May 2021).
- Law no. 76/2017, August 17. Diário da República no. 158, I Series: 4734–4762. Available online: https://dre.pt/pesquisa/-/search/108010872/details/maximized (accessed on 16 May 2021).
- Law no. 114/2017, December 29. Diário da República no. 249, I Series: 6768–7010. Available online: https://dre.pt/pesquisa/-/search/114425586/details/maximized (accessed on 16 May 2021).
- Decree-Law no. 14/2019, January 21. Diário da República no. 14, I Series: 443–446. Available online: https://dre.pt/pesquisa/-/search/118051707/details/maximized (accessed on 16 May 2021).
- Decree-Law no. 127/2005, August 5. Diário da República no. 150, I Series A: 4521–4527. Available online: https://dre.pt/pesquisa/-/search/241857/details/maximized (accessed on 16 May 2021).
- Valente, S.; Coelho, C.; Soares, J. Forest Intervention Areas (ZIF): A new approach for forest management in Portugal. Silva Lusit. 2013, 21, 137–161. [Google Scholar]
- ICNF—Instituto da Conservação da Natureza e das Florestas—ZIF Informação Geral. Available online: https://www.icnf.pt/florestas/zif/zifinformacaogeral (accessed on 16 April 2021).
- Santana, V.M.; González-Pelayo, O.; Maia, P.A.; Valdecantos, A.; Vallejo, V.R.; Keizer, J.J. Effects of fire recurrence and different salvage logging techniques on carbon storage in Pinus pinaster forests from northern Portugal. Eur. J. Forest Res. 2016, 135, 1107–1117. [Google Scholar] [CrossRef]
- Landsaf–IPMA. Estimation of Gross Primary Production from Space. Available online: https://landsaf.ipma.pt/en/news/news/estimation-of-gross-primary-production-from-space/ (accessed on 29 March 2021).


| Date of Wildfire | Burnt Area [ha] | Municipality (DISTRICT) | Source of Data |
|---|---|---|---|
| July, 1986 | 10,032 | Vila de Rei (CASTELO BRANCO) | [18] |
| Spetember, 1987 | 10,013 | Arganil, Oliveira do Hospital (COIMBRA) | [18] |
| August, 1992 | 12,814 | Arganil (COIMBRA) | [18] |
| August, 2003 | >20,000 | Oleiros, Proença-a-Nova, Sertã, Vila de Rei (CASTELO BRANCO); Alter do Chão, Crato, Gavião, Nisa, Ponte de Sor (PORTALEGRE); Chamusca, Mação (SANTARÉM) | [18] |
| August, 2003 | ≈66,000 | Odemira (BEJA); Aljezur, Monchique, Portimão, Silves (FARO) | [18] |
| July, 2004 | 27,452 | Almodôvar (BEJA); Loulé, Tavira, São Brás de Alportel (FARO) | [18] |
| July, 2005 | 15,837 | Arganil, Oliveira do Hospital, Pampilhosa da Serra (COIMBRA); Seia (GUARDA); Covilhã, Fundão (CASTELO BRANCO) | [18] |
| August, 2005 | >11,000 | Arouca, Vale de Cambra (AVEIRO) | [18] |
| August, 2005 | ≈12,000 | Pombal (LEIRIA); Ourém (SANTARÉM) | [18] |
| August, 2005 | ≈12,000 | Pampilhosa da Serra (COIMBRA) | [18] |
| August, 2005 | >13,000 | Coimbra, Lousã, Miranda do Corvo, Penacova, Penela, Vila Nova de Poiares (COIMBRA) | [18] |
| August, 2005 | ≈12,000 | Abrantes, Chamusca, Ourém (SANTARÉM) | [18] |
| August, 2005 | >11,000 | Caminha, Paredes de Coura, Ponte de Lima, Viana do Castelo, Vila Nova da Cerveira (VIANA DO CASTELO) | [18] |
| July, 2012 | 24,843 | Tavira (FARO) | [18] |
| July, 2013 | 13,706 | Alfândega da Fé (BRAGANÇA) | [23] |
| August, 2016 | 21,910 | Arouca (AVEIRO) | [24] |
| June, 2017 | 27,364 | Pedrógrão Grande (LEIRIA) | [19] |
| June, 2017 | 17,521 | Góis (COIMBRA) | [19] |
| July, 2017 | 29,758 | Sertã (CASTELO BRANCO) | [19] |
| October, 2017 | 16,610 | Figueira da Foz, Lousã (COIMBRA) | [19] |
| October, 2017 | 35,806 | Lousã (COIMBRA) | [19] |
| October, 2017 | 30,142 | Sertã (CASTELO BRANCO) | [19] |
| October, 2017 | 57,534 | Seia (GUARDA) | [19] |
| October, 2017 | 15,687 | Alcobaça (LEIRIA) | [19] |
| August, 2018 | 26,763 | Monchique (FARO) | [25] |
| July, 2019 | 9,249 | Vila de Rei (CASTELO BRANCO); Mação (SANTARÉM) | [22] |
| Satellite | Before Wildfires | After Wildfires |
|---|---|---|
| Landsat 5 | 02 September 1990 | 26 December 1991 |
| 01 July 2002 | 12 August 2003 | |
| Landsat 8 | 15 June 2017 | 05 October 2017 |
| 29 May 2019 | 01 August 2019 | |
| MODIS | 26 June 2002 to 03 July 2002 | 13 August 2003 to 20 August 2003 |
| 02 June 2017 to 09 June 2017 | 30 September 2017 to 07 October 2017 | |
| 25 May 2019 to 01 June 2019 | 28 July 2019 to 04 August 2019 |
| Satellite | Sensor | Bands (μm)/Product | Spatial Resolution (m) |
|---|---|---|---|
| Landsat 5 | TM (Thematic Mapper) | Blue (0.45–0.52) | 30 |
| Green (0.52–0.60) | |||
| Red (0.63–0.69) | |||
| NIR (0.76–0.90) | |||
| Mid-IR (2.08–2.35) | |||
| Landsat 8 | OLI (Operational Land Imager) | Blue (0.45–0.51) Green (0.53–0.59) Red (0.64–0.67) NIR (0.85–0.88) SWIR (2.11–2.29) | 30 |
| MODIS | Aqua | MYD17A2 (gross primary production) | 500 |
| Wildfire (Year) | Burnt Area (km2) |
|---|---|
| 1991 | 131.03 |
| 2003 | 193.50 |
| 2017 | 265.96 |
| 2019 | 56.31 |
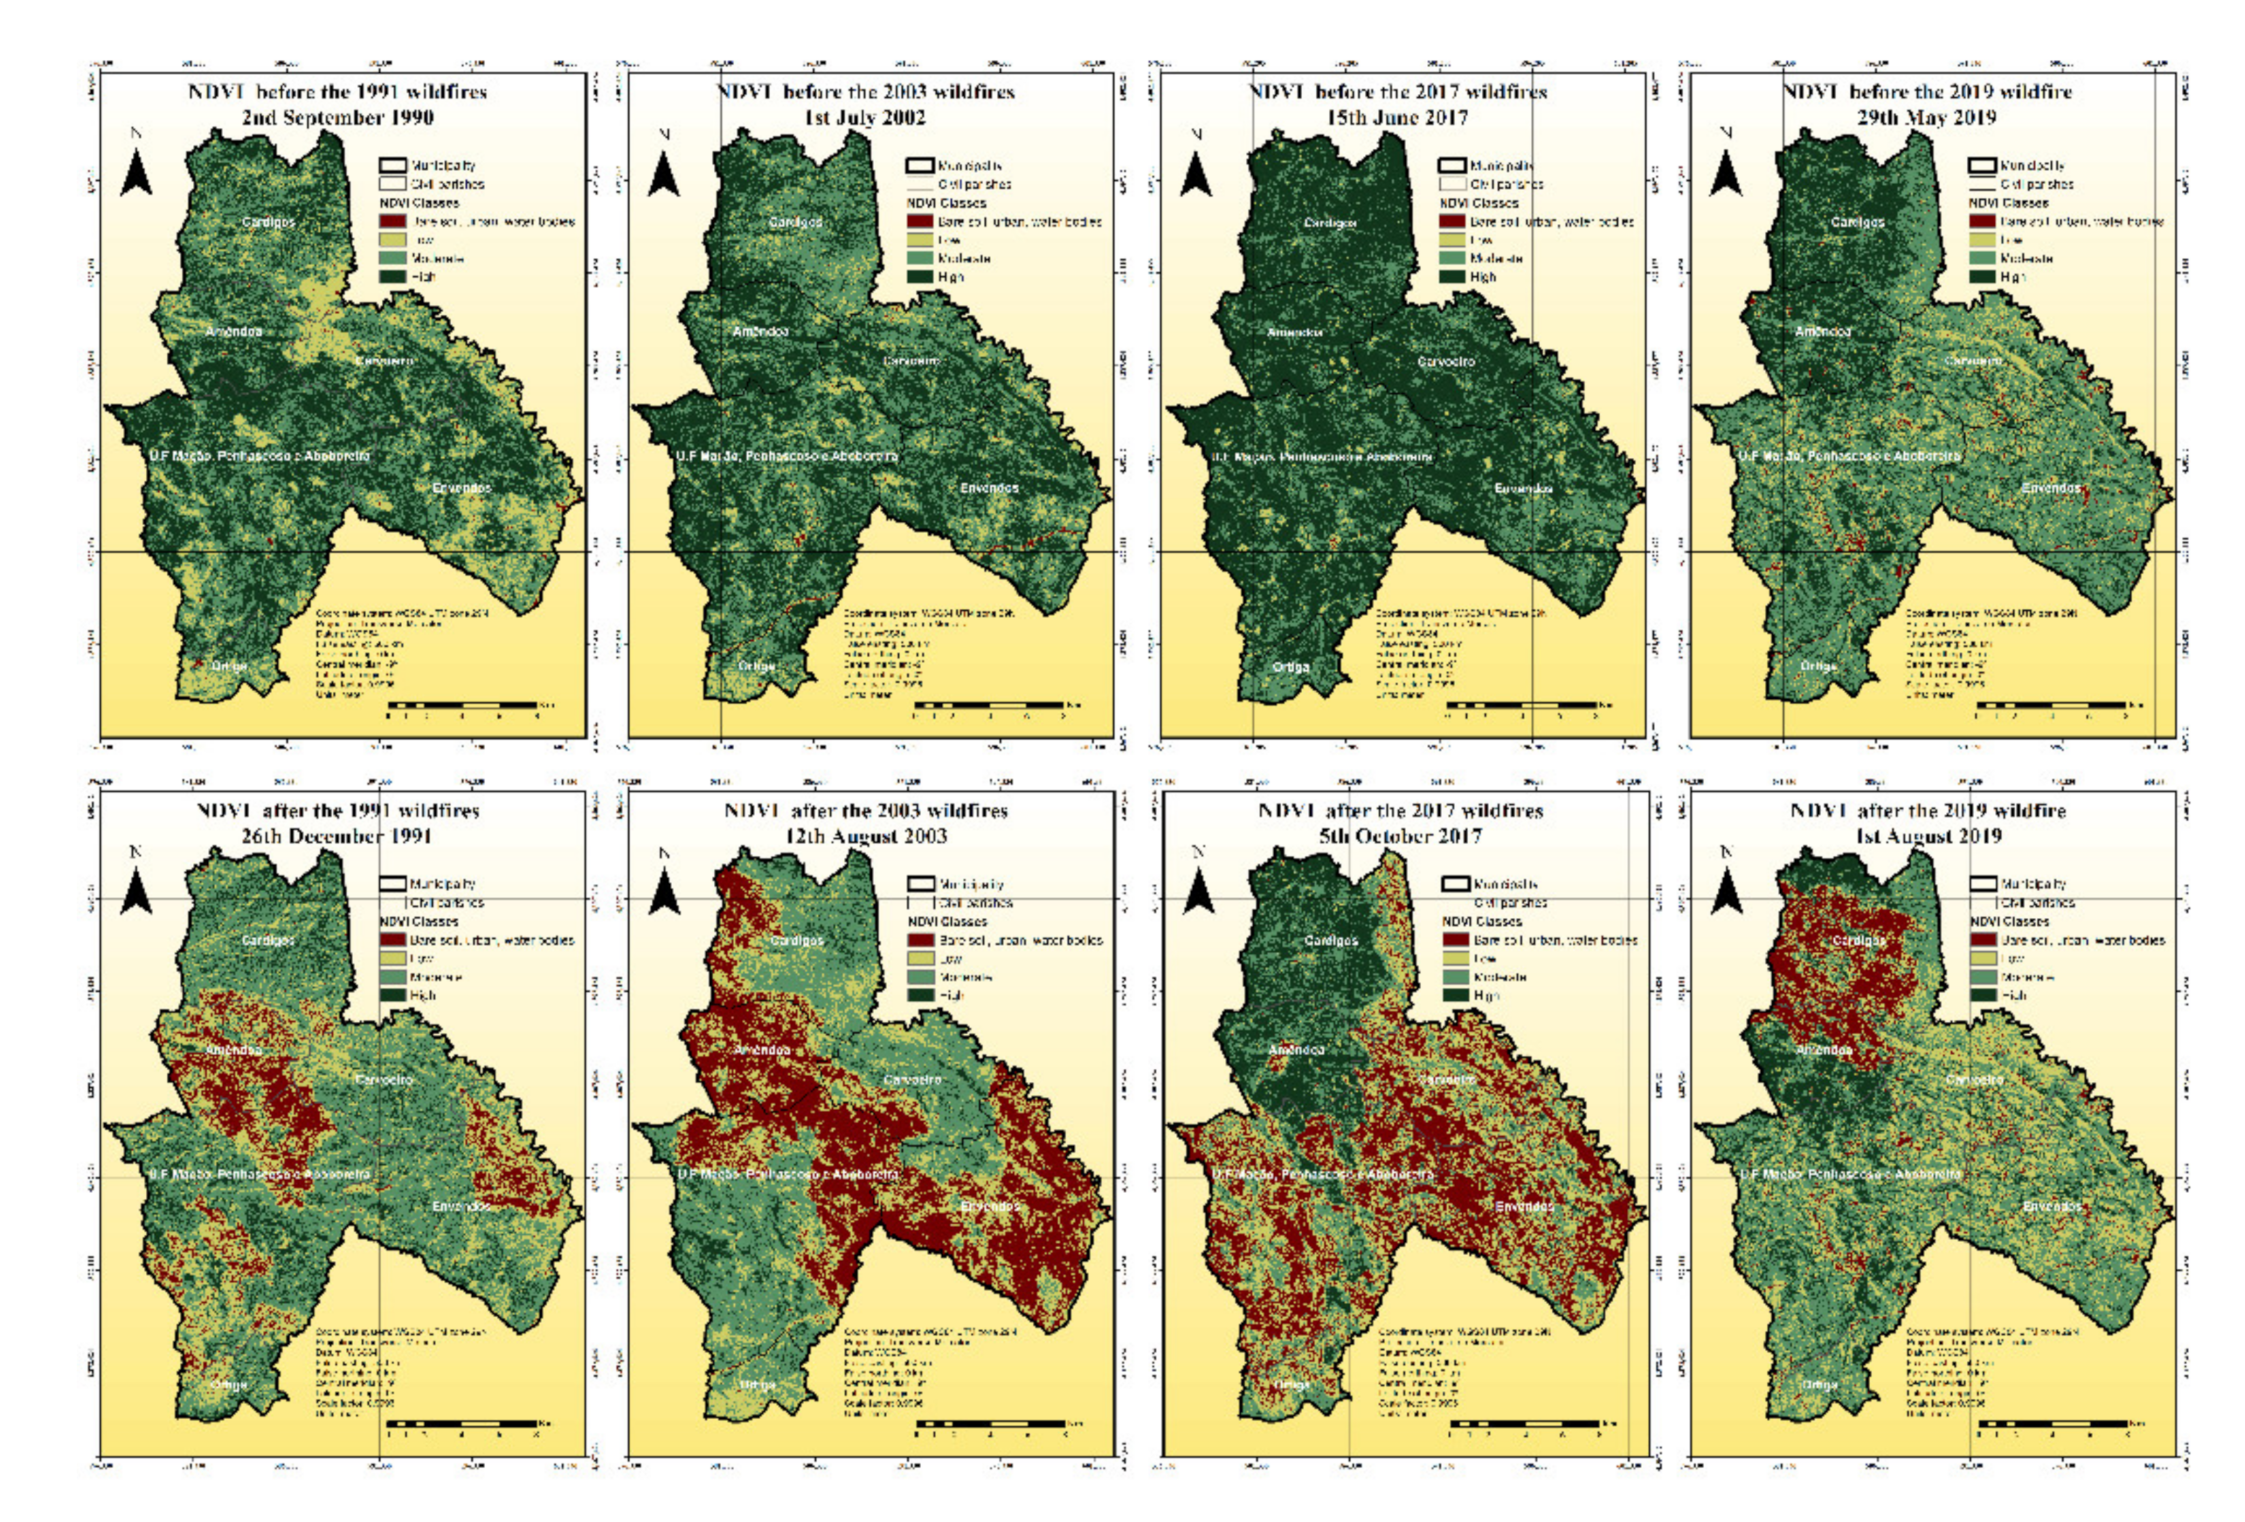
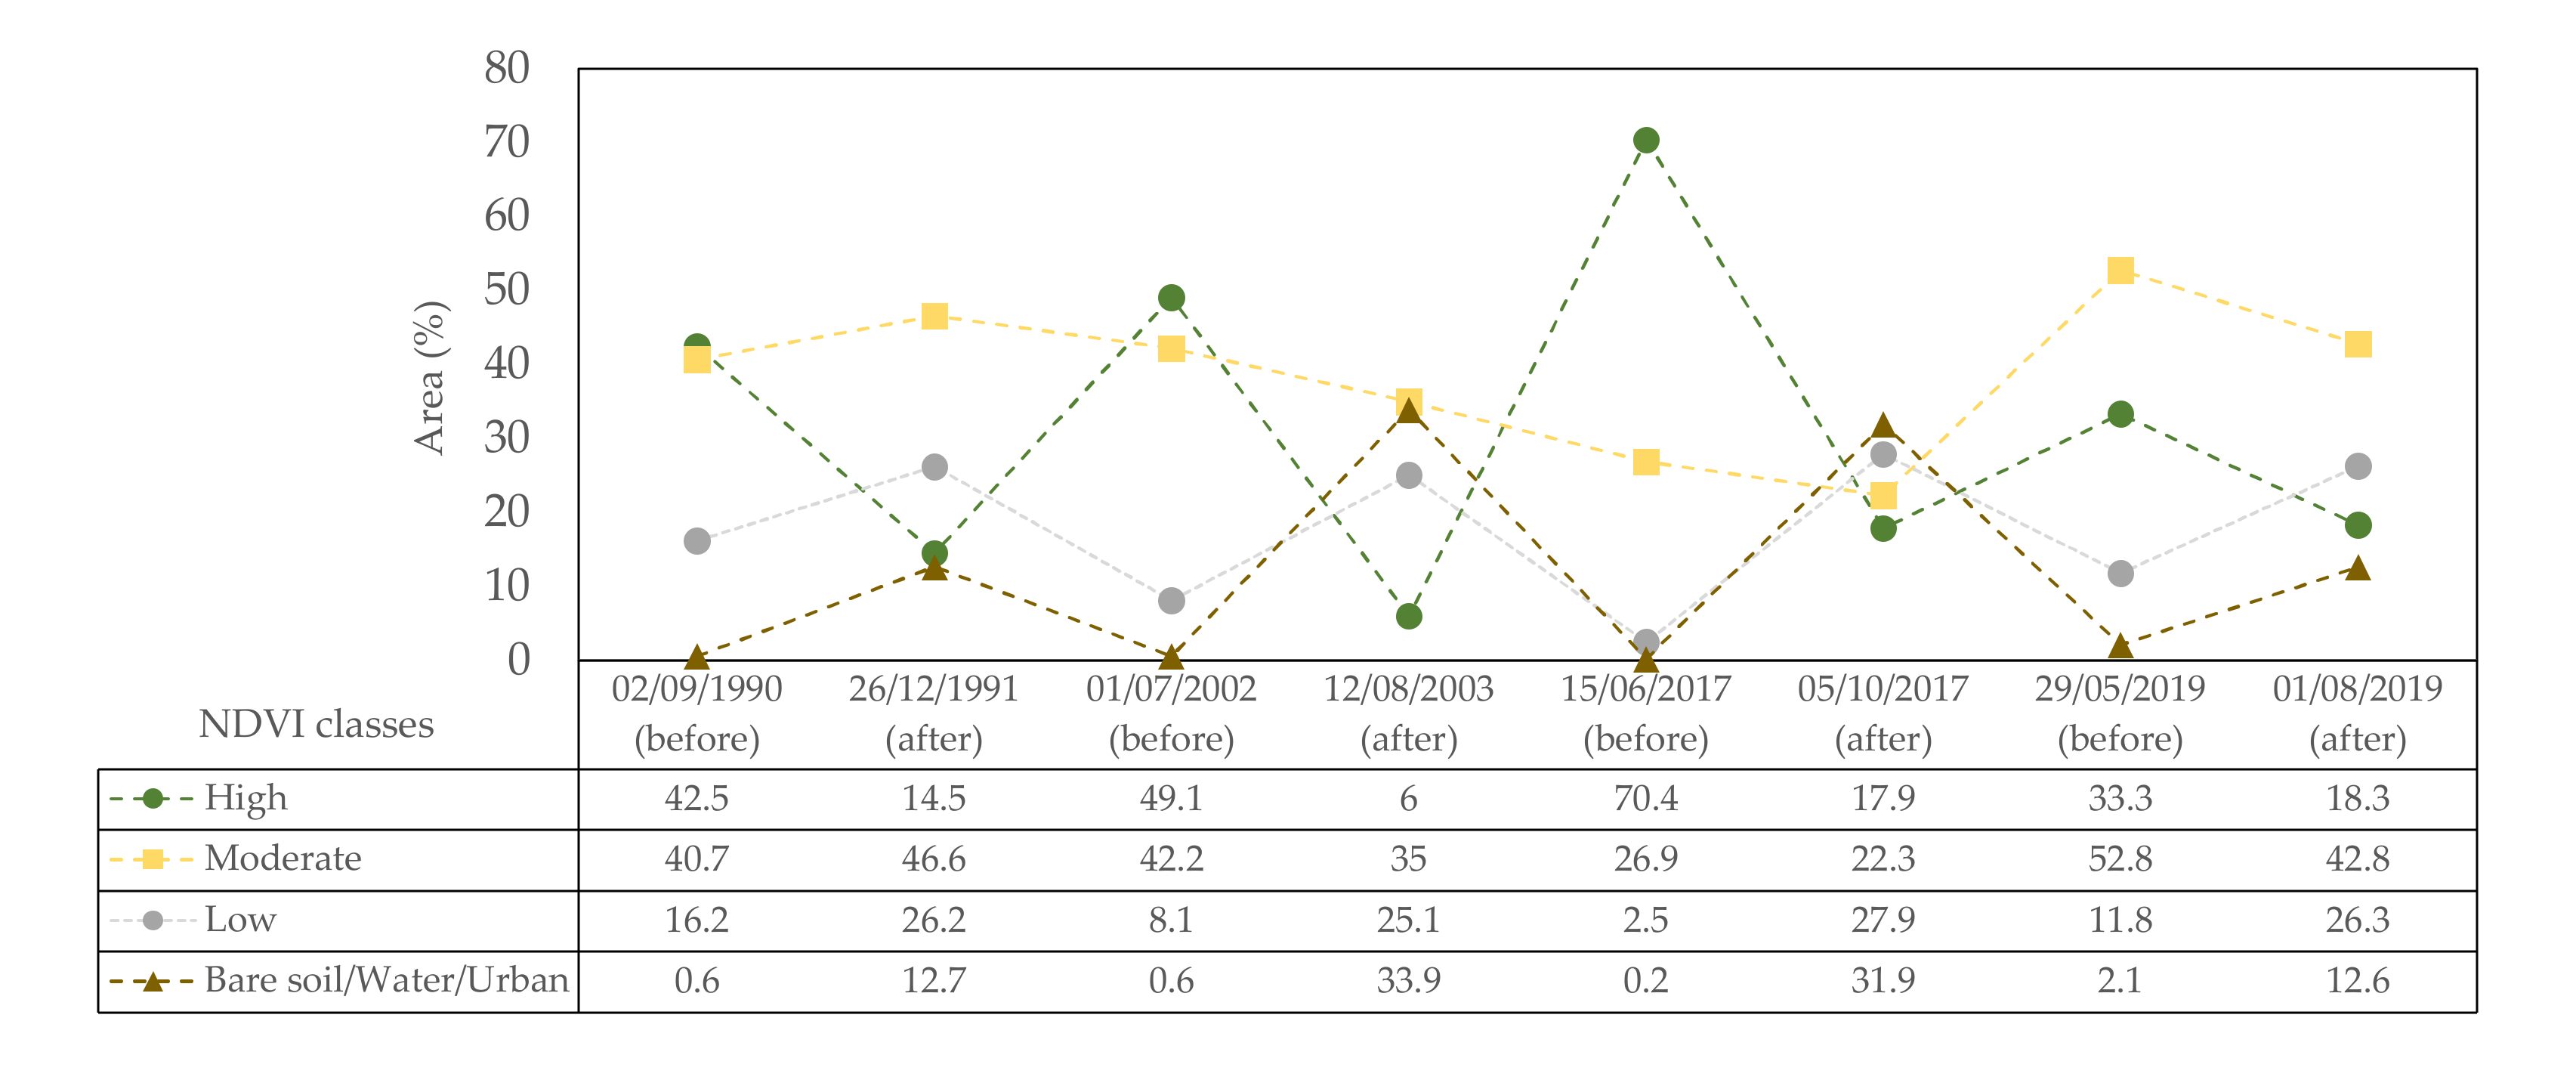
| NDVI | Classification | Land Cover |
|---|---|---|
| [0.5; 1.0] | High | Dense vegetation (Pinus and eucalyptus) |
| [0.2; 0.5] | Moderate | Moderate vegetation (Pinus and eucalyptus) |
| [0.1; 0.2] | Low | Sparse vegetation (shrubs and grassland) |
| ≤0.1 | None | Bare soil, urban areas, and water bodies |
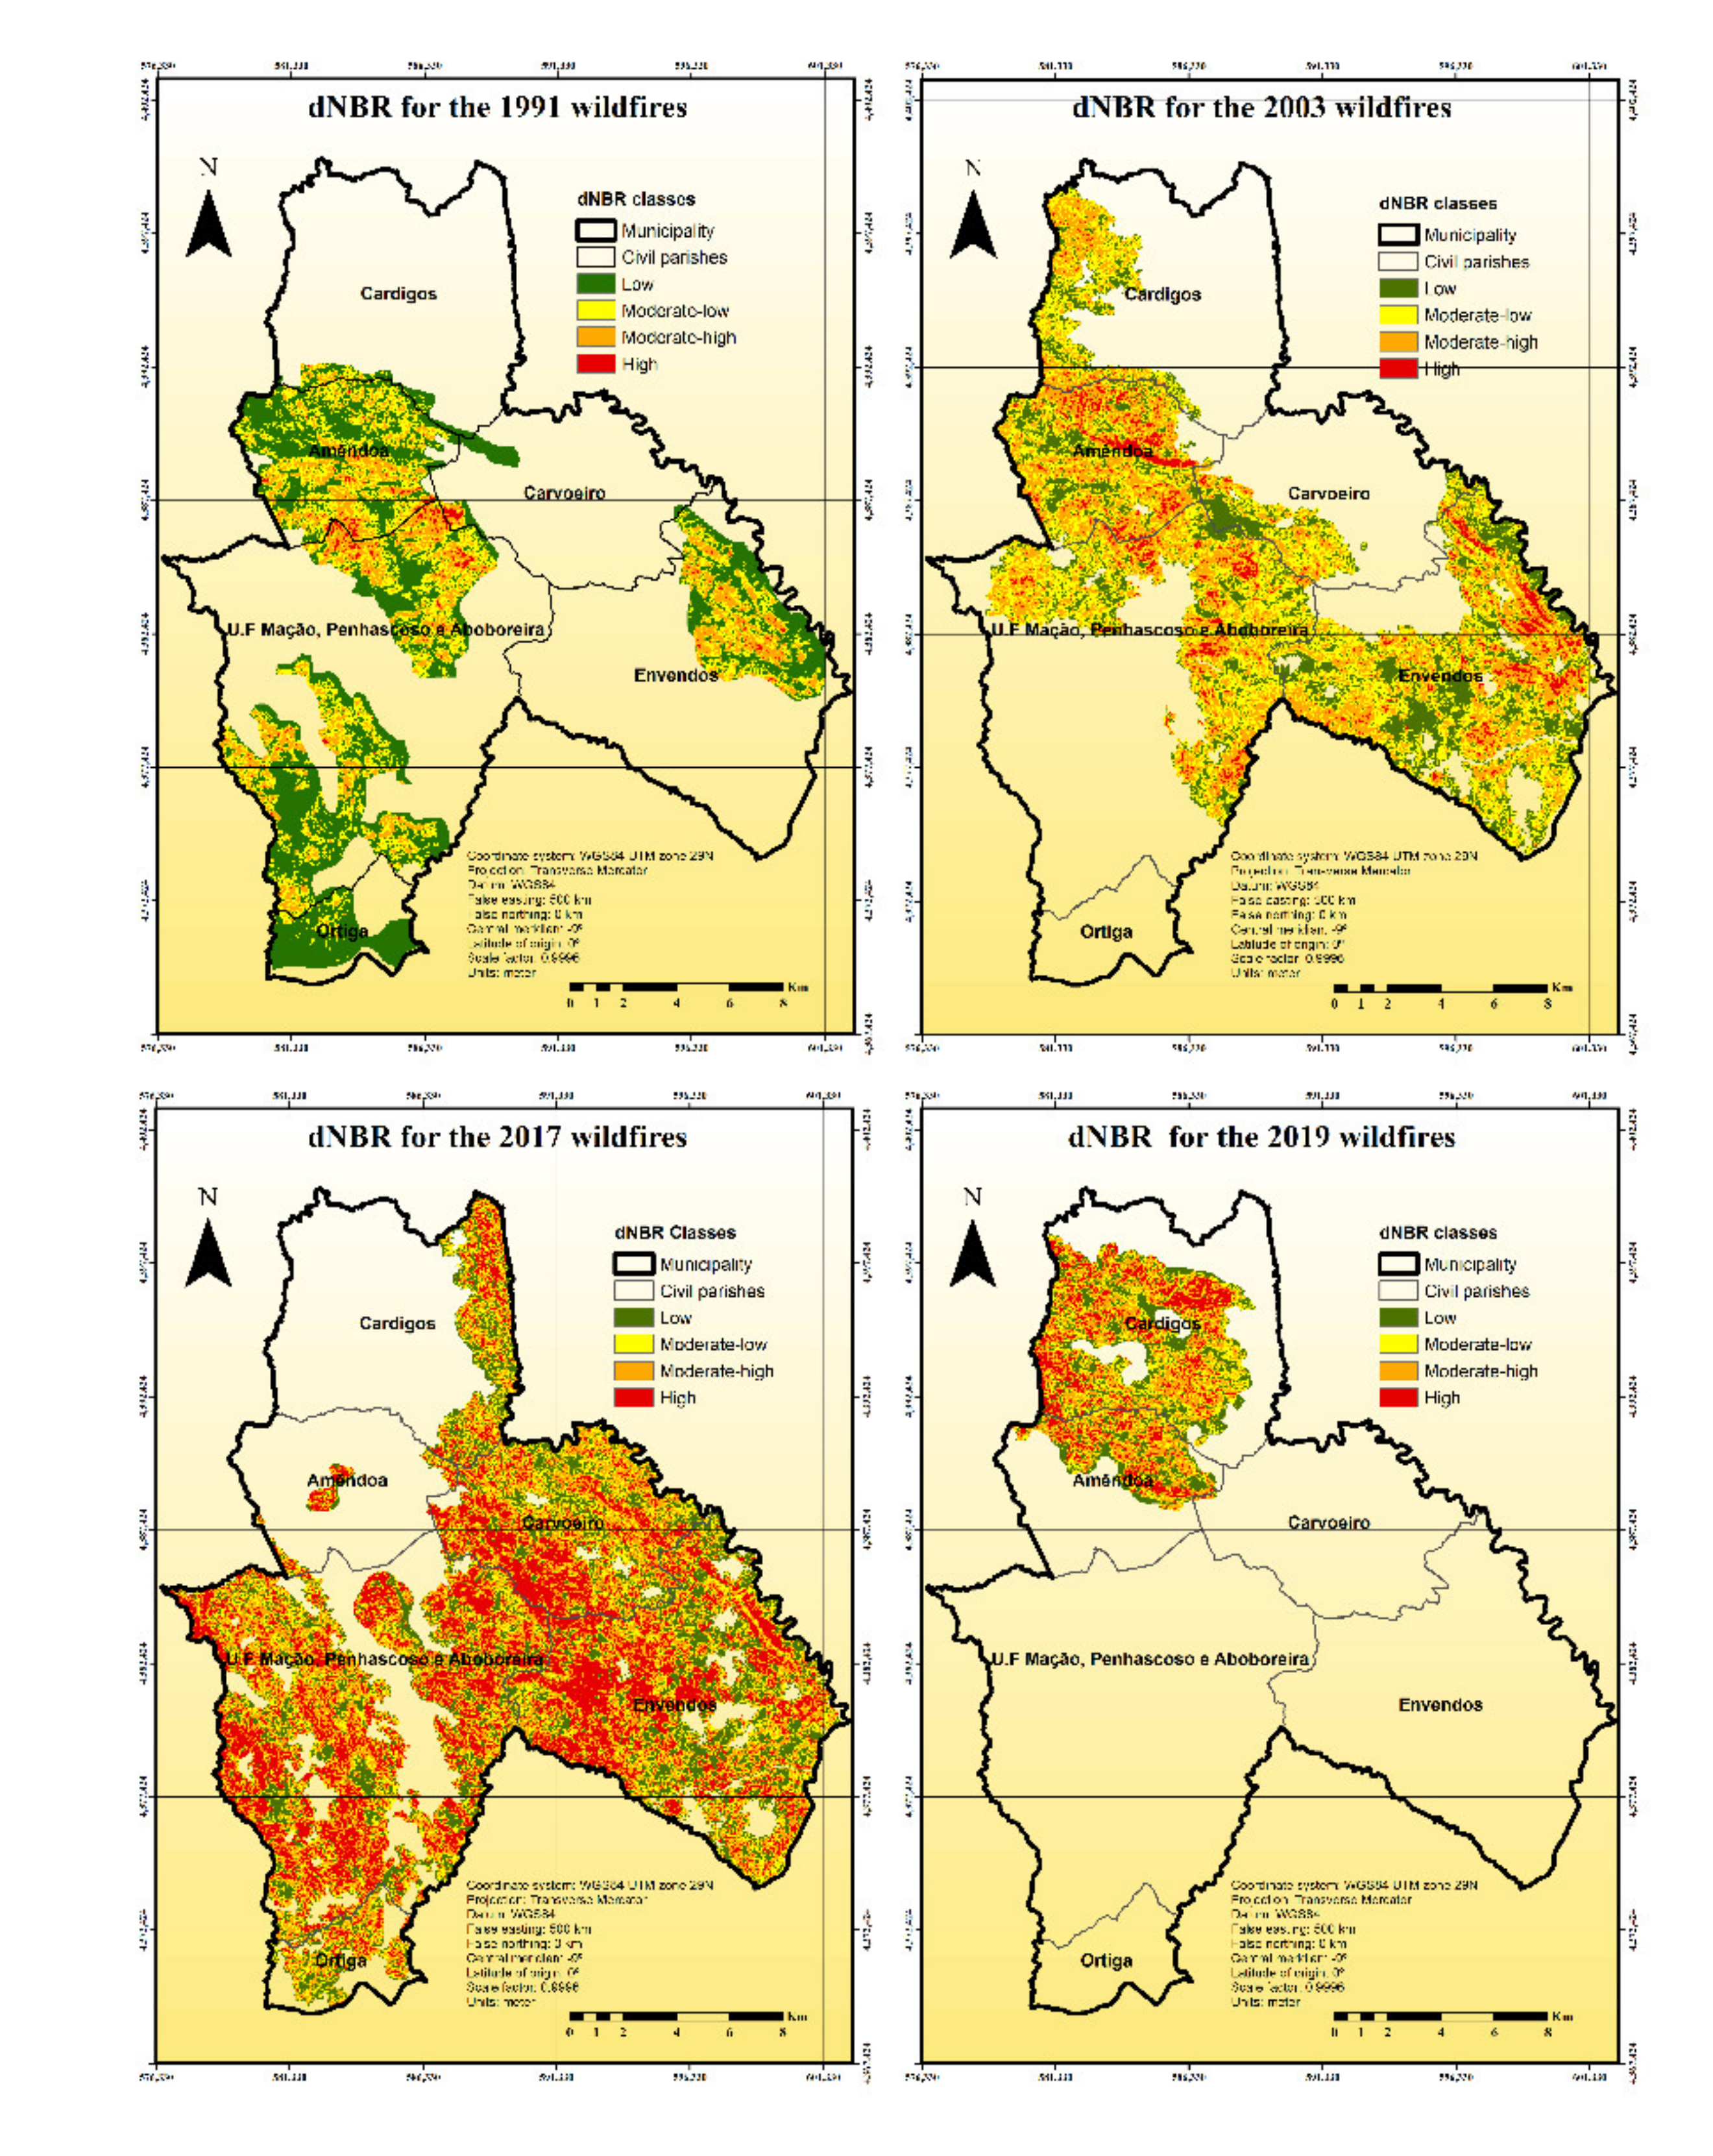
| dNBR | Severity |
|---|---|
| >0.66 | High |
| [0.44; 0.66] | Moderate–high |
| [0.27; 0.44] | Moderate–low |
| <0.27 | Low |
Publisher’s Note: MDPI stays neutral with regard to jurisdictional claims in published maps and institutional affiliations. |
© 2021 by the authors. Licensee MDPI, Basel, Switzerland. This article is an open access article distributed under the terms and conditions of the Creative Commons Attribution (CC BY) license (https://creativecommons.org/licenses/by/4.0/).
Share and Cite
Fernandez, H.M.; Granja-Martins, F.M.; Pedras, C.M.G.; Fernandes, P.; Isidoro, J.M.G.P. An Assessment of Forest Fires and CO2 Gross Primary Production from 1991 to 2019 in Mação (Portugal). Sustainability 2021, 13, 5816. https://doi.org/10.3390/su13115816
Fernandez HM, Granja-Martins FM, Pedras CMG, Fernandes P, Isidoro JMGP. An Assessment of Forest Fires and CO2 Gross Primary Production from 1991 to 2019 in Mação (Portugal). Sustainability. 2021; 13(11):5816. https://doi.org/10.3390/su13115816
Chicago/Turabian StyleFernandez, Helena Maria, Fernando M. Granja-Martins, Celestina M.G. Pedras, Patrícia Fernandes, and Jorge M.G.P. Isidoro. 2021. "An Assessment of Forest Fires and CO2 Gross Primary Production from 1991 to 2019 in Mação (Portugal)" Sustainability 13, no. 11: 5816. https://doi.org/10.3390/su13115816
APA StyleFernandez, H. M., Granja-Martins, F. M., Pedras, C. M. G., Fernandes, P., & Isidoro, J. M. G. P. (2021). An Assessment of Forest Fires and CO2 Gross Primary Production from 1991 to 2019 in Mação (Portugal). Sustainability, 13(11), 5816. https://doi.org/10.3390/su13115816