Abstract
Emerging tourism destinations repeatedly face many managerial challenges, often leading to common pitfalls and rookie mistakes. The current study aims to analyze relationships between destination attractiveness factors (Destination Amenities, Tourism Infrastructure and Accessibility, Active Family Destination, Hospitality and Services, and Social–Safety–Economic Values), satisfaction, destination image, and revisit intentions to test a mediating role of satisfaction between destination attractiveness factors and both destination image and revisit choices within so-called rookie destinations. For this purpose, a quantitative study was carried out using a questionnaire as an instrument for data collection. Data were collected from a sample of 2030 visitors to Serbia. Structural equation modeling (SEM) in R was applied to analyze the data. The results revealed the positive direct effects of destination attractiveness factors on satisfaction, destination image, and revisit intentions. Moreover, the research confirmed the mediating role of satisfaction in the relationship between destination attractiveness and destination image, and revisit intentions. The results are further discussed from the perspective of emerging tourism destinations to make their management more sustainable for the future and mitigate the repetition of rookie mistakes.
1. Introduction
Many emerging destinations represented by the countries with low GDPs seek to develop the tourism industry with objective limitations caused by scarce financial resources and a lack of tourism-related instruments [1]. The lack of tourism traditions and expertise, sometimes coupled with a severe lack of accommodation facilities or service provision capabilities, could hamper the user satisfaction, destination image, and revisit intentions. These types of destinations are often defined as “rookie” destinations. Most of the existing research on destination satisfaction focuses primarily on a well-established destination by studying its tourism demand and somewhat predictable expectations toward the quality of attractions and services it offers. However, emerging destinations do not provide fully developed tourism products due to their infancy [2].
The global tourism market is becoming increasingly competitive for tourism destinations. This phenomenon puts pressure on all tourism destinations, especially emerging ones, to be innovative and discover new foundations for competitive advantage based on their tourism attractiveness. Tourism attractiveness factors are widely recognized as determinants of tourism development, consisting of destinations’ specific features and attributes that encourage tourists to visit a particular place [3]. These factors, which are facilitated and managed by decision makers, can determine the direction and scope of tourism development [4,5]. Tourism attractiveness factors include the physical attributes of a destination. Natural resources of a destination, such as its climate, beaches, relaxation areas [6], and cultural resources such as historical monuments fall into this category. On the other hand, some authors such as Hu and Ritchie [7] defined destination attractiveness as the “reflection of the feelings, beliefs and opinions that an individual has about the destination’s perceived ability to satisfy the special vacation needs of that person”. They thus consider destination attractiveness to be the main element of a destination’s appeal and suggest that they are the principal factor that motivates tourists to visit a particular tourism destination [8].
Destinations compete with one another on a global scale to draw both investors and visitors, and they appear to market themselves in similar ways. From a marketing standpoint, as Lew [9] argued, the image is the most significant feature of a tourist attraction [10]. It also has a substantial effect on cognitive perceptions of an attraction. All of the factors mentioned above were previously found to affect the revisit intention since destination attractiveness factors, satisfaction, and destination image are determinants of a decision to come back to a destination [11].
If appropriately managed, available tourism resources and attractions can become a competitive advantage and help achieve long-term economic goals while, at the same time, securing sustainable tourism growth and an improved market position [12,13]. To develop sustainably and maintain a competitive advantage, tourism decision makers in both private and public sectors need to analyze their strategies to respond to changes occurring in the external environment [14], further developing rookie destinations and leaning on the provided data and models to make the right decisions. As a result, how tourists evaluate a destination, what kinds of revisit intentions they will express, and the interrelationships between all of the variables in the model used may also differ between emerging and mature destinations. One of the most important goals for emerging destinations is to identify the unique elements of those destinations [2] and the less well-performing aspects of those destinations. These data could be of critical importance for further development and could enable setting a course for further success or failure of those destinations.
Based on this, the main objectives of the study are to explore the direct effects of tourism destination attractiveness factors on the level of satisfaction, destination image, and revisit intention on the example of an emerging destination; to investigate how the level of satisfaction affects the destination image and revisit intention; and to analyze the mediating effect of satisfaction between destination attractiveness factors, on the one hand, and destination image and revisit intention, on the other hand. In doing so, the paper first establishes a theoretical framework and develops a hypothesis to test Serbia’s example. Serbia qualifies as a suitable emerging destination because it has all of the characteristics mentioned above.
2. Theoretical Framework and Hypotheses Development
2.1. Destination Attractiveness Factors—Antecedents of Satisfaction, Destination Image, and Revisit Intention
The concept of destination attractiveness has attracted the interest of tourism researchers [15,16,17,18,19]. Their focus was put on tourists’ perceptions about a destination and their ability to satisfy the needs of tourists [20,21], including elements of distinctive attractiveness, aspects of infrastructure and tourism facilities, as well as the general destination atmosphere [22]. Within a plethora of research, authors define destination attractiveness through the physical attributes or an inventory of tourism resources [16]. Today, we can go a step further and perceive destinations, not as distinct natural, cultural, or environmental resources, but rather as an overall appealing product available in a certain area [23]. The destination offers a multifaced set of products and services, contributing to a pleasing and memorable experience [24,25,26]. Moreover, destination attractiveness factors impact tourists’ satisfaction [27,28,29,30], destination image, and revisit intention [27,28,30,31].
Overall, tourists’ satisfaction is highly dependent on the quality of the destination’s attractions. Echtner and Ritchie [32] argued that the quality of the destination’s attractions will vastly influence destination choice. The broad set of amenities, including accommodation, housing opportunities, restaurant services, are perceived as important factors [33]. In particular, accommodation services have been recognized as yet another essential factor of tourists’ overall destination satisfaction and predictor of revisit intention [34,35].
Vujičić et al. [36] found that spaciously complex cultural heritage and cultural institutions are among the primary pull motives. Here, museums are considered the most popular attractions within cultural tourism travel, usually followed by galleries and cultural and historical monuments [37]. As an essential part of cultural tradition, food has been a critical element of destination attractiveness. Indeed, the food itself possesses psychosensory, social, and cultural traits and is often associated with the image of the destination and destination attractiveness [36,38,39,40]. Food can be at the top of the tourist’s experience during the trip, and it can influence the decision to revisit the given area [41,42].
Chen and Chen [34] and Hui et al. [35] found elements of destination infrastructure to be essential determinants of destination satisfaction, further leading and influencing tourists’ revisit intention. Related, Loi et al. [43] found that the quality of the infrastructure at the destination is a good predictor of tourists’ revisit intention. In particular, a destination’s accessibility has a long history of being recognized as a major pull factor and driving force of destination attractiveness [44]. Researchers such as Danaher and Arweiler [44] argued that transportation services had no direct effect on tourists’ revisit intention; conversely, Thompson and Schofield [45] and Zhang et al. [46] found that transport-related services were vital elements of both satisfaction and revisit intention.
Tourists have been found to give much importance to the quality of information about a destination, leading to tourists’ destination satisfaction. Chen and Chen [34] empirically tested and concluded that tourists pay attention to the quality of information. Relatedly, Chen et al. [47] argued that usage of telecommunication technologies is a relevant predictor of tourists’ revisit intention.
Safety and security have been described as another significant destination value for tourists and a determinant of their revisit intention, affecting destination image and level of satisfaction. Mok et al. [48] examined the significance of destination attributes within Hong Kong and Taiwan and discovered safety to be the most imperative value. Loi et al. [43] and Zhang et al. [46] found that safety was essential antecedents of tourists’ revisit intention, in line with the research of Chen et al. [47], who found convincing results concerning the significance of perceived safety and risks on tourists’ revisit intention. Glensor and Peak [49] argued that the most significant prerequisite for the positive development of tourism is the reputation of keeping criminals at bay and guaranteeing safety to tourists. Further, security concerns especially play a role in deciding not to travel to aggressive/hostile destinations [50]. Previously mentioned is in line with the research of Vujičić et al. [36], saying that price and personal safety play a major role when choosing a final destination for travel.
Morrison [51] indicated that the hedonistic approach to the consumption of tourism services implies that high prices do not adversely affect demand, but that the concept of “value for money” plays a more significant role, in which the amount of money spent is directly related to the quality of services. Some studies connect price with overall satisfaction with the destination, shaping tourist’s perception and intention to revisit, further affecting destination image [34,35,52,53]. In addition, the natural environment and landscape of a destination contribute to an essential element in attracting tourists [54]. The local community works in synergy with natural and experiential assets in a destination and directly links with local people [54]. Locals and communities primarily affect experience and satisfaction since tourists who directly experience local community and culture through experience design are more likely to have memorable ones [54], leading toward a higher level of pleasure and satisfaction [32].
Based on a review of the literature regarding destination attractiveness factors, satisfaction, destination image, and revisit intention, we propose the following hypotheses:
Hypothesis 1 (H1).
Destination Amenities has a positive effect on Satisfaction.
Hypothesis 2 (H2).
Tourism Infrastructure and Accessibility has a positive effect on Satisfaction.
Hypothesis 3 (H3).
Active Family Destination has a positive effect on satisfaction.
Hypothesis 4 (H4).
Hospitality and Services has a positive effect on satisfaction.
Hypothesis 5 (H5).
Social–Safety–Economic Values has a positive effect on satisfaction.
Hypothesis 6 (H6).
Destination Amenities has a positive effect on destination image.
Hypothesis 7 (H7).
Tourism Infrastructure and Accessibility has a positive effect on destination image.
Hypothesis 8 (H8).
Active Family Destination has a positive effect on destination image.
Hypothesis 9 (H9).
Hospitality and Services has a positive effect on destination image.
Hypothesis 10 (H10).
Social–Safety–Economic Values has a positive effect on destination image.
Hypothesis 11 (H11).
Destination Amenities has a positive effect on revisit intention.
Hypothesis 12 (H12).
Tourism Infrastructure and Accessibility has a positive effect on revisit intention.
Hypothesis 13 (H13).
Active Family Destination has a positive effect on revisit intention.
Hypothesis 14 (H14).
Hospitality and Services has a positive effect on revisit intention.
Hypothesis 15 (H15).
Social–Safety–Economic Values has a positive effect on revisit intention.
2.2. The Impact of Tourists’ Satisfaction on Destination Image and Revisit Intention
In the tourism context, satisfaction is perceived as a function of previsit expectations and postvisit encounters. Satisfaction can be described as the extent of overall pleasure or contentment.
Felt by the visitor, satisfaction results from the ability of the trip experience to fulfill the visitor’s desire, expectations, and needs about the trip [55]. Tourists feel satisfied when the apparent presentations surpass earlier desires, and they feel disappointed if their prior expectations exceed the perceived performances [34,56,57,58,59]. Satisfaction’s relevance lies in its role in repetitive purchase or service patterns, manifested through loyalty toward a product, brand, or destination [60].
Satisfaction is among the most vital components of the tourist experience [46] and may be one of the most thoroughly researched areas and variables in tourism literature [61]. Concerning tourism, satisfaction is recognized as accumulated feelings [62] and the extent of overall pleasure [63] that one experiences from visiting a tourist destination. Tourist satisfaction stands between emotional and cognitive responses to service experience [64], or between pretravel expectations and post-travel experiences [34].
The connection of satisfaction and destination image has been widely recognized, further leading toward two research areas—destination image as an antecedent of tourism satisfaction [55,65] and found satisfaction as an antecedent of the destination image. Chen and Tsai [55] argued that tourists use the perceived image of the destination to form expectations and compare them with post-travel experiences. Consequently, a positive destination image will increase the propensity to make a positive evaluation of the sojourn and enhance intentions to return and recommend the destination [11].
The connection between satisfaction with a destination and their revisit intention is found in the destination choice set theory [65]. A plethora of research found that the more tourists’ express their satisfaction with a destination, the more likely they are to revisit the destination [26,33,42,45,51,54,66,67,68,69,70,71,72]. Tourists’ revisit intention, which leads to their perceived likelihood of returning to the same destination, is a unique component of a favorable post consumption behavior and thus a vital element of tourism loyalty [43,62,73]. Research evaluating the relationship between satisfaction and tourism behavior has centered on destination loyalty [55,65]. Chi and Qu [27] found statistically significant relationships between overall satisfaction and destination loyalty.
Based on this, the following hypotheses can be drawn:
Hypothesis 16 (H16).
Satisfaction has a positive effect on destination image.
Hypothesis 17 (H17).
Satisfaction has a positive effect on revisit intention.
2.3. The Mediating Role of Satisfaction Level
Destination image and loyalty are both critical to the overall success of a destination [73]. Tourist satisfaction is the interlink that brings these two concepts together. Most of the literature mentioned variables linearly, with destination image being antecedent of satisfaction [27], and lacked causal relationships among destination image, tourist satisfaction, and destination loyalty. Stylos et al. [74] argue that tourists’ intention to return to a destination is also determined by the extent to which they perceive that the destination attractiveness factors shall meet their needs, further developing claim and model with mediating component (satisfaction).
Authors utilize more advanced techniques such as structural equation modeling to analyze the mediating effects and avoid biases created by usual analytical methods. Therefore, this research uses structural equation modeling to test the mediating effect of tourist satisfaction.
In summary, previous studies have pointed out the potential linkages between destination attractiveness factors, satisfaction, destination image, and destination loyalty. For managers, understanding the mediation role of satisfaction between attractions factors and destination image and revisit intention can affect and tailor their future business decisions. At the same time, for researchers, empirical testing of theoretical framework could deepen the body of knowledge and contribute to the better understanding of previously posed research question.
According to this, the following hypothesis can be suggested:
Hypothesis 18 (H18).
Satisfaction mediates the relationship between destination attractiveness factors, on the one hand, and destination image and revisit intention, on the other.
The expected relationships and hypotheses are presented in Figure 1.
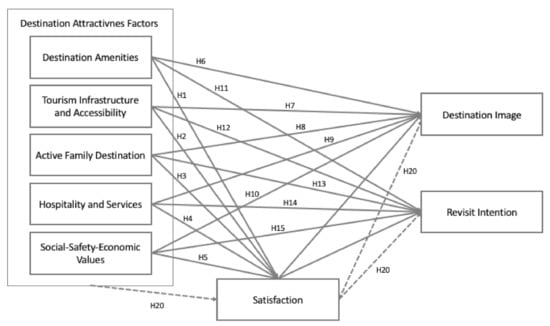
Figure 1.
Proposed model of research.
3. Methods
3.1. Instruments
The questionnaire used in this study consists of three parts. The first part measured the sociodemographic characteristics of respondents (gender, age, education, work status, country of residence). The second part of the questionnaire measured destination attractiveness developed based on the focus group data, where derived factors were found in previous literature [18,22,36,75]. The third part of the questionnaire measured destination image, revisit intention, and level of satisfaction as observed variables. All the statements were assessed on the five-point Likert scale (1—I totally disagree, 5—I totally agree), except for the question about the revisit intention (1—No, 2—Not sure, 3—Yes).
3.2. Procedure
This study combines both qualitative and quantitative research methods. The qualitative method consisted of research conducted through focus group discussions among tourism experts. The focus group discussion involved 20 experts from tourism academia, hotel industry, DMO, event industry and was held in June 2019. The aim was to define the components of destination attractiveness (latent variable), where they were asked to name five attractiveness factors that would best describe Serbia (“rookie” tourism destination). A total of 22 items were selected for scale testing of destination attractiveness factors.
By employing a convenient method for sampling, the quantitative data were collected through face-to-face standard paper and pen surveys with visitors to Serbia. The questionnaire was distributed to three urban destinations (Belgrade, Novi Sad, Subotica), three mountain destinations (Kopaonik, Zlatibor, Tara), and two spa destinations (Vrnjačka Banja and Banja Koviljača). Each interview took approximately 20 min to complete. During the process, 2760 questionaries were collected over almost two months period from 1 December 2019 to 25 January 2020. After eliminating invalid questionnaires due to incompleteness, a total of 2030 valid questionnaires were ultimately collected for further analysis.
3.3. Data Analysis
The first data were randomly split into two data sets used for exploratory factor analysis (N = 997) and confirmatory factor analysis (N = 1033). We used exploratory factor analysis to test the potential dimensions of the tourism destination attractiveness factors scale. Confirmatory factor analysis was used to test the measurement model. The tourism destination attractiveness factors construct in the proposed model were tested with the maximum likelihood method of structural equation modeling. This method evaluates how well a proposed conceptual model with observed indicators and hypothetical constructs explains or fits the collected data [76,77]. Observing a load of each item on the construction variables and using the fit index to test the model fit ensures the model construction validity. Afterward, we used SEM mediation analysis to test the tourism destination attractiveness factors model in terms of how these factors affect destination image and revisit of a destination through satisfaction mediation. After, we conducted a mediation analysis of the established theoretical model with latent variables (tourism destination attractiveness factors) predictors to image and revisit a destination through satisfaction mediation. The obtained data were processed by Statistical Package for Social Sciences Version 23 (SPSS), which was used for EFA calculus, and for the CFA and SEM mediation analysis, authors applied R and RStudio (lavaan, semPlot, psych, and semTools packages).
3.4. Study Area (Serbia as a Rookie Destination)
Since the country’s opening to the West in 2000 and initial structural changes in its tourism industry, Serbia has established itself as an emerging destination in the 2010s [78]. Besides the increasing number of accommodation facilities and capacity, since 2014, the country has recorded steady growth of tourist arrivals and overnight stays, as well as the number of flights and passengers’ arrivals at international airports [79]. In 2019, official records indicated 3.7 million arrivals, a 7.2% yearly growth, evenly split between foreign (50.1%) and domestic (49.9%) tourists [80]. Serbia features diverse geography and strategic location on the main road to the Balkan Peninsula and Bosporus. This played a part in modern-day Serbia having a rich multicultural heritage. The country has several main tourism products that compete for domestic and foreign tourists. One of the products is city break tourism, predominantly taking place in Belgrade and Novi Sad, where visitors can explore cultural heritage, visit leisure and business events, or enjoy the nightlife. Outside of the cities, the rural areas offer spa and wellness resorts adjacent to the geothermal springs, most notable of which are Vrnjačka Banja and Banja Koviljača. Finally, the mountainous area features ski resorts and nature-based activities throughout the year, with the most visited being Kopaonik and Zlatibor mountains. Accordingly, the number of tourist arrivals in 2019 was highest in Belgrade and Novi Sad, accounting for 38.2% combined. Spa and wellness tourism attracted 18.1% of visitors, and mountain resorts accommodated 17.3% of tourists. However, spa and mountain destinations recorded higher overnight stays. The most significant number of foreign tourists who visited the Republic of Serbia in 2019 were tourists from China, with 145 thousand arrivals, Bosnia and Herzegovina (136 thousand arrivals), Turkey (108 thousand arrivals, followed by Germany (104 thousand arrivals) and Croatia (104 thousand arrivals) [81].
4. Results
4.1. Study Sample
The sample consists of 2030 visitors to Serbia. There is a slightly higher number of males in the sample (51.6%), while the most visitors are in the 25–34 age category. Most of the visitors to Serbia are employed (73.6%) with finished faculty/college or acquired MSc and PhD diploma (56.7%). Visitors to Serbia mostly come from ex-Yugoslavia countries (21.4%), followed by Eastern Europe (11.9%), as presented in Table 1.

Table 1.
Sociodemographic characteristics of respondents (N = 2030).
4.2. Exploratory Factor Analysis—Destination Attractiveness Factors
Exploratory factorial analysis (EFA) was performed on a data set of 997 randomly selected visitors, measuring latent variable destination attractiveness factors. The results of EFA (principal component analysis) with Varimax rotation, factor loadings, and KMO are presented in Table 2. A Kaiser–Meyer–Olkin measure yielded 0.891, and Bartlett’s test of sphericity was 11,022.647 (df = 231, p < 0.000), showing high significance. Thus, further factor analysis was appropriate. Five factors were extracted, explaining at least 64.325% of the total variance. Reliability coefficients (Cronbach’s α) of all relevant variables in the rotated factor matrix ranged from 0.651 to 0.915 (Table 2). While Cronbach’s α for four factors is above 0.7 thresholds, for factor Social–Safety–Economic Values (SSEV) is 0.651, which is acceptable by Wim et al. [82]. According to the factor loading scores for each item, the five components are interpreted as five different attractiveness factors, which are (Destination Amenities—DA, Tourism Infrastructure and Accessibility—TIA, Active Family Destination—AFD, Hospitality and Services—HS, Social–Safety–Economic Values—SSEV).
Table 2.
Descriptive statistics for each latent variable and its items.
4.3. Measurement Model Validity for Attractiveness Factor—Confirmatory Factorial Analysis
Prior to estimating the structural model and testing our study hypotheses, the latent factors measurement model was estimated to check for innate construct validity and reliability using confirmatory factorial analysis CFA. Initial model fit indices showed good results, beside RMSEA, which was above threshold 0.08 (CFI = 0.960, TLI = 0.954, RMSEA = 0.102, SRMR = 0.069, df = 231, p < 0.000), thus revealing potential problems associated with the model. Therefore, the modification indices needed to be used. Six items in total with high residuals were excluded (DA5, TIA1, TIA2, AFD1, HS4, SSEV4), thus defining model with satisfactory fit (CFI = 0.988, TLI = 0.985, RMSEA = 0.079, SRMR = 0.048, df = 120, p < 0.000). The final scale for destination attractiveness factors included five latent factors with 16 items in total.
Scale reliability was assessed in three ways: using an Alpha coefficient (α), composite reliability (CR), and average variance extracted (AVE) indices (Table 3). The reliability analysis confirmed that all measures used in the study are reliable since Cronbach’s alpha (α) for each construct is greater than 0.7 [83], except for SSEV that is 0.68, which is near threshold, and a value of Cronbach’s alpha between 0.6 and 0.8 is acceptable [82].
Table 3.
Reliability of the instruments.
The convergent validity of each dimension was examined by calculating the average variance extracted (AVE) [84]. A substantial convergent validity is achieved when all item-to-factor loadings are significant and the AVE score is higher than 0.50 within each dimension. However, AVE higher than 0.40 is still acceptable if composite reliability (CR) is higher than 0.60 [84,85]. Results showed that all dimensions had AVE higher than 0.40 and CR higher than 0.60 (Table 3), indicating good convergent validity.
Discriminant validity was then checked by comparing the square root of each average variance extracted (AVEs) with the correlation coefficients for each latent construct. Fornell and Larcker [84] noted that the discriminant validity is guaranteed when the square root of each AVE is greater than the correlation coefficient’s estimates Table 4.
Table 4.
Discriminant validity.
The square roots of AVE values were all higher than the correlation values of constructs, compared to all other constructs. Thus, results confirm that all dimensions have sufficient discriminant validity [84,86].
4.4. Results of the Path Model
The path model was conducted to test the suggested hypothesis of the study. The results of the model provided satisfactory model fit (CFI = 0.987, TLI = 0.983, RMSEA = 0.071, SRMR = 0.047, df = 171, p < 0.000), which were acceptable for addressing the hypothesized interrelations between each latent factor and observed variables.
Regarding mediating role of satisfaction, the model showed that it mediates the relationship between Tourism Infrastructure and Accessibility and Destination Image. Additionally, Social–Safety–Economic Values and Destination Image, as both direct and indirect effects, were found significant. Additionally, the relationship between Hospitality and Services and Revisit Intention is mediated through satisfaction with both direct and indirect impact, and these factors were found to be significant.
The results of the model indicate that Tourism Infrastructure and Accessibility has a positive effect on Satisfaction (β = 0.123, p < 0.025); Hospitality and Services has a positive impact on Satisfaction (β = 0.340, p < 0.000); and Social–Safety–Economic Values has a positive effect on Satisfaction (β = 0.202, p < 0.001); hence, Hypotheses 2, 4, and 5 are confirmed. At the same time, Hypotheses 1 and 3 are rejected.
Regarding the influence of satisfaction and destination attractiveness factors on destination image, Tourism Infrastructure and Accessibility has a negative effect on Destination Image (β = −0.279, p < 0.000), while Active Family Destination has a positive effect on Destination Image (β = 0.075, p < 0.031), and Social–Safety–Economic Values has a positive effect on Destination Image (β = 0.304, p < 0.000). This means that Hypotheses 8 and 10 are confirmed, while Hypotheses 6, 7, and 9 are rejected.
The model showed that Destination Amenities has a positive effect on Revisit Intention (β = 0.135, p < 0.050) and Hospitality and Services has a positive effect on Revisit Intention (β = 0.306, p < 0.001), confirming Hypotheses 11 and 14, while Hypotheses 12, 13, and 15 are rejected.
Finally, Satisfaction has a positive effect on Destination Image (β = 0.227, p < 0.000), and Satisfaction has a positive effect on Revisit Intention (β = 0.312, p < 0.000), thus confirming Hypotheses 16 and 17.
The final Hypothesis 18 (satisfaction mediates the relationship between destination attractiveness factors and destination image and revisit intention) is also accepted.
Table 5.
The results of the model (standardized regression weights).
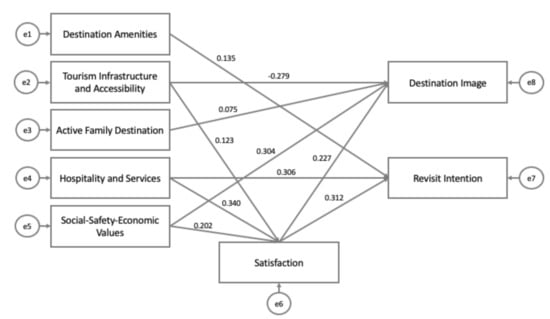
Figure 2.
The results of the path model based on standardized regression weights.
5. Discussion and Conclusions
The current study aimed to test interrelations between destination attractiveness factors, satisfaction, destination image, and revisit intention, within rookie destinations (Serbia) and further analyze the mediating role of satisfaction in regression between destination attractiveness factors, on one side, and destination image and revisit intention, on the other side. The study’s main theoretical contribution is that it addresses the research gap in the field of tourism and hospitality since this is the first time such a model is implemented to the emerging (rookie) destination.
The study results suggest that Tourism Infrastructure and Accessibility, Hospitality and Services, and Social–Safety–Economic Values showed a significant positive influence on Satisfaction. This is in line with previous research, finding a positive effect of Tourism Infrastructure and Accessibility on satisfaction [45,46] a positive impact of Hospitality and Services on satisfaction [34,35], and a positive influence of Social–Safety–Economic Values on satisfaction [36,48,49]. Destination Amenities and Active Family Destination were not significantly related to Satisfaction, which is opposed to studies of McKercher [37] and Vujičić et al. [36]. During their visit to Serbia, tourists were positively satisfied with developed infrastructure, good transport connection, tourism signalization, accommodation and restaurants, overall quality of services, safety and security, friendly local community, and value for money. These findings are essential for physical amenities at emerging destinations (most of the supporting components of a destination attractiveness). They show a good starting point since they do not require further heavy investment at this moment. Findings on positive satisfaction with other core and supporting destination attractiveness factors also facilitate different sustainable development plans for tailoring the meaningful experience for the tourists and directing future investments.
In terms of the influence of destination attractiveness factors on Destination Image, Active Family Destination and Social–Safety–Economic Values have a direct positive effect on Destination Image. In contrast, Tourism Infrastructure and Accessibility has a negative influence on Destination Image. Similar findings are found in the work of several previous studies [27,28,29,30,64], in which authors emphasized the impact of destination attractiveness on destination image. On the opposite side, Destination Amenities and Hospitality Services did not show a significant effect on Destination Image.
Regarding the influence of destination attractiveness factors on Revisit Intention, Destination Amenities and Hospitality Services have a direct positive influence on Revisit Intention, which is found in the work of Chi and Qu [27], Akgün et al. [31], Cong [64], and Viet et al. [30]. On the other hand, Active Family Destination, Social–Safety–Economic Values, and Tourism Infrastructure and Accessibility did not show a significant effect on Revisit Intention, which is in line with the work of Danaher and Arweiler [44], in which authors found that transportation services had no direct effect on tourists’ revisit intention. On the other side, authors found influence on revisit intention by accommodation services [34,35,87], transportation services [45,47], quality of infrastructure [34,35,43], and safety and security [43,47,48,52,53], which is in contrast to the findings within this study. From Figure 2, it can be observed that museums, galleries, cultural heritage, events, accommodation, restaurants, service quality are significant predictors of the probability of revisit intention and the strongest determinants. From the managerial perspective and DMO, mentioned items should keep the overall quality as the proven driving forces of a rookie destination.
Besides the direct effects of mentioned destination attractiveness factors on Satisfaction, Destination Image, and Revisit Intention, Satisfaction also positively impacted Destination Image and Revisit Intention. The finding could be analyzed in the context that satisfied tourists are more willing to come back to the same destination, further contributing toward a positive image of a destination, which is in congruence with the research of De Nisco et al. [11] and others who connect satisfaction with latent variable destination loyalty [27,43,54,61,65].
The most important assumption of the current study was that satisfaction mediates the relationship between the destination attractiveness factors and Destination Image and Revisit Intention (Hypothesis 18). Satisfaction was found to mediate Tourism Infrastructure and Accessibility and Social–Safety–Economic Values with Destination Image, especially for Tourism Infrastructure and Accessibility since, through Satisfaction’s mediation role, they change from negative to the positive effect on Destination Image. We can explain that tourists have perceived negative impressions about the infrastructure, good transport connection, and tourism signalization. After the visit, the destination impressions change to more positive feelings, contributing to the positive Destination Image. Additionally, we can argue that safety and security, friendly local community, and good value for money are enhanced through satisfaction during the visit and leading to a better Destination Image. While for Social–Safety–Economic Values, their already positive effect on Destination Image is boosted through Satisfaction mediation. Additionally, Satisfaction is found to mediate Hospitality and Services with Revisit Intention, which means that satisfied tourists with accommodation, restaurants, and the overall service quality will further lead toward their intention to revisit the destination. Finally, our findings are in line with the recent study of Marques et al. [2], which found the positive mediation role of satisfaction on revisit intention within the emerging destination of Sofia (the city in Bulgaria, a neighboring country to Serbia).
Study Limitations and Further Research
Despite the significant contributions it makes, this study has several limitations that direct academia into new research gaps and areas. First, the research study area is limited by its focus on emerging tourism destinations (rookie). Future research conducted in other types of destinations will probably be valuable for validating these research results and generalizing the proposed model. Second, satisfaction is presented as an observed variable, and for further complexity of the model, it should be presented as a latent variable. This study analyzed the satisfaction–destination image relation as the postvisit country image, which is found in the research of Da Graça Batista et al. [88] and Gim [89]. This differs from other research focusing on the tourism perspective, in which the destination image is considered an antecedent to tourists’ satisfaction with the destination [11,47]; therefore, future research could test this variable relation. Additionally, destination image and revisit intention can be viewed as latent variables rather than observed, making the proposed model more complex and informative. Future research could include different sociodemographic characteristics and test their mediation role between destination attractions factors, on one side, and satisfaction, destination image, and revisit intention, on the other side. The COVID-19 pandemic proved to be a game changer for tourism destinations [90], followed by postpandemic strategies and survival toll kits. In order to develop such documents and strategies, policymakers will need to rely on effective use of data that will guide them toward smarter decisions [91].
Author Contributions
Conceptualization: M.Ć. and M.D.V.; methodology, M.Ć. and M.D.V.; formal analysis, M.D.V.; investigation, Č.K., M.D. and Đ.A.V.; data curation, M.Ć., Č.K., M.D. and Đ.A.V.; writing—original draft preparation, M.Ć., M.D.V. and Č.K.; writing—review and editing, U.S., S.K. and Ž.A. All authors have read and agreed to the published version of the manuscript.
Funding
This research received no external funding.
Institutional Review Board Statement
Not applicable.
Informed Consent Statement
Informed consent was obtained from all subjects involved in the study.
Data Availability Statement
Data available on request due to restrictions.
Acknowledgments
This publication is based upon work from COST Action CA18124—The Geography of New Working Spaces and the Impact on the Periphery supported by COST (European Cooperation in Science and Technology).
Conflicts of Interest
The authors declare no conflict of interest.
References
- Armenski, T.; Dwyer, L.; Pavluković, V. Destination Competitiveness: Public and Private Sector Tourism Management in Serbia. J. Travel Res. 2018, 57, 384–398. [Google Scholar] [CrossRef]
- Marques, C.; da Silva, R.V.; Antova, S. Image, satisfaction, destination and product post-visit behaviours: How do they relate in emerging destinations? Tour. Manag. 2021, 85, 104293. [Google Scholar] [CrossRef]
- Armenski, T.; Stankov, U.; Choi, H.S. Destination Branding of European Russia: An Empirical Investigation of the Web Projected Imagery. Drus. Istraz. 2018, 27, 735–755. [Google Scholar] [CrossRef]
- Prayag, G.; Ryan, C. Antecedents of tourists’ loyalty to Mauritius: The role and influence of destination image, place attachment, personal involvement, and satisfaction. J. Travel Res. 2011, 51, 342–356. [Google Scholar] [CrossRef]
- Veasna, S.; Wu, W.Y.; Huang, C.H. The impact of destination source credibility on destination satisfaction: The mediating effects of destination attachment and destination image. Tour. Manag. 2013, 36, 511–526. [Google Scholar] [CrossRef]
- Lam, G.Y.E.; León, G.C.J.; León, L.J.D. Highlights of consumption and satisfaction in nautical tourism. A comparative study of visitors to the Canary Islands and Morocco. Gest. Amb. 2015, 18, 129–145. [Google Scholar]
- Hu, Y.; Ritchie, B.J. Measuring Destination Attractiveness: A Contextual Approach. J. Travel Res. 1993, 32, 25–34. [Google Scholar]
- Ritchie, B.J.; Crouch, G.I. The Competitive Destination: A Sustainable Tourism Perspective; CABI Publishing: Wallingford, UK, 2005; p. 304. [Google Scholar]
- Lew, A.A. A Framework of tourist attraction research. Ann. Tour. Res 1987, 14, 553–575. [Google Scholar] [CrossRef]
- Stankov, U.; Kennell, J.; Morrison, A.M.; Vujičić, M.D. The view from above: The relevance of shared aerial drone videos for destination marketing. J. Travel Tour. Mark. 2019, 36, 808–822. [Google Scholar] [CrossRef]
- De Nisco, A.; Mainolfi, G.; Marino, V.; Napolitano, M.R. Tourism satisfaction effect on general country image, destination image, and post-visit intentions. J. Vacat. Mark. 2015, 21, 305–317. [Google Scholar] [CrossRef]
- Krešić, D.; Prebežac, D. Index of destination attractiveness as a tool for destination attractiveness assessment. Tourism 2011, 59, 497–517. [Google Scholar]
- Klaučo, M.; Gregorová, B.; Stankov, U.; Marković, V.; Lemenkova, P. Land planning as a support for sustainable development based on tourism: A case study of Slovak Rural Region. Environ. Eng. Manag. J. 2017, 16, 449–458. [Google Scholar] [CrossRef]
- Dwyer, L.; Pavluković, V.; Armenski, T.; Mihalič, T.; Cvelbar, L.K. Achieving Destination Competitiveness: An Importance–Performance Analysis of Serbia. Curr. Issues Tour. 2014, 19, 1309–1336. [Google Scholar] [CrossRef]
- Kim, H.B. Perceived attractiveness of Korean destinations. Ann. Tour. Res 1998, 25, 340–361. [Google Scholar]
- Formica, S.; Uysal, M. Destination attractiveness based on supply and demand evaluations: An analytical framework. J. Travel Res. 2006, 44, 418–430. [Google Scholar] [CrossRef]
- Lee, C.F.; Huang, H.I.; Huery-Ren, Y. Developing an evaluation model for destination attractiveness: Sustainable forest recreation tourism in Taiwan. J. Sustain. Tour. 2010, 18, 811–828. [Google Scholar] [CrossRef]
- Kim, D.; Perdue, R.R. The Influence of Image on Destination Attractiveness. J. Travel Tour. Mark. 2011, 28, 225–239. [Google Scholar] [CrossRef]
- Reitsamer, B.F.; Brunner-Sperdin, A.; Stokburger-Sauer, N.E. Destination attractiveness and destination attachment: The mediating role of tourists’ attitude. Tour. Manag. Perspect. 2016, 19, 93–101. [Google Scholar] [CrossRef]
- Mayo, E.J.; Jarvis, L.P. The Psychology of Leisure Travel: Effective Marketing and Selling of Travel Services; CBI Publishing Company: Boston, MA, USA, 1981; p. 281. [Google Scholar]
- Vengesayi, S. A conceptual model of tourism destination competitiveness and attractiveness. In Proceedings of the ANZMAC 2003 Conference, Adelaide, Australia, 1–3 December 2003; pp. 637–647. [Google Scholar]
- Vigolo, V. Investigating the attractiveness of an emerging long-haul destination: Implications for loyalty. Int. J. Tour. Res. 2015, 17, 564–576. [Google Scholar] [CrossRef]
- Buhalis, D. Marketing the competitive destination of the future. Tour. Manag. 2000, 21, 97–116. [Google Scholar] [CrossRef]
- Cracolici, M.F.; Nijkamp, P. The attractiveness and competitiveness of tourist destinations: A study of southern Italian regions. Tour. Manag. 2008, 30, 336–344. [Google Scholar] [CrossRef]
- Pine, J.; Gilmore, J.H. Welcome to the experience economy. Harv. Bus. 1998, 76, 97–105. [Google Scholar]
- Bozic, S.; Kennell, J.; Vujicic, M.D.; Jovanovic, T. Urban tourist motivations: Why visit Ljubljana? Int. J. Tour. Cities 2017, 3, 382–398. [Google Scholar] [CrossRef]
- Chi, C.; Qu, H. Examining the structural relationships of destination image, tourist satisfaction and destination loyalty: An integrated approach. Tour. Manag. 2008, 29, 624–636. [Google Scholar] [CrossRef]
- Cong, L.C.; Dam, D.X. Factors affecting European tourists’ satisfaction in Nha Trang City: Perceptions of destination quality. Int. J. Tour. Cities 2017, 3, 350–362. [Google Scholar] [CrossRef]
- Bang, N.V. The influence of destination image components on tourist satisfaction and loyalty: A case study in Côn Đảo Islands, Vietnam. Afr. J. Hosp. Tour. Leis. 2019, 8, 1–14. [Google Scholar]
- Viet, B.N.; Dang, H.P.; Nguyen, H.H. Revisit intention and satisfaction: The role of destination image, perceived risk, and cultural contact. Cogent Bus. Manag. 2020, 7, 1796249. [Google Scholar] [CrossRef]
- Akgün, A.E.; Senturk, H.A.; Keskin, H.; Onal, I. The relationships among nostalgic emotion, destination images and tourist behaviors: An empirical study of Istanbul. J. Dest. Mark. Manag. 2020, 16, 100355. [Google Scholar] [CrossRef]
- Echtner, C.M.; Ritchie, J.R.B. The measurement of destination image: An empirical assessment. J. Travel Res. 1993, 31, 3–13. [Google Scholar] [CrossRef]
- Murphy, P.; Pritchard, M.P.; Smith, B. The destination product and its impact on traveller perceptions. Tour. Manag. 2000, 21, 43–52. [Google Scholar] [CrossRef]
- Chen, C.F.; Chen, F.S. Experience quality, perceived value, satisfaction and behavioral intentions for heritage tourists. Tour. Manag. 2010, 31, 29–35. [Google Scholar] [CrossRef]
- Hui, K.T.; Wan, D.; Ho, A. Tourists’ satisfaction, recommendation revisiting Singapore. Tour. Manag. 2007, 28, 965–975. [Google Scholar] [CrossRef]
- Vujičić, M.D.; Stamenković, I.; Stankov, U.; Kovačić, S.; Vasiljević, Đ.A.; Locke, J.P. What will prevail within citybreak travel, motivation or demotivation? Case study of Novi Sad, Vojvodina, Serbia. Geogr. Pannonica 2020, 24, 42–55. [Google Scholar] [CrossRef]
- McKercher, B. A comparative study of international cultural tourists. J. Hosp. Tour. Manag. 2004, 11, 95–107. [Google Scholar]
- Ab Karim, S.; Chi, C.G.Q. Culinary tourism as a destination attraction: An empirical examination of destinations’ food image. J. Hosp. Mark. Manag. 2010, 19, 531–555. [Google Scholar] [CrossRef]
- Bessiere, J. Local development and heritage: Traditional food and cuisine as tourist attractions in rural areas. Sociol. Rur. 1998, 38, 21–34. [Google Scholar] [CrossRef]
- Frochot, I. An analysis of regional positioning and its associated food images in French tourism regional brochures. J. Travel Tour. Mark. 2003, 14, 77–96. [Google Scholar] [CrossRef]
- Kim, Y.H.; Kim, M.; Goh, B.K.; Antun, J.M. The role of money: The impact on food tourists’ satisfaction and intention to revisit food events. J. Culin. Sci. Technol. 2011, 9, 85–98. [Google Scholar] [CrossRef]
- Quan, S.; Wang, N. Towards a structural model of the tourist experience: An illustration from food experiences in tourism. Tour. Manag. 2004, 25, 297–305. [Google Scholar] [CrossRef]
- Loi, L.T.I.; So, A.S.I.; Lo, I.S.; Fong, L.H.N. Does the quality of tourist shuttles influence revisit intention through destination image and satisfaction? The case of Macao. J. Hosp. Tour. Manag. 2017, 32, 115–123. [Google Scholar] [CrossRef]
- Danaher, P.J.; Arweiler, N. Customer satisfaction in the tourist industry: A case study of visitors to New Zealand. J. Travel Res. 1996, 35, 89–93. [Google Scholar] [CrossRef]
- Thompson, K.; Schofield, P. An investigation of the relationship between public transport performance and destination satisfaction. J. Transp. Geogr. 2007, 15, 136–144. [Google Scholar] [CrossRef]
- Zhang, H.; Wu, Y.; Buhalis, D. A model of perceived image, memorable tourism experiences and revisit intention. J. Dest. Mark. Manag. 2017, 8, 1–11. [Google Scholar] [CrossRef]
- Chen, J.V.; Htaik, S.; Hiele, T.M.B.; Chen, C. Investigating international tourists’ intention to revisit Myanmar based on need gratification, flow experience and perceived risk. J. Qual. Assur. Hosp. Tour. 2017, 18, 25–44. [Google Scholar] [CrossRef]
- Mok, C.; Armstrong, R.W.; Go, F.M. Taiwanese travellers’ perception of leisure destination attributes. Aust. J. Hosp. Manag. 1995, 2, 17–22. [Google Scholar]
- Glensor, R.; Peak, K. Crimes against Tourists. 2004. Available online: http://www.cops.usdoj.gov/mime/open.pdf?Item=1306 (accessed on 20 April 2021).
- Edgell, D.L. International Tourism Policy; Van Nostrand Reinhold: New York, NY, USA, 1990. [Google Scholar]
- Morrison, A.M. Hospitality and Travel Marketing; Delmar Publishers: New York, NY, USA, 1996. [Google Scholar]
- Hutchinson, J.; Lai, F.; Wang, Y. Understanding the relationships of quality, value, equity, satisfaction, and behavioral intentions among golf travelers. Tour. Manag. 2009, 30, 298–308. [Google Scholar] [CrossRef]
- Ranjbarian, B.; Pool, J.K. The impact of perceived quality and value on tourists’ satisfaction and intention to revisit Nowshahr city of Iran. J. Qual. Assur. Hosp. Tour. 2015, 16, 103–117. [Google Scholar] [CrossRef]
- Kim, J.; Ritchie, J.R.B.; McCormick, B. Development of a scale to measure memorable tourism experiences. J. Travel Res. 2012, 51, 12–25. [Google Scholar] [CrossRef]
- Chen, C.F.; Tsai, D.C. How destination image and evaluative factors affect behavioral intentions? Tour. Manag. 2007, 28, 1115–1122. [Google Scholar] [CrossRef]
- Rajesh, R. Impact of tourist perceptions, destination image and tourist satisfaction on destination loyalty: A conceptual model. PASOS Rev. Tur. Patrim. Cult. 2013, 11, 67–78. [Google Scholar] [CrossRef]
- Backman, K.F.; Backman, S.J.; Malinovsky, J. An assessment of service quality in a nature-based tourism setting. J. Qual. Assur. Hosp. Tour. 2000, 1, 9–29. [Google Scholar] [CrossRef]
- Naidoo, P.; Ramseook-munhurrun, P.; Seegoolam, P. An assessment of visitor satisfaction with nature-based tourism attractions. Int. J. Manag. Mark. Res. 2011, 4, 87–98. [Google Scholar]
- Kozak, M.; Rimmington, M. Tourist satisfaction with Mallorca, Spain, as an off-season holiday destination. J. Travel. Res. 2000, 38, 260–269. [Google Scholar] [CrossRef]
- Devesa, M.; Laguna, M.; Picos, A. The role of motivation in visitor satisfaction: Empirical evidence in rural tourism. Tour. Manag. 2010, 31, 547–552. [Google Scholar] [CrossRef]
- Chiu, W.; Zeng, S.; Cheng, P.S.-T. The influence of destination image and tourist satisfaction on tourist loyalty: A case study of Chinese tourists in Korea. Int. J. Cult. Tour. Hosp. Res. 2016, 10, 223–234. [Google Scholar] [CrossRef]
- Cole, S.T.; Scott, D. Examining the mediating role of experience quality in a model of tourist experiences. J. Travel Tour. Mark. 2004, 16, 79–90. [Google Scholar] [CrossRef]
- Quintal, V.A.; Polczynski, A. Factors influencing tourists’ revisit intentions. Asia Pac. J. Mark. Logist. 2010, 22, 554–578. [Google Scholar] [CrossRef]
- Cong, L.C. A formative model of the relationship between destination quality, tourist satisfaction and intentional loyalty: An empirical test in Vietnam. J. Hosp. Tour. Manag. 2016, 26, 50–62. [Google Scholar] [CrossRef]
- Bigne, J.E.; Sanchez, M.I.; Sanchez, J. Tourism image, evaluation variables and after purchase behaviour: Inter-relationship. Tour. Manag. 2001, 22, 607–616. [Google Scholar] [CrossRef]
- Crompton, J.L.; Ankomah, P.K. Choice set propositions in destination decision. Ann. Tour. Res. 1993, 20, 461–476. [Google Scholar] [CrossRef]
- Assaker, G.; Vinzi, V.E.; O’Connor, P. Examining the effect of novelty seeking, satisfaction, and destination image on tourists’ return pattern: A two factor, nonlinear latent growth model. Tour. Manag. 2011, 32, 890–901. [Google Scholar] [CrossRef]
- Del Bosque, I.R.; Martín, H.S. Tourist satisfaction: A cognitive-affective model. Ann. Tour. Res. 2008, 35, 551–573. [Google Scholar] [CrossRef]
- Lee, C.K.; Lee, Y.K.; Lee, B. Korea’s destination image formed by the 2002 World Cup. Ann. Tour. Res. 2005, 32, 839–858. [Google Scholar] [CrossRef]
- Petrick, J.F.; Morais, D.B.; Norman, W. An examination of the determinants of entertainment vacationers’ intentions to visit. J. Travel Res. 2001, 40, 41–48. [Google Scholar] [CrossRef]
- Kanwel, S.; Lingqiang, Z.; Asif, M.; Hwang, J.; Hussain, A.; Jameel, A. The Influence of Destination Image on Tourist Loyalty and Intention to Visit: Testing a Multiple Mediation Approach. Sustainability 2019, 11, 6401. [Google Scholar] [CrossRef]
- Um, S.; Chon, K.; Ro, Y.H. Antecedents of revisit intention. Ann. Tour. Res. 2006, 33, 1141–1158. [Google Scholar] [CrossRef]
- Ramseook-Munhurrun, P.; Seebaluck, V.N.; Naidoo, P. Examining the structural relationships of destination image, perceived value, tourist satisfaction and loyalty: Case of Mauritius. Procedia Soc. Behav. Sci. 2015, 175, 252–259. [Google Scholar] [CrossRef]
- Stylos, N.; Vassiliadis, C.A.; Bellou, V.; Andronikidis, A. Destination images, holistic images and personal normative beliefs: Predictors of intention to revisit a destination. Tour. Manag. 2016, 53, 40–60. [Google Scholar] [CrossRef]
- Vujičić, M.D.; Kennell, J.; Morrison, A.; Viachaslau, F.; Štajner Papuga, I.; Stankov, U.; Vasiljević, D. Fuzzy Modelling of Tourist Motivation: An Age-Related Model for Sustainable, Multi-Attraction, Urban Destinations. Sustainability 2020, 12, 8698. [Google Scholar] [CrossRef]
- Bollen, K.A. A new incremental fit index for general structural models. Sociol. Methods Res. 1989, 17, 303–316. [Google Scholar] [CrossRef]
- Yoon, Y.; Gursoy, D.; Chen, J. Validating a tourism development theory with structural equation modeling. Tour. Manag. 2001, 22, 363–372. [Google Scholar] [CrossRef]
- Drakulić Kovačević, N.; Kovačević, L.; Stankov, U.; Dragićević, V.; Miletić, A. Applying destination competitiveness model to strategic tourism development of small destinations: The case of South Banat district. J. Dest. Mark. Manag. 2018, 8, 114–124. [Google Scholar] [CrossRef]
- Statistical Office of Republic of Serbia. Available online: https://www.stat.gov.rs/publikacije/publication/?p=12102 (accessed on 4 April 2021).
- Statistical Office of Republic of Serbia. Available online: https://www.stat.gov.rs/publikacije/publication/?p=12972 (accessed on 4 April 2021).
- Statistical Office of Republic of Serbia. Available online: https://www.stat.gov.rs/publikacije/publication/?p=12795 (accessed on 4 April 2021).
- Wim, J.; Katrien, W.; Patrick, D.P.; Patrick, V.K. Marketing Research with SPSS, 1st ed.; Prentice Hall, Pearson Education: Hoboken, NJ, USA, 2008; pp. 274–275. ISBN 978-0-273-70383-9. [Google Scholar]
- Kaiser, H.F. An index of factorial simplicity. Psychometrika 1974, 39, 31–36. [Google Scholar] [CrossRef]
- Fornell, C.; Larcker, D.F. Evaluating Structural Equation Models with Unobservable Variables and Measurement Error. J. Mark. Res. 1981, 18, 39–50. [Google Scholar] [CrossRef]
- Huang, C.-C.; Wang, Y.-M.; Wu, T.-W.; Wang, P.-A. An Empirical Analysis of the Antecedents and Performance Consequences of Using the Moodle Platform. Int. J. Inf. Educ. Technol 2013, 3, 217–221. [Google Scholar] [CrossRef]
- Zait, A.; Bertea, P.E. Methods for Testing Discriminant Validity. Manag. Mark. J. 2011, 9, 217–224. [Google Scholar]
- Kalinić, Č.; Vujičić, M. A Subnational Assessment of Hotel Social Media Metrics—The Case of Serbia. Geogr. Pannonica 2019, 23, 87–101. [Google Scholar] [CrossRef]
- Da Graça Batista, M.; Couto, J.P.; Botelho, D.; Faias, C. Tourist satisfaction and loyalty in the hotel business: An application to the Island of São Miguel, Azores. Tour. Manag. Stud. 2014, 10, 16–23. [Google Scholar]
- Gim, T.-H.T. Tourist Satisfaction, Image, and Loyalty from an Interregional Perspective: An Analysis of Neighboring Areas with Distinct Characteristics. Sustainability 2018, 10, 1283. [Google Scholar] [CrossRef]
- Stankov, U.; Filimonau, V.; Vujičić, M.D. A mindful shift: An opportunity for mindfulness-driven tourism in a post-pandemic world. Tour. Geogr. 2020, 22, 703–712. [Google Scholar] [CrossRef]
- Dias, Á.; Aldana, I.; Pereira, L.; da Costa, R.L.; António, N. A Measure of Tourist Responsibility. Sustainability 2021, 13, 3351. [Google Scholar] [CrossRef]
Publisher’s Note: MDPI stays neutral with regard to jurisdictional claims in published maps and institutional affiliations. |
© 2021 by the authors. Licensee MDPI, Basel, Switzerland. This article is an open access article distributed under the terms and conditions of the Creative Commons Attribution (CC BY) license (https://creativecommons.org/licenses/by/4.0/).