Abstract
The purpose of this study was to evaluate outdoor PM2.5 infiltration into multifamily homes according to the building characteristics using regression models. Field test results from 23 multifamily homes were analyzed to investigate the infiltration factor and building characteristics including floor area, volume, outer surface area, building age, and airtightness. Correlation and regression analysis were then conducted to identify the building factor that is most strongly associated with the infiltration of outdoor PM2.5. The field tests revealed that the average PM2.5 infiltration factor was 0.71 (±0.19). The correlation analysis of the building characteristics and PM2.5 infiltration factor revealed that building airtightness metrics (ACH50, ELA/FA, and NL) had a statistically significant (p < 0.05) positive correlation (r = 0.70, 0.69, and 0.68, respectively) with the infiltration factor. Following the correlation analysis, a regression model for predicting PM2.5 infiltration based on the ACH50 airtightness index was proposed. The study confirmed that the outdoor-origin PM2.5 concentration in sufficiently leaky units could be up to 1.59 times higher than that in airtight units.
1. Introduction
Outdoor PM2.5 is known to cause respiratory and cardiovascular diseases when the human body is exposed to it for long periods [1,2], and it is classified as a Group 1 carcinogen by the International Agency for Research on Cancer (IARC) under the World Health Organization (WHO). Accordingly, many countries have proposed national countermeasures against outdoor PM2.5 and have established standards intended to reduce the damage caused by exposure to PM2.5. The U.S. Environmental Protection Agency (EPA) established the National Ambient Air Quality Standards for PM2.5 in 1997 and then in 2012 reinforced the standards at a mean level of 35 per 24 h. The State Council of the People’s Republic of China suggested the Air Pollution Prevention and Control Action Plan in 2013 [3]. The Ministry of Environment (MOE) in Korea presented the High Concentration Fine Particle Response Manual for vulnerable groups in 2017. Action levels for outdoor PM2.5, which is known to have a large impact on the human body, have been in force in Korea since 2015.
Nevertheless, outdoor PM2.5 can infiltrate the indoors through cracks in buildings, even under non-ventilated conditions, thereby affecting indoor PM2.5 concentrations [4,5]. As outdoor- and indoor-origin PM2.5 differ in composition, formation, and toxicity [6,7], it is necessary to evaluate their concentrations separately in order to establish management strategies for reducing indoor PM2.5 concentrations. Moreover, since outdoor-origin PM2.5 consists of air pollutants such as nitrates, sulfates, and carbon compounds, it is known to have higher health risks than indoor-origin PM2.5 [8]. Accordingly, it is important to evaluate the infiltration of outdoor PM2.5 when managing indoor PM2.5.
Several studies have evaluated the infiltration of outdoor PM2.5 into indoors. Existing studies have suggested a relationship between indoor and outdoor PM2.5 concentrations through the calculation of the indoor–outdoor concentration ratio (I/O ratio) in residential buildings [9,10,11,12]. In the measurements for occupied buildings, the average I/O ratio was found to be in the range of 0.61 to 1.00, which indicates that the outdoor PM2.5 concentration affects the indoor PM2.5 concentration. Several studies have been conducted to assess the infiltration of outdoor PM2.5 with infiltration factors [13,14,15,16,17,18]. The PM2.5 infiltration factor is an indicator of the equilibrium fraction of outdoor PM2.5 that penetrates and becomes suspended indoors. In these studies, the infiltration factor ranged from 0.35 to 0.66, from which it can be estimated that the indoor PM2.5 concentration in residential buildings is 35–66% of the outdoor PM2.5 concentration. The results show that the impact of outdoor-origin PM2.5 on indoor concentrations may vary according to the building characteristics.
Infiltration of outdoor PM2.5 depends on building characteristics such as the building size (floor area and volume of room), year of construction, and airtightness [18,19,20]. In addition, environmental conditions such as temperature and pressure differences between the indoors and outdoors can affect the amount of outdoor-origin PM2.5 reaching the indoors [18,19,20,21]. Stephens and Siegel [22] conducted infiltration tests of ultrafine particles (20–1000 nm in diameter) in 18 detached homes in the U.S. to analyze the correlation between various building characteristics and the outdoor source of ultrafine particles. In their study, environmental conditions, including indoor–outdoor pressure differences, differed by testing unit when conducting the infiltration test. They found a limit at which the impact of the environmental conditions was reflected in the assessment of the infiltration according to the building characteristics. Unlike the detached houses studied in previous research, according to the 2015 Population and Housing Census of Korea [23], 77.2% of residential buildings in Korea are multifamily homes, most of which are high-rise buildings of 15 or more stories. Accordingly, the PM2.5 infiltration is expected to vary due to the differences in building characteristics. To establish targeted management strategies for reducing indoor PM2.5 in diverse multifamily housing units in Korea, it is necessary to identify the impact of the dominant building factors on the infiltration of outdoor PM2.5.
This study aimed to estimate the outdoor PM2.5 infiltration of multifamily homes depending on the building characteristics. Field test results for 23 multifamily homes were analyzed to investigate the infiltration factor and building characteristics including the floor area, volume, outer surface area, building age, and airtightness. Subsequently, regression analysis was conducted to identify the dominant building factors influencing infiltration of outdoor PM2.5. To minimize the impact of environmental disturbances, the blower-door depressurization procedure [18,24], which enables the maintenance of an identical indoor–outdoor pressure difference for each test housing unit, was utilized to conduct the PM2.5 infiltration test. Based on the correlation analysis results, a regression model for predicting PM2.5 infiltration according to the airtightness index is proposed.
2. Methods
2.1. Analysis Units
The analysis units consisted of a total of 23 domestic homes. These homes had reinforced concrete structures with layouts including living rooms, kitchens, and toilets and had various building characteristics. They included 12 units being tested for the first time and 11 units that had been previously investigated in a study by Choi and Kang [18]. Among the building characteristics of the analysis units, the construction year, floor area, and window area were obtained through on-site investigation and are listed in Table 1. The average building age was 13.6 years, with a minimum of 1 year and a maximum of 38 years. The floor area ranged from 14 to a maximum of 212 , with an average of 57.4 . In terms of floor area, both small and large units were thus included in the experiment. To analyze the correlation between building factors and outdoor infiltration, field tests were conducted to measure the airtightness of the buildings and the PM2.5 infiltration factor.

Table 1.
Descriptive statistics of the building factors.
2.2. Airtightness Test
To measure the airtightness of the test homes, the fan pressurization method was applied in compliance with ISO 9972 [25]. The airtightness of the buildings was calculated using the fan pressurization method based on the air flow rate generated by the fan to determine the indoor–outdoor pressure difference for five points between 10 and 60 Pa. The indoor–outdoor pressure difference and the resulting air flow rate can be explained by the power law in Equation (1), and the trend line, which is found by interpolating the measured values with a straight line, can be used to obtain the air leakage coefficient (C) and the pressure exponent. C depends on the leakage characteristics of the building; n is a value between 0.5 and 1: it is close to 0.5 when the inflow air is turbulent and close to 1.0 when it is laminar. The power law is
where Q is the air leakage rate through the building envelope (, C is the air leakage coefficient (), is the induced pressure difference (Pa), and n is the pressure exponent (dimensionless).
(the air change rate at 50 Pa), which is used as a performance indicator of airtightness, can be calculated using the ratio of the air flow rate to the volume of the room, while maintaining the indoor–outdoor pressure difference at 50 Pa through Equation (2). The effective leakage area (ELA) of the units when the pressure difference between the indoors and outdoors is 4 Pa can be calculated using Equation (3). Since the ELA of each unit depends on the size of the unit, the specific ELA, which distributes the ELA over the floor area, was also calculated. The normalized leakage (NL), which allows for comparison of the airtightness between units by accounting for their floor area and height, is calculated by Equation (4) using the ELA, floor area, and floor height:
where is the air flow rate through the building envelope under a pressure difference of 50 Pa(, C is the air flow coefficient (), is the reference pressure difference (Pa), n is the air flow exponent (dimensionless), is the air density (kg ), is the floor area (), and H is the floor height (m).
In this study, Retrotec EU6101 with DM32 (USA) was used as the measurement equipment for the fan pressurization method; the measurement error of the wind volume was ±5%. To prevent measurement errors caused by indoor–outdoor pressure differences, the measurement conditions proposed in ISO 9972 were employed, that is, a wind speed of less than 6 m/s and natural conditions with an indoor–outdoor pressure difference of 5 Pa or more. Assuming a single-zone target unit, the interior doors were kept open during the measurement of the blower door, and the air flow rate generated by the fan was measured to create outdoor pressure difference conditions of 10, 20, 30, 40, and 50 Pa. Based on the measurement results of the blower door, the following airtightness indicators were derived: C (leakage coefficient), n (pressure exponent), , ELA (effective leakage area), specific ELA, and NL (normalized leakage). To classify the analysis units by airtightness level, the leakage class was determined according to the airtightness and ventilation requirements presented by ASHRAE 119 [26], as shown in Table 2.
Table 2.
Leakage class according to ASHRAE 119.
2.3. PM 2.5 Infiltration Test
To analyze the effects of building factors on the infiltration of outdoor , a infiltration test was conducted using the blower-door depressurization method [18], which enables the assessment of outdoor infiltration under controlled pressure differences. The main strategy of the blower-door depressurization method is to use a blower door to fix the indoor–outdoor pressure difference at 10 Pa and then to measure the indoor and outdoor concentrations. To obtain the indoor concentration after the infiltrated outdoor-origin had been fully mixed into the indoor air, the indoor and outdoor concentration measurements were obtained after operating the blower door for more than one time constant to entirely replace the room air under the controlled indoor–outdoor pressure difference of 10 Pa.
Under natural conditions, the difference between the indoor and outdoor pressures of a building is generally known to be 4 Pa [27]. In this study, the pressure difference was limited to 10 Pa through the blower door to enable the comparison of the building-specific infiltration factor. This is the minimum recommended pressure difference at which the flow rate is controlled during the blower-door experiment [27], and it is an indoor–outdoor pressure difference that can be found in mid- and high-rise buildings or that can be caused by external winds in winter [28,29]. Based on the living environment in Korea, where the proportion of high-rise multifamily housing units is high, a pressure difference of 10 Pa is therefore judged as suitable for simulating the natural infiltration environment in middle- and high-rise units. Although low indoor–outdoor pressure differences can cause the measured infiltration factor to be slightly higher than the actual infiltration factor, this study included an infiltration experiment under the same environmental conditions to select the dominant building factors for outdoor infiltration through comparison of the units and then evaluated the infiltration level.
In this study, the infiltration factor as an indicator of outdoor infiltration was calculated using the indoor mass balance equation. Equation (5) is the indoor mass balance equation; it is composed of the outdoor infiltration, indoor generation, and deposition, resuspension, removal, and exfiltration terms:
where V is the volume of the room (), is the indoor concentration (), is the outdoor concentration (), P is the penetration coefficient (dimensionless), is the air change rate (), K is the deposition rate (), E is the indoor emission rate (), is the resuspension rate (), and is the removal rate ().
The change in indoor concentration is expressed by Equation (6) with the assumption that there is no indoor generation source, resuspension, or removal. The indoor concentration can be expressed by Equation (7) when the indoor fine dust concentration reaches a steady-state, at which point the infiltration factor () can be obtained as the ratio of the indoor and outdoor concentrations in the steady-state, as shown in Equation (8):
where V is the volume of the room (), is the indoor concentration (), is the outdoor concentration (), P is the penetration coefficient (dimensionless), is the air change rate at 10 Pa (), K is the deposition rate (), is the indoor concentration at steady-state (), and is the outdoor concentration at steady-state ().
To conduct the infiltration test using the fan pressurization method, Retrotec EU6101 with DM32 (USA) was used for the blower door, and a light-scattering-type AM510 (TSI, Shoreview, MN, USA), which has been used for continuous measurement of concentration in previous studies [30,31], was used for the measurements. The measurement error of the PM2.5 concentration was 1 over 24 h. At a measurement interval of 3 min, the indoor and outdoor concentrations were measured at one point in the center of the unit and at one point in the outdoor area close to the unit. To prevent the resuspension of indoor caused by air flow through the blower door, cleaning was carried out to remove indoor sources before the measurements, and the measurements were conducted in the absence of indoor sources or resuspension activities in the room. The concentration was obtained after one time constant at a 10 Pa pressure difference at the steady-state of the indoor concentration, and the infiltration factor of was calculated using Equation (8).
The infiltration test with the blower-door depressurization procedure was conducted to minimize the impact of environmental factors on the outdoor infiltration when comparing the infiltration factors of multifamily homes according to their building characteristics. Nevertheless, as the factors affecting the outdoor infiltration, the outdoor concentration conditions varied at the time of the measurements. When the outdoor concentration is low, the margin of error in the calculation of the infiltration factor may even increase to the level of the device measurement error (1 ) due to the small difference between the indoor and outdoor concentrations. When the outdoor concentration changes drastically, the infiltration factor may be overestimated or underestimated depending on the pattern of change. The analysis was thus performed by classifying the outdoor concentration and its fluctuations as they are expected to affect the outdoor infiltration (Table 3). OPC-1 denotes the combination of concentrations that exceed the “bad” level of a daily average of 35 presented by the MOE in Korea and the U.S. EPA with low fluctuation, i.e., measurements with a deviation of less than 10% of the average outdoor concentration, and this case was adopted for statistical analysis. Moreover, based on the measurement results for OPC-2, which includes average outdoor concentrations below 35 , and OPC-3, which includes outdoor concentration deviations of 10% or more than the average, trends in the measurement results were investigated according to the outdoor concentration conditions.
Table 3.
Measurements classification according to the outdoor PM2.5 concentration (Cout) conditions.
2.4. Regression Analysis
To determine the building factors that have a dominant influence on outdoor infiltration, an analysis of the correlation between the building factors and infiltration factor was performed. Prior to the correlation analysis, tests of normality (the Kolmogorov–Smirnov test and Shapiro–Wilk test) were applied to the measurement data to test the validity of normal distribution between the continuous variables. Subsequently, the Pearson correlation coefficient (r) was calculated to determine the strength of the linear relationship between the variables, and p-values were calculated to evaluate the statistical significance of the relationship between the building factors and outdoor infiltration. For the statistical analysis, we utilized the Statistics and Machine Learning Toolbox in MATLAB. Linear regression analysis was performed with the infiltration factor as the dependent variable to produce an equation that describes the infiltration factor in terms of the dominant building factor that was derived from the correlation results.
2.4.1. Pearson’s Correlation Coefficient
The Pearson’s correlation coefficient is a statistic that quantifies the linear relationship between two variables; the coefficient of correlation () between variables x and y can be calculated using Equation (9). is in the range [−1, 1]: the closer its absolute value is to 1, the stronger the correlation is; if it is greater than 0.7 in absolute value, the correlation is said to be strong. The statistical significance of the correlation can be tested by a t-test, and the correlation can be considered statistically significant when the p-value is less than 0.05.
where is the mean of x, and is the mean of y.
2.4.2. Regression Model
Regression analysis is a method for numerically modeling the relationship between independent and dependent variables and is based on the method of least squares. A model is selected when the sum of the squared residuals between the linear model and the observations is minimized. Regression models have the advantage of being able to quantify the relationship between the independent variables and the dependent variable and facilitate the intuitive interpretation of relationships among factors, making them widely used for the evaluation of explanatory objective variables in existing studies [32,33].
In this study, a regression model was used to evaluate outdoor PM2.5 infiltration based on the selected building factors. To select a suitable model to describe the relationships between the variables, four types of linear regression (linear, log-linear, linear–log, and log–log regression), including log-transformation models that can explain nonlinear relationships between variables based on their log transformation, were conducted. The coefficient of determination (R2) (Equation (9)) was used as an indicator to evaluate the ability of each regression model to explain the measured values. falls in the range [0, 1]; and the closer it is to 1, the better the regression model describes the measurements:
where Yi is the i-th measured value, is the mean of the measured values, and is the i-th predicted value in the regression model.
3. Results and discussion
3.1. Airtightness of Analysis Units
Table 4 presents the airtightness measurements obtained for the analysis units. The ELA was found to range from 8 cm2 to 435 cm2. The infiltration was expected to vary depending on the leakage area, which serves as the infiltration path for under the reference differential pressure condition (4 Pa). The ratio of ELA to the floor area (ELA/FA) was calculated to control for the difference in ELA due to the varying size of the analysis units: it had a range of 0.47 to 7.65 . The average was found to be 7.0 (±3.9) , with a minimum of 1.4 and a maximum of 15.0 , which are similar to the results of previous studies (1.9 and 12.9 , respectively) [34,35,36,37,38] that investigated the of Korean multifamily homes. We found that the leakage classes of the multifamily homes, calculated based on the and NL in the analysis units, include a wide range of airtightness: from A (sufficiently tight) to G (highly leaky).
Table 4.
Airtightness of the analysis units.
3.2. PM2.5 Infiltration Factor
Table 5 presents the results of the infiltration tests in the multifamily homes. The outdoor concentration at steady-state () and indoor concentration at steady-state () were measured to calculate the infiltration factor. The deviation of and was within 5% of the measured mean value, indicating that the steady-state assumption was satisfied in the calculation of the infiltration factor. The infiltration factor was shown to range from 0.31 to 1.12, with an average of 0.71 (± 0.19), under an indoor–outdoor pressure difference of 10 Pa. This suggests that when there is no indoor generating source, the indoor concentration is about 71% of the outdoor concentration. The infiltration factors (0.31 to 1.12) measured in this study were similar to or higher than those found in previous studies [13,16,17], which had an average of 0.55 to 0.66 for residential buildings.
Table 5.
Infiltration test results for multifamily homes.
When analyzing the correlation between and the building factors, the measurement results were classified as OPC-1, OPC-2, or OPC-3 to reflect the level and variability of the outdoor concentration. Three units (Unit 2, 9, 16) were categorized as OPC-2, four units (Unit 6, 10, 19, 22) as OPC-3, and sixteen units (Unit 1, 3, 4, 5, 7, 8, 11, 12, 13, 14, 15, 17, 18, 20, 21, 23) as OPC-1. To avoid the margin of error factor caused by the condition of outdoor concentration when calculating the infiltration factor and to increase the accuracy of the analysis, the measurement results for OPC-1 were used to analyze the correlation between the outdoor infiltration factor and building factors.
Figure 1 shows the distribution of the infiltration factor measurements for the OPC-1 units. The infiltration factor averaged 0.68 ± 0.15 , with a range of 0.36 to 0.91 . To determine whether the infiltration factor measurements are suitable for the analysis of the Pearson’s correlation with the building characteristics, the distribution of the measurements for the units in the OPC-1 category was plotted: the measurements exhibited a roughly linear relationship with the quantiles of the normal distribution (Figure 1b). Tests of normality, namely the Kolmogorov–Smirnov test and Shapiro–Wilk test, were applied to measurements, the results of which are listed in Table 6: both test results confirm that the t-values are within the significance level (p > 0.05) and that there is not sufficient evidence that the infiltration factor measurements of the OPC-1 group do not follow a normal distribution. Accordingly, the measured infiltration factors for the OPC-1 group are judged to be suitable for linear correlation analysis.
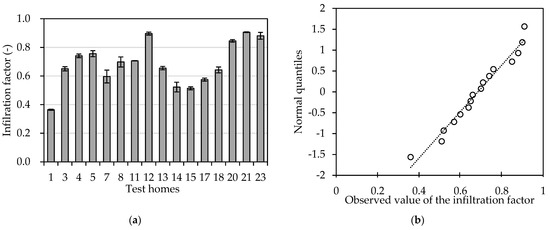
Figure 1.
Distribution of infiltration factor in test homes: (a) infiltration factor for OPC-1 group; (b) Normal Q–Q plot of infiltration factor of the analysis set.
Table 6.
Tests of normality of the infiltration factor.
3.3. Correlation between the PM2.5 Infiltration Factor and Building Factors
Table 7 lists the correlations between the infiltration factor and the building characteristics, and Table 8 ranks the dominant building factors in terms of correlation and statistical significance. The correlation coefficients (r) of the airtightness metrics (, NL, and ELA/FA) and the infiltration factor were 0.701, 0.685, and 0.684, respectively, with p-values of less than 0.01; that is, there was a strong, positive correlation that is statistically significant. The outdoor infiltration is thus proportional to the airtightness of the building, and the relationship between the two can be explained through a linear model. In addition to airtightness, in the order of decreasing strength, the building characteristics found to be highly correlated with the infiltration factor are WA/FA, volume, floor area, construction year, and EWA/FA. WA/FA, volume, and floor area are related to the size of the building and were found to be negatively correlated with the infiltration factor, with coefficients of −0.489, −0.366, and −0.362, respectively. Although the infiltration factor tended to be higher in smaller units, the correlations were not statistically significant (p-value ≥ 0.05). We thus conclude that the negative correlation between building size and infiltration factor is less descriptive of their relationship and that additional data are needed. The year of construction and EWA/FA had low positive correlations with the infiltration factor, and the correlations were not statistically significant. ELA/FA showed a strong, positive correlation with the infiltration factor within statistical significance rather than EWA/FA and WA/FA. This result implies that outdoor infiltration could depend on the leakage area of the building facade which may differ with the materials or construction of the building, rather than the size of the building facades.
Table 7.
Correlation coefficient (r) between the building factors and PM2.5 infiltration.
Table 8.
Ranking of the correlations between the building characteristics and PM2.5 infiltration.
The correlation between the building factors was also calculated: the correlations between the year of construction and the airtightness metrics (ELA/FA, , and NL) were 0.604, 0.561, and 0.598, respectively, i.e., a moderate positive correlation that was statistically significant (p-value < 0.05). This may be attributable to increased airtightness in newly built multifamily homes for the purpose of saving energy. Based on the relationship between airtightness and the year of construction, the correlation between the outdoor infiltration factor and year of construction can be derived without any field tests and can be further investigated through more data collection.
The airtightness metrics (, NL, EL, and ELA/FA) were selected as the dominant factors based on the ranking of the correlations of the building factors with the infiltration factor. To avoid the problem of multicollinearity between the independent variables, , which was found to have the highest correlation among the performance indicators of airtightness with the infiltration factor, was selected as the independent variable for the simple regression model.
3.4. PM 2.5 Infiltration According to
Table 9 shows the results for four kinds of bivariate linear regression of and the infiltration factor. The coefficient of determination () of the linear–log regression model was found to be 0.57, indicating that this model has the highest explanatory power for the measured values. The linear–log model reflects a decreasing trend in the infiltration factor as the airtightness increases; this may explain the upper bound on the infiltration factor ( < 1.0) within the range of observed here. Figure 2 graphically illustrates the linear–log regression model of the infiltration factor according to , utilizing and the infiltration factor for case OPC-1.
Table 9.
Results of regressing the PM2.5 infiltration factor (Fin) on ACH50.
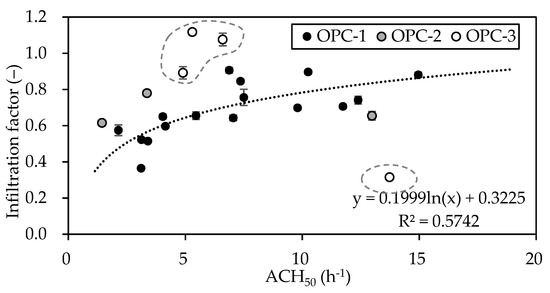
Figure 2.
Results of regressing the PM2.5 infiltration factor on .
To assess the outdoor infiltration of a building according to its airtightness, the airtightness was categorized by leakage class (tight (: 0~5 ), leaky (: 5–10 ), sufficiently leaky (: 10~15 )), as defined in ASHRAE 119. Figure 3 shows the mean and standard deviation of the infiltration factor according to airtightness level. In the tight units (n = 6), the infiltration factor averaged 0.54 (±0.09), and the value estimated by the regression model was 0.56 (±0.04). In leaky units (n = 6), the infiltration factor measurements averaged 0.75 (±0.09), and the estimated value was 0.72 (±0.03). In sufficiently leaky units (n = 4), the infiltration factor averaged 0.81 (±0.08), and the regression model estimate was 0.82 (±0.03). These results indicate that without indoor -generating sources, the concentration in tight multifamily homes may be half the outdoor and that sufficiently leaky units may be vulnerable to outdoor : the indoor concentration due to outdoor infiltration was up to 1.59 times higher in sufficiently leaky homes than in tight homes, suggesting that the indoor exposure risks of outdoor varies depending on the airtightness of the multifamily home.
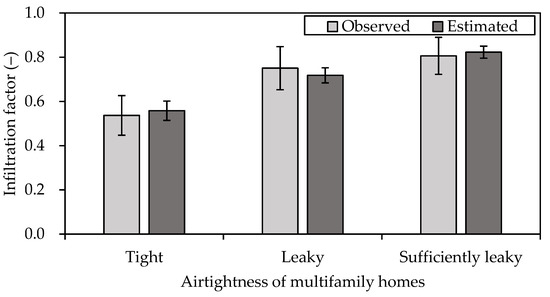
Figure 3.
PM2.5 infiltration factor by airtightness of multifamily homes.
Analysis of the data that were acquired under the OPC-2 and OPC-3 measurement conditions (seven units) was performed to compare the effects of the outdoor conditions. The multifamily homes in OPC-2 ( < 35 ) with a low concentration of outdoor had values of 1.4 to 13.0 and infiltration factors of 0.62 to 0.78. Unlike the differences in the airtightness, there was no significant difference between the infiltration factors in the OPC-2 group. This may be due to the low outdoor concentration and low outdoor-origin indoor concentration: even a small measurement deviation can thus cause relatively large errors when calculating the infiltration factor. The OPC-3 group exhibited a large deviation in the outdoor concentration ( > 10% of ); units in this group had values between 4.9 and 13.7 and infiltration factors between 0.31 and 1.12. We checked the difference in the estimated infiltration factor according to changes in the outdoor concentration. Reductions in the concentration ( > ) tended to be associated with a higher infiltration factor compared to the regression model, while the opposite was true for increasing concentrations ( < ). When the concentration of the outdoor changed significantly, it was found that there was a lag time in the accumulation of the outdoor-origin indoor concentration. The lag time that occurs when outdoor pollutants infiltrate the indoors has been identified through a cross-case analysis in a previous study [39]. Based on the results of this study, additional study on the method to compensate for the impact of outdoor fine dust conditions when conducting infiltration experiments using a blower door is needed.
4. Conclusions
The purpose of this study was to evaluate outdoor infiltration into multifamily homes in Korea according to the building characteristics utilizing a field test and a regression model. The infiltration test was conducted using the blower-door depressurization procedure, and correlation analysis was used to identify the dominant building factors associated with the infiltration of outdoor . A regression model for estimating the infiltration factor based on the ACH50 airtightness index was proposed. The key results of this study are as follows:
- The infiltration analysis was conducted for 23 target units in Korea, and the effective measurement of the infiltration factor for 23 homes was 0.71 (±0.19).
- Analysis of the correlation between building characteristics and the infiltration factor showed that , ELA/FA, and NL had a statistically significant (p < 0.05), strong positive correlation (r = 0.701, 0.685, 0.684) with the infiltration factor.
- Based on the correlation analysis, was selected as the dominant predictor for infiltration, and a regression model (0.57) was developed to explain the infiltration rate by the index: = 0.1999 ln() + 0.3225.
- The analysis of the infiltration rate according to the leakage class confirmed that the concentration of outdoor-origin in sufficiently leaky units can be up to 1.59 times higher than that in tight units.
We presented the infiltration factor for the estimation of the outdoor infiltration in multifamily homes in Korea and selected as the dominant building factor for predicting the infiltration of outdoor . These results are potentially useful for indoor exposure assessments and control measures against outdoor infiltration based on the airtightness performance of domestic multifamily homes. Although this study targets Korean multifamily homes, the results could be used to estimate the outdoor infiltration into homes with reinforced concrete structures which have similar characteristics. The results are also expected to be used for the calculation of dust removal loads to establish system operating strategies aimed at maintaining proper indoor air quality. As the behavior of the particles differs according to the size fraction [40,41], fine and ultrafine particles could interact differently with building characteristics. Accordingly, the study on the relationship between size-resolved particles and building factors can be conducted in future research based on the results of this study.
Author Contributions
Conceptualization, D.H.K. and D.H.C.; methodology, B.R.P.; validation, B.R.P. and Y.S.E.; investigation, B.R.P. and Y.S.E.; writing—original draft preparation, B.R.P. and Y.S.E.; writing—review and editing, D.H.K. and D.H.C.; visualization, B.R.P.; supervision, D.H.K. All authors have read and agreed to the published version of the manuscript.
Funding
This research was supported by the National Research Foundation of Korea (NRF) grant funded by the Korea government (MSIP) (NRF-2017R1C1B2011561) and by the Basic Science Research Program through the NRF funded by the Ministry of Education (NRF-2018R1D1A1B07050503).
Conflicts of Interest
The authors declare no conflict of interest.
References
- Brook, R.D.; Rajagopalan, S.; Pope, C.A., 3rd; Brook, J.R.; Bhantnagar, A.; Luepker, R.V.; Mitteleman, M.A.; Peters, A.; Siscovick, D.; Simth, S.C.; et al. Particulate matter air pollution and cardiovascular disease: An update to the scientific statement from the American Heart Association. Circulation 2010, 121, 2311–2378. [Google Scholar] [CrossRef]
- Kim, I.S.; Jang, J.Y.; Kim, T.H.; Park, J.; Shim, J.; Kim, J.B.; Byun, Y.S.; Sung, J.H.; Yoon, T.W.; Kim, J.Y.; et al. Guidelines for the prevention and management of cardiovascular disease associated with fine dust/Asian dust exposure. J. Korean Med. Assoc. 2015, 58, 1044–1059. [Google Scholar] [CrossRef]
- The State Council of the People’s Republic of China. Air Pollution Prevention and Control Action Plan. Available online: http://www.gov.cn/zwgk/2013-09/12/contenst_2486773.htm (accessed on 30 December 2020).
- Liu, D.L.; Nazaroff, W.W. Particle penetration through building cracks. Aerosol Sci. Technol. 2003, 37, 563–573. [Google Scholar] [CrossRef]
- Chen, C.; Zhao, B. Review of relationship between indoor and outdoor particles: I/O ratio, infiltration factor and penetration factor. Atmos. Environ. 2011, 45, 275–288. [Google Scholar] [CrossRef]
- Long, C.; Suh, H.; Kobzik, L.; Catalano, P.; Ning, Y. A pilot investigation of the relative toxicity of indoor and outdoor fine particles: Invitro effects of endotoxin and other particulate properties. Environ. Health Perspect. 2001, 109, 1019–1026. [Google Scholar] [CrossRef]
- Wilson, W.; Brauer, M. Estimation of ambient and non-ambient components of particulate matter exposure from a personal monitoring panel study. J. Expo. Sci. Environ. Epidemiol. 2006, 16, 264–274. [Google Scholar] [CrossRef]
- Ebelt, S.T.; Wilson, W.E.; Brauer, M. Exposure to ambient and nonambient components of particulate matter: A comparison of health effects. Epidemiology 2005, 16, 227–250. [Google Scholar] [CrossRef] [PubMed]
- Clyaton, C.A.; Perritt, R.L.; Pellizzari, E.D.; Thomas, K.W.; Whitmore, R.W.; Wallace, L.A.; Ozkaynak, H.; Spengler, J.D. Particle total exposure assessment methodology (PTEAM) study: Distributions of aerosol and elemental concentrations in personal, indoor, and outdoor air samples in a southern California community. J. Expo. Anal. Environ. Epidemiol. 1993, 3, 227–250. [Google Scholar]
- Fisher, P.H.; Hoek, G.; van Reeuwijk, H.; Briggs, D.J.; Lebret, E.; van Wijnen, J.H.; Kingham, S.; Elliott, P.E. Traffic-related differences in outdoor and indoor concentrations of particles and volatile organic compounds in Amsterdam. Atmos. Environ. 2000, 34, 3713–3722. [Google Scholar] [CrossRef]
- Chao, C.Y.H.; Tung, T.C. An empirical model for outdoor contaminant transmission into residential buildings and experimental verification. Atmos. Environ. 2001, 35, 1585–1596. [Google Scholar] [CrossRef]
- Liu, L.J.S.; Box, M.; Kalman, D.; Kaufman, J.; Koenig, J.; Larson, T.; Lumley, T.; Sheppard, L.; Wallace, L. Exposure assessment of particulate matter for susceptible populations in Seattle. Environ. Health Perspect. 2003, 111, 909–918. [Google Scholar] [CrossRef]
- Lachenmyer, C.; Hidy, G.M. Urban measurements of outdoor-indoor PM2.5 concentrations and personal exposure in the Deep South. Part 1. Pilot study of mass concentrations for nonsmoking subjects. Aerosol Sci. Technol. 2000, 32, 34–51. [Google Scholar] [CrossRef]
- Landis, M.S.; Norris, G.A.; Williams, R.W.; Weinstein, J.P. Personal exposures to PM2.5 mass and trace elements in Baltimore, MD, USA. Atmos. Environ. 2001, 35, 6511–6524. [Google Scholar] [CrossRef]
- Williams, R.; Suggs, J.; Rea, A.; Sheldon, L.; Rodes, C.; Thronburg, J. The research Triangle Park particulate matter panel study: Modeling ambient source contribution to personal and residential PM mass concentrations. Atmos. Environ. 2003, 37, 5365–5378. [Google Scholar] [CrossRef]
- Wallace, L.; Williams, R. Use of personal-indoor-outdoor sulfur concentrations to estimate the infiltration factor and outdoor exposure factor for individual homes and persons. Environ. Sci. Technol. 2005, 39, 1707–1714. [Google Scholar] [CrossRef]
- Meng, Q.Y.; Spector, D.; Colome, S.; Turpin, B. Determinants of indoor and personal exposure to PM2.5 of indoor and outdoor origin during the RIOPA study. Atmos. Environ. 2009, 43, 5750–5758. [Google Scholar] [CrossRef] [PubMed]
- Choi, D.H.; Kang, D.H. Infiltration of ambient PM2.5 through building envelope in apartment housing units in Korea. Aerosol Air Qual. Res. 2017, 17, 598–607. [Google Scholar] [CrossRef]
- Chen, Z.; Chen, C.; Wei, S.; Wu, Y.; Wang, Y.; Wan, Y. Impact of the external window crack structure on indoor PM2.5 mass concentration. Build. Environ. 2016, 108, 240–251. [Google Scholar] [CrossRef]
- MacNeill, M.; Wallace, L.; Kearney, J.; Allen, R.W.; Van Ryswyk, K.; Judek, S.; Xu, X.; Wheeler, A. Factors influencing variability in the infiltration of PM2.5 mass and its components. Atmos. Environ. 2012, 37, 518–532. [Google Scholar] [CrossRef]
- Han, Y.; Qi, M.; Chen, Y.; Shen, H.; Liu, J.; Huang, Y.; Chen, H.; Liu, W.; Wang, X.; Liu, J.; et al. Influence of ambient air PM2.5 concentration and meteorological condition on the indoor PM2.5 concentrations in a residential apartment in Beijing using a new approach. Environ. Pollut. 2015, 205, 307–314. [Google Scholar] [CrossRef]
- Stephens, B.; Siegel, J.A. Penetration of ambient submicron particles into single-family residences and associations with building characteristics. Indoor Air 2012, 22, 501–513. [Google Scholar] [CrossRef]
- Population and Housing Census. Available online: http://www.census.go.kr/dat/ysr/ysrList.do?q_menu=6&q_sub=3 (accessed on 30 December 2020).
- Choi, D.H.; Kang, D.H. Indoor/outdoor relationships of airborne particles under controlled pressure difference across the building envelope in Korean multifamily apartments. Sustainability 2018, 10, 4074. [Google Scholar] [CrossRef]
- ISO. ISO 9972. Thermal Performance of Buildings-Determination of air Permeability of Buildings-Fan Pressurization Method; International Standard Organization: Geneva, Switzerland, 2015. [Google Scholar]
- ASHRAE. ANSI/ASHRAE Standard 119: Air Leakage Performance for Detached Single-Family Residential Buildings; American Society of Heating, Refrigerating & Air Conditioning Engineers: Atlanta, GA, USA, 1998. [Google Scholar]
- Walker, I.S.; Sherman, M.H.; Joh, J.; Chan, W.R. Applying Large datasets to developing a better understanding of air leakage measurement in homes. Int. J. Vent. 2013, 11, 323–337. [Google Scholar]
- Kalamees, T.; Kurnitski, J.; Jokisalo, J.; Eskola, L.; Jokiranta, K.; Vinha, J. Measured and simulated air pressure conditions in Finnish residential buildings. Build. Serv. Eng. Res. Technol. 2010, 31, 177–190. [Google Scholar] [CrossRef]
- Jo, J.H.; Lim, J.H.; Song, S.Y.; Yeo, M.S.; Kim, K.W. Characteristics of pressure distribution and solution to the problems caused by stack effect in high-rise residential buildings. Build. Environ. 2007, 42, 263–277. [Google Scholar] [CrossRef]
- Huang, L.; Hopke, P.K.; Zhao, W.; Li, M. Determinants on ambient PM2.5 infiltration in non-heating season for urban residences in Beijing: Building characteristics, interior surface covering and human behavior. Atmos. Pollut. Res. 2015, 6, 1046–1054. [Google Scholar] [CrossRef]
- Shi, Y.; Li, X.; Li, H. A new method to assess infiltration rates in large shopping centers. Build. Environ. 2017, 119, 140–152. [Google Scholar] [CrossRef]
- Li, Z.; Tong, X.; Ho, J.M.W.; Kwok, T.C.Y.; Dong, G.; Ho, K.; Yim, S.H.L. A practical framework for predicting residential indoor PM2.5 concentration using land-use regression and machine learning methods. Chemosphere 2021, 265, 129140. [Google Scholar] [CrossRef]
- Hauri, D.D.; Huss, A.; Zimmermann, F.; Kuehni, C.E.; Roosli, M. A prediction model for assessing residential radon concentration in Switzerland. J. Environ. Radioact. 2012, 112, 83–89. [Google Scholar] [CrossRef]
- Won, G.H.; Huh, J.H. Airtightness evaluation of apartments based on their deterioration length. In Proceedings of the Society of Air-Conditioning and Refrigerating Engineers of Korea, Seoul, Korea, 21 November 2002; pp. 508–513. [Google Scholar]
- Kwon, O.H.; Kim, J.H.; Kim, M.H.; Seok, Y.J.; Jeong, J.W. Case study of residential building air tightness in Korea based on blower door test approach. J. Archit. Inst. Korea Plan. Des. 2010, 26, 303–310. [Google Scholar]
- Jo, J.H. Measurements of the dwelling unit airtightness in high-rise residential buildings. J. Archit. Inst. Korea Plan. Des. 2010, 26, 337–344. [Google Scholar]
- Yoon, J.O. Field Measurement of infiltration in new apartments using de-pressurization method. Korea Inst. Ecol. Archit. Environ. J. 2013, 13, 27–32. [Google Scholar]
- Lee, S.I.; Kim, J.G.; Kim, S.H.; Kim, J.H.; Jeong, H.G.; Jang, C.Y. An analysis of the airtightness performance and heating energy demand according to building structural characteristics. Korea Inst. Ecol. Archit. Environ. J. 2015, 15, 109–115. [Google Scholar]
- Eisner, A.D.; Richmond-Bryant, J.; Hagn, I.; Drake-Richman, Z.; Brixey, L.A.; Wiener, R.W.; Ellenson, W.D. Analysis of indoor air pollution trends and characterization of infiltration delay time using a cross-correlation method. J. Environ. Monit. 2009, 11, 2201–2206. [Google Scholar] [CrossRef]
- Albuquerque, P.C.; Gomes, J.F.; Bordado, J.C. Assessment of exposure to airborne ultrafine particles in the urban environment of Lisbon, Portugal. J. Air Waste Manag. Assoc. 2012, 62, 373–380. [Google Scholar] [CrossRef] [PubMed]
- Bordado, J.C.; Gomes, J.F.; Albuquerque, P.C. Exposure to airborne ultrafine particles from cooking in Portuguese homes. J. Air Waste Manag. Assoc. 2012, 62, 1116–1126. [Google Scholar] [CrossRef]


Publisher’s Note: MDPI stays neutral with regard to jurisdictional claims in published maps and institutional affiliations. |
© 2021 by the authors. Licensee MDPI, Basel, Switzerland. This article is an open access article distributed under the terms and conditions of the Creative Commons Attribution (CC BY) license (https://creativecommons.org/licenses/by/4.0/).