Abstract
Online marketplaces enable cooperation between potential stakeholders by supporting offer and demand identification at the secondary raw material markets. The use of marketplaces facilitates communication between supply chain actors operating within the same or different industry sectors and enables detection of ways to close the loop of their products. This research investigated which criteria to use for the circular cooperation matching of companies in the context of a marketplace. These criteria were used for the development of a circular economy (CE) matchmaking framework based on a multi-level approach and relevance scoring between the users. The multi-level approach is based on the following criteria: (i) the compliance with circular economy principles, (ii) the material flows analysis, (iii) the greenhouse gas (GHG) emissions from transport. Based on those aspects a Total Relevance Score (TRS) between the stakeholders is calculated. The Total Relevance Score indicates the possibility for successful circular cooperation between two partners who are willing to close their loops with the best possible match. The logic behind the proposed circular economy matchmaking framework is illustrated by four cases using data collected from companies. Recommendations for further deployment are proposed. The developed framework, by incorporating circular economy principles for the first time within the matching algorithm, provides the opportunity for interested stakeholders for more tailored matching and increases their possibilities of finding a perfect match on the secondary raw materials market in terms of circularity. A similar approach has not yet been reported in the literature. The circular economy matchmaking framework constitutes a theoretical basis of an online marketplace to be developed.
1. Introduction
Circular economy (CE) is a popular concept that has gained attention from both public and private sector stakeholders during recent years. More than 100 definitions of the term “circular economy” have been proposed [1]. In this work, the phrase “circular economy” is used as defined by Ellen MacArthur Foundation (EMF), i.e., an “economy that is restorative and regenerative at the same time” [2] and that relies on three main concepts, namely “(i) designing out waste and pollution, (ii) keeping products and materials in use, and iii) regenerating natural systems” [2]. The Circular Economy Action Plan [3], recently adopted by the European Commission (EC), embodies these principles. The document’s goal is to propel the transition towards the circular economy, as described in the European Green Deal [4]. Within the Circular Economy Action Plan, the interrelated strategies for fast-tracking the transition are presented. The described strategies encourage acting throughout the entire life cycle of products, with special emphasis on sectors where circular transition is most likely to occur and, at the same time, where the actions are much needed due to high use of resources. The presented concepts involve sustainable design and endorsing circularity in production processes, encouraging sustainable consumption and keeping products and materials in use. This consistently leads to waste reduction. At the same time, measures for enhancing the role of the consumer, by assuring their right to credible information and the “right to repair”, are also presented therein [3]. The circular economy is linked to the Sustainable Development Goals (SDGs) of the United Nations [5]. Circular economy actions can be considered tools for confronting the challenges described by SDGs with special attention to the goals covering topics such as water (SDG 6), energy (SDG 7), economic growth (SDG 8), sustainable consumption (SDG 12), and land (SDG 15) [6].
The attempts for circular economy implementation have been reported and analyzed for diverse sectors and industries [7,8,9,10]. At the same time, the transition from a linear to a circular economy sets expectations on the private stakeholders. On the other hand, it has been shown that many private stakeholders are willing to undertake actions related to circular economy application, allowing them to be perceived as eco-friendly by their customers [11]. This involves, among others, the need for the implementation of green supply chain practices within their strategy [12]. Diverse digital technologies have huge potential to increase the readiness for the economical shift and support the new circular economy business models at all the stages [3,13,14]. Using digital tools increases supply chain resilience in case of, e.g., disruption in supply chains, which are especially difficult to handle [15,16]. Sharing platforms, including online marketplaces, are among the circular economy business models discussed by the Finnish Innovation Fund SITRA and relevant partners in their Circular Economy Playbooks for the chemical [17] and for the manufacturing industries [18]. By offering solutions on how to manage the generated waste, the use of the marketplace can contribute to externality reduction, which is in line with the EMF’s CE principles [19].
Tools and concepts explaining and supporting the relatively new circular economy paradigm are in demand [20]. Matchmaking tools, such as marketplaces or industrial symbiosis (IS) platforms, enable the interactions between supply chain actors acting as collaboration facilitators and support the interested stakeholders in finding ways to close the loop of their products and the right partners for waste-to-resource exchanges. Therefore, marketplaces are envisioned as the type of tools that can support circular economy actions [21]. A significant number of matchmaking platforms can be found online or have been reported in scientific literature [22]. In light of circular cooperation, an enhancement of those tools is necessary. One of the possible enrichments is incorporation of circular economy related criteria within the matching algorithm, as proposed in this manuscript. The aim of this research was to define the criteria to be used for circular cooperation matching of companies that form a basis of a CE matchmaking framework. The framework will be deployed at a later stage to an online CE marketplace. The developed framework is based on a multi-level approach defined by the selected criteria: (i) compliance with CE principles, (ii) material flows, and (iii) greenhouse gas (GHG) emissions deriving from secondary raw material transport between the stakeholders’ warehouses. Taking into account those criteria, a relevance score between different marketplace users is calculated allowing evaluation of possibilities for cooperation. The relevance score approach allows the interested actors to close the loop of their products with the best available match in terms of circularity. The CE matchmaking framework is a novel concept that allows tailored matching under the circular economy umbrella concept, which has not yet been explored.
2. Methodology
Figure 1 visualizes the conceptual framework that was used in this study. Firstly, a detailed literature review was performed. This resulted in identifying a research gap in relation to the inclusion of circular economy principles within matchmaking algorithms used in secondary raw material marketplaces. The aim of this research was to address the gap by selecting criteria to be used within the CE matchmaking framework. The criteria are defined based on a further literature review of both scientific literature in peer reviewed journals and grey literature. This was followed by the CE matchmaking framework design.
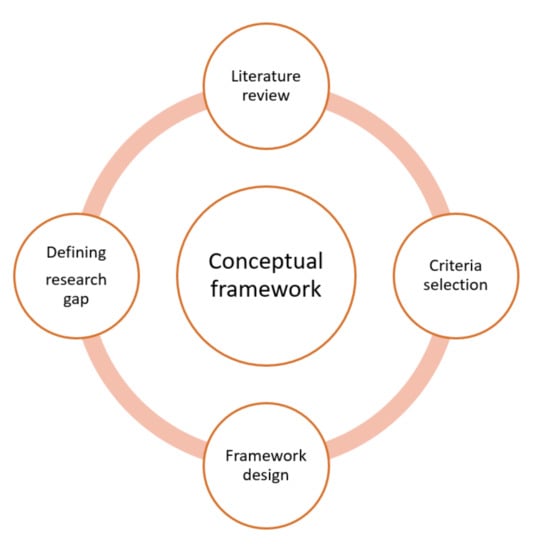
Figure 1.
Conceptual framework for the circular economy (CE) matchmaking framework design.
Having defined the need for a marketplace that would incorporate the CE principles within the matching logic, the following research question was formulated: Which criteria should be used for the circular matching of companies in the context of a marketplace, and how can they be incorporated in the CE matchmaking framework? The research objectives were therefore a) to identify the criteria to be used for circular matchmaking of companies and b) to design the CE matchmaking framework and incorporate the criteria within the framework. The research was designed as presented in Figure 2. The following steps were taken in order to address the research question: (i) literature review, (ii) criteria selection, (iii) CE matchmaking framework design, (iv) application of the framework to cases, (v) formulation of conclusions and identification of further research recommendations related to the CE matchmaking framework implementation.
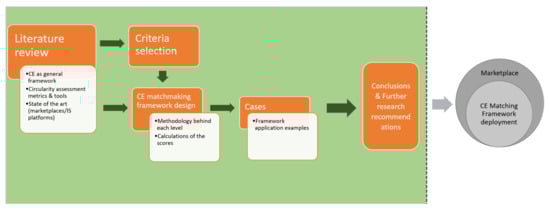
Figure 2.
Research design (part marked in grey is beyond the scope of this manuscript).
The literature review was performed in the context of circular economy and marketplaces. To obtain a frame of reference of the research context and to cover the objectives of the study, special focus was given to the following topics: (i) circular collaboration, (ii) circularity metrics and methodologies behind circularity measurement tools, (iii) state of the art. The literature study forms a theoretical background for the criteria selection. Chosen criteria constitute the basis of the multi-level approach, in which companies are matched. The methodology behind each level was developed and score calculations established. The CE matchmaking framework application examples are presented in four hypothetical cases. The cases are based on primary data obtained from companies through surveys and personal communication and clearly stated assumptions where the data are not sufficient. Using obtained data several company profiles were created. The created profiles were used to design hypothetical cases illustrating the logic behind different elements of the framework. At the final stage of the research, conclusions were drawn, and recommendations for further research and implementation of the concept into online marketplace were developed.
3. Literature Review
In order to address the research questions and objectives, a literature review on the circular economy and marketplaces was performed with special focus on (i) circular collaboration, (ii) circularity metrics and methodologies behind circularity measurement tools, (iii) state of the art. In the search for the criteria to be selected for CE matchmaking of companies, the specificity of circular collaboration of companies had to be taken into account. Circularity tools and metrics provided valuable inspiration for the design of the framework but with the consideration of the differences between circularity assessment and circularity cooperation. Stateoftheart study gives an insight into similar initiatives.
3.1. Circular Economy Context
Partnership and collaboration are considered key enablers of circular economy [23]. Bocken et al., (2016) in the scope of the business model strategy framework mention the importance of collaboration and collaborative agreements in the context of two business model strategies for closing the loops: “extending resource value” and “industrial symbiosis” and for slowing the loops: “extending product value” [20]. Successful CE transition requires participation of all the actors and their ability to network and form collaborations and exchange models [24]. González-Sánchez et al. (2020) suggest that in the circular supply chains, the right partnerships not only improve environmental and economic performance but also that the circular supply chains are established with greater intensity. The need for greater relational capacity arises [25]. Maranesi and De Giovanni discuss the crucial role of relationship in CE synergies and go one step further by highlighting the need for supply chain partners to demonstrate the same approach towards circularity [26]. The authors point out that in the search for adequate business partners, companies might be introducing specialized selection protocols, use evaluation systems or networking platforms such as the TenP Sustainable Supply Chain Self-Assessment Platform [27]. Migliore et al. (2020) mention possible applications of a marketplace, one of them being its utilization as an instrument for initiating industrial symbiosis or CE cluster collaborations [28], which have the capacity to accelerate the circular transition [29]. Marketplaces have the potential to serve as a powerful tools for CE clusters and industrial symbioses by supporting exchanges mainly at regional level [30]. All of these studiesindicate the importance of cooperation and relational dimension when analyzing circular economy transactions. In creating CE cooperation the tightest possible loops should be aimed at. The tighter the loop, the less product needs to be transformed and the faster it circulates back on the market. Tighter loops require fewer resources, less labor and energy, etc., at the same time allowing for more material and retained value preservation [31].
3.2. Circularity Tools and Circularity Metrics
In 2020 two new tools for circularity assessment at the company level were released. Those tools have the potential to close the gap of the assessment of CE strategies at micro level described by Elia et al. (2017) [32]. Both Circulytics from the EMF [33] and the World Business Council for Sustainable Development (WBCSD) Circular Transition Indicators (CTI) framework, which was developed into an online tool in partnership with Circular IQ [34], aim at facilitating companies’ shift to circular economy and support benefiting from the opportunities that arise. The importance of the assessments offered by these tools is reflected by the number of registered business accounts. Circulytics reported that 604 companies have signed up during the period of 8 months from January 2020, when the tool was launched, to August 2020 [35]. WBCSD announced in April 2021 that the CTI tool, one year after its launch, has reached 1000 active accounts [36]. Both tools are developed in cooperation with companies. The latest version of Circulytics (Circulytics 2.0) was released in October 2020. The evaluation is a third-party assessment, based on a single score and two categories of indicators: Outcomes and Enablers. The assessment takes into account the type of industry and material flows. The Outcomes category represents the current state of a business’s circularity, while the Enablers category reflects the aspects that make the change possible by indicating where possibilities for improvement are located. Indicators belonging to the Enablers category are obtained based on the company’s answers to a set of questions, which are divided into five themes. Circulytics themes reflect the steps a company has to follow in order to become circular, starting from the development of a strategy and then pursuing steps for its application. The Outcome indicators concern materials recylculation, services, assets, finance, water, and energy with adjustments based on the type of business [37].
By using the CTI self-assessment tool, companies can assess and monitor the circularity of a product line, business unit, site location, or the business as a whole. The focal point is the analysis of the circular and linear mass flows of the company. The transition to renewable energy is also considered, while the circularity of freshwater was included in the framework in the latest version of the tool (V2.0). This approach, in combination with optional indicators, allows an in-depth analysis of a company’s status in terms of circularity as well as planning actions for progress in circular transition [38].
The Material Circularity Indicator (MCI) is a tool developed by the EMF and Ansys Granta based on the methodology for identifying product and material circularity in relation to flows, which can be extended to a company’s circularity [39]. Circularity Check, a tool for product or service circularity measurement, is targeted at SMEs and other companies and is based on 60 questions about practices related to design, delivery, use, recovery, and sustainability with an output in a form of the percentage of circularity [40]. Discussed tools for businesses’ circularity focus either on analysis of flows (CTI, MCI), circular practices and strategy related aspects (Circularity Check), or both (Circulytics).
The importance of defining circularity metrics is also clearly noticeable in the scientific literature. Establishing a circularity measure was defined as a first step in the transition process from a linear to a circular economy [41]. The importance of the assessment of the actions related to the implementation of a CE model is emphasized by Elia et al. (2017) [32]. De Pascale at al. (2020) state that “indicators can be considered as measures of “circularity’s evolution”” [42]. The need for keeping track of the progress in the transition to a CE is also visible in the actions of the EC, which has developed the CE monitoring framework [43] and is emphasizing the need for its revision in the Circular Economy Action Plan [3]. The framework currently consists of 10 indicators organized into four thematic domains: “(1) production and consumption, (2) waste management, (3) secondary raw materials, and 4) competitiveness and innovation” [43]. The importance of the metrics for measuring the circularity is also mirrored by the significant number of indicators that have been reported in the literature and the efforts for their classification [32,42,44,45]. Despite the abundance of circularity indicators, the lack of a commonly recognized measurement system poses a potential difficulty in making a choice on which one to apply in the research [46].
The tools and indices discussed in this section are designed to assess circularity at different levels. They provide valuable insight for the CE matchmaking framework design. However, the aim of the CE matchmaking framework is not the assessment of the level of circularity of a stakeholder but evaluation of possible cooperation for secondary materials market in terms of circular economy. Therefore, the CE matchmaking framework, although related to circularity assessment, is a separate and novel concept designed with a different intention in relation to tools analyzed in this section.
3.3. State of the Art
The Circular Economy Action Plan aims at assuring that the EU establishes an effectively operating internal market for secondary raw materials and encourages the development of innovative solutions that take the advantage of the potential offered by digital technologies. Given these two factors, it can be expected that the need for digital tools that enable collaboration and communication across the supply chain and within different sectors will increase. Secondary raw material marketplaces and IS platforms facilitate contact between stakeholders and lead to successful CE cooperation between the users by creating the missing connection between supply and demand. The waste, a by-product, a result of overproduction or a faulty product, may be of no or little value to one stakeholder but could serve as a resource or process material for another actor. By means of a matching tool, a connection between such potential business partners can be established. As a result, products and materials are kept in use. Such initiatives have been developed during recent years around the world and applied across a variety of sectors often within the industrial setting. Some examples include the SWAN platform operating in the Balkan and Mediterranean region [47]; E-Simbioza, a tool for engagement in industrial symbiosis (IS) in Slovenia [48]; SymbioSys, a tool tested on 25 companies in Northern Spain from different industrial sectors [49]; eSymbiosis, which was validated with data from Viotia region in Greece [50,51,52]; a platform for industrial waste in the region of Western Macedonia, Greece [53]; the first IS platform in Italy applied in Sicily [54,55]; a collaboration platform implemented in food waste case study in Singapore [56]; a platform connecting process industries producing saline wastewater with those that utilize the technological treatment for salt extraction from that wastewater [57]; and a marketplace framework for the construction sector [28,58]. Most of the marketplaces are discussed in the context of industrial symbiosis or eco-industrial parks (EIPs) [59,60,61,62,63,64]. Some tools are based on more than one matching criterion. An example is the algorithm based on pillars such as material type, quantity, and quality parameters as well as geographic location presented by Bakogianni et al. (2019) [57]. The SWAN platform incorporates several matching steps in the matching methodology [47]. Some tools also consider indirect matches, enabling the identification of collaboration opportunities that are not obvious [50,65,66]. The most common method of listing presentation is a list of technically feasible matches being returned. Another approach is by implementing the relevance score between the users. The ESymbiosis matching algorithm uses a similarity measure based on explicit and tacit knowledge [66]. In i-Symbiosis, the synergies are rejected if the relevance rate is lower than 60% [67]. Bakogianni et al. (2019) [57] used matching rates indicating the level of compatibility between offered and requested material.
Attempts at marketplace classification have been reported in the literature. Capelleveen et al. (2018) propose a classification framework for tools that enable retrieval of IS possibilities [68]. Kosmol and Leys (2020) examine different tools and categorize them based on aspects such as: form of research, means of collaboration type, platform type, and platform components [22]. Additionally, several reviews and assessments of existing IT tools for industrial symbiosis are available, e.g., by Grant et al. (2010) [69], Maqbool et al. (2018) [70], and Yeo et al. (2019) [71].
A number of attempts to incorporate environmental assessment in matching tools was reported in the literature. Some examples include use of environmental metrics [51,65] or integration of the IS-Life Cycle Assessment (LCA) engine in the matching algorithm [72] as well as different LCA approaches applied to forest IS located in Finland [73], followed by guidelines for conducting LCA on IS systems [74,75]. The environmental performance of several IS complexes, e.g., Kalundborg (Denmark) [76] and Kawasaki [77], was assessed using different methods. In the case of online marketplaces, as in the case of e-commerce in general, one of the environmental concerns is the pollution resulting from the transportation of exchanged materials [78,79].
4. Criteria Selection
Online marketplaces facilitate the identification of supply and demand and therefore are practical tools for secondary material markets. They are seen as synergy facilitators in the context of circular economy. Existing marketplaces, though conceptually complying with CE principles, in many ways still follow the linear economy laws of supply and demand. Concepts related to circular economy such as the relational dimension, collaborations, and loop tightness, although very relevant for creating synergies in the context of marketplace and circular economy, are not taken into account. The need for advancement of those tools in the spirit of the CE arises. In order to address that challenge, a CE matchmaking framework for implementation into a marketplace algorithm is proposed. The circular economy was used as a context. Based on the literature research, several aspects for consideration in terms of circular matching and marketplace were identified, with some of them being a consequence of the marketplace’s nature (e.g., supply/demand), while others were related to the CE principles. When defining the criteria to be included in the CE matching framework, the following aspects were taken into account: collaboration as a CE enabler, loop tightness, supply and demand, and environmental impact. A multi-level approach was chosen to address all the defined aspects and to assure the flexibility of adding additional aspects in the future, if needed. The following criteria encompassing the defined aspects are proposed as a multi-level approach within the matchmaking framework: (i) compliance with CE principles, (ii) material flows with special attention to loop tightness and matches directness, (iii) GHG emissions deriving from secondary raw material transport between the stakeholders’ warehouses. The process of criteria selection is described in Figure 3.
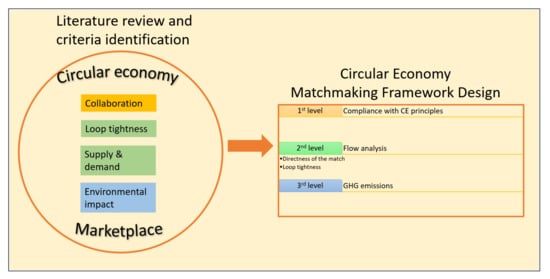
Figure 3.
Logic behind criteria selection for CE matchmaking framework.
The first level of the multi-level approach reflects the degree of proximity between stakeholders in terms of compliance with CE principles. It is based on a questionnaire. The answers provided by the marketplace users are compared against answers provided by other users. By including that criterion within the matching algorithm, the importance of suitable partnerships is taken into account, and the collaboration as an enabler for CE is considered. The second level approach concerns the analysis of a company’s material flows. Inclusion of the flow analysis within the marketplace algorithm is self-explanatory as materials are the basis of the exchanges. In the context of the circular marketplace matchmaking, two aspects seem to be of major importance when it comes to flow analysis: whether the match is direct or indirect and the tightness of the potential loop. A tangible environmental impact related to the operation of the online waste-to-resource marketplace seems to be the pollution related to transportation of the material between the users, which constitutes the third-level approach within the matchmaking framework. It is considered in the form of GHG emissions.
5. Matchmaking Framework Design and Methodology
In this section the overall description of the CE matchmaking framework is presented, as well as methodology behind each element of the framework. The developed CE matchmaking framework is based on a multi-level approach and relevance scoring between users being potential partners for cooperation. By using a multi-level approach, the criteria that are needed for the circular cooperation matching of stakeholders in the context of a marketplace are taken into account. A relevance subscore between the users is calculated at each level. The subscores from all the levels are combined into Total Relevance Score (TRS). The TRS reflects the possibility of two companies for successful CE collaboration.
The CE matchmaking framework design is presented in Figure 4. The framework is based on a multi-level approach with following levels: (i) compliance with CE principles, (ii) flow analysis with special attention to the loop tightness and matches directness, and (iii) GHG emissions. Relevance subscores A, B, and C are obtained at every level (i), (ii), and (iii), respectively, and further transformed into the Total Relevance Score between the users based on the following equation:
TRS (%) = (α*A + β*B + γ*C) * 100 %
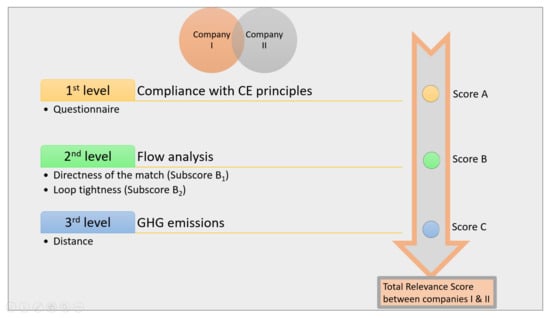
Figure 4.
CE matchmaking framework design.
Subscore A reflects the similarity of two companies in terms of the level of implementation of circularity. Subscore B describes how circular potential matches between two companies are, based on the directness and the type of resulting cooperation. Subscore C is related to the distance between two companies, which is translated to GHG emissions released while transporting the material between marketplace users. Subscore B consists of two subscores B1 and B2:
where Β1 stands for directness of the match and Β2 reflects the tightness of the loop. The logic behind the subscores B1 and B2 is further described in Section 5.2.1 and Section 5.2.2, respectively.
B = (Β1 + Β2)/2
The metrics α, β, γ are introduced in Equation (1) in order to differentiate the importance of the levels and respective subscores A, B, and C. The importance of each criteria is adjusted based on the setup, in which the marketplace operates. For example, if the method is applied within regional IS, where all the users are located in the vicinity of each other, the metric γ is of minor importance, and the equation can be adjusted accordingly. On the other hand, if the marketplace is used on a country level, then the needs change, and metric γ becomes of major importance. Similarly, if there is an interest in promoting “like-minded” cooperation, i.e., at similar CE maturity level, more importance can be assigned to the first level—compliance with CE principles.
The listings are obtained based on the TRS, following the logic that the higher the Total Relevance Score two companies obtain, the better their cooperation will be in terms of circularity. By incorporating the CE principles within the matching algorithm, the concept offers more tailored matchmaking and therefore more customized networking, favoring the application of the CE.
The matching framework supports materials exchange only, with the possibility for further future extension to water and energy exchanges.
The logic and methodology behind each level of the matchmaking framework is presented in detail in following sections.
5.1. Compliance with CE Principles
The first level match is based on a questionnaire to be answered by each framework user. The questionnaire consists of a set of questions related to the company’s circular actions. The questions correspond to Enablers category themes of Cyrculytics reflecting the path that a company has to follow in order to become circular. For each theme one to three relevant questions were developed forming a questionnaire of nine questions presented in Table 1. The potential users of the marketplace are asked to answer each question by choosing one out of the four possible answers: (1) our organization is not involved in this practice, (2) our organization engages in this practice at ad hoc levels, (3) our organization is beginning to engage in this practice in a more systematic way, (4) this practice is well embedded in our organization. Qualitative answers were used, as described by Bertels (2014) [80], with one additional response option. By choosing between the four maturity levels, the user is forced to form a clear opinion on the CE practices of their company. As in the case of the Likert scale used for surveys, by removing the possibility of the “neutral” answer, it is expected that the user will express more definite opinions rather than turn towards a neutral answer [81]. This might be especially important in the case of a relatively new topic such as circularity. On the other hand, the reliability of the survey is not expected to be affected, as the answers are not used for a direct circularity assessment. Responses to each question are compared between pairs of stakeholders and rated 1 in case of identical answers; 0.75 when answers are one level apart (e.g., one user chooses answer 2 and another 3); 0.5 when the answers are two steps apart; and 0.25 when the users choose two extreme answers, i.e., 1 and 4. Subscore A is the result of the sum of the ratings divided by the number of the questions.

Table 1.
The set of questions provided to the companies at the first level of the multi-level approach: Compliance with circular economy (CE) principles. The questions were grouped into Circulytics’ Enablers themes and partly adapted from the Circulytics “Question Indicator List” (from the Enablers category) [82] as well as the Circularity Check tool’s questions [40] to meet the needs of the framework.
5.2. Material Flows
Supply and demand of materials is the core of the waste-to-resource exchanges. The related aspects taken into account within the CE matchmaking framework are the direct versus indirect matches and the loop tightness, which together form the second level of the framework.
5.2.1. Direct and Indirect Matches (Subscore B1)
Ideally, the outflow from one marketplace user, in a form of a by-product or waste, matches the needs of another stakeholder and can be directly used as secondary raw material input. Such a situation is referred to as a direct match. In many cases, however, a need for indirect matches arises when an intermediate stakeholder is needed to close the material loop and material repurposing takes place. An intermediate stakeholder often offers a technology necessary to process the waste so that it can be used as a resource by another stakeholder. The abundance of waste patterns in different sectors shows that for creation of an adequate database of matches, it is necessary to have detailed information about the supply chain. Additionally, apart from straightforward, direct matches, many unapparent possibilities for circular cooperation exist. Within the matchmaking framework both cases are foreseen with direct and indirect matches receiving B1 subscores of 1 and 0.5, respectively. The matches will be identified based on the information provided by the users against a relevant database, which will be developed.
5.2.2. Loop Tightness (Subscore B2)
Within the developed concept, collaborations resulting in a tighter loop are promoted. This is expressed by the scoring scheme presented in Figure 5. The scoring scheme is based on the logic behind the EMF infographic [83], also known as the “butterfly diagram”. The fundamentals of the CE are captured in that diagram, including the reasoning behind striving for tighter loops.
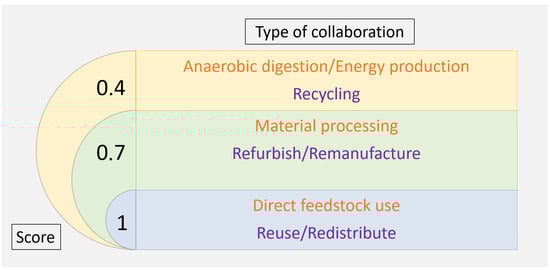
Figure 5.
Scoring based on the type of collaboration and related loop tightness reflected as subscore B2 for biological (written in orange) and technical (written in violet) cycles based on the Ellen MacArthur Foundation (EMF) infographic [83].
The loop tightness scoring scheme is based on the type of collaboration and involves distinction between technical and biological cycles. Although Walter Stahel’s inertia principle pertains to technical materials [84] and therefore concerns mainly the technical cycle, similar logic is used for the biological cycle scores. In the biological cycle, the reasoning behind the scoring scheme is based on the idea that using feedstock, e.g., slurry as fertilizer, utilizes the material more completely than collaborations where processing of the material is needed. At the same time, the algorithm promotes collaborations based on processing of the material rather than synergies that are based on the use of the material for anaerobic digestion or energy production. This is achieved by assigning a higher score to the type of collaboration resulting in a tighter loop (e.g., reuse/redistribute—1, refurbish/remanufacture—0.7, recycling—0.4). For the biological cycle, the following scoring scheme is used, depending on the basis of collaboration: direct feedstock use—1, material processing—0.7, anaerobic digestion/energy production—0.4.
For the indirect matches that require an intermediate processing step, the score of 0.7 is applied, following the logic that keeping materials in the loop as long as possible has more value than allocating them for, e.g., energy production.
5.3. GHG Emissions
GHG emissions from transport of the material from producer to receiver is the third level match in the CE matchmaking framework. The criterion was chosen as being relevant in terms of environmental impact of a marketplace. The distance together with other factors, e.g., modes of transport, weight of the material, and fuel type, influence the quantity of GHG emissions. All these factors are planned to be ultimately included in the third level of the matching framework. Once these factors are incorporated, intervals of GHG emissions and corresponding values of subscore C will be concluded. At the stage of the presentation of the framework application described in Section 6, the calculations are performed only for road transport and are based on the distance between stakeholders. An exact description of how subscore C is calculated for each application case can be found in Section 6. Inclusion of other modes of transport is under development.
6. Presentation of Framework Application—Cases
Four hypothetical cases are depicted in this section. These cases are designed to illustrate how the logic of the CE matchmaking framework is applied in real-life settings using data obtained from companies, being potential framework stakeholders. Each case describes a hypothetical situation and a possible solution in the context of the CE matchmaking framework. For each case insights are presented. The cases focus on different functionalities of the framework. Case 1 puts emphasis on direct matches. Case 2 presents a situation where the framework can be applied as a support tool in decision making process on which partner to choose for further cooperation. Case 3 illustrates how flow tightness is applied within the network, while Case 4 is an example of indirect matching.
Case 1 is based on data provided by Alia Cooperative on their outflows and the information about networking companies. Cases 2–4 rely on data provided by other companies representing stakeholders from both the biological and technical cycle (Table A1). A “Report on stakeholder involvement along the supply chain” [85], a deliverable of the CIRC4Life project, was used as basis for information on supply chains in the food sector and the electric and electronic sectors. Data from those sectors were to a large extent used for the design of the cases. The answers to the CE compliance questionnaire provided by companies are presented as aggregate data, in the form of the relevance subscore A (Cases 2–4). For Cases 2–4, data obtained from companies were used for the calculation of subscores A and B. Due to the fact that two out of the five companies did not provide any answer to question 8, this question was not taken into account while calculating score A for Cases 2 and 3.
For Case 1, subscore C calculation is based on the distance measurement. The distance is compared to the Eurostat data on the average distance goods were carried in 2018 on the national level [86]. A relevance score was calculated based on predefined intervals, which were calculated for Spain. Table 2 presents data for Spain where, according to Eurostat, the average distance that goods were carried was equal to 114 km in 2018.
Table 2.
Distance intervals and corresponding relevance subscore C values for Spain.
For Cases 2–4, due to the distant locations of the companies, a simplified approach for the calculation of subscore C was implemented. This approach is based solely on the relevant distance between marketplace users, i.e., with a higher score for companies located closer to each other.
The weighting factors used for calculating the Total Relevance Score according to Equation (1) were tentatively set to the following values: α and γ to 0.2 and β to 0.6.
6.1. Case 1—Direct Matches
Circumstances: Alia is a feed manufacturer company located in Lorca, Spain. Alia produces the following waste and by-products: slurry, corpses, meat waste from slaughterhouses (hair, blood, hooves, hands, and heads), meat waste from processing plants, and also pig feed Alia is willing to manage those wastes and by-products in the most circular way possible. The CE matching framework was applied to investigate the options.
Framework context: Alia’s waste and by-products match the demand of companies V, W, X, Y, and Z as presented in Table 3.
Table 3.
Matches between Alia and companies V, W, X, Y, and Z.
The detailed profiles of the companies, including their location and distance from Alia, are presented in Table 4.
Table 4.
Profiles of the companies.
The next step within the matching framework is calculation of subscores A, B, and C for Alia and companies V, W, X, Y, and Z.
Subscore A
It was assumed that the relevance subscore A between Alia and all the companies is equal to 0.75, as real data were not available. This assumption is based on the fact that the analysis concerns actual cooperation; therefore, a certain level of CE compliance within Alia’s network is expected to exist.
Subscore B
All flows between Alia and companies V, W, X, Y, and Z are considered to be direct matches, as there is no need for an intermediate stakeholder to process the materials. Therefore, the relevance subscore B1 is equal to 1 in all cases. Companies W, X, and Y treat the materials received from Alia using, e.g., extraction processes, resulting in subscore B2 equal to 0.7. The farmer from Lorca (company V) uses the slurry from Alia directly as biochemical feedstock, with the assumption that no treatment of the slurry is needed. Therefore, the obtained subscore B2 between Alia and company V is equal to 1. Similarly, the pig feed is directly used by the pig breeder (company Z) as biochemical feedstock, resulting in the tightest possible loop and a B2 score equal to 1.
Subscore C
Subscore C for companies V, Y, and Z is equal to 1, while for company W it is 0.75. Company X is located the farthest away from Alia’s premises, exceeding the 1.5 national distance; therefore, subscore C is equal to 0.25. It is assumed that company Z (pig breeder) is located within 57 km from Alia premises; therefore, subscore C between company Z and Alia equals 1.
TRS
Based on the obtained values for subscores A, B, and C, the Total Relevance Score between Alia and companies was calculated. The highest Total Relevance Score (95%) was obtained between Alia and the farmer located in Lorca (company V), as well as between Alia and the pig breeder from Southeast Spain (company Z). This is followed by the relevance score of 86% for company Y that uses meat waste from processing plants and is located in the Lorca region. The Total Relevance Score between Alia and companies W and X was equal to 81% and 71%, respectively. These results confirm that, due to the fact that already existing connections were used and because of lack of the data on the CE compliance, the factor that significantly influenced the final result is the distance between the companies. The results are summarized in Table 5.
Table 5.
Total Relevance Score (TRS) calculation, based on the scores A, B, and C.
Scenarios
In order to illustrate the impact of subscore A on the Total Relevance Score, different scenarios using a hypothetical company U were considered. Company U is an agricultural company with similar characteristics to company V, using Alia’s slurry directly on its field and being located in the Lorca region. In the first hypothetical case, company U and Alia obtained the relevance subscore A equal to 0.5 and in the second 0.25. The influence on the overall score was investigated. In the first case, the Total Relevance Score changes from 95% to 90%, placing company U in the second position of the listing. In the second scenario, the Total Relevance Score is reduced to 85%, and company U is placed after companies Z and Y.
Another example showing the influence of the GHG emissions on the Total Reference Score is presented. This is achieved by increasing the distance between company Z and Alia beyond 57 km. The influence on subscore C and the Total Reference Score is presented in Table 6. It can be seen that in the current metrics of α, β, and γ settings, the location change does not influence the overall score by more than 15%, even in case of relatively large distances between the stakeholders.
Table 6.
The influence of the changing distance between Alia and company Z on the score C (GHG emissions) and on the Total Relevance Score.
Insights: Case 1 illustrates how the framework can be applied in the case of direct matches. Some of the elements of the framework, such as the support of the decision process on selection between different partners, CE compliance, flow tightness, or indirect matches, could not be demonstrated within Case 1. In order to illustrate functionality of those elements, Cases 2–4 were designed.
6.2. Case 2—Partner Selection
Circumstances: WEEE recycling company is interested in finding a stakeholder that will accept glass, which is one of the outflows at the WEEE recycling company.
Framework context: Glass is stated as in demand by three companies: A lighting company, a design and architecture company, and a packaging company. It was assumed that the material provided by the WEEE recycling company is in a recycled form that can be directly used by the three receiving companies and does not need any processing, resulting in direct matches, therefore resulting in B1 reference equal to 1 and B2 to 0.4. Subscore A calculation is based on the answers provided by companies. As mentioned in Section 6, the calculation of score C is based on the relative distance between marketplace users. In this case the WEEE company with the design and architecture company residing in Spain obtained the highest subscore C (0.75). The second highest score C was obtained for the WEEE company and the packaging company located in Germany, followed by the WEEE company and the lighting company with warehouses in China. The summary of scores for the matches presented in Figure 6 is shown in Table 7.
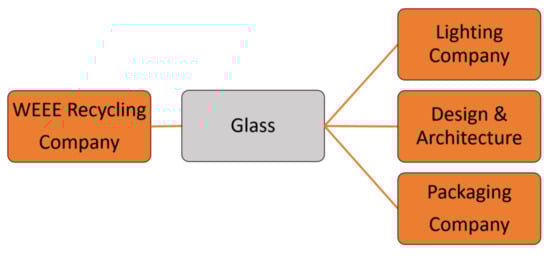
Figure 6.
Possible collaborations on glass waste as described in Case 2.
Table 7.
Summary of scores for Case 2.
As shown in Table 7, the WEEE recycling company obtained the highest TRS with the design and architecture company, followed by a slightly lower TRS with the packaging company. The WEEE company has a lower chance of successful cooperation with the lighting company due to low reference subscores A and C.
Insights: Case 2 presents a situation where the framework can be applied as a support tool in the decision process on which partner to choose for further cooperation.
6.3. Case 3—Flow Tightness
Circumstances: A lighting company is looking for demand for its outflows consisting of PCB, housing, and screws.
Framework context: Two stakeholders specified those articles as “in demand”: WEEE Recycling company and Repairing and Upgrading Services. The direct match between these two companies is detected (Figure 7) and the TRS score calculation initiated. Score A is calculated in the same way as for Case 2. It is assumed that the cooperation with the WEEE company is based on recycling while with Repairing and Upgrading Services on refurbishing; therefore, relevant B2 scores were applied (0.4 and 0.7, respectively) with both matches being direct matches where no intermediate stakeholder is needed. The summary of scores for the matches presented in Figure 6 is shown in Table 8.
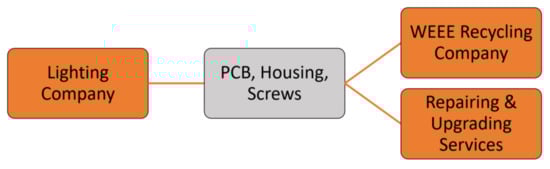
Figure 7.
Selection of matches between companies of the technical cycle. Score calculation for the matches between companies marked in orange is described in the text.
Table 8.
Summary of scores from Case 3.
As shown in Table 8, the lighting company obtained higher TRS with Repairing and Upgrading Services. In this case, the higher scores for C and B1, related to type of cooperation, were decisive, given the slightly lower score A.
Insights: Case 3 illustrates how flow tightness is applied within the network. In order to avoid the need for assumptions on the type of cooperation, more detailed information from the users should be requested. Promotion of the framework in order to attract a higher number of users, so that collaborations in closer locations can be established, is necessary.
6.4. Case 4—Indirect Matches
Circumstances: An extension services company generates plastic, paper, and cardboard as a side effect of their operation.
Framework context: No direct match exists. A possible indirect match arises with the fruit producer from Poland (Figure 8).

Figure 8.
Indirect match between extension services company and fruit producer.
Plastic, paper, and cardboard, which is of no use for the first company, after being recycled by a recycling company (a need for an intermediate stakeholder), could be used by fruit producer, which stated that plastic and cardboard are one of the inflows at the company. This match involves an assumption that the material provided by the first company is not suitable in the provided form for the second company and that a stakeholder offering an intermediate process is necessary (in this case, a recycling company). Since a potential match exists, the next step is calculation of subscores A, B1, B2, and C. Based on the answers provided by two companies, the relevance subscore A is equal to 0.81. Indirect matches result in subscore B1 equal to 0.5, while recycling of the material results in subscore B2 equal to 0.7. Subscore C is set to 0.5 in order to be able to calculate the TRS. After applying the equation, the TRS is equal to 53.2 % which in case of no other options could be of interest for potential framework users, provided that they are located closer.
Insights: Case 4 is an example of indirect matching. In order to avoid the need for assumptions in the digitalized version of the marketplace, more detailed information on the materials will be required from the users. The companies are located too far apart, and in reality, the cooperation between the two companies would not be beneficial or taken into account. Promotion of the CE matching framework among potential stakeholders is necessary so that a larger number of possible collaborations is assured.
7. Discussion
This study investigated which criteria to apply for the circular cooperation matching of companies in the context of circular partnerships. These criteria were used for the development of a CE matchmaking framework with the intention of future deployment within an online marketplace algorithm. The developed CE matching framework is based on a multi-level approach and relevance scoring between the users. The multi-level approach addresses the following aspects: (i) compliance with circular economy principles, (ii) material flows analysis, (iii) greenhouse gas emissions. Based on those aspects, a Total Relevance Score between the stakeholders is calculated. The relevance score reflects the possibility of two companies cooperating successfully and is not interchangeable with the assessment of a company’s circularity. We believe that relevance scores between stakeholders possess certain advantages over a single score, as they are not linked to evaluation. During the current, rather early stage of circularity implementation in the markets, many stakeholders might not feel confident with the assessment of their company in terms of circularity. On the other hand, it has been reported by some companies that the CE maturity level, together with other factors, does play a role in successful circular collaboration activities [87]. By avoiding the use of a single score and therefore the direct assessment of a company, the focus is on bringing out potential partnerships and identifying even unobvious cooperation. Similar frameworks have not been defined in the literature, while many authors emphasize the importance of the right partnerships in the context of circular economy. The proposed framework has the potential to become an CE synergy facilitator and a solution to certain barriers to circular transition, especially those related to communication between companies and supply chain complexity [88].
The CE matching framework application is demonstrated in four hypothetical cases. The cases were designed with the intention to present the main functionalities of the framework, provided there are available data. The lack of larger sets of data posed a limitation for more elaborate application presentation. As a result, some of the matches might not have been feasible in real-life conditions. This limitation is expected to be eliminated. More extensive participation is anticipated once the framework is deployed in an online marketplace, and therefore it is a more tangible tool than the concept presented to the stakeholders at the early point of development.
Some enhancements of the framework are recommended prior to its online deployment. Further development of the concept should consider more precise GHG emission calculation. The weight of the transported material and different modes of transport should be taken into consideration [89]. The weighting scheme using Equation (1) should be further studied to avoid possible bias. Additionally, it seems that there might be a need to clarify question 8 of the CE compliance questionnaire, as some of the companies did not provide an answer to it. An important part of marketplace creation will be the collection of data for the database of flows [90]. This will allow expansion to diverse industries and incorporation of different strategies for indirect approaches to closing the loop, which will be suggested to the user by the recommender system. At the same time, close collaboration with potential marketplace users is advised from the early development stages of the marketplace to assure the necessary knowledge transfer of all aspects [91]. The multi-level approach offers the flexibility of adding other aspects in the future. Further development of the concept will include enhancement of the marketplace for water first and at a later stage for energy. The presented CE matchmaking framework will be significantly expanded especially within the water sector, where the overwhelming need for reuse, recycling, and recovery is posing an urgent need for such an initiative [92]. Improving the marketplace user experience, e.g., by incorporation of algorithms such as those proposed by Musial et al. (2016), might also be considered [93]. Additionally, ideas brought up during discussions with companies could be considered, e.g., validation of information provided by users and requesting information about traceability certification.
8. Conclusions
This manuscript presents a novel concept: a circular economy matchmaking framework. The proposed framework incorporates for the first time the CE within the matchmaking process and was developed with an objective of future deployment in the marketplace for the secondary raw material markets. Use of the CE matchmaking framework as an integral part of an online marketplace can have a number of potential benefits for the involved companies. It facilitates finding new cooperation opportunities for circular business and strengthens the existing ones. By using a CE matchmaking framework within a marketplace, therefore becoming more circular, a company is expected to be able to gain client trust as a business with an environmentally friendly approach. By closing the loops of their products, companies improve the security of their raw materials and are better prepared for the upcoming and already existing regulations [94,95].
Within the presented concept, it was attempted to go beyond simple output/input match. A multi-level approach was proposed based on circular economy principles contained within the matching algorithm and coupled with relevance score between the stakeholders. By bypassing a single score, which may have negative connotations, we introduced the best fit of the circular economy and enabled connections between stakeholders with similar levels of circularity. The CE matching framework is a novel concept that contributes to the circular transition.
Author Contributions
Conceptualization, G.T.; methodology, G.T., L.Ł.-A. and S.L.; validation, M.M.N., L.Ł.-A. and G.T.; investigation, G.T. and L.Ł.-A.; resources, M.M.N.; writing—original draft preparation, L.Ł.-A.; writing—review and editing, G.T., M.M.N. and S.L.; visualization, L.Ł.-A.; supervision, G.T.; project administration, G.T.; funding acquisition, A.A. All authors have read and agreed to the published version of the manuscript.
Funding
This research has been conducted as part of CIRC4Life and was funded by European Union’s Horizon 2020 research and innovation programme under Grant agreement No. 776503. The APC was funded by the CIRC4Life project.
Data Availability Statement
The data presented in this study are available on request from the corresponding author. Some of the data are not publicly available due to privacy restrictions. Aggregate anonymized data are used.
Acknowledgments
The research described in this publication has been conducted within CIRC4Life project and was funded by European Union’s Horizon 2020 research and innovation programme under Grant agreement No. 776503. We would like to thank all the companies that participated in the survey. We appreciate the insight and expertise provided by colleagues from Laurea University of Applied Sciences in Finland.
Conflicts of Interest
The authors declare no conflict of interest. The funders had no role in the design of the study; in the collection, analyses, or interpretation of data; in the writing of the manuscript; or in the decision to publish the results.
Appendix A
Table A1.
Data on the inflows and outflows provided by companies and used for Cases 2–4. The location of the warehouses is presented in brackets.
Table A1.
Data on the inflows and outflows provided by companies and used for Cases 2–4. The location of the warehouses is presented in brackets.
| WEEE Recycling Company (Vizcaya, Spain) | |
|---|---|
| IN: aluminum, metal (ferrous fraction), copper concentrated fraction, metal (general), PCB fraction, PMMA fraction, rare-earth elements (Li, Ce, Eu), technology metals (Ga, In), precious metals (Au, Ag), plastic, wood, glass, frames, diffusers, screws, PCB, housing, batteries, screens, lighting, wires, others | OUT: metal (non-ferrous fraction), metal (ferrous fraction), copper concentrated fraction, mixed plastics, PCB fraction, PMMA fraction, plastic, wood, glass |
| Lighting Manufacturing Company (Suzhou, China) | |
| IN: aluminum, metal (ferrous fraction), metal (general), PCB fraction, rare-earth elements (Li, Ce, Eu), plastic, glass, screws, PCB, housing, batteries, lighting, wires | OUT: PCB, housing, batteries, lighting, wires, diffusers, screws, metal (ferrous fraction), mixed plastics, pcb fraction, plastic, glass |
| Design and Architecture Company (Barcelona, Spain) | |
| IN: metal (general), wood, glass, screws, lighting, wires, other: various discarded materials that can be upcycled, reused, or repurposed into functional design objects | OUT: metal (non-ferrous fraction), metal (ferrous fraction), wood |
| Packaging Company (Bonn, Germany) | |
| IN: metal (general), plastic, glass, frames, screws, housing, screens, lighting, wires | OUT: screws, metal (non-ferrous fraction), mixed plastics, plastic |
| Repairing and Upgrading Services (Germany, Czech Republic, USA) | |
| IN: aluminum, metal (ferrous fraction), copper concentrated fraction, metal (general), precious metals (Au, Ag), plastic, screws, PCB, housing, batteries | OUT: N/A (company provides services) |
| Extension Services (Sardinia, Italy) | |
| IN: other | OUT: plastic, paper, and cardboard |
| Farming and Livestock Producers (Valencia, Spain) | |
| IN: fertilizer, seeds, animal feed, vegetables for animal feed | OUT: biowaste, vegetables overproduction (not specified), slurry, meat waste |
| Fruit Producer (Obsza, Poland) | |
| IN: fertilizer, plastic, paper/cardboard, plant protection products | OUT: rejected fruit (with defects, overripe, etc.) |
References
- Kirchherr, J.; Reike, D.; Hekkert, M. Conceptualizing the circular economy: An analysis of 114 definitions. Resour. Conserv. Recycl. 2017, 127, 221–232. [Google Scholar] [CrossRef]
- Ellen MacArthur Foundation. The Circular Economy in Detail. Available online: https://www.ellenmacarthurfoundation.org/explore/the-circular-economy-in-detail (accessed on 15 May 2020).
- European Comission. Circular Economy Action Plan. Available online: https://ec.europa.eu/environment/circular-economy/pdf/new_circular_economy_action_plan.pdf (accessed on 15 May 2020).
- European Commission. Communication from the Commission to the European Parliament, the European Council, the Council, the European Economic and Social Committee and the committee of the Regions. The European Green Deal. Available online: https://ec.europa.eu/info/strategy/priorities-2019-2024/european-green-deal_en (accessed on 15 May 2020).
- United Nations. About the Sustainable Development Goals—United Nations Sustainable Development. Available online: https://www.un.org/sustainabledevelopment/sustainable-development-goals/ (accessed on 7 September 2020).
- Schroeder, P.; Anggraeni, K.; Weber, U. The Relevance of Circular Economy Practices to the Sustainable Development Goals. J. Ind. Ecol. 2019, 23, 77–95. [Google Scholar] [CrossRef]
- Upadhyay, A.; Akter, S.; Adams, L.; Kumar, V.; Varma, N. Investigating “circular business models” in the manufacturing and service sectors. J. Manuf. Technol. Manag. 2019, 30, 590–606. [Google Scholar] [CrossRef]
- Upadhyay, A.; Laing, T.; Kumar, V.; Dora, M. Exploring barriers and drivers to the implementation of circular economy practices in the mining industry. Resour. Policy 2021, 72, 102037. [Google Scholar] [CrossRef]
- Heyes, G.; Sharmina, M.; Mendoza, J.M.F.; Gallego-Schmid, A.; Azapagic, A. Developing and implementing circular economy business models in service-oriented technology companies. J. Clean. Prod. 2018, 177, 621–632. [Google Scholar] [CrossRef]
- Jæger, B.; Menebo, M.M.; Upadhyay, A. Identification of environmental supply chain bottlenecks: A case study of the Ethiopian healthcare supply chain. Manag. Environ. Qual. Int. J. 2021. [Google Scholar] [CrossRef]
- Upadhyay, A.; Kumar, A.; Akter, S. An analysis of UK retailers’ initiatives towards circular economy transition and policy-driven directions. Clean Technol. Environ. Policy 2021, 1, 3. [Google Scholar] [CrossRef]
- Upadhyay, A. Antecedents of green supply chain practices in developing economies. Manag. Environ. Qual. Int. J. 2020. [Google Scholar] [CrossRef]
- Agrawal, R.; Wankhede, V.A.; Kumar, A.; Upadhyay, A.; Garza-Reyes, J.A. Nexus of circular economy and sustainable business performance in the era of digitalization. Int. J. Product. Perform. Manag. 2021. [Google Scholar] [CrossRef]
- Upadhyay, A.; Mukhuty, S.; Kumar, V.; Kazancoglu, Y. Blockchain technology and the circular economy: Implications for sustainability and social responsibility. J. Clean. Prod. 2021, 293, 126130. [Google Scholar] [CrossRef]
- Sawik, B. Selected multiple criteria supply chain optimization problems. Appl. Manag. Sci. 2020, 20, 31–58. [Google Scholar] [CrossRef]
- Nandi, S.; Sarkis, J.; Hervani, A.A.; Helms, M.M. Redesigning Supply Chains using Blockchain-Enabled Circular Economy and COVID-19 Experiences. Sustain. Prod. Consum. 2021, 27, 10–22. [Google Scholar] [CrossRef]
- Chemical Industry Federation of Finland; Sitra; Business Finland; Accenture. Sustainable and Circular Business Models for the Chemical Industry. Circular Economy Playbook for Chemical Companies. Available online: https://media.sitra.fi/2020/05/28111719/sustainable-and-circular-business-models-for-the-chemical-industry.pdf (accessed on 4 November 2020).
- Sitra; Technology Industries of Finland; Accenture. Circular Economy Business Models for the Manufacturing Industry. Circular Economy Playbook for Finnish SMEs. Available online: https://teknologiateollisuus.fi/sites/default/files/inline-files/20180919_Circular%20Economy%20Playbook%20for%20Manufacturing_v1%200.pdf (accessed on 4 November 2020).
- Ellen MacArthur Foundation. Towards a Circular Economy: Business Rationale for an Accelerated Transition. Available online: https://www.ellenmacarthurfoundation.org/publications/towards-a-circular-economy-business-rationale-for-an-accelerated-transition (accessed on 26 January 2021).
- Bocken, N.M.P.; de Pauw, I.; Bakker, C.; van der Grinten, B. Product design and business model strategies for a circular economy. J. Ind. Prod. Eng. 2016, 33, 308–320. [Google Scholar] [CrossRef]
- Berg, H.; Wilts, H. Digital Platforms as Market Places for the Circular Economy. Requirements and Challenges. Available online: https://epub.wupperinst.org/frontdoor/deliver/index/docId/7103/file/7103_Berg.pdf (accessed on 16 April 2021).
- Kosmol, L.; Leyh, C. A Vision for Industrial Symbiosis: Build Your Platform (Ecosystem). In Proceedings of the Twenty-Eight European Conference on Information Systems (ECIS2020), Marrakesh, Morocco, 15–17 June 2020. [Google Scholar]
- World Business Council for Sustainable Development. Policy Enablers to Accelerate the Circular Economy; World Business Councilfor Sustainable Development: Geneva, Switzerland, 2019; Available online: https://www.wbcsd.org/Programs/Circular-Economy/Factor-10/Resources/Policy-enablers-to-accelerate-the-circular-economy (accessed on 2 April 2021).
- Ghisellini, P.; Cialani, C.; Ulgiati, S. A review on circular economy: The expected transition to a balanced interplay of environmental and economic systems. J. Clean. Prod. 2016, 114, 11–32. [Google Scholar] [CrossRef]
- González-Sánchez, R.; Settembre-Blundo, D.; Ferrari, A.M.; García-Muiña, F.E. Main dimensions in the building of the circular supply chain: A literature review. Sustainability 2020, 12, 2459. [Google Scholar] [CrossRef]
- Maranesi, C.; De Giovanni, P. Modern circular economy: Corporate strategy, supply chain, and industrial symbiosis. Sustainability 2020, 12, 9383. [Google Scholar] [CrossRef]
- TenP Platform. Available online: https://www.globalcompactnetwork.org/en/network-activities-eng/tenp-platform.html (accessed on 9 March 2021).
- Migliore, M.; Oberti, I.; Talamo, C. Circular economy and recycling of pre-consumer scraps in the construction sector. Cross-sectoral exchange strategies for the production of eco-innovative building products. In Regeneration of the Built Environment from a Circular Economy Perspective; Della Torre, S., Cattaneo, S., Lenzi, C., Zanelli, A., Eds.; Research for Development; Springer: Cham, Switzerland, 2020; pp. 217–228. [Google Scholar]
- European Cluster Collaboration Platform. Clusters in the Circular Economy. Building Partnerships for Sustainable Transition of SMEs. Available online: https://www.clustercollaboration.eu/news/clusters-circular-economy-0 (accessed on 16 November 2020).
- World Business Council for Sustainable Development. Secondary Material Marketplaces. Available online: https://www.ceguide.org/Strategies-and-examples/Dispose/Secondary-material-marketplaces (accessed on 22 November 2020).
- Ellen MacArthur Foundation. Towards the Circular Economy: Economic and Business Rationale for an Accelerated Transition. Available online: https://www.ellenmacarthurfoundation.org/assets/downloads/publications/Ellen-MacArthur-Foundation-Towards-the-Circular-Economy-vol.1.pdf (accessed on 21 June 2020).
- Elia, V.; Gnoni, M.G.; Tornese, F. Measuring circular economy strategies through index methods: A critical analysis. J. Clean. Prod. 2017, 142, 2741–2751. [Google Scholar] [CrossRef]
- Ellen MacArthur Foundation. Circulytics-Measuring Circularity. Available online: https://www.ellenmacarthurfoundation.org/resources/apply/circulytics-measuring-circularity (accessed on 21 June 2020).
- World Business Council for Sustainable Development; CIRCULAR IQ. CTI Tool—Circular Transition Indicators. Available online: https://ctitool.com/ (accessed on 21 June 2020).
- Ellen MacArthur Foundation. Data & Insights. Available online: https://www.ellenmacarthurfoundation.org/resources/apply/circulytics-measuring-circularity/data-insights (accessed on 12 April 2021).
- World Business Council for Sustainable Development Post|Linked in. Available online: https://www.linkedin.com/posts/wbcsd_circular-water-bioeconomy-activity-6783327187324940288-nh-j/ (accessed on 12 April 2021).
- Ellen MacArthur Foundation. Circulytics Method Introduction. Available online: https://www.ellenmacarthurfoundation.org/assets/downloads/circulytics-method-introduction.pdf (accessed on 6 December 2020).
- WBCSD. Circular Transition Indicators V2.0. Metrics for Business, by Business. Available online: https://www.wbcsd.org/contentwbc/download/11256/166026/1 (accessed on 11 May 2021).
- Ellen MacArthur Foundation. Material Circularity Indicator. Available online: https://www.ellenmacarthurfoundation.org/resources/apply/material-circularity-indicator (accessed on 13 April 2021).
- Ecopreneur; We Sustain. Circularity Check Landing Page. Available online: https://ecopreneur.eu/circularity-check-landing-page/ (accessed on 4 September 2020).
- IMSA Amsterdam. Unleashing the Power of the Circular Economy. Available online: http://circular-future.eu/wp-content/uploads/2015/08/Unleashing_the_Power_of_the_Circular_Economy-Circle_Economy.pdf (accessed on 27 November 2020).
- De Pascale, A.; Arbolino, R.; Szopik-Depczyńska, K.; Limosani, M.; Ioppolo, G. A systematic review for measuring circular economy: The 61 indicators. J. Clean. Prod. 2020, 124942. [Google Scholar] [CrossRef]
- European Comission. Communication from the Commission to the European Parliament, the Council, the European Economic and Social Committee and the Committee of the Regions on a Monitoring Framework for the Circular Economy. Available online: https://eur-lex.europa.eu/legal-content/EN/TXT/PDF/?uri=CELEX:52018DC0029&from=EN (accessed on 21 January 2021).
- Moraga, G.; Huysveld, S.; Mathieux, F.; Blengini, G.A.; Alaerts, L.; Van Acker, K.; de Meester, S.; Dewulf, J. Circular economy indicators: What do they measure? Resour. Conserv. Recycl. 2019, 146, 452–461. [Google Scholar] [CrossRef]
- Corona, B.; Shen, L.; Reike, D.; Rosales Carreón, J.; Worrell, E. Towards sustainable development through the circular economy—A review and critical assessment on current circularity metrics. Resour. Conserv. Recycl. 2019, 151, 104498. [Google Scholar] [CrossRef]
- Roos Lindgreen, E.; Salomone, R.; Reyes, T. A Critical Review of Academic Approaches, Methods and Tools to Assess Circular Economy at the Micro Level. Sustainability 2020, 12, 4973. [Google Scholar] [CrossRef]
- Angelis-Dimakis, A.; Arampatzis, G.; Pieri, T.; Solomou, K.; Dedousis, P.; Apostolopoulos, G. SWAN platform: A web-based tool to support the development of industrial solid waste reuse business models. Waste Manag. Res. 2021, 39, 489–498. [Google Scholar] [CrossRef]
- Fric, U.; Rončević, B. E-simbioza—Leading the way to a circular economy through industrial symbiosis in Slovenia. Soc. Ekol. 2018, 27, 119–140. [Google Scholar] [CrossRef]
- Álvarez, R.; Ruiz-Puente, C. Development of the Tool SymbioSyS to Support the Transition Towards a Circular Economy Based on Industrial Symbiosis Strategies. Waste Biomass Valorization 2017, 8, 1521–1530. [Google Scholar] [CrossRef]
- Cecelja, F.; Raafat, T.; Trokanas, N.; Innes, S.; Smith, M.; Yang, A.; Zorgios, Y.; Korkofygas, A.; Kokossis, A. E-Symbiosis: Technology-enabled support for Industrial Symbiosis targeting Small and Medium Enterprises and innovation. J. Clean. Prod. 2015, 98, 336–352. [Google Scholar] [CrossRef]
- Raafat, T.; Trokanas, N.; Cecelja, F.; Bimi, X. An ontological approach towards enabling processing technologies participation in industrial symbiosis. Comput. Chem. Eng. 2013, 59, 33–46. [Google Scholar] [CrossRef]
- Raafat, T.; Trokanas, N.; Cecelja, F.; Kokossis, A.; Yang, A. Semantically-Enabled Formalisation to Support and Automate the Application of Industrial Symbiosis. Comput. Aided Chem. Eng. 2012, 31, 1055–1059. [Google Scholar] [CrossRef]
- Dounavis, A.S.; Kafasis, P.; Ntavos, N. Using an online platform for the improvement of industrial symbiosis and circular economy (in Western Macedonia, Greece). Glob. NEST J. 2019, 21, 76–81. [Google Scholar] [CrossRef]
- Cutaia, L.; Morabito, R.; Barberio, G.; Mancuso, E.; Brunori, C.; Spezzano, P.; Mione, A.; Mungiguerra, C.; Li Rosi, O.; Cappello, F. The project for the implementation of the industrial symbiosis platform in Sicily: The progress after the first year of operation. In Pathways to Environmental Sustainability; Salome, R., Saija, G., Eds.; Springer: Cham, Switzerland, 2014; pp. 205–214. [Google Scholar]
- Cutaia, L.; Luciano, A.; Barberio, G.; Sbaffoni, S.; Mancuso, E.; Scagliarino, C.; Monica, M. La The experience of the first industrial symbiosis platform in Italy. Environ. Eng. Manag. J. 2015, 14, 1521–1533. [Google Scholar] [CrossRef]
- Raabe, B.; Low, J.S.C.; Juraschek, M.; Herrmann, C.; Tjandra, T.B.; Ng, Y.T.; Kurle, D.; Cerdas, F.; Lueckenga, J.; Yeo, Z.; et al. Collaboration Platform for Enabling Industrial Symbiosis: Application of the By-product Exchange Network Model. In Proceedings of the Procedia CIRP 61, the 24th CIRP Conference on Life Cycle Engineering, Kamakura, Japan, 8–10 March 2017; Takata, S., Umeda, Y., Kondoh, S., Eds.; Elsevier: Amsterdam, The Netherlands, 2017; Volume 61, pp. 263–268. [Google Scholar]
- Bakogianni, D.; Skourtanioti, E.; Meimaris, D.; Xevgenos, D.; Loizidou, M. Online brine platform: A tool for enabling industrial symbiosis in saline wastewater management domain. In Proceedings of the 15th Annual International Conference on Distributed Computing in Sensor Systems (DCOSS), Santorini Island, Greece, 29–31 May 2019; Institute of Electrical and Electronics Engineers Inc.: New York, NY, USA, 2019; pp. 430–435. [Google Scholar]
- Migliore, M.; Talamo, C.; Paganin, G. A Virtual Marketplace for Waste Valorization. In Strategies for Circular Economy and Cross-sectoral Exchanges for Sustainable Building Products. Preventing and Recycling Waste; Springer: Cham, Switzerland, 2020. [Google Scholar]
- Ding, X.; Zhang, S.; Zhang, Y.; Zhong, W. Pattern of the 3rd Party Reverse Logistics System in ecological industrial park. Adv. Mater. Res. 2011, 171–172, 648–653. [Google Scholar] [CrossRef]
- Chen, H.; Feng, N. Information platform and the stability of an ecological industrial park. Adv. Mater. Res. 2013, 616–618, 1631–1635. [Google Scholar] [CrossRef]
- Guo, J.; Qiao, Q.; Yao, Y. New trend of eco-industrial parks’ construction and management. Adv. Mater. Res. 2014, 962–965, 2436–2440. [Google Scholar] [CrossRef]
- Zhou, L.; Pan, M.; Sikorski, J.J.; Garud, S.; Aditya, L.K.; Kleinelanghorst, M.J.; Karimi, I.A.; Kraft, M. Towards an ontological infrastructure for chemical process simulation and optimization in the context of eco-industrial parks. Appl. Energy 2017, 204, 1284–1298. [Google Scholar] [CrossRef]
- Zhou, L.; Pan, M.; Sikorski, J.J.; Garud, S.; Kleinelanghorst, M.J.; Karimi, I.A.; Kraft, M. System Development for Eco-industrial Parks Using Ontological Innovation. In Proceedings of the Energy Procedia, 8th International Conference on Applied Energy, Beijing, China, 8–11 May 2016; Yan, J., Sun, F., SK, C., Desideri, U., Li, H., Campana, P., Xiong, R., Eds.; Elsevier: Amsterdam, The Netherlands, 2017; Volume 105, pp. 2239–2244. [Google Scholar]
- Benedict, M.; Kosmol, L. Designing Industrial Symbiosis Platforms—From Platform Ecosystems to Industrial Ecosystems. In Proceedings of the PACIS 2018, 22nd Pacific Asia Conference on Information Systems, Yokohoma, Japan, 26–30 June 2018; Tanabu, M., Senoo, D., Eds.; Publisher Association for Information Systems (AIS): Atalanta, GA, USA, 2018. [Google Scholar]
- Trokanas, N.; Cecelja, F.; Raafat, T. Semantic approach for pre-assessment of environmental indicators in Industrial Symbiosis. J. Clean. Prod. 2015, 96, 349–361. [Google Scholar] [CrossRef]
- Trokanas, N.; Cecelja, F.; Raafat, T. Semantic input/output matching for waste processing in industrial symbiosis. Comput. Chem. Eng. 2014, 66, 259–268. [Google Scholar] [CrossRef]
- Stirna, J.; Zdravkovic, J.; Henkel, M.; Loucopoulos, P.; Stratigaki, C. Modeling organizational capabilities on a strategic level. In Proceedings of the The Practice of Enterprise Modeling. PoEM 2016. Lecture Notes in Business Information Processing; Horkoff, J., Jeusfeld, M., Persson, A., Eds.; Springer: Cham, Switzerland, 2016; Volume 267, pp. 257–271. [Google Scholar]
- Van Capelleveen, G.; Amrit, C.; Yazan, D.M. A Literature Survey of Information Systems Facilitating the Identification of Industrial Symbiosis. In From Science to Society; Otjacques, B., Hitzelberger, P., Naumann, S.W.V., Eds.; Springer: Berlin/Heidelberg, Germany, 2018; pp. 155–169. [Google Scholar]
- Grant, G.B.; Seager, T.P.; Massard, G.; Nies, L. Information and communication technology for industrial symbiosis. J. Ind. Ecol. 2010, 14, 740–753. [Google Scholar] [CrossRef]
- Maqbool, A.; Mendez Alva, F.; Van Eetvelde, G. An Assessment of European Information Technology Tools to Support Industrial Symbiosis. Sustainability 2018, 11, 131. [Google Scholar] [CrossRef]
- Yeo, Z.; Masi, D.; Low, J.S.C.; Ng, Y.T.; Tan, P.S.; Barnes, S. Tools for promoting industrial symbiosis: A systematic review. J. Ind. Ecol. 2019, 23, 1087–1108. [Google Scholar] [CrossRef]
- Kerdlap, P.; Low, J.S.C.; Steidle, R.; Tan, D.Z.L.; Herrmann, C.; Ramakrishna, S. Collaboration platform for enabling industrial symbiosis: Application of the industrial-symbiosis life cycle analysis engine. In Proceedings of the Procedria CIRP, 26th CIRP Conference on Life Cycle Engineering (LCE) Purdue University, West Lafayette, IN, USA, 7–9 May 2019; Sutherland, W.J., Skerlos, S.J., Zhao, F., Eds.; Elsevier: Amsterdam, The Netherlands, 2019; Volume 80, pp. 655–660. [Google Scholar]
- Mattila, T.J.; Pakarinen, S.; Sokka, L. Quantifying the total environmental impacts of an industrial symbiosis-a comparison of process-, hybrid and input-output life cycle assessment. Environ. Sci. Technol. 2010, 44, 4309–4314. [Google Scholar] [CrossRef]
- Mattila, T.; Lehtoranta, S.; Sokka, L.; Melanen, M.; Nissinen, A. Methodological Aspects of Applying Life Cycle Assessment to Industrial Symbioses. J. Ind. Ecol. 2012, 16, 51–60. [Google Scholar] [CrossRef]
- Martin, M.; Svensson, N.; Eklund, M. Who gets the benefits? An approach for assessing the environmental performance of industrial symbiosis. J. Clean. Prod. 2015, 98, 263–271. [Google Scholar] [CrossRef]
- Jacobsen, N.B. Industrial Symbiosis in Kalundborg, Denmark: A Quantitative Assessment of Economic and Environmental Aspects. J. Ind. Ecol. 2006, 10, 239–255. [Google Scholar] [CrossRef]
- Van Berkel, R.; Fujita, T.; Hashimoto, S.; Fujii, M. Quantitative assessment of urban and industrial symbiosis in Kawasaki, Japan. Environ. Sci. Technol. 2009, 43, 1271–1281. [Google Scholar] [CrossRef]
- Delgado-de Miguel, J.-F.; Buil-López Menchero, T.; Esteban-Navarro, M.-Á.; García-Madurga, M.-Á. Proximity Trade and Urban Sustainability: Small Retailers’ Expectations Towards Local Online Marketplaces. Sustainability 2019, 11, 7199. [Google Scholar] [CrossRef]
- Ding, F.; Campos, J.K. The Impact of E-commerce Development on Urban Logistics Sustainability. Open J. Soc. Sci. 2016, 4, 1–6. [Google Scholar] [CrossRef]
- Bertels, S. Embedding Sustainability Self-Assessment. Embedding Project. 2014. [Google Scholar] [CrossRef]
- Garland, R. The Mid-Point on a Rating Scale: Is it Desirable? Mark. Bull. 1991, 2, 66–70. [Google Scholar]
- Ellen MacArthur Foundation. Circulytics Question Indicator List. Available online: https://www.ellenmacarthurfoundation.org/assets/downloads/Circulytics-question-indicator-list.pdf (accessed on 13 May 2020).
- Ellen MAcArthur Foundation. Inforgraphic. Circular Economy Systems Diagram. Available online: https://www.ellenmacarthurfoundation.org/circular-economy/concept/infographic (accessed on 26 June 2020).
- Stahel, W.R. The Performance Economy, 2nd ed.; Palgrave Macmillan: London, UK, 2010. [Google Scholar]
- CIRC4Life H2020 Project. Report on the Stakeholder Involvement along the Supply Chain. Available online: https://ec.europa.eu/research/participants/documents/downloadPublic?documentIds=080166e5c8b04180&appId=PPGMS (accessed on 13 July 2020).
- Eurostat. Road Freight Transport by Vehicle Characteristics/Average Distance Travelled. Available online: https://ec.europa.eu/eurostat/statistics-explained/index.php/Road_freight_transport_by_journey_characteristics#Average_distance_travelled (accessed on 26 June 2020).
- Brown, P.; Bocken, N.; Balkenende, R. Why Do Companies Pursue Collaborative Circular Oriented Innovation? Sustainability 2019, 11, 635. [Google Scholar] [CrossRef]
- Jaeger, B.; Upadhyay, A. Understanding barriers to circular economy: Cases from the manufacturing industry. J. Enterp. Inf. Manag. 2020, 33, 729–745. [Google Scholar] [CrossRef]
- Mckinnon, A.; Piecyk, M. Measuring and Managing CO2 Emissions of European Chemical Transport. Available online: https://cefic.org/app/uploads/2018/12/MeasuringAndManagingCO2EmissionOfEuropeanTransport-McKinnon-24.01.2011-REPORT_TRANSPORT_AND_LOGISTICS.pdf (accessed on 26 June 2020).
- van Capelleveen, G.; Amrit, C.; Yazan, D.M.; Zijm, H. The influence of knowledge in the design of a recommender system to facilitate industrial symbiosis markets. Environ. Model. Softw. 2018, 110, 139–152. [Google Scholar] [CrossRef]
- White, G.R.T.; Cicmil, S.; Upadhyay, A.; Subramanian, N.; Kumar, V.; Dwivedi, A. The soft side of knowledge transfer partnerships between universities and small to medium enterprises: An exploratory study to understand process improvement. Prod. Plan. Control 2019, 30, 907–918. [Google Scholar] [CrossRef]
- ARUP; Ellen MacArthur Foundation; Antea Group. Water and circular economy—White Paper. Available online: https://www.ellenmacarthurfoundation.org/assets/downloads/ce100/Water-and-Circular-Economy-White-paper-WIP-2018-04-13.pdf (accessed on 10 May 2021).
- Musial, J.; Pecero, J.E.; Lopez-Loces, M.C.; Fraire-Huacuja, H.J.; Bouvry, P.; Blazewicz, J. Algorithms solving the Internet shopping optimization problem with price discounts. Bull. Polish Acad. Sci. Tech. Sci. 2016, 64. [Google Scholar] [CrossRef]
- Collaborating Centre for Sustainable Consumption and Production gGmbH How You Can Benefit from a Circular Economy? Available online: https://www.scp-centre.org/can-benefit-circular-economy/ (accessed on 15 July 2020).
- Kumar, N.; Brint, A.; Shi, E.; Upadhyay, A.; Ruan, X. Integrating sustainable supply chain practices with operational performance: An exploratory study of Chinese SMEs. Prod. Plan. Control 2019, 30, 464–478. [Google Scholar] [CrossRef]
Publisher’s Note: MDPI stays neutral with regard to jurisdictional claims in published maps and institutional affiliations. |
© 2021 by the authors. Licensee MDPI, Basel, Switzerland. This article is an open access article distributed under the terms and conditions of the Creative Commons Attribution (CC BY) license (https://creativecommons.org/licenses/by/4.0/).