Abstract
Natural gas is a main source of energy in Iran, and optimal allocation to different sectors is crucial, based on realities, geopolitical considerations, and national security concerns. In this paper, a multi-objective goal programming model is developed to study the optimal allocation of this resource to various consumption sectors, including household business, industry, petrochemical industry, power plants, injection to oil fields, and export from Iran for the horizon of 2025. In this research, the energy security index is prioritized over other indicators. Two objective functions are considered: the first is maximizing the energy security index (minimizing the cost of energy security), and the second is minimizing the relative weight of different consumption sectors. The goal share of the various gas sectors, the amount of consumption of the various consumption sectors, and the allocatable and predicted amount for each year is calculated. Household business, power plants, petrochemical industries, industry, and export aid injection to oil fields are the most consuming sectors in 2025, respectively. Also, based on cost minimization, power plants, petrochemical industries, and industries in general are the more consuming sectors, respectively.
1. Introduction
Nowadays, natural gas (NG) is the main source of energy in many countries. Being more efficient and having less carbon, NG is increasingly used in different sectors rather than other fossil fuels and non-renewable energy sources [1]. While the global portion of oil consumption in the energy sector fell from 45% in 1970 to 43.6% in 2020, NG experienced an increase from 17.2% to 33.7% in a similar period [2]. Iran is known to be among the main suppliers of NG in the world and its own region. Having been explored and found to have more than 33.5 trillion cubic meters of NG reserves in 2015, Iran is the second-biggest owner of NG reserves globally, and it is estimated to own almost 18% of all explored NG on the Earth (Figure 1).
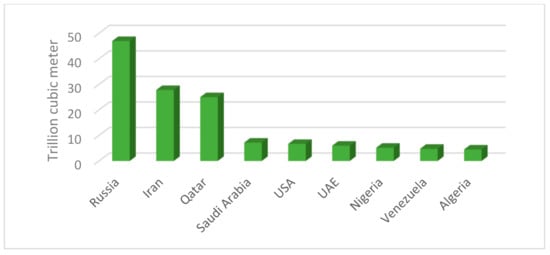
Figure 1.
Country natural gas reserves (Data from eoearth.org, 2020, access on 3 October 2020).
Importantly, explorations by Iran over the past two decades increased its global proportion by 2% [2]. Energy use and consequent NG consumption in Iran has dramatically increased over the past 10 years. Despite all mentioned facts, and its increased extraction, Iran is currently an importer of NG from Turkmenistan, and in search of new NG exporters [3]. It is worth mentioning that there is a reliable planning and allocation sector which is associated with population and consumption, and that forecasting is crucial.
Because of its operational features, NG can be distributed to different sectors of energy consumers. NG is the main fuel used by petrochemical and refinery industries to gain added value. However, a significant proportion of NG is consumed in transportation, domestic heating and cooking, and industry.
NG allocation should be associated with the expansion of social welfare over time, and this measure must be considered as the opportunity cost of gas distribution to various sectors. Consequently, the cost of allocation between the NG exploitation time and various sectors’ uses should be minimized. Hence, a function of the profit and costs of gas allocation to the different sectors should be considered [4]. In fact, optimally allocating limited sources of NG to different consumers is a crucial political and economic challenge. Hence, this paper aims to study the optimal allocation of NG to distinct sectors in Iran by developing an optimization model.
One of the major factors playing a key role in optimally allocating resources is predicting future consumptions in order to make it applicable. There are several approaches to forecast energy demand, e.g., artificial neural network, data-driven model, time-series analysis such as ARIMA, etc. [5,6,7]. However, in this paper, forecasts of future energy consumptions in Iran are extracted from energy balance sheets by simple statistical methods. As well, different approaches and optimization algorithms, such as fuzzy goal programming [8], weighted goal programming [9], and mixed integer programming [10], are employed by operations research scholars to optimize energy resource allocation.
In this paper, a multi-objective goal programming method is employed to optimally allocate NG to the different Iranian consumers for the horizon of 2025. The rest of the paper is organized as follows: in Section 2 the literature is reviewed, in Section 3 the methodology and the mathematical model are presented, in Section 4 the results are demonstrated and discussed, and, finally, there is a conclusion on the research and the results.
2. Literature Review
Due to economic growth, technological advances, and increasing demand, planning for energy is now a complex multi-variable, multi-objective problem. Accordingly, a variety of models are developed to solve the problem based on a different point of view worldwide [11]. While they have pros and cons, many of them cannot be considered as decision-making assistance tools. Also, some of them do not adequately reflect energy policies. For instance, they do not take into account the policies which the World Energy Council has proposed: e.g., by 2050, new technologies should generate about 37% of the total energy in the world [12].
Pollution and environmental problems caused by overuse of fossil fuels, especially for transportation, have exacerbated the need for alternative fuels. Romm [13] thoroughly investigated alternative fuels for transportation systems in the future. Arslan et al. [14] reviewed possible scenarios of supplying energy for cars rather than fossil fuels in Turkey. Also, Babtista et al. [15] studied short-term and long-term resources and road consumption scenarios in Portugal and found alternative fuels necessary for longer horizons. Sehatpour et al. [16] made a comprehensive research on fossil-fuel alternatives for light-duty vehicles and, based on a multi-criteria evaluation, concluded NG and biogas are superior options for the mid-term in Iran. Santisirisomboon et al. [17] studied policies of carbon taxation to study the competitiveness of biomass energy with fossil fuels in Thailand.
Due to the importance of the problem, there are many decision support tools and simulation models available, such as the Vienna Automated System Planning Package, MESSAGE (Model for Energy Supply Strategy Alternatives and their General Environmental Impact) [18], the Long-range Energy Alternatives Planning system (LEAP), the MARKAL-EFOM Integrated System (TIMES), and the Energy PLAN [19]. These models allocate energy based on minimizing costs and priorities of demands. Environmental concerns, planning policies, and availability of energy resources can be defined as constraints [20].
A different application of these models is recorded in the literature. Strachan & Kannan [21] employed MARKAL-Macro (M-M) to study the long-term reduction of CO2 emissions in the UK energy sector. Liu et al. [22] applied the energy model of MESSAGE-China to study the trend of novel energy technologies and their contributions to GHG reduction in China. Ball et al. [23] employed the energy system model MOREHyS to plan spatially and temporally a set-up of a hydrogen-based transport infrastructure system in Germany for the horizon of 2030. Chiodi et al. [24] analyzed the competing demands for land-use, import dependency, availability of sustainable bioenergy, and economics under the framework of an Irish energy systems model of TIMES. Tavakoli et al. [25] and Valinejad et al. [26] found the energy model system as a convenient and user-friendly approach to analyze energy policies.
Goal programming (GP) is a current multi-objective optimization method, which can address multi-criteria decision analysis (MCDA) problems. Jayaraman et al. [27] used a GP model for efficient allocation of labor resources considering the criteria of economic, energy, and environment in the United Arab Emirates using the approach of prioritizing areas for strategic planning and resource allocation for the sustainability of the strategies. They presented mathematical and economic indicators in order to digitize criteria. Kumar et al. [28] developed an insight into the application of various multiple criteria decision-making (MCDM) methods in the renewable energy sector. Zografidou et al. [29] programmed a GP model with all possible weight combinations to analyze energy allocation and budgeting in Greece and provided a multi-dimensional decision-makers’ framework to determine the optimal budgeting mix to attract investors and guarantee the success of the venture. Kumar et al. [30] optimized priorities among suppliers considering the three dimensions of economic, social, and environmental sustainability in India. They integrated fuzzy AHP and fuzzy multi-objective linear programming approaches. Other extensions to GP are also applied to energy suitability problems, e.g., stochastic goal programming [7], weighted goal programming [31], fuzzy goal programming [32], and fractional goal programming [33]. Flisberg et al. [34] kept a schedule of the harvest and chipping operations of forest fuels in Sweden and studied alternatives. They employed indicators for all operations and solved them by a decision support system. Mekonnen et al. [35] explored the commutation between domestic and other applications of biomass energy sources in Ethiopia by employing a no-separable-farm household model in which labor energy is also considered in the stages of collection and farming. They concluded that the application of dung as a domestic fuel source negatively affects the value of harvested crops, however, the application of on-farm fuelwood is compromised with an increase in the value of agricultural output. Chong et al. [36] analyzed factors which had an impact on the energy consumption growth in Guangdong Province by employing the logarithmic mean Divisia index I (LMDI) based on the physical processes of energy utilization from the source to end-users. They concluded GDP and population are the most influential factors in energy consumption.
Atabaki and Aryanpur [37] developed a multi-objective linear planning model to analyze Iran’s long-term power sector development from economic, environmental, social, and sustainable perspectives. Three objective functions in this study are included: minimizing the cost, carbon production, and maximizing the job market. To assess expert-based weights, analytical hierarchy process (AHP) methods are employed and, moreover, to support the decision-makers, the MESSAGE model as a planning tool is used to define different scenarios for developing clean technologies. The results show that a sustainable scenario leads to high technology diversification. Furthermore, the combined cycle would be the dominant option in Iran’s long-term generation mix. In addition, power generation from non-hydro renewables, solar PV in particular, should grow faster than the total electricity demand. The findings indicate that the economic scenario fulfills Iran’s commitment to 4% reduction of emissions compared to the current trend. However, the sustainable and environmental scenarios would achieve the superior 12% reduction goal. Multi-objective analysis shows that moving away from one’s objective optimum value leads to significant improvements in other objective values. Adnan et al. [38] formulated a multi-objective scheduling problem to optimize the allocation of renewable energy resources and electric vehicle (EV) charging stations.
2.1. Comparative Analysis of Conventional Method
Investigating the appropriateness of different fuels and technologies, including renewable energy, is a practical decision-making practice for policymakers. Renewable energy sources can help to increase energy supply as well, to reduce emissions of greenhouse gas pollutants. Due to limitations of supplying the total energy from new sources of energy for now, finding an optimal combination of supply from both renewable and non-renewable energy sources is favorable. However, the rapid development and rising capacity of new technologies in different areas should be taken into account in planning future and targeting [39]. Ehsan and Yang [40] comprehensively investigated optimization methods employed in distributed generation in the power distribution networks. The Pros and cons of each method are shown in Table 1. The literature was investigated with a systematic review. Criteria for selecting articles included: publication dates between 1990 and 2020, use of a quantitative allocation technique, presence of a case study, use of optimization method, and those published in reputable journals.

Table 1.
Comparative analysis of conventional techniques and metaheuristic algorithms [40].
Alternate energy sources cannot guarantee the continuity and reliability of the power supply. Vega-Garita et al. [41] and Calpa et al. [42] analyzed the effects of high PV penetration as the main source of energy for the Spanish electric grid. Renewable resources have many technical and economic benefits. Its technical benefits include reducing system losses, improved voltage, quality, high reliability, and economic benefits including low maintenance costs and fuel costs. The most common distribution generation (DG) systems today are residential solar technology, small wind turbines, and fuel cells. Some research work focusing on energy resource allocation optimization is listed in Table 2.
Table 2.
Previous research in the field of energy resource allocation optimization.
2.2. Research Gap
Hashemipour et al. [53] presented a mathematical model to optimize the NG allocation to an oil field of Iran by using genetic algorithms. The objective function included (1) maximizing the production rate and (2) maximizing the profit. Alikhani and Rshidi [54] proposed a stochastic programming model for NG allocation with an energy security cost approach. They concluded that the priorities of NG resources allocations are as follows: domestic and commercial sections, power plants, industries, gas reinjection, exports, refinery, road transport, and agriculture, respectively. Kazemi et al. [55] comprehensively studied the problem of NG allocation models by AHP approach and 13 models were ranked in this study. Using multi-objective goal programming, Chedid et al. [56] suggested a model for NG allocation in Lebanon. Borges and Antunes [57] formulated energy allocation to the domestic sector using fuzzy multi-objective programming. Hatagalung [47] analyzed the optimization allocation of sustainable energy source by a non-linear mathematical model. Li et al. [58] examined the energy allocation problem by minimizing errors of budget. Maroufmashat and Sattari [59] presented a linear programing model to allocate NG resources to Iran’s various demand sectors. Alikhani and Azar [60] employed a fuzzy goal programming model for allocating NG to different sectors. It was shown that NG injection, export, and road transportation are the most important sectors, respectively.
Some other studies investigated the NG prices’ effects on the economics of importers and exporters since this influences the cycle of energy demand and supply [61,62,63]. Orlov [64] studied the Russian government’s policy to reduce domestic NG price regulation and concluded that the domestic NG price should be 55% of the export netback price. Wang and Lin [61] presented a dynamic model to analyze the effect of NG price increase on the economy indexes (GDP, imports, and household income) in China. The effects of NG pricing were not presented or researched in any of the studies analyzed by the authors (or in systematic literature review made by the authors). Hence, some literature with their features is listed in Table 3 for a better idea of research trends needed in this field.
Table 3.
Modeling approaches.
In this paper, the optimal allocation of natural gas resources to different sectors of consumption is investigated by applying multi-objective goal programming decision-making techniques. Therefore, the objective function is the goal and system constraints of the multi-goal programming decision-making technique based on the relative weights assigned to different sectors of consumption.
3. Methods and Material
3.1. Multi-Objective Function Model—Scenario 1 (Minimizing Gas Consumption in Different Sectors)
Simplex in linear programming is standard method for solving an optimization problem, typically one involving a function and several constraints expressed as inequalities. The inequalities define a polygonal region, and the solution is typically at one of the vertices. The simplex method is a systematic procedure for testing the vertices as possible solutions. In this research the simplex method was used for model formulation based on goal programming.
Let us take Xij the amount of gas which must be allocated in year t to the sectors i = 1, 2, …, 6, which represent the household business, industry, petrochemicals, power plants, injection into oil fields, and exports, respectively, and j is the number of the year (2018–2025—j = 1, 2, …,8).
Definition of indexes and parameters are as follows:
- j: time (year);
- i: The number of the consumer sector;
- Zi: Objective I;
- Pi: The priority of objective I;
- di+: Positive deviation from objective I;
- di−: Negative deviation from objective I;
- Pij: Price of gas consumed in sector i in year j;
- ACij: Minimum natural gas consumption of each sector; and
- FCij: The goal portion of various gas sectors.
The main proposed model is the multi-objective function based on goal programming, as follows:
Subject to:
As it is clear, this model consists of six objectives. The prior objective is to allocate gas to the export sector in different production years. Therefore, in the equation of the multi-objective model, the related deviations are considered as positive and so for the other sectors. Also, each of the objective functions are assigned and continued to minimize deviations from the goal that are included in the final objective function constraints. Also, since a target function cannot have values greater than or less than the goal, six final constraints are used in this regard. Discussed target functions are presented as below:
3.2. Objective Function Model Allocation of Household-Commercial Gas Surplus to Other Sectors
- Fj: Gas deficit rate in year j
- Ej: Gas household surplus in j year
3.3. Objective Function Model Optimizing Energy Security Cost
Energy security is a factor that is associated with national security and the availability of natural resources. In this context, the security of the energy supply is of the utmost importance. It is worth mentioning that energy security plays the most important role for decision-makers, that is to say, this factor is highly influential on the price of energy resources, and political power and relation among exporter and importer counties.
The cost of energy security should be quantized and have a measurement. All applications to secure energy should be taken into account, e.g., increasing fuel costs from a source to reduce consumption from an unsafe and insecure source, costs of infrastructure construction to create new and safe systems, and the political costs of securing and storing energy resources. Accordingly, in a country which holds energy policy as its priority, circumstances are different to those where cheaper energy is the objective.
Threats endangering the transmission and consumption of fuel in any of the sub-sectors can be categorized into seven general groups:
Investment threats: This threat is considered as a physical threat that affects the external or physical nature of fuel transmission. Delay or lack of investment due to the administrative bureaucracy and the complexity of the country’s structure in absorbing domestic and foreign capital, legal restrictions, international sanctions, and taxes, uncertainty about the fate of investment, the high risk of investing in the particular project, and the lack of return on investment are among the investment threats.
Technical threats: This threat can disrupt the supply. Technical problems in the process of the production can result in waste or no fuel extraction, however, those problems related to gas transmission pipelines are likely to be solved by storing it or bypassing to injection fields.
The threats of demand management and consumption growth: Mismanagement in demand and supply can lead to a threat. If a supplier is unable to provide storage facilities, consumption fluctuations can become problematic. In cases where a supplier has not considered urgent matters of sudden cold or gradual growing demand, the distribution could face difficulties due to lack of proper infrastructure.
Other physical threats: Earthquakes, pipeline failure, and terrorist attacks on facilities are among these threats. Some of these threats are taken seriously and some less seriously in Iran.
Pricing and marketing threats: These threaten the security of fuel exports. Pricing could threaten supply security by conflicts before and after contract. Energy security imposes costs on the supplier and the importer. Due to security issues and administrative allocation strategy, competitive pricing is a conflict between the authority and the private sector, making the market impossible.
Internal management threats: In addition to geopolitical issues which are compromised with the nature of the energy sector, national problems, such as economic crises and mass strikes, influence the security of supply.
Foreign and international political threats: Foreign countries which are stakeholders in energy trade in the region could be counted as threats by implication. In addition, actions implemented by other countries or unions, such as sanctions, could highly threaten safe and secure supply.
The objective function and constraints are as follows:
Subject to:
In this paper, the developed model is a seven-objective and linear model. Therefore, goal programming and lexicographer methods have been used to solve the MODM models. It is worth noting that Lingo software is used to solve this problem.
3.4. Problem-Solving Approach with Lexicographer
One of the methods employed to solve goal programming problems when objectives are prioritized is lexicographers. In fact, the lexicographer uses a set of methods that an analyzer needs to get basic information from the decision-maker. The difference between lexicographers and the weighting method is receiving weights from the decision-maker. In the weighting method the weights taken from the decision-maker reveal the importance of the objective functions. However, in the lexicographer’s method, the only order of priorities or preferences is determined by the decision-maker.
The lexicographer’s approach is to select an objective function with the highest priority and the problem is optimized in the target space with the highest priority. Afterwards, if the found point is unique, it is considered the optimum. If multiple solutions are found, the point which satisfies the less prior objective functions as well.
This method consists of the following steps:
Step 1: Prioritize the desired goals;
Step 2: The goal has the highest priority from which the deviation is more important to the decision-maker, so in this step select the most important goal and minimize the related deviation; and
Step 3: The problem will be solved only for the highest prior function and its optimum will be searched. Two situations could happen at this stage:
Mode 1: If the solution is unique, the answer is found; and
Mode 2: If some points are found, lower prior functions determine which point is superior.
Steps above are iterated until reaching a unique answer.
4. Results and Discussion
In this section, priorities of allocating gas to different sectors of consumption as coefficients of proximity (rank) and relative proportional weight and priority of six different sectors of gas consumption are shown in Table 4. It should be noted that the relative weight of each sector is calculated by dividing the corresponding coefficient of affinity into the total coefficients of the proximity of all sectors of consumption. Regarding Table 4, the first rank of consumption is assigned to export and then injection to oil fields and petrochemical industries are in order, respectively.
Table 4.
Rating, relative weight, and priority of the different sectors (Pi) of consumption.
At this stage, the optimal allocation of gas resources to different sectors of consumption is implemented using the GP multi-purpose decision-making technique. Therefore, the solution for the objective function, the goal and system constraints of GP multi-purpose decision-making technique for 2018–2025 by using the relative weight of the various consumption sectors (presented in Table 4), as well as information extracted from the trend of the gas industry and energy balance sheet documents of Iran is to be found. The goal share of the various gas sectors, the amount of consumption of the various departments of consumption (based on the balance sheet of energy and hydrocarbons), the base gas volume, the allocable and predicted amount of each year is summarized in Figure 2, Table 5 and Table 6.
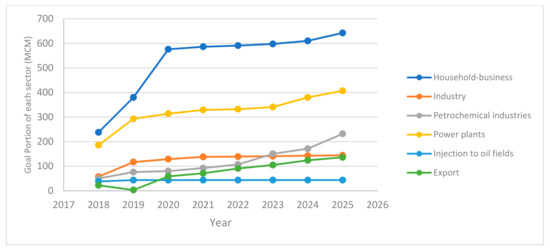
Figure 2.
The goal portion (FCij) of various gas sectors (MCM: Million Cubic Meter).
Table 5.
Price per cubic meter of natural gas in consumption areas Pij (Rials).
Table 6.
Base gas volume (Zi), limited, allocated and predicted value (MCM).
Inputs of GP consists the goal portion () of consumption, price per cubic meter of natural gas in consumption areas, , base gas volume (), limited, allocated and predicted value, the volume of gas deficit (), and minimum natural gas consumption of each consumption sector () in Figure 2, Table 5, Table 6, Table 7, Table 8 and Table 9, respectively.
Table 7.
The volume of gas deficit (Fj) (MCM).
Table 8.
Minimum natural gas consumption of each sector (ACij) (MCM).
Table 9.
The Gas surplus in different years (Ej) (MCM).
Calculate Security Costs
Considering the equations, the cost of energy security in different sectors is calculated. The probability of occurrence of each of the threats in the gas security disorder is based on the recurrence of the expert’s opinion as outlined in the following tables (Table 10 and Table 11).
Table 10.
The probability of occurrence of each of the threats ( ) (Percentage).
Table 11.
Price per cubic meter of gas per consumption unit ( ) (Rials).
The goal programming model mentioned in the previous section after substituting numerical values associated with different input parameters is as follows:
Such that:
In the lexicographer method, the objective functions of the goal programming model are considered and solved separately to minimize the deviation from the specified goal according to their priority. Then, if it obtained a unique point, it is considered to be the optimal point. If multiple solutions are found in the space of multiple solutions, lower important functions are checked for the points.
According to the results obtained by solving the model with the first priority objective function (the first objective function), the obtained point is unique and the negative deviation of the first objective function from the specified cause is minimum and zero. The answer (Table 12 and Figure 3) is final and efficient and acceptable:
Table 12.
Optimal allocation of gas to sectors based on cost minimization (MCM).
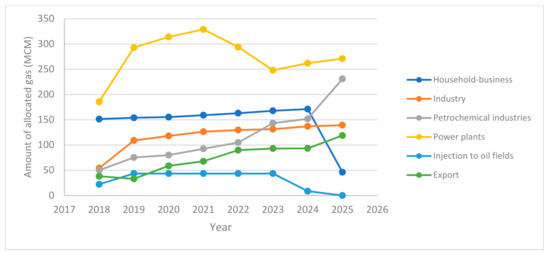
Figure 3.
Optimal allocation of gas to sectors based on cost minimization.
Allocation of household surplus gas to other sectors is calculated as follows:
According to the solution of the above formula, the optimal allocation of surplus gas to each of the sources of consumption is as follows (Table 13 and the Figure 4).
Table 13.
Optimal allocation of surplus gas (MCM).
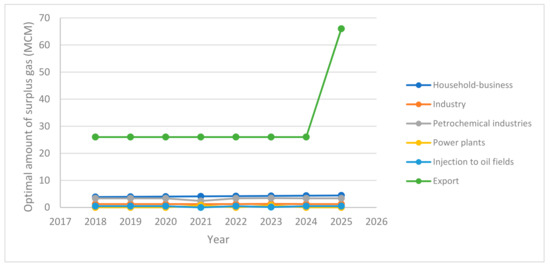
Figure 4.
Optimal allocation of surplus gas.
Minimizing the cost of energy security is calculated as follows:
Such that:
Considering the above problem in Lingo 17 software, the optimal allocation of energy security is as follows (Table 14 and Figure 5).
Table 14.
Optimal allocation of energy security costs (Rials).
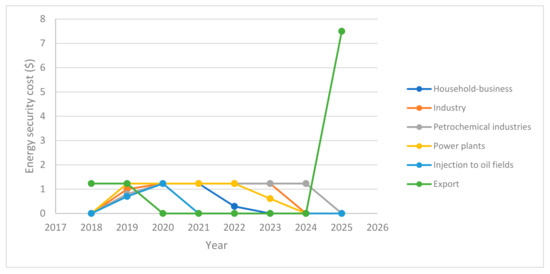
Figure 5.
Optimal allocation of energy security costs.
According to Table 14, the optimal cost of energy security is calculated as follows:
Regarding Table 13 gas surplus was present throughout the gas system. It shows that the gas surplus is allocated to different consumption sectors. Table 14 shows the cost of energy security which is only calculated for the sectors which do not have a supply shortage. In other words, this cost is assigned to the various sectors according to the cost of gas production and the priority of the consumer sector as specified in Table 14.
5. Conclusions
In this paper, the optimal allocation of limited NG resources to different sectors of consumption (including household business, industry, petrochemical industries, power plants, injection to oil fields, and export) in Iran during 2018–2025 is studied. The multi-objective linear planning model has been used for modeling. Lexicography method is employed and the objective functions of the goal programming model are solved according to their assigned priority, in order to minimize the deviation from the specified goal. Energy security strategies differ in each country and region. Energy-importing countries often consider energy security as the security of energy supply, while energy-exporting countries prefer to refer to it as security of energy demand. It should be noted that energy security is crucial for decision-makers in terms of supply, moreover, it is highly influential on energy pricing as well political power. Two main objective functions are considered in this study: (1) maximizing energy security index (minimizing energy security cost), and (2) minimizing the relative weight of different consumption sectors from negative to a goal by using GP multi-objective decision-making technique. Therefore, the objective function and systematic constraints of multi-objective GP decision-making techniques are presented based on the relative weight of the various sectors and also on the basis of information extracted from the gas industry prospectus and energy and hydrocarbon balance sheets. The goal share of different natural gas sectors (based on the gas industry outlook in Iran), the base consumption of the various sectors (based on energy and hydrocarbon balances in Iran), and the volume of basic natural gas, the allocable and predicted limit per year are given in the tables. The results of this study are used for optimal allocation of natural gas to different consumption sectors as well as for future planning. Household business, power plants, petrochemical industries, industry, export, and injection to oil fields are the highest consuming sectors in 2025, respectively. Also based on cost minimization function, power plants, petrochemical industries, and industries in general are the more consuming sectors, respectively.
The results show that if Iran’s gas production plans are successful and the level of gas production achieves the levels announced in the development plans, it needs to target a great level of gas exports to maximize social welfare. In other words, the gas exports should not be one of the priorities of Iran’s policy when the production level is faced with constraint (which is confirmed by other studies over the past decade), and domestic consumptions and, in particular, injection into oil fields has higher security. But if policies of increasing production are successful and the level of Iran’s production is increased with a level that is predicted in the sixth development plan, the mass exportation of gas will lead to increased social welfare. This shows the need for extensive planning investments in this area. One of the most important policy implications is the increasing transmission capacities of Iran. It is also worth mentioning that one of the reasons for the high level of energy consumption in the final sectors is the lack of attention to correct the pattern of consumption. Of course, in this regard the large subsidies received by the energy sector, especially the gas sector, is an important reason for it. Also, for the natural gas demand model, official prices of natural gas have been used, which also include subsidies, and should be considered in the analysis of the results. Therefore, although the increased volume of natural gas needs special attention in the next three decades and the necessary infrastructure for the extraction of gas resources in the area of final gas consumption must be developed, at the same time crucial strategies should be used that lead to improving consumption patterns.
Author Contributions
Conceptualization, I.M.-K. and S.G.; methodology, S.G. and I.M-K.; software, I.G.S.; validation, I.M.-K. and V.D., formal analysis, I.M.-K.; investigation, I.M.-K. and S.G.; resources, V.D.; writing—original draft preparation, S.G. and I.G.S.; writing—review and editing, I.G.S.; visualization, S.G. and V.D.; supervision, I.M.-K. All authors have read and agreed to the published version of the manuscript.
Funding
This research received no external funding.
Institutional Review Board Statement
Not applicable.
Informed Consent Statement
Not applicable.
Data Availability Statement
The data of this study is available from the authors upon request.
Conflicts of Interest
The authors declare no conflict of interest.
References
- Economides, J.; Wood, A. The state of natural gas. J. Nat. Gas Sci. Eng. 2009, 1, 1–13. [Google Scholar] [CrossRef]
- BP. Statistical Review of World Energy, London. Available online: https://www.bp.com (accessed on 3 October 2020).
- Rowse, J. On Hyperbolic Discounting in Energy Models: An Application to Natural Gas Allocation in Canada. Energy J. 2008, 29, 135–158. [Google Scholar] [CrossRef]
- Rowse, J. Allocation of Canadian Natural Gas to Domestic and Export Markets. Can. J. Econ. 1986, 19, 417–442. [Google Scholar] [CrossRef]
- Khotanzad, A.; Elragal, H.; Lu, T.-L. Combination of artificial neural-network forecasters for prediction of natural gas consumption. IEEE Trans. Neural Netw. 2000, 11, 464–473. [Google Scholar] [CrossRef]
- Liu, L.-M.; Lin, M.-W. Forecasting residential consumption of natural gas using monthly and quarterly time series. Int. J. Forecast. 1991, 7, 3–16. [Google Scholar] [CrossRef]
- Jayaraman, R.; Colapinto, C.; Liuzzi, D.; La Torre, D. Planning sustainable development through a scenario-based stochastic goal programming model. Oper. Res. 2016, 17, 789–805. [Google Scholar] [CrossRef]
- Jayaraman, R.; Colapinto, C.; La Torre, D.; Malik, T. A Weighted Goal Programming model for planning sustainable development applied to Gulf Cooperation Council Countries. Appl. Energy 2017, 185, 1931–1939. [Google Scholar] [CrossRef]
- Lima, J.P.; Barroso, L.A.; Granville, S.; Pereira, M.V.F.; Fampa, M.H.C. Computing leastcore allocations for firm-energy rights: A Mixed Integer Programming procedure. In Proceedings of the 2016 IEEE Power and Energy Society General Meeting (PESGM), Boston, MA, USA, 17–21 July 2016; pp. 1–5. [Google Scholar]
- Liu, Y.; Yu, S.; Zhu, Y.; Wang, D.; Liu, J. Modeling, planning, application and management of energy systems for isolated areas: A review. Renew. Sustain. Energy Rev. 2018, 82, 460–470. [Google Scholar] [CrossRef]
- Council, W.E. World Energy Scenarios Composing Energy Futures to 2050; PSI: London, UK, 2013. [Google Scholar]
- Salvi, B.; Subramanian, K.; Panwar, N. Alternative fuels for transportation vehicles: A technical review. Renew. Sustain. Energy Rev. 2013, 25, 404–419. [Google Scholar] [CrossRef]
- Romm, J. The car and fuel of the future. Energy Policy 2006, 34, 2609–2614. [Google Scholar] [CrossRef]
- Arslan, R.; Ulusoy, Y.; Tekìn, Y.; Surmen, A. An evaluation of the alternative transport fuel policies for Turkey. Energy Policy 2010, 38, 3030–3037. [Google Scholar] [CrossRef]
- Baptista, P.C.; Silva, C.M.; Farias, T.L.; Heywood, J.B. Energy and environmental impacts of alternative pathways for the Portuguese road transportation sector. Energy Policy 2012, 51, 802–815. [Google Scholar] [CrossRef]
- Sehatpour, M.-H.; Kazemi, A.; Sehatpour, H.-E. Evaluation of alternative fuels for light-duty vehicles in Iran using a multi-criteria approach. Renew. Sustain. Energy Rev. 2017, 72, 295–310. [Google Scholar] [CrossRef]
- Santisirisomboon, J.; Limmeechokchai, B.; Chungpaibulpatana, S. Impacts of biomass power generation and CO2 taxation on electricity generation expansion planning and environmental emissions. Energy Policy 2001, 29, 975–985. [Google Scholar] [CrossRef]
- Nakicenovic, N.; Riahi, K. Model Runs with MESSAGE in the Context of the Further Development of the Kyoto-Protocol; German Advisory Council on Global Change: Berlin, Germany, 2003. [Google Scholar]
- Lund, H. Advanced Energy Systems Analysis Computer Model Documentation Version 11.4; Aalborg University: Aalborg, Denmark, 2014; pp. 1–188. [Google Scholar]
- Mirjat, N.H.; Uqaili, M.A.; Harijan, K.; Das Valasai, G.; Shaikh, F.; Waris, M. A review of energy and power planning and policies of Pakistan. Renew. Sustain. Energy Rev. 2017, 79, 110–127. [Google Scholar] [CrossRef]
- Strachan, N.; Kannan, R. Hybrid modelling of long-term carbon reduction scenarios for the UK. Energy Econ. 2008, 30, 2947–2963. [Google Scholar] [CrossRef]
- Liu, Q.; Shi, M.; Jiang, K. New power generation technology options under the greenhouse gases mitigation scenario in China. Energy Policy 2009, 37, 2440–2449. [Google Scholar] [CrossRef]
- Ball, M.; Wietschel, M.; Rentz, O. Integration of a hydrogen economy into the German energy system: An optimising modelling approach. Int. J. Hydrog. Energy 2007, 32, 1355–1368. [Google Scholar] [CrossRef]
- Chiodi, A.; Deane, P.; Gargiulo, M.; Gallachóir, B.Ó. The Role of Bioenergy in Ireland’s Low Carbon Future–Is it Sustainable? J. Sustain. Dev. Energy Water Environ. Syst. 2015, 3, 196–216. [Google Scholar] [CrossRef]
- Tavakoli, M.; Shokridehaki, F.; Marzband, M.; Godina, R.; Pouresmaeil, E. A two stage hierarchical control approach for the optimal energy management in commercial building microgrids based on local wind power and PEVs. Sustain. Cities Soc. 2018, 41, 332–340. [Google Scholar] [CrossRef]
- Valinejad, J.; Marzband, M.; Funsho Akorede, M.; D Elliott, I.; Godina, R.; Matias, J.; Pouresmaeil, E. Long-term decision on wind investment with considering different load ranges of power plant for sustainable electricity energy market. Sustainability 2018, 10, 3811. [Google Scholar] [CrossRef]
- Jayaraman, R.; La Torre, D.; Malik, T.; Pearson, Y.E. Optimal work force allocation for energy, economic and en-vironmental sustainability in the United Arab Emirates: A goal programming approach. Energy Procedia 2015, 75, 2999–3006. [Google Scholar] [CrossRef][Green Version]
- Kumar, A.; Sah, B.; Singh, A.R.; Deng, Y.; He, X.; Kumar, P.; Bansal, R. A review of multi criteria decision making (MCDM) towards sustainable renewable energy development. Renew. Sustain. Energy Rev. 2017, 69, 596–609. [Google Scholar] [CrossRef]
- Zografidou, E.; Petridis, K.; Petridis, N.E.; Arabatzis, G. A financial approach to renewable energy production in Greece using goal programming. Renew. Energy 2017, 108, 37–51. [Google Scholar] [CrossRef]
- Kumar, D.; Rahman, Z.; Chan, F.T.S. A fuzzy AHP and fuzzy multi-objective linear programming model for order allocation in a sustainable supply chain: A case study. Int. J. Comput. Integr. Manuf. 2017, 30, 535–551. [Google Scholar] [CrossRef]
- Zografidou, E.; Petridis, K.; Arabatzis, G.; Dey, P.K. Optimal design of the renewable energy map of Greece using weighted goal-programming and data envelopment analysis. Comput. Oper. Res. 2016, 66, 313–326. [Google Scholar] [CrossRef]
- Sharma, D.; Jana, R.; Gaur, A. Fuzzy goal programming for agricultural land allocation problems. Yugosl. J. Oper. Res. 2007, 17, 31–42. [Google Scholar] [CrossRef]
- Ren, C.F.; Li, R.H.; Zhang, L.D.; Guo, P. Multiobjective Stochastic Fractional Goal Programming Model for Water Resources Optimal Allocation among Industries. J. Water Resour. Plan. Manag. 2016, 142, 04016036. [Google Scholar] [CrossRef]
- Flisberg, P.; Frisk, M.; Rönnqvist, M.; Guajardo, M. Potential savings and cost allocations for forest fuel transportation in Sweden: A country-wide study. Energy 2015, 85, 353–365. [Google Scholar] [CrossRef]
- Mekonnen, D.; Bryan, E.; Alemu, T.; Ringler, C. Food versus fuel: Examining tradeoffs in the allocation of biomass energy sources to domestic and productive uses in Ethiopia. Agric. Econ. 2017, 48, 425–435. [Google Scholar] [CrossRef]
- Chong, C.; Liu, P.; Ma, L.; Li, Z.; Ni, W.; Li, X.; Song, S. LMDI decomposition of energy consumption in Guangdong Province, China, based on an energy allocation diagram. Energy 2017, 133, 525–544. [Google Scholar] [CrossRef]
- Atabaki, M.S.; Aryanpur, V. Multi-objective optimization for sustainable development of the power sector: An economic, environmental, and social analysis of Iran. Energy 2018, 161, 493–507. [Google Scholar] [CrossRef]
- Adnan, N.; Nordin, S.M.; Rahman, I.; Amini, M.H. A market modeling review study on predicting Malaysian consumer behavior towards widespread adoption of PHEV/EV. Environ. Sci. Pollut. Res. 2017, 24, 17955–17975. [Google Scholar] [CrossRef]
- Agrawal, V.; Shenoy, U.V. Unified conceptual approach to targeting and design of water and hydrogen networks. AIChE J. 2006, 52, 1071–1082. [Google Scholar] [CrossRef]
- Ehsan, A.; Yang, Q. Optimal integration and planning of renewable distributed generation in the power distribution networks: A review of analytical techniques. Appl. Energy 2018, 210, 44–59. [Google Scholar] [CrossRef]
- Vega-Garita, V.; Harsarapama, A.P.; Ramirez-Elizondo, L.; Bauer, P. Physical integration of PV-battery system: Advantages, challenges, and thermal model. In Proceedings of the 2016 IEEE International Energy Conference (ENERGYCON), Leuven, Belgium, 4–8 April 2016; pp. 1–6. [Google Scholar]
- Calpa, M.; Castillo-Cagigal, M.; Matallanas, E.; Caamaño-Martín, E.; Gutiérrez, Á. Effects of Large-scale PV Self-consumption on the Aggregated Consumption. Procedia Comput. Sci. 2016, 83, 816–823. [Google Scholar] [CrossRef]
- Ja’fari Samimi, A.; Dehghani, T. Application of Dynamic Model for Optimizing Iranian Gas Reserves. Q. J. Econ. Res. 2007, 30, 165–192. [Google Scholar]
- Renani, M.; Sharifi, A.; Khosh Akhlagh, R.; Dinmohammadi, M. Determining the Priorities for Using Iranian Gas Reserves (Study Period 2006–2028). Q. J. Econ. Res. 2009, 9, 151–182. [Google Scholar]
- Mohaghar, A.; Mehregan, M.; Abolhasani, G. Application of Decision-making Techniques to Prioritize Consumption and Optimal Allocation of Natural Gas with the Fuzzy Approach. J. Energy Econ. 2010, 7, 91–119. [Google Scholar]
- Ng, D.W.K.; Lo, E.S.; Schober, R. Energy-Efficient Resource Allocation in OFDMA Systems with Hybrid Energy Harvesting Base Station. IEEE Trans. Wirel. Commun. 2013, 12, 3412–3427. [Google Scholar] [CrossRef]
- Hutagalung, A.M. The Economic Value of Indonesia’s Natural Gas: A Quantitative Assessment of Rhree Gas Policies. Ph.D. Thesis, University of Twente, Enschede, The Netherlands, 2014. [Google Scholar]
- Orlov, A. An assessment of optimal gas pricing in Russia: A CGE approach. Energy Econ. 2015, 49, 492–506. [Google Scholar] [CrossRef]
- Zhang, W.; Yang, J.; Zhang, Z.; Shackman, J.D. Natural gas price effects in China based on the CGE model. J. Clean. Prod. 2017, 147, 497–505. [Google Scholar] [CrossRef]
- Daneshzand, F.; Amin-Naseri, M.R.; Elkamel, A.; Fowler, M.W. A System Dynamics Model for Analyzing Future Natural Gas Supply and Demand. Ind. Eng. Chem. Res. 2018, 57, 11061–11075. [Google Scholar] [CrossRef]
- Daneshzand, F.; Amin-Naseri, M.R.; Asali, M.; Elkamel, A.; Fowler, M. A system dynamics model for optimal al-location of natural gas to various demand sectors. Comput. Chem. Eng. 2019, 128, 88–105. [Google Scholar] [CrossRef]
- Alavi, S.E.; Lotfalipour, M.R.; Falahi, M.A.; Effati, S. The Optimal Allocation of Iran’s Natural Gas. Iran. Econ. Rev. 2020, 24, 75–98. [Google Scholar]
- Hashemi pour Rafsanjani, H.; rajabi Kalcateh, Y. Optimization of Allocating Gas to One of the Oil Field of Iran for Lifting by Gas Thesis. In Sanctions and Export Deflection: Evidence from Iran; Paris School of Economics: Paris, France, 2011. [Google Scholar]
- Ali-Khani, A.; Rshidi Komeijani, A. Random Planning Model for Allocating the Gas Resources in Iran with the Ap-proach of Energy Security Cost. Manag. Future Stud. 2012, 23, 25–36. [Google Scholar]
- Kazemi, A.; Shakouri, H.; Shakiba, S.; Hossein Zadeh, M. Selecting the Appropriate Model for Allocation of Energy in Iran by Using the Process of Hieratical Analysis. Publ. Iran Energy 2013, 16, 31–61. [Google Scholar]
- Chedid, R.; Mezher, T.; Jarrouche, C. A fuzzy programming approach to energy resource allocation. Int. J. Energy Res. 1999, 23, 303–317. [Google Scholar] [CrossRef]
- Borges, A.R.; Antunes, C.H. A fuzzy multiple objective decision support model for energy-economy planning. Eur. J. Oper. Res. 2003, 145, 304–316. [Google Scholar] [CrossRef]
- Qardaji, W.; Yang, W.; Li, N. Understanding hierarchical methods for differentially private histograms. Proc. VLDB Endow. 2013, 6, 1954–1965. [Google Scholar] [CrossRef]
- Maroufmashat, A.; Sattari, S. Estimation of natural gas optimum allocation to consuming sectors in year 2025 in Iran. Energy Sources Part B Econ. Plan. Policy 2016, 11, 587–596. [Google Scholar] [CrossRef]
- Alikhani, R.; Azar, A. A hybrid fuzzy satisfying optimization model for sustainable gas resources allocation. J. Clean. Prod. 2015, 107, 353–365. [Google Scholar] [CrossRef]
- Wang, T.; Lin, B. China’s natural gas consumption and subsidies—From a sector perspective. Energy Policy 2014, 65, 541–551. [Google Scholar] [CrossRef]
- Dagher, L. Natural gas demand at the utility level: An application of dynamic elasticities. Energy Econ. 2012, 34, 961–969. [Google Scholar] [CrossRef]
- Shahbaz, M.; Arouri, M.; Teulon, F. Short- and long-run relationships between natural gas consumption and economic growth: Evidence from Pakistan. Econ. Model. 2014, 41, 219–226. [Google Scholar] [CrossRef]
- Orlov, A. Distributional effects of higher natural gas prices in Russia. Energy Policy 2017, 109, 590–600. [Google Scholar] [CrossRef]
- Dayo, F.B.; Adegbulugbe, A.O. Utilization of Nigerian natural gas resources: Potentials and opportunities. Energy Policy 1988, 16, 122–130. [Google Scholar] [CrossRef]
- Boucher, J.; Smeers, Y. Alternative Models of Restructured Electricity Systems, Part 1: No Market Power. Oper. Res. 2001, 49, 821–838. [Google Scholar] [CrossRef]
- Orlov, A. An assessment of proposed energy resource tax reform in Russia: A static general equilibrium analysis. Energy Econ. 2015, 50, 251–263. [Google Scholar] [CrossRef]
- Zhu, X.; Yi, J.; Chen, S.; Jiang, H. A multi-objective algorithm for task scheduling and resource allocation in cloud-based disassembly. J. Manuf. Syst. 2016, 41, 239–255. [Google Scholar]
- Gazijahani, F.S.; Salehi, J. Stochastic multi-objective framework for optimal dynamic planning of interconnected microgrids. IET Renew. Power Gener. 2017, 11, 1749–1759. [Google Scholar] [CrossRef]


Publisher’s Note: MDPI stays neutral with regard to jurisdictional claims in published maps and institutional affiliations. |
© 2021 by the authors. Licensee MDPI, Basel, Switzerland. This article is an open access article distributed under the terms and conditions of the Creative Commons Attribution (CC BY) license (https://creativecommons.org/licenses/by/4.0/).