Abstract
In this paper, an expedited multi-criteria decision analysis framework, capable of tackling several dimensions for the choice of sanitation services, at an early planning stage is presented. The approach combines geographic information systems aided analysis for onsite solutions, with a multi-criteria decision analysis tool capable of suggesting and ranking several viable offsite treatment alternatives, according to the desired criteria. The framework was applied to four coastal cities in Northern Angola, one of the sub-Saharan countries of the west coast of Africa, thus obtaining an indication for city-wide solutions, as an aid to achieve the goal of ensuring full sanitation coverage in those four locations. It included possible onsite collection and storage interfaces, namely Ventilated Improved Pit latrines, fossa alterna, septic tanks or conventional sewer systems. The study also contributed to an informed decision regarding optimal offsite treatment facility type, namely based on dedicated or combined wastewater and faecal sludge treatment (co-treatment), as well as different options for locations and sanitation technologies. Alternatives were compared and ranked according to ten main criteria concerning social, economic, technological and environmental aspects. This work helped demonstrate the usefulness of decision-aiding tools in the multi-stakeholder and complex context of sanitation in a developing country.
1. Introduction
In many regions of the world, and typically in sub-Saharan Africa, urban sanitation services are incipient and too often fail to provide sustainable and continuing benefits to its users [1]. This lack of service sustainability is caused by multiple factors, such as global population growth, migration from rural to urban areas, governance issues and poor resource management, lack of civil engagement, as well as site specific cultural aspects, related to power structures and religious and political practices [2].
Urban sanitation can be broadly categorized under conventional drainage networks or as faecal sludge chains, which comprise sanitation solutions that are not connected to a sewerage system [3,4]. The former are more common in urban settings in developed countries, while the latter can frequently be found in a large portion of the African continent and Southeast Asia. An urban sanitation chain usually comprises four elements, namely: (a) on-site facilities (toilets, pit latrines, etc.), (b) extraction and transport (gravity sewers and rising mains in conventional systems, or manual sludge extraction and transport by a number of vehicles and containers for faecal sludge management systems), (c) treatment at wastewater treatment plants (WWTP) or faecal sludge treatment plants (FSTP), and (d) reuse (irrigation with disinfected wastewater or fertilizer use from bio-solids) or disposal [3,4].
Sanitation technologies can also be considered as wet or dry sanitation, referring to whether disposal of human excreta is made with or without use of water as a carrier [5,6].
In Angolan cities, conventional pipe-based drainage systems are generally insufficient, and date back to the colonial period, presenting severe degradation. Most of the cities comprise large peri-urban areas, where dry sanitation solutions prevail, mostly in the form of single or multi-family traditional latrines. Even so, it is estimated that only 66% of households in the country include adequate sanitation facilities [7].
The Angolan Energy and Water Section Action Plan (2018–2022) establishes priorities for the country’s development over that five year span, with the objective of eliminating open defecation by 2030, in alignment with target 6.2 of the United Nations (UN) Sustainable Development Goals, agreed in September 2015. The plan particularly focuses on studies on wastewater collection and sustainable treatment in province capitals and coastal cities. However, the country’s social and economic context (high housing density, low socio-economic status, unstructured spatial development and the country’s low human development index) presents a challenge for large scale implementation of expensive and energy demanding conventional systems, usually comprising sewer networks, pumping stations and treatment plants [7,8].
The absence of infrastructure may also present an opportunity for a paradigm shift towards more sustainable sanitation options. Alternatives to conventional large-scale infrastructure and sewer networks include more decentralized nature-based solutions (NBS) and faecal sludge management (FSM) chains, which can represent more affordable and viable solutions [9,10,11,12]. Nonetheless, city-wide planning of sanitation services involves multiple scales, in addition to a wide variety of stakeholders and available options, for on-site and off-site treatment technologies, and collection and transportation business models.
This process is rather complex, often presenting contrasting objectives, thus requiring the ability to make informed decisions at an early planning stage. In this context, several guidelines and multi-criteria decision analysis (MCDA) tools are being increasingly used in urban wastewater planning, with a number of MCDA models and tools being proposed in recent years [13,14,15,16]. In some sectors, such as waste management, for example, integration of Geographic Information Systems (GIS) capabilities with MCDA tools is of growing interest, for the ability to couple initial screening and site selection, with expert opinions [17,18]. This integration procedure allows for processing, evaluating and visualizing geographically referenced data, while simultaneously contributing to organizing decision problems, and defining, assessing and ranking possible alternatives [19]. Additional examples of MCDA models for sanitations systems can be found in Dinesh and Dandy [20], or Salisbury et al. [21], to name a few. These approaches focus on specific aspects of the sanitation chain, such as MCDA for wastewater treatment technologies [20], or on-site alternatives, such as VIP latrines and urine diversion dehydrating toilets [21].
The main challenges for application of such approaches to sanitation services refer mainly to:
- Integration of the different scales, namely on-site solutions (such as improved latrines, ventilated improved latrines, ecological latrines, fossa alterna, and septic tanks) with the intricacies of available treatment technologies (conventional intensive treatments versus extensive nature-based solutions; centralized versus de-centralized options);
- A combination of several services, i.e., the need to combine collection of wastewater inflows generated from highly populated areas with potable water access, with faecal sludge collection and transport from peri-urban areas with limited water access;
- The possibility of different service business models, namely in public and private sectors (where sludge collection and transport is often a possibility for small business development, while treatment infrastructure operation is usually carried out by larger public or private utilities).
Existing decision-aiding models and tools, while extremely informative and helpful, focus mostly on a single aspect of the sanitation service chain individually, without being really able to tackle its holistic dimension. Additionally, facilitated access to information regarding key aspects of sanitation solutions is crucial for an informed and accurately supported decision. These aspects may include investment, operation and maintenance (O&M) costs, estimates on area requirements or energy consumption, among other environmental and social aspects deemed relevant for decision makers, local communities and stakeholders.
As such, the main objective of the work presented in this paper is to demonstrate the development and application, to full scale case-studies, of a straightforward expedite multi-criteria framework, capable of dealing with several aspects lacking in similar sanitation-oriented MCDA models found in the literature, such as:
- The consideration of different scales, namely on-site sanitation and off-site treatment alternatives;
- The combination of dry and wet sanitation options;
- Simultaneous handling of wastewater and faecal sludge treatment;
- Reporting of performance assessment aspects related with sanitation solutions.
Choice of strategies and technologies was supported by a MCDA model entitled SETA (Social, Economic Technological and Environmental Multi-criteria tool, in Portuguese), initially developed for FSM in Mozambique [22]. The initial tool was specifically expanded and adapted for this project, to include the capability of comparison of different site locations, on-site user interfaces, faecal sludge (FS) collection and storage options, and a broader range of wastewater and faecal sludge treatment alternatives. The framework was designed for application at a feasibility study and concept design stage.
2. Methods
2.1. Multi-Criteria Framework SETA
2.1.1. General Approach
The MCDA framework SETA consists of a two-step approach, initialized by a GIS-based analysis to determine generic on-site options, which depend on water use per capita, population density and terrain elevation. It is then followed by a multi-criteria model to analyse different alternatives for offsite treatment options and locations, and rank them.
The baseline data of the scenarios under analysis, as well as preferences and potential local constraints, are provided by the user, which allows the definition of exclusion criteria for solutions, prior to the performance evaluation of each one. The evaluation continues with a performance assessment of each possible solution, against a set of previously defined indicators, which culminates in an overall score for each solution. A multi-criteria approach is then used to standardise the scales of indicators and ranking of possible solutions, in order to obtain the recommended solution as the final result, which corresponds to the alternative with the highest score.
The preference elicitation process consisted of several meetings and workshops, with stakeholders including national and regional wastewater service decision makers, as well as several sanitation experts involved in the wastewater treatment engineering processes in the region. This step allowed the identification of four main areas of concern, namely the social (S), economical (E), technical (T) and environmental (A) dimensions, divided into a total of ten fundamental criteria. These were considered the performance indicators to be addressed while choosing a sanitation solution, as represented in the value tree in Figure 1.
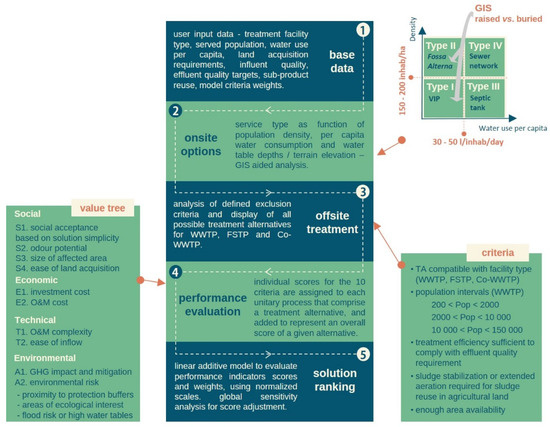
Figure 1.
SETA framework.
The model was implemented in Visual Basic for Applications (VBA) and is run using Microsoft Excel due to portability and user convenience reasons. It is started with an input form (illustrated in Figure 2) where the user is prompted to incorporate all relevant data regarding location, facilities and restrictions.

Figure 2.
Input data menu for sanitation options using the MCDA SETA model.
The following sections of the chapter expand on the methods used within the proposed SETA framework.
2.1.2. Definition of On-Site Options
In global terms, wastewater and faecal sludge transport options, on-site and off-site solutions were considered depending namely on: (i) local urban and population characteristics and, (ii) per capita water consumption.
Figure 1 (top right) shows the considered evolution of sanitation service type, according to population density and per capita water consumption, which served as base for this preliminary assessment. In case of high population density (over 150 to 200 inhabitants/ha), and per capita water consumption over 30 to 50 L/(inhab.day), the most adequate collection option considered was by conventional gravity sewer networks and off-site treatment (at a WWTP). This results from the assumption that, in this situation, available areas are insufficient to accommodate septic tanks and proper disposal areas, especially when higher water consumptions are expected.
In the remaining cases, on-site storage systems should be preferred, through adequate dry sanitation solutions, such as ventilated improved pit latrines (VIP), fossa alterna or ecological latrines. Above ground solutions should be considered depending on soil type and water table levels.
An open source GIS software was used (QGis) to identify neighbourhoods located in lower topographic levels, through digital terrain models (DTM), which may possibly be subjected to rising water table levels.
Due to a lack of more reliable sources, population densities were estimated based on housing density grids, taking into account an average occupancy of about 5–7 inhabitants per household [7] and 1–3 floors per building. GIS data were validated in the field with local focal points, whenever possible.
2.1.3. Off-Site Treatment Alternatives and Exclusion Criteria
A treatment alternative (TA) is considered as a complete line of combined unitary processes (UP) capable of full effluent or sludge treatment. These usually comprise of a stage of preliminary and primary treatment, secondary treatment and sludge treatment. Tertiary treatment (both for disinfection and nutrient removal) and sludge stabilization are included in some alternatives, if these stages are required as inputs by the user.
TAs are divided into three facility types, namely wastewater treatment plant (WWTP), faecal sludge treatment plant (FSTP) or combined treatment plant (Co-WWTP), when faecal sludge is treated simultaneously with liquid effluents. The model currently handles 96 TAs (see Tables S1 and S2 in Supplementary Materials for a list of all UP considered).
Population intervals (expressed in population equivalent, PE) were defined as follows: 200 < Pop 1 ≤ 2000; 2000 < Pop 2 ≤ 10,000; Pop 3 ≥ 10,000. The maximum population allowed for simulation is of about 150,000 PE for WWTP, on the hypothesis that larger capacity plants may skew model results, especially in what concerns costs and energy consumption, and as such should be analysed in greater detail. No population thresholds were defined for FSTP, given the lower per capita inflows.
In essence, TAs are excluded if the following criteria are not met:
- A TA is compatible with facility type defined by user (i.e., WWTP, FSTP, Co-WWTP);
- A TA is compatible with population interval (for example, Imhoff tanks and soil infiltration processes are only considered for < 10,000 PE);
- Effluent disinfection must be included in case of wastewater reuse scenarios;
- Treatment efficiency must be sufficient to comply with required effluent quality and legal discharge requirement;
- Anaerobic or aerobic sludge stabilization, dewatering and hygienisation are required for sludge application on agricultural land;
- The area required for facility is naturally compatible with the available area.
2.1.4. The Decision Modelling Process
A sequence of steps is initiated with the analysis of input data for the definition of treatment alternatives for a given simulation (1), followed by the exclusion of treatment configurations not compatible with desired scenarios (2), a performance evaluation of each possible solution (3), an MC analysis to obtain a ranking of alternatives (4), according to the desired criteria weights, as detailed below. A sensitivity analysis (5), should be carried out to evaluate the effect of preferred weights on the suggested solution. When using the tool, the recommended solution is highlighted, and the user can view a standard layout of the treatment facility corresponding to the best performing solution.
- (1)
- Decision alternatives
- (2)
- And exclusion criteria
These aspects, described in Section 2.1.3, result in a list of the main possible treatment alternatives for the desired scenario (taking into account population, effluent quality requirements, foreseeable sludge, wastewater reuse and area availability, among the other criteria).
- (3)
- Value functions and performance evaluation
For each TA, individual scores referring to the unitary processes that comprise it are calculated and then added to represent the overall score of that TA for indicators S3, E1, E2 and A1 (depicted in Figure 1). Energy use and treatment efficiency were also estimated for information and exclusion of TA purposes only. Unitary investment cost (USD/PE), area (m2/PE), O&M cost (USD/PE.yr.−1) and energy use (kWh.m−3) functions were obtained from a combination of sources, including roughly 40 Portuguese and Mozambican WWTP and FSTP projects, five Angolan water and wastewater treatment projects, as well as technical reports from Portuguese utilities [23,24], field studies for 17 WWTP performance indicators [25] and capital costs and other indicators obtained for developing countries [26,27,28]. Performance indicators were approximated as linear functions, varying in the three population intervals considered, except for economic indicators.
Investment costs (C1) were either modelled as an exponential equation in the form of Equation (1) or as Equation (2):
whereas O&M costs (C2) were modelled as Equation (3) or Equation (4), as follows:
as represented in Table S1 in Supplementary Materials for population interval Pop 3 (i.e., over 10,000 PE).
C1 (USD) = k Pop n,
C1 (USD) = a Pop2 + b Pop + c,
C2 (USD.yr−1) = d Pop + e,
C2 (USD.yr−1) = f Pop g,
Investment costs of all UP of a given TA sum up to about 60–70% of the overall value, with the remainder being considered for influent pumping, main operation building, exterior landscaping, piping and accessories. It should also be noted O&M costs include expenditures with plant personnel, energy, maintenance and chemicals. These costs vary over time and should be updated. Discount rate, r, capital opportunity cost or project’s minimum return rate means, in general, the profitability that the investor requires to implement a project, and may be expressed by Equation (5)
r = (1 + treal) × (1 + trisk) × (1 + tinfla) − 1
Being treal, the expected profitability, trisk and tinfla are the rates associated with risk and inflation, respectively. The net present value, PV, reflects the value, at the moment, of a revenue or expense that takes place in the future. Yearly total costs may be computed when all the parcels are updated to a reference year (usually year 0) through the discount rate. As such, PV may be obtained as a function of the future value (FV), the investment or O&M costs (C) applied in year n, and discount rate (r), as shown in Equation (6):
PV = FV/(C (1 + r) n)
Investment costs for WWTP and Co-WWTP in Mozambique and Angola were observed to be roughly 1.5–3.0 times those found in the aforementioned literature (mostly from Portugal, but also from countries like Brazil), whereas O&M cost estimates were found to be typically lower. This is mostly due to the fact that most materials and equipment need to be imported, whereas energy and labour costs (which comprise most of the O&M value) are lower. All four cities presented as case studies are provided with electricity from the electrical power grid. However, it should be noted that other remote areas in the country rely almost exclusively on diesel-powered generators as the main energy source, which would result in increased O&M costs. Therefore, and since the tool is intended to be flexible and applicable to other markets and realities, a cost adaptation parameter was included in the model, as to allow a more flexible use for different sites.
The evaluation of greenhouse gas (GHG) emissions (indicator A1) was adapted from the methodology developed by Godinho [29], where qualitative data was transformed into numerical data, on the assumption that reliable and transparent decision support is usually best achieved using numerical scores on a cardinal scale [30]. The overall GHG score for a given UP is obtained from the difference in GHG emission debit and credit, within a certain score range (from 0–neutral processes, to 3–significant debit/credit) and operation scope, as shown in Table S2 in Supplementary Materials. ‘Scope 1′ refers to direct emissions generated within the facility, resulting from fossil fuel burn or treatment processes, ‘Scope 2′ refers to indirect emission from energy usage (generated outside the facility), and ‘Scope 3′ refers to indirect emissions resulting from activities outside utility management/control. GHG credit occurs for UP conducing to effluent reuse.
Similarly, occupied area, energy usage and pollutant removal efficiency were calculated directly for each UP and added to account for a complete TA. Quality parameters include Chemical Oxygen Demand (COD), Biochemical Oxygen Demand (BOD5), Total Suspended Solids (TSS) and Faecal Coliforms (FC); their concentration in the treated effluent (Conc_Ef) is obtained by a mass balance between influent concentration (Conc_in), and an average removal rate (ri) at each UP, and then compared with discharge requirements inputted by the user (Equation (7)).
Conc_Ef = Conc_in − [Σ (1 − ri − 1) ri Conc_inf
The remaining criteria essential for performance evaluation (S4, T2 and A2) are directly inputted by the user as numerical data, based on personal perception, and are meant to be evaluated during the elicitation process, along with consultation with local experts and stakeholders, since these are likely to vary greatly.
S4 refers to land ownership (public or privately owned) and whether it is occupied or available. T2 is assessed based on: (a) the need for pumping stations and rising mains (measured in terms of number of PS, installed power and rising main length) for wastewater conveyance; or (b) accessibility and distance for sludge transport vehicles, in case of FSM. A2 is evaluated based on proximity to protected natural areas, floodplains, groundwater and erosion prone areas.
- (4)
- Ranking of TA
For the sake of simplicity and clarity, a linear additive model was chosen to evaluate performance indicator scores and weights, which implies that all indicators refer to the same unit, or alternatively, are represented across transformed preference scales before their weighted averages are calculated. Additionally, for TA ranking, objective functions were also defined for maximization (S1, S4, T1, and T2) or minimization (S2, S3, E1, E2, A1 and A2) of their individual score.
Scales were normalized using the empirical method, expressed on an interval of 0 to 10, where indicators whose score was subjected to maximization functions present a normalized (N) value, relative to the TA score (X) and the maximum (Vmax) and minimum (Vmin) values on the scale for any given criteria, obtained by Equation (8).
N= 10 (X − Vmin)/ (Vmáx − Vmin)
The scale is inverted for indicators whose value is intended to be minimized. Vmax and Vmin were established for every indicator according to the best or worst performance for each solution. Criteria preference weights were defined on a scale of 0 to 100.
- (5)
- Global sensitivity analysis (GSA) for score adjustment
A semi-informal and iterative process was carried out to evaluate the ranking of TA and overall preference of recommended solutions, in an attempt to adjust scores and weights. The latter was evaluated using the ‘swinging method’, resulting in the default methods recommended by the model. Nevertheless, during that process it was found it could be useful if the decision support tool being developed would allow the user the option to input other weights, hence that option was included.
For each of the four case studies the model was applied in two stages, with different objectives, namely: (i) to demonstrate, suggest and validate viable Treatment Alternatives for off-site solutions and (ii) to carry out a performance assessment and ranking of each alternative.
2.2. Case Study Sites: Lândana, Cabinda, Soyo and N’Zeto
2.2.1. Brief Description
All four case studies are coastal towns located in Northern Angola (Figure 3). In peri-urban areas, dry sanitation solutions prevail, mostly in the form of traditional pit latrines.

Figure 3.
Location of the project areas in the four cities and main off-site treatment alternatives considered.
Soyo is a city with a heavy presence of the oil and gas industry. With an area of about 3097 ha, the city develops on the left bank of the Congo River estuary. The region presents one of the largest mangrove ecosystems in Angola. Peri-urban informal settlements are common near these water bodies, which combined with a lack of safe access to water and sanitation, contribute to a strong incidence of gastrointestinal diseases, including outbreaks of cholera in recent years (2016/2017) [31].
Existing wastewater collection systems are quite degraded, dating back to the colonial period. The population to be served with sanitation services in the design period of 2040 is estimated at about 252,000 inhabitants.
Cabinda is the capital city of the Cabinda province, an Angolan enclave bordered by the Republic of Congo and the Democratic Republic of Congo. The city presents a total area of about 91 km2 and sanitation services in 2040 are intended to serve about 1,000,000 inhabitants. Steep hills surrounding the city centre are occupied by informal settlements, with difficult vehicle access for sludge collection, where pit latrines or open defecation are the most common practices. In urbanized central areas, septic tanks are available in larger commercial and residential buildings, and institutional establishments such as schools, health units and hotels. However, the city’s water courses and stormwater channels are often used for direct discharge of untreated wastewater and deposition of urban waste.
Lândana and N’Zeto are smaller towns, with populations to be served of about 30,000 and 50,000 inhabitants, respectively. Lândana is roughly 5 km2, located in the Bay of Lândana, in an area characterized by steep ravines and coastal erosion. N’Zeto, mainly a fishing village, is characterized by sandy beaches, with some sea influenced lagoons and salt pans. Both towns rely on dry sanitation solutions in most neighbourhoods, with occasional septic tanks in consolidated areas with piped water supply. In Figure 3, schematic locations of main offsite treatment alternatives per town are presented. In this figure, Septic means septic tank, CW, constructed wetland, WWTP, Wastewater Treatment Plant, FSTP, dedicated Faecal Sludge Treatment Plant and Co-WWTP, sludge and wastewater co-treatment facility.
2.2.2. Summary of the Decision Problem
For all four cities the decision problem involved multiple dimensions, namely onsite sanitation facilities (wet and dry options), off-site treatment alternatives, dedicated wastewater and faecal sludge treatment versus co-treatment, and site selection for the location of treatment facilities. Each alternative entails site specific aspects, such as distance to water sources or natural resources, or potential odour nuisance to neighbouring communities, to name a few, which present different scores in the criteria presented in the value tree in Figure 1.
In addition, some baseline assumptions were defined from the start and during elicitation processes, namely to: (a) avoid resettlements and expropriations, (b) avoid or restrict interventions in protected areas or servitude of other infrastructure, (c) avoid or restrict interventions in areas with high risk of erosion and flooding, (d) ensure the quality of treated effluents comply with legislation thresholds, (e) minimize the impact of offensive odours and (f) maximize the potential end use of WWTP/FSTP by-products (water and bio-solids).
3. Results
3.1. GIS Aided Analysis for On-Site Solutions
Results regarding the first step of the SETA approach refer to the GIS-aided pre analysis for on-site sanitation solutions, as exemplified in Figure 4 for Soyo town, for illustration purposes (the same approach was used for the remaining cities). The main results of this step refer to identifying the percentage of population to be served with on-site faecal sludge systems, as well as a recommendation of what type of generic solutions to adopt.

Figure 4.
GIS pre analysis for spatial distribution of on-site sanitation solutions in Soyo town.
Areas where elevated water table levels may occur frequently, represented in light green, were considered for elevated solutions, such as elevated VIP latrines or fossa alterna. Regarding population density, areas with higher density and piped water supply (grid P1 in Figure 4) were considered for conventional wastewater collection networks. On the other hand, underground simpler solutions were foreseen for areas with scarcer population and no risk of aquifer contamination (as shown in grid P10 in Figure 4).
Similar outcomes were obtained for the remaining cities, albeit terrain levels were adjusted to approximate local water table levels, and existing and projected piped water supply projects were analysed individually for each location.
3.2. Evaluation of Viable Off-Site Treatment Alternatives
Following the definition of on-site solutions, the outputs of the first stage of the decision model refer to viable off-site treatment solutions for each location. As an example, Table 1 shows input data used for the assessment of viable treatment alternatives (WW refers to population served by conventional wastewater collection systems, while FS refers to population served by faecal sludge collection). All interventions were divided into priority interventions (end of design period in 2040) and subsequent interventions, planned for an expansion phase (investments to be carried out in 2035–2040, considering 2060 the end of the design period).

Table 1.
Main inputs for analysis of treatment alternatives for all four case study sites.
Table 2 summarizes the alternatives and main aspects taken into account in the decision process, to be evaluated in the second stage of the SETA model application, in terms of alternative performance assessment and ranking. It should be noted that all treatment alternatives must comply with Angolan wastewater discharge requirements for nitrogen removal, regardless of the nature of receiving waters (which reduces the number of viable treatment alternatives presented to the user).
Table 2.
Summary of off-site treatment decision aspects.
A total of 12 alternatives were considered for Soyo, and four alternatives for each of the remaining cities/towns (Cabinda, N’Zeto and Lândana).
Soyo being the city with the most alternatives for the decision process, will be used as a detailed example throughout this chapter and summary conclusions regarding the other case studies will be provided.
3.3. Performance Evaluation and Solution Ranking
Table 3 shows input data used for assessment and ranking of sanitation alternatives for Soyo, in terms of treatment facility number and locations, main treatment process, as well as land acquisition (S4), collection simplicity (T2) and environmental risk (A2).
Table 3.
Input data for alternative assessment and ranking for Soyo.
Table 4 shows the result of the performance assessment of each alternative included in the decision process, in terms of estimates for area occupancy, energy use, costs and impact on climate change (conservatively considering a cost adjustment factor of 2.75, for illustration).
Table 4.
Performance summary of sanitation alternatives (Soyo).
Evaluation of the 10 criteria for each alternative is shown in Table 5, which represents the normalized value N for each criterion.
Table 5.
Criteria evaluation of alternatives under consideration (Soyo).
For demonstration purposes, the detailed calculation of the balance sheet regarding impact on climate change, indicator A1-GHG impact and mitigation, is presented for Alternative 1C (Table 6). The same approach is used for all other alternatives in the decision analysis process (see Tables S3 and S4 in Supplementary Materials for details).
Table 6.
Balance assessment for indicator A1 for Alternative 1C (Soyo).
Since scale minimum and maximum values for this indicator range from 5 to 30, the standard value obtained for this indicator is thus 8.4 (rounded up to 9 conservatively), which translates into the category of Negligible GHG emissions.
The final result of the overall performance of alternatives is obtained taking into account the abovementioned score, weighted for each criterion. For this project, two scenarios were carried out with different weights, as a sensitivity analysis to the model. Table 7 shows evaluation results considering the following weights: social (S1 to S4)–20%, investment (E1)–10%, O&M costs (E2)–30%, technical (T1 to T2)–20% and environmental (A1 and A2)–20%.
Table 7.
Overall performance scores (Soyo).
It should be kept in mind that option 1C is the only alternative considering co-treatment of effluents (liquid and faecal sludge), thus requiring a single facility. All other options refer to separate treatment facilities for WWTP and FSTP, and were presented individually for comparison between alternatives in each category. However, they are to be analysed together, meaning they require an average score from a combination from one WWTP and one FSTP alternative. As such, preference was given to a single location, which obtained the highest overall score of 6.07.
The same method was applied to the remaining cities, where the following main results were obtained, regarding the preferred solution:
- Cabinda–the solution with the best overall performance assessment, referred to a NBS WWTP, located in an agricultural valley due to the larger area requirements for pond treatment and a FSTP located near the existing waste dumping site, due to possible requalification of the area and synergies with solid waste transport routes. Future system expansion with another WWTP is foreseen.
- N’Zeto–a co-WWTP, located near a cemetery site further from existing households, natural ponds and salt pans, with final discharge to a river downstream of a fish farm.
- Lândana–a co-WWTP located in a deactivated quarry, with opportunity for site recovery, with final discharge to a river, downstream from a water collection point used by the local population.
Regarding on-site solutions, both N’Zeto and Lândana present lower risk for aquifer contamination, seeing as terrain elevation is higher than 5 m in most areas, thus raised solutions were not proposed. Concerning sludge transport, these towns are also quite small, therefore no transfer stations (TS) were deemed necessary by experts and stakeholders. Cabinda, on the other hand, is the largest city in the study. Several areas of topographic levels below 5 m were identified, as well as the need for 6 TS, to minimize the distance to be covered by operators responsible for initial faecal sludge collection and transport. Figure 5 represents a summary of the main components of the system proposed for the three cities. All areas not served with conventional piped systems are to be covered with FSM solutions.
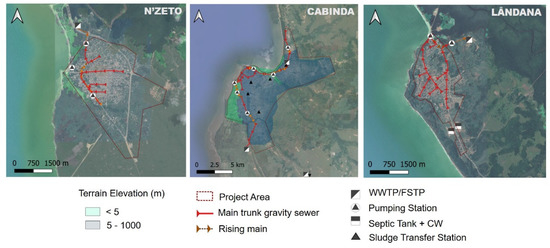
Figure 5.
Summary of main sanitation components for N’Zeto, Cabinda and Lândana.
4. Discussion
In terms of evaluating options for on-site solutions in a broad perspective, this approach is useful given it allows a relatively simple and quick way to understand and communicate the spatial distribution of proposed solution types, according to a set of parameters. This facilitates mobilization of local teams and resource allocation for locally sourced materials.
The chosen parameters, namely (a) distance to water tables, inferred by ground levels, (b) population density and (c) water consumption per capita, analysed by the existence of piped water supply, were defined due to their simplicity to obtain, especially in countries where data access may be a challenge at a service planning stage. These allow for consideration into health and environmental protection issues (such as potential contamination of underground water sources), as well as technical aspects regarding expected inflows. Higher population densities and water consumption lead to increased wastewater flows, which may hint at the necessity for a more conventional pipe based collection system. The defined thresholds of 30–50 L/inhab.day for water consumption and 150–200 inhab/ha were found to be optimal to the Angolan context, especially in the cities under consideration for the project. Nonetheless, these may be calibrated to better reflect diverse realities with different peri-urban spatial configurations, while the overall approach still remains valid.
Regarding possible off-site treatment facilities, only treatment alternatives that allow compliance with required effluent quality are presented to the user. It is observable by Table 5 and Table 7 that more conventional intensive approaches (solutions A and B of activated sludge treatment with separate anoxic and aeration tanks, as well as combined nitrification/denitrification in oxidation ditches) perform better in categories related to area occupancy. NBS, typically pond, constructed wetland or hybrid systems, require extensive areas. Nonetheless, these alternatives are much less energy demanding, require less reagent consumption, present simplified maintenance and operation needs, and technical skills and knowledge. For these reasons, these solutions (namely alternative 1C, and alternatives FSTP1 to FSTP3) perform higher in indicators S1, E1, E2, T2 and A1.
Social acceptance of treatment facilities (S1) is assessed based on preference. In the present work, NBS were preferred as the general approach to treatment options. However, if applying the model to other realities and consulting different stakeholders, individual scores for UP may need adjustment, when conventional approaches are clearly preferred over NBS.
The perception of environmental risk is related to a set of parameters which refer mainly to the location of treatment infrastructure, rather than treatment technology. As such, the allocated scores (Table 3 and Table 5), which clearly benefited solutions 1C and all locations for the FSTP, were assigned based on distance from mangroves, protected areas and flood risk prone areas. On the other hand, performance of each alternative regarding more complex criteria, namely odour potential, energy and costs, is estimated within the model, and presented to decision makers and stakeholders.
This process illustrates the usefulness of preference elicitation and stakeholder involvement in solution acceptance. The fact that the MCDA model includes an option to allocate different weights for the main categories, allows for consultation sessions and analysis of different outcomes, according to different perceptions of importance. As an example, investment costs may not be perceived as important if a particular project has already been funded; however, simplicity in O&M and technological options may be crucial in locations with little institutional history and expert knowledge/experience. In fact, this preference was observed during initial model development in Mozambique [22], as well as during its expansion and application to the current case study.
The suggested framework may be seen as a step forward from existing well-established guidelines in the literature [16,17], as the model may be applied to specific cases and sites, thus allowing a more tailored approach, that includes both wastewater and faecal sludge management options.
Regarding future developments, several aspects may justify further research and development. The presented model may be expanded to include additional treatment alternatives and viable technologies, as these become available or demonstrate superior performance.
Indicator A1, intended to reflect the impact on climate change, evolved from the approach first proposed by Godinho [29]. Nonetheless, it still refers solely to a semi-quantitative evaluation. A possible evolution could be a tentative computation of GHG emissions per unit process.
The MCDA model could also include more decision aid modules regarding collection methods and transport. Nonetheless, this would present the challenge of becoming too complex and overlook site specific aspects.
5. Conclusions
The process of decision making in choice of adequate sanitation services and alternatives is a complex task, involving multiple challenges, stakeholders and, often conflicting objectives. The work carried out allowed reaching the following main conclusions:
- The consultation and preference elicitation process is crucial in complex city-wide problems, involving many decision makers and affected populations;
- Within the urban sanitation context in developing countries, MCDA models need to be able to include its different categories (i.e., conventional systems and FSM), as well as most aspects of the sanitation chain, since it was found likely that the optimal preferred solution will result from a combination of approaches, rather than one single aspect;
- Model simplicity is key for effective communication and presentation of alternatives and model results to stakeholders;
- Inclusion of NBS treatment alternatives was very relevant for the Angolan context, in terms of economic and technical performance of such technologies, due to their low energy demands and little skills required for O&M activities;
- The developed multi-criteria framework was demonstrated to be efficient as a decision-aiding tool, applied to four cities in Angola, with different urban scales and viable sanitation alternatives.
As such, the proposed framework allowed for a more effective and practical communication method, capable of including different scales and aspects of the sanitation service, ultimately leading to better informed decisions. Nonetheless, the model may be continuously expanded. Additional treatment alternatives may be added, as well as new fundamental concerns that may arise from stakeholder engagement in other realities. Future research may also focus on improving the method for GHG impact quantification, as well as on including different sludge collection and transport options.
Supplementary Materials
The following are available online at https://www.mdpi.com/article/10.3390/su13105627/s1, Table S1: Investment and O&M cost parameters used in SETA for population interval Pop 3 (≥10,000 PE), Table S2: Unit area per treatment process and GHG emission/credit parameters used in SETA, Table S3: Overall TA performance for A1 GHG emission/credit parameters Table S4: Energy consumption per unit operation used in SETA.
Author Contributions
R.V.M.: conceptualization, methodology, writing—original draft preparation. F.F.: conceptualization, writing—reviewing and editing. L.A.: project administration. E.R.: project administration. L.C.: project administration. J.S.M.: conceptualization, supervision. All authors have read and agreed to the published version of the manuscript.
Funding
This research received no external funding.
Acknowledgments
The project, funded by the African Development Bank (AfDB), was developed by Studi/Serambi, with specialized consultancy by Hidra–Hidráulica e Ambiente, and managed by the National Water Directorate (DNA) of the Republic of Angola.
Conflicts of Interest
The authors declare no conflict of interest.
References
- Jiménez, A.; Jawara, D.; LeDeunff, H.; Naylor, K.A.; Scharp, C. Sustainability in Practice: Experiences from Rural Water and Sanitation Services in West Africa. Sustainability 2017, 9, 403. [Google Scholar] [CrossRef]
- Silvestri, G.; Wittmayer, J.M.; Schipper, K.; Kulabako, R.; Oduro-Kwarteng, S.; Nyenje, P.; Komakech, H.; Van Raak, R. Transition Management for Improving the Sustainability of WASH Services in Informal Settlements in Sub-Saharan Africa—An Exploration. Sustainability 2018, 10, 4052. [Google Scholar] [CrossRef]
- Medland, L.S.; Scott, R.E.; Cotton, A.P. Achieving sustainable sanitation chains through better informed and more systematic improvements: Lessons from multi-city research in Sub-Saharan Africa. Environ. Sci. Water Res. Technol. 2016, 2, 492–501. [Google Scholar] [CrossRef]
- Daudey, L. The cost of urban sanitation solutions: A literature review. J. Water Sanit. Hyg. Dev. 2018, 8, 176–195. [Google Scholar] [CrossRef]
- Lourenço, N.; Nunes, L.M. Review of Dry and Wet Decentralized Sanitation Technologies for Rural Areas: Applicability, Challenges and Opportunities. Environ. Manag. 2020, 65, 642–664. [Google Scholar] [CrossRef] [PubMed]
- Scott, E. Dry sanitation solutions. J. Rural Remote Environ. Health 2002, 1, 23–25. [Google Scholar]
- INE–Instituto Nacional de Estatística. Resultados Definitivos do Recenseamento Geral da População e da Habitação de Angola 2014 (In English: Final Results of the General Population and Housing Census of Angola 2014)–Instituto Nacional de Estatística. Available online: www.ine.gov.ao (accessed on 12 December 2019).
- Cain, A. Water Resource Management under a Changing Climate in Angola’s Coastal Settlements; IIED Working Paper; IIED Publishing: London, UK, 2017. [Google Scholar]
- Garfí, M.; Flores, L.; Ferrer, I. Life Cycle Assessment of wastewater treatment systems for small communities: Activated sludge, constructed wetlands and high rate algal ponds. J. Clean. Prod. 2017, 161, 211–219. [Google Scholar] [CrossRef]
- Strande, L.; Ronteltap, M.; Brdjanovic, D. Faecal Sludge Management-Systems Approach for Implementation and Operation; IWA Publishing: London, UK, 2014. [Google Scholar] [CrossRef]
- Galvão, A.; Matos, J.; Rodrigues, J.; Heath, P. Sustainable sewage solutions for small agglomerations. Water Sci. Technol. 2005, 52, 25–32. [Google Scholar] [CrossRef] [PubMed]
- Rizzo, A.; Bresciani, R.; Martinuzzi, N.; Masi, F. French Reed Bed as a Solution to Minimize the Operational and Maintenance Costs of Wastewater Treatment from a Small Settlement: An Italian Example. Water 2018, 10, 156. [Google Scholar] [CrossRef]
- Zheng, J.; Egger, C.; Lienert, J. A scenario-based MCDA framework for wastewater infrastructure planning under uncertainty. J. Environ. Manag. 2016, 183, 895–908. [Google Scholar] [CrossRef] [PubMed]
- Sadr, S.M.; Saroj, D.P.; Mierzwa, J.C.; McGrane, S.J.; Skouteris, G.; Farmani, R.; Kazos, X.; Aumeier, B.; Kouchaki, S.; Ouki, S.K. A multi expert decision support tool for the evaluation of advanced wastewater treatment trains: A novel approach to improve urban sustainability. Environ. Sci. Policy 2018, 90, 1–10. [Google Scholar] [CrossRef]
- Tilley, E.; Ulrich, L.; Lüthi, C.; Reymond, P.; Zurbrügg, C. Compendium of Sanitation Systems and Technologies, 2nd ed.; Swiss Federal Institute of Aquatic Science and Technology (Eawag): Dübendorf, Switzerland, 2014. [Google Scholar]
- Lüthi, C.; Morel, A.; Tilley, E.; Ulrich, L. Community-Led Urban Environmental Sanitation Planning: CLUES-Complete Guidelines for Decision-Makers with 30 Tools; Swiss Federal Institute of Aquatic Science and Technology (Eawag): Dübendorf, Switzerland; WSSCC: Geneva, Switzerland; UN-HABITAT: Nairobi, Kenya, 2011. [Google Scholar]
- Chang, N.-B.; Parvathinathan, G.; Breeden, J.B. Combining GIS with fuzzy multicriteria decision-making for landfill siting in a fast-growing urban region. J. Environ. Manag. 2008, 87, 139–153. [Google Scholar] [CrossRef] [PubMed]
- Schoebitz, L.; Bischoff, F.; Lohri, C.R.; Niwagaba, C.B.; Siber, R.; Strande, L. GIS Analysis and Optimisation of Faecal Sludge Logistics at City-Wide Scale in Kampala, Uganda. Sustainability 2017, 9, 194. [Google Scholar] [CrossRef]
- Sadeghi-Niaraki, A.; Jelokhani-Niaraki, M.; Choi, S.-M. A Volunteered Geographic Information-Based Environmental Decision Support System for Waste Management and Decision Making. Sustainability 2020, 12, 6012. [Google Scholar] [CrossRef]
- Dinesh, N.; Dandy, G.C. A decision support system for municipal wastewater reclamation and reuse. Water Supply 2003, 3, 1–3. [Google Scholar] [CrossRef]
- Salisbury, F.; Brouckaert, C.; Still, D.; Buckley, C. Multiple criteria decision analysis for sanitation selection in South African municipalities. Water SA 2018, 44. [Google Scholar] [CrossRef]
- Matos, R.V.; Ferreira, F.; Matos, J.S.; Júnior, R.; Bakker, G. Multi-criteria decision analysis model for sanitation options in the city of Tete, Mozambique. In Proceedings of the 2nd EWA Spring Conference–Sanitation Approaches and Solutions and the Sustainable Development Goals, Lisbon, Portugal, 10–11 May 2017. [Google Scholar]
- Águas de Portugal. Soluções Tipo para Pequenas Instalações de Tratamento de Águas Residuais. Relatório Técnico. DT AdP–04.01-00. In Standard Solutions for Small Wastewater Treatment Facilities-Tech Report; AdP: Lisbon, Portugal, 2002. [Google Scholar]
- Covas, D.; Monteiro, A.J.; Teixeira, A.T.; Cabeças, A.; Barros, C.; Figueiredo, D.; Pena, J.; Mamouros, L.; Amado, M.C.; Cabral, M.; et al. Custos de Referência de Infraestruturas do Ciclo Urbano da Água, de Valorização de Resíduos Urbanos Sólidos e de Proteção da orla Costeira (in English: Reference Costs of Infrastructure for the Urban Water Cycle, Recovery of Solid Urban Waste and Coastal Protection); Relatório Final–Volume II, Instituto Superior Técnico (IST)-Programa Operacional para a Sustentabilidade e Eficiência no Uso de Recursos (POSEUR); ERSAR: Lisboa, Portugal, 2015. [Google Scholar]
- Silva, C.; Rosa, M.J. Energy performance indicators of wastewater treatment: A field study with 17 Portuguese plants. Water Sci. Technol. 2015, 72, 510–519. [Google Scholar] [CrossRef] [PubMed]
- Von Sperling, M. Princípios do tratamento biológico de águas residuais. In 2ª Edição–Lagoas de Estabilização; Universidade Federal de Minas Gerais: Belo Horizonte, Brazil, 2002; Volume 3, ISBN 85-85266-06-6. [Google Scholar]
- Von Sperling, M.; Salazar, B.L. Determination of capital costs for conventional sewerage systems (collection, transportation and treatment) in a developing country. J. Water Sanit. Hyg. Dev. 2013, 3, 365–374. [Google Scholar] [CrossRef]
- Libhaber, M.; Orozco-Jaramillo, A. Sustainable Treatment and Reuse of Municipal Wastewater–for Decision Makers and Practicing Engineers; IWAP: London, UK, 2012; p. 576. ISBN 9781780400167. [Google Scholar]
- Godinho, F.; Godinho, C. Redução das Emissões de GEE no Tratamento de Águas Residuais Um Roteiro de ação Para Entidades Gestoras. Águas Resíduos 2017. [Google Scholar] [CrossRef]
- Dodgson, J.S.; Spackman, M.; Pearman, A.; Phillips, L.D. Multi-Criteria Analysis: A Manual; Department for Communities and Local Government: London, UK, 2009; ISBN 9781409810230.
- MSF–Médecins Sans Frontiérs International Activity Report 2017. Available online: https://www.msf.org/sites/msf.org/files/2018-08/msf-international-activity-report-2017_1.pdf (accessed on 15 March 2021).
Publisher’s Note: MDPI stays neutral with regard to jurisdictional claims in published maps and institutional affiliations. |
© 2021 by the authors. Licensee MDPI, Basel, Switzerland. This article is an open access article distributed under the terms and conditions of the Creative Commons Attribution (CC BY) license (https://creativecommons.org/licenses/by/4.0/).