Abstract
The case study for this analysis is Henan province in China, where sustainability is a central issue for tourism development due to the area’s enormous and unexploited potential for cultural tourism. We construct a cultural tourism industry competitiveness evaluation index from cultural resource competitiveness, economic development support competitiveness, ecological environment competitiveness and basic guarantee competitiveness, and also construct a tourism flow evaluation index from tourist flow, consumption flow and effect flow. For this study, we then adopt an Entropy-TOPSIS and Coupling Coordination model to analyze the characteristics of coupling and coordinated development of them from 2009 to 2019. The empirical results show that (1) the comprehensive development index of cultural tourism industry competitiveness and tourism flow exhibits a fluctuating rise trend and maintains good development momentum; and (2) the coupling coordination degree between the cultural tourism industry competitiveness and tourism flow in Henan Province as a whole is gradually improving and the coupling coordination level developed from extreme disorder to grudging coordination, but it is unpromising in some parts of cities. Some recommendations are provided to promote the coupling and coordinated development of cultural tourism industry competitiveness and tourism flow for cities.
1. Introduction
As a worldwide export category and a key sector of the world economy, tourism plays an increasingly critical role in creating job opportunities, generating huge revenues and promoting economic prosperity. It has been acknowledged that tourism contributes immensely to economic growth and development [1]. According to the World Travel and Tourism Council (WTTC) report in 2019, tourism contributed 10.4% of the world’s gross domestic product (GDP), produced 319 million jobs (10% of total employment), and a share of approximately 6.5% of total global exports [2]. In addition, the international tourism revenue and the number of international tourists rose rapidly during the period between 2005 and 2018. Specifically, the former increased from USD 811 billion to USD 1.65 trillion, and the latter increased from 823 billion to 1400 billion people (UNWTO, 2019). With the development of tourism and the growth of disposable income, individuals have greater expenditures on travel itineraries, and they have higher expectations and requirements for tourist destinations [3,4]. This phenomenon has intensified the fierce competition within the tourism industry, because only the most competitive destinations are likely to grow [4,5]. As a result, tourist destinations are increasingly trying to find new ways to gain a competitive advantage to attract more tourists [6,7,8,9]. Previous studies have identified different factors that are beneficial to building the competitive advantage of a destination, including problem recognition skills [10], branding [11], advertising [12], green initiatives [13] and service customization [14].
Coupling, a concept in physics, is used to describe the phenomenon when two or more systems produce a joint relationship through various interactions [15]. Coupling degree is an index used to evaluate the degree of mutual influence and interaction between systems. If the components of systems are interdependent, coordinated and promoted, there is a coordinated development relationship between the systems, that is, their coupling degree is high. The value of coupling directly reflects the association degree between the two systems, and the larger the value, the stronger the association between them. As the growing importance of the tourism industry has continued to grow, the issue of the coupling and coordination relationship between tourism and other industries has received more attention from researchers. For example, Yu and Liu [16] built a comprehensive evaluation index of tourism demand and supply, and used the coupling coordination model to measure their coupling coordination development level; Wang and Liu [17] examined the relationship between tourism competitiveness and economic growth of 56 developing countries from 2008 to 2017; and Wu, Jiao, and Ye [18] and Guo, Mu, and Ming et al. [19] analyzed the spatio-temporal characteristics of coordinated development between tourism economy and transportation. In summary, previous studies mainly focused on discovering the relationship between tourism and regional economies, tourism and environment, tourism and economic structure adjustment, etc.
Culture and tourism have always been inextricably linked; cultural attractions and historical events provide important motivations for tourism, and tourism itself produces culture [20]. Recognized by many counties and regions as the most promising green and low-carbon sunrise industry, the cultural tourism industry has unique advantages that can help optimize the economic structure, transform the development mode, and improve development quality. It integrates industries of culture and tourism and has become one of the mainstream elements of tourism development [21]. Cultural tourism industry competitiveness is a tool to measure the competitiveness of a destination’s cultural tourism industry, it reflects a destination’s ability to highlight its own attractiveness to tourists and to provide tourists with goods and services better than other destinations, it also reflects the supply capacity of the tourism industry to a certain extent [22]. Tourism flow is the tourist flow, information flow and material flow between different destinations, it is an important manifestation of tourism demand [16,22]. From the perspective of supply and demand in the tourism industry, cultural tourism industry competitiveness and tourism flow are powerful representations of the interaction between supply and demand in the process of tourism destination development. Research on cultural tourism industry competitiveness mainly focuses on its concept, evaluation index and promotion strategy, and research on tourism flow mainly focuses on its concept, space-time characteristics, network structure, influencing factors and development prediction [22,23,24].
The good coupling and coordinated development relationship between cultural tourism industry competitiveness and tourism flow can not only promote the positive interaction between cultural industry and tourism industry, but also promote the sustainable development of regional tourism industry and enhance the competitiveness of tourism destination. However, at present, only a handful of studies to explore the correlation between cultural tourism industry competitiveness and tourism flow [25,26], and few scholars consider their coupling and coordinated development characteristics. To fill this gap, this study looks at the Henan Province in China, and attempts to assess its coupling and coordinated development level through an empirical analysis. The conclusion of this study has important research value and significance. On one hand, it can guide similar cities to effectively use their rich tourism resources and improve the coordinated development level of their cultural tourism industry competitiveness and tourism flow. On the other hand, this study also helps to address the lack of existing research and provides new evidence for the relationship between cultural tourism industry competitiveness and tourism flow from a broader perspective.
The remainder of this paper is organized as follows: Section 2 introduces the literature related to the cultural tourism industry competitiveness, tourism flow and the application of Coupling Coordination between tourism industries. Section 3 briefly presents sample description, the evaluation index of cultural tourism industry competitiveness and the evaluation index of tourism flow, and the related methods. Section 4 discusses the empirical findings. Section 5 concludes this study and outlines its future prospects.
2. Literature Review
2.1. The Literature Related to the Cultural Tourism Industry Competitiveness
Cultural tourism is a new form of tourism; it includes visiting historical sites, appreciating the art of different nations, experiencing traditional culture, looking at famous relics and taking part in various cultural activities [24]. The connection between culture and tourism has been clearly identified as cultural tourism in recent decades [20]. However, there are significant differences in the interpretations of the cultural motivation of tourists, which are reflected in the variety of definitions of cultural tourism [21]. According to the Cultural Tourism Charter (International Council on Monuments and Sites, ICOMOS, 1976), one purpose of cultural tourism is to discover and better understand historical and artistic monuments and sites. This initial definition shows the proximity of cultural and commemorative tourism, although cultural tourism usually involves other activities and experiences besides visiting historical and artistic sites. Later, many scholars put forward a variety of definitions of cultural tourism. Richards [27] asserts that cultural tourism has a conceptual definition and a technical definition; the conceptual definition refers to “the flow of people from their normal residence to cultural attractions, with the aim to collect new information and experience to meet their cultural needs”, and the technical definition refers to “all movements of people to specific cultural attractions, such as heritage sites, cultural expressions, arts and drama outside of their normal residence”.
Cultural tourism is the integration and development of cultural resources and tourism, it involves many fields such as culture, economy and politics [20]. Researchers have more or less reached a consensus that cultural tourism is a type of tourism activity where people’s basic motivation is to learn, discover, experience and consume tangible and intangible cultural attractions/products of tourist destinations [28,29]. Competitiveness is the ability of an entity to design, produce and provide market products that that are more attractive than their competitors’ products. It is an effort to obtain sustained profitability, usually, beyond the industry average [30,31]. Cultural tourism industry competitiveness is a tool to measure the competitiveness of a destination’s cultural tourism industry; it reflects the ability of a tourist destination to highlight its appeal to tourists and to provide them with better goods and services than other destinations [12].
2.2. The Literature Related to Tourism Flow
Tourism flow is the projection of tourists in a destination space and the external manifestation of tourist needs. It has a narrow sense and a broad sense. The narrow sense refers to tourist flow, and the broad sense includes information flow, capital flow, trade flow, etc. [32]. As an important aspect of tourism geography research, the study of tourism flow helps to reveal the spatial movement of tourists and their social, economic and environmental effects. Existing studies on tourism flow mainly focus on the concept, theoretical framework [33], spatial characteristics [34] and influencing factors [35]. More in-depth research has gradually revealed the influence of tourism resources, transportation development, level of regional economic development and level of tourism service reception on the structural characteristics of the tourism flow network [36]. At the same time, scholars have begun to focus more attention on the interaction between tourism destinations and tourism flow and have proposed countermeasures for regional tourism development. For example, taking 17 cities of Anhui Province as an example, Zhang, Pan and Yang [25] studied the relationship between tourism resource competitiveness and tourism income. Li and Tian [26], using the Pearl River Delta as an example, analyzed the link between tourism resource competitiveness and tourism development level. Furthermore, in recent years, there has been a strong increase in competition between cultural tourism destinations attempting to attract tourists by offering a complete travel experience [1]. Many scholars have emphasized the vitality of destination competitiveness in attracting tourists [5,14,37,38]. Countries that aim to become popular destinations for international tourists are usually required to make greater efforts in establishing their competitive advantages [30].
2.3. Application of Coupling Coordination between Tourism Industries
There are relationships of competition and cooperation between different industries, which are interrelated and complementary to each other [39]. To address this problem, scholars have introduced the concept of coupling into studies on industrial interaction relationships. One of the core aims is to use the coupling model to evaluate coupling and coordination relationships and propose countermeasures based on the evaluation results. Industrial coupling not only involves the sharing and integration of technology and knowledge between different industries, but also comprehensive cooperation and interaction between the market, production elements, product research and development and technological innovation [15]. It is a more efficient and comprehensive development model with advantages such as low development cost, flexible mechanisms and reasonable industrial structure [40]. The coupling coordination degree is used to evaluate the state of a process between systems, from disorder to order. Coordination between different industries occurs between two or more systems, and a good coordination and productive cycle between systems can ensure harmonious and healthy development between industries [41,42].
With the intensification of competition between tourism destinations, cultural tourism has become an important tool for creating new products and services to attract tourists [43,44]. It is regarded as one of the largest and fastest growing parts of the global tourism industry. Scholars are increasingly introducing cultural tourism resources into the study of tourism competitiveness, and have conducted extensive research on its evaluation index, influencing factors and promotion strategies [21,45]. As an effective representation of regional tourism development, tourism flow supports the development of cultural tourism resources and the promotion of tourism destination competitiveness, which has also been a topic of great interest from scholars [34,46,47]. Recently, the coupling coordination relationship between cultural tourism industry competitiveness and tourism flow has received more attention from researchers. Using Yunnan, China, as a case study, Zhao and Bai [22] investigated the spatio-temporal characteristics and influencing factors of the coupling coordination development of brand tourism resource competitiveness and tourism flow and revealed that there is a significant positive correlation, and a strong coupling coordination relationship, between brand tourism resource competitiveness and tourism flow. Pei, Ma, and Li et al. [48] analyzed the current situation of tourism flow and tourism resource development and the relationship and influencing factors between them. Guo, Mu, and Ming et al. [19] explored the spatial coupling relationship between rapid traffic superiority degree and tourist flow intensity in tourist destinations.
A good coupling relationship between the cultural tourism industry and tourism flow can promote interaction between the cultural and tourism industries, thereby improving the sustainable development of regional industries and enhancing the competitiveness of the tourism destination. From the perspective of tourism supply and demand, cultural tourism industry competitiveness and tourism flow are representations of supply-side and demand-side tourism, respectively. They interact with each other and have a coupling relationship [22]. Although the existing studies have made significant contributions by linking cultural tourism industry competitiveness and tourism flow, their common limitation is that they each focus on a single sub-indicator of cultural tourism industry competitiveness to analyze the relationship with tourism flow. This may lead to some bias in their understanding of the coupling coordination development relationship between cultural tourism industry competitiveness and tourism flow and potentially result in unreliable policy inferences. This study evaluates the coupling coordination development relationship using a multi-dimensional evaluation index system, ensuring that the distribution of elements between the cultural tourism industry and the sustainable development of the cultural tourism industry is more scientific.
3. Materials and Methods
3.1. Sample Description
Henan, China was selected as a case study for three reasons. First, it is rich in historical and cultural resources, including Neolithic culture, Wushu culture and culture related to its ancient capital. Cultural tourism has become an important pillar of regional economic development, and the contribution of the tourism industry to economic development increased from 10.35% to 17.96% from 2009 to 2019, showing an obvious growth trend. Second, with the development of cultural tourism, problems such as the insufficient utilization of tourism resources and the homogenization of tourism products have become increasingly prominent, and the enormous and unexploited potential of cultural tourism in this area has made sustainability a central issue for tourism development. Third, there is a lack of studies concerning the coupling coordination relationship between cultural tourism industry competitiveness and tourism flow. The shift toward a more coordinated development model may have a significant impact on the sustainable development of the local tourism industry.
3.2. Data Collection Methods
Cultural tourism industry competitiveness is an open and complex system, and tourism flow can also be understood from a variety of perspectives. To evaluate both more accurately, this study adheres to the principles of scientificity, integrity and operability, and constructs an evaluation index system of cultural tourism industry competitiveness and tourism flow based on existing research [1,22,23,49,50]. The specific evaluation indexes are shown in Table 1.

Table 1.
Evaluation indexes of cultural tourism industry competitiveness and tourism flow.
The index layer data of economic development support competitiveness, ecological environment competitiveness, ecological environment competitiveness, basic guarantee competitiveness and tourism flow used in this study was mainly obtained from the Henan Provincial Statistical Yearbook (2010–2020). The index layer data of cultural tourism resource competitiveness was obtained from the Statistical Bulletin of National Economic and Social Development of Henan Province (2009–2019). In particular, the data of some indicators are missing in certain years, and these missing data were supplemented by interpolation and trend extrapolation using data from previous years.
3.3. Determination of Index Weight
The entropy weight method is a mathematical method used to judge the variation of an index. The greater the variation of the index, the greater its influence on the comprehensive evaluation. The calculation method of information entropy is as follows:
where represents the jth index of the ith sample, represents the entropy of the jth index and represents the weight obtained by the entropy weight method of the jth index.
This study first adopts the entropy weight method to standardize the original data matrices of cultural tourism industry competitiveness and tourism flow and obtains the weight of each index in each layer. Then, the TOPSIS model is used to analyze the decision normalization matrix and calculate the comprehensive evaluation index of the cultural tourism industry competitiveness and tourism flow of cities in Henan Province [26]. Finally, we analyze their coupling coordination degree according to the results.
3.4. Calculating Coupling Coordination Degree
The coupling coordination model is developed based on the coupling model. It can effectively analyze the coordination relationship between systems and provides suggestions for promoting their coordinated development [15]. By analyzing the coupling coordination degree, this study explores whether the cultural tourism industry competitiveness is fully stimulated to attract tourism flow and whether tourism flow can promote cultural tourism development. The specific form of this model is as follows:
where C is the coupling degree; D is the coupling coordination degree, both of which are between 0 and 1; T is the comprehensive evaluation index; and = M(x) and = M(y) represent the evaluation index of cultural tourism industry competitiveness and tourism flow, respectively. Drawing on existing research [48], it is believed that cultural tourism industry competitiveness is as important as tourism flow, so α and β are both 0.5.
To accurately reflect the coupling coordination relationship between cultural tourism industry competitiveness and tourism flow in different cities, this study adopts a ten-method approach to determine their coupling coordination degree (as shown in Table 2) [51].
Table 2.
Evaluating criteria of coupling coordination grade.
4. Empirical Results
4.1. Overall Coupling and Coordination Characteristics
Using the Entropy-TOPSIS Model, this study first obtains the cultural tourism industry competitiveness comprehensive index M(x) and the tourism flow comprehensive index M(y) and then, with the help of R, we perform correlation analysis and regression analysis on M(x) and M(y). The analysis results show that the correlation coefficient between M(x) and M(y) is 0.602, the p value is 0.000, and the regression coefficient is positive and statistically significant at 5%. Specifically, when the cultural tourism industry competitiveness index increases by 1 percentage point, the tourism flow increases by 0.923 percentage points. These results indicate that there is a strong correlation between cultural tourism industry competitiveness and tourism flow, and that there may be strong coupling coordination. Using the coupling coordination model, we calculated the coupling coordination degree of cultural tourism industry competitiveness and tourism flow of Henan province from 2009 to 2019, and the coordination degree was then graded according to Table 2 (as shown in Figure 1). As seen in Figure 1, the enhancement of cultural tourism industry competitiveness and tourism flow, increased the coupling coordination degree of the whole province from 0.158 to 0.571 from 2009 to 2019, and the coupling coordination level developed from extreme disorder to grudging coordination, showing an obvious upward trend.
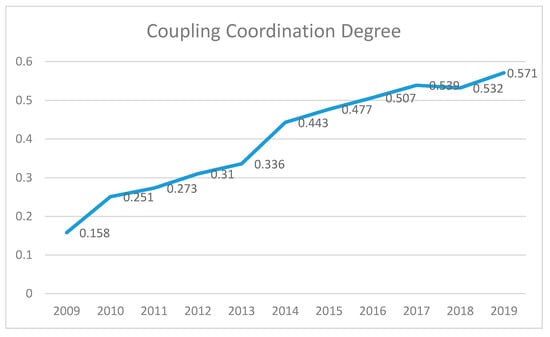
Figure 1.
Coupling coordination degree and its’ grade of cultural tourism industry competitiveness and tourism flow in Henan from 2009 to 2019.
To intuitively discover the coupling and coordination relationship between the hierarchical index of cultural tourism industry competitiveness and tourism flow, this study further calculates the comprehensive evaluation indexes of tourism flow, the cultural resource competitiveness, the economic development support competitiveness, the ecological environment competitiveness and the basic guarantee competitiveness, and presents the trend of their coupling and coordination degree (as shown in Figure 2).
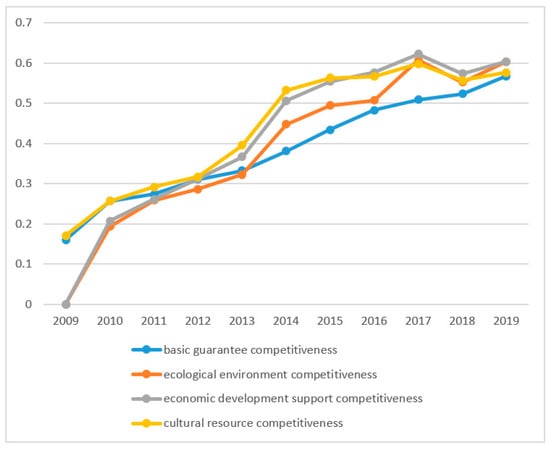
Figure 2.
Evolution of coupling coordination degree between tourism flow and hierarchical index of cultural tourism industry competitiveness in Henan Province.
As shown in Figure 2, the coupling and coordination degree between the hierarchical index of cultural tourism industry competitiveness and tourism flow is generally increasing over time. Specifically, the coupling coordination degree between basic guarantee competitiveness and tourism shows a straight upward trend, changing from a minimum of 0.16 in 2009 to a peak of 0.567 in 2019, and the coupling coordination level experienced the development stages of severe disorder, moderate disorder, mild disorder, on the verge of disorder and grudging coordination. The coupling coordination degree between cultural resource competitiveness, ecological environment competitiveness, economic development support competitiveness and tourism flow all present a fluctuating growth trend, and their coupling coordination degree reached a maximum in 2017. The coupling coordination level between cultural resource competitiveness and tourism flow experienced the development stages of severe disorder, moderate disorder, mild disorder and grudging coordination, and remained at the stage of grudging coordination from 2014. The coupling coordination value between ecological environment competitiveness, economic development support competitiveness and tourism flow exceeded 0.6 in 2017, reaching the primary coordination level, and showing development stages of grudging coordination and primary coordination in 2018 and 2019, respectively.
4.2. The Coupling Coordination Characteristics of Cities
Using the coupling coordination model, this paper also calculates the coupling coordination degree of cultural tourism industry competitiveness and tourism flow and its statistics for 17 cities in Henan province from 2009 to 2019 (as shown in Table 3).
Table 3.
Statistical characteristics and proportion of cultural tourism industry competitiveness and tourism flow coupling coordination degree in 17 cities in Henan province from 2009 to 2019.
As shown in Table 3, all cities were still at the uncoordinated development stage by 2014, and 64.8% of the cities were still at a stage of serious uncoordinated development. Until 2019, 65% of the cities were still at the uncoordinated development stage. These results indicate that the coupling coordination development level of some cities is not optimistic. In addition, the average coupling coordination degree of the 17 cities is gradually increasing, from 0.145 in 2009 to 0.585 in 2019. At the same time, the range of coupling coordination degree also generally increased. In 2019, the range of coupling coordination degree was 0.404; Zhengzhou had the highest coupling coordination degree while Luohe had the lowest. Taking cultural tourism industry competitiveness as the abscissa, the tourism flow as the ordinate, and the mean values of cultural tourism industry competitiveness and tourism flow as the cutting point. This study divides the coupling coordination development level of 17 cities into four types (as shown in Table 4) and makes recommendations for their coupling and coordinated development.
Table 4.
Coupling coordination types of cultural tourism industry competitiveness and tourism flow of 17 cities in Henan Province.
The first quadrant is the region of high cultural tourism industry competitiveness and high tourism flow, mainly represented by Zhengzhou and Luoyang. As the capital city of Henan, Zhengzhou has unique advantages in cultural tourism development. On the one hand, it is a National Central City, its scale, economy, environment and transportation are far better than the other cities in Henan. On the other hand, in terms of culture, it is the birthplace of Chinese civilization, the cultural and political center of Henan Province and one of the six major sites supported by the state. It has rich multi-cultural tourism resources, and its ancestor worship culture and Shaolin martial arts culture are widely known both in China and abroad. Luoyang also has rich cultural and historical resources, such as “peony culture” and “tomb culture”. It is also known as the “Nine Dynasties Ancient Capital”. Furthermore, the Luoyang Peony Festival and Heluo Cultural Tourism Festival are well-known and popular with tourists. As the first level of coupling and coordinated development, Zhengzhou and Luoyang should pay attention to consolidating their own cultural tourism brand image, and actively create their own tourism characteristics. Meanwhile, they should actively strengthen the win–win cooperation with surrounding cities, to promote the coordinated development of cultural tourism industry competitiveness and tourism flow in Henan Province.
The second quadrant is the region of low cultural tourism industry competitiveness and high tourism flow, mainly represented by Kaifeng and Jiaozuo. Both have unique cultural tourism resources and are attractive destinations for tourists. For example, Qingming Shanghe Park in Kaifeng and Yuntai Mountain in Jiaozuo are national 5A scenic spots, which are well-known globally and have a strong appeal for tourists. However, the tourism transportation and infrastructure of these cities are relatively lagging and insufficient, which limits the development of the regional cultural tourism industry. These cities should fully utilize their own resources to create more tourism brands. At the same time, they should strengthen tourism transportation and infrastructure, enhance tourism services and improve the accessibility of tourism destinations and attractiveness of tourism resource brands.
The third quadrant is the region of low cultural tourism industry competitiveness and low tourism flow, it includes about 50% of the cities such as Xinyang, Hebi, Sanmenxia, Shangqiu and other cities. These cities also have obvious cultural tourism resources, but generally weak economic development support competitiveness, ecological environment competitiveness and basic guarantee competitiveness, which restricts the coupling and coordinated development of cultural tourism industry competitiveness and tourism flow to a large extent. These cities should develop diversified cultural tourism resources, improve infrastructure, increase tourism investment and marketing and create a series of regional cultural tourism scenic spots using their superior ecological environment.
The fourth quadrant is the region of high cultural tourism industry competitiveness and low tourism flow, mainly represented by Nanyang, Xuchang and Puyang. In these cities, the cultural tourism industry competitiveness has not been fully transformed into a driving force of tourism flow development. Tourism managers in these areas should use WeChat, Douyin and other platforms to promote and publicize tourism destinations, to improve their popularity and attractiveness at a local level.
5. Discussion and Concluding Remarks
5.1. Summary of Empirical Findings
Using Henan Province as a case study, empirical research based on methods including Pearson correlation analysis, the Entropy-TOPSIS Model and the Coupling Coordination Model was conducted. The comprehensive application of multiple research methods can effectively avoid the limitation of a single research method, and thus, comprehensively verify the coupling coordination relationship. The results can also help formulate sustainable development strategies for cultural tourism industry competitiveness and tourism flow. From the results, the following conclusions can be drawn: (1) The correlation coefficient between cultural tourism industry competitiveness and tourism flow in Henan Province is 0.602 and the regression coefficient is positive and statistically significant. Furthermore, with the enhancement of cultural tourism industry competitiveness and tourism flow, their coupling coordination level developed from extreme disorder to good grudging coordination, showing an obvious upward trend; (2) From the perspective of different cities, the “polarization effect” of coupling coordination level is gradually increasing, and the coupling and coordinated development of some cities are still not promising; and (3) Combined with the current situation of cultural tourism industry competitiveness and tourism flow, this paper divides the coupling and coordinated development of 17 cities into four types according to the four quadrants model, and makes some recommendations to promote the coupling and coordinated development of cultural tourism industry competitiveness and tourism flow.
5.2. Implications
From the perspective of theoretical contribution and practical significance, our research can be useful for researchers and managers. Theoretically, on one hand, from the perspective of tourism industry supply and demand, cultural tourism industry competitiveness and tourism are powerful representations of the interaction between supply and demand in the process of destination tourism development; although there are studies that explore the correlation between cultural tourism industry competitiveness and tourism flow [25,26], few scholars have considered their coupling and coordinated development characteristics. This study provides an examination of the relationship between cultural tourism industry competitiveness and tourism flow by developing a coupling coordination model; the conclusions reveal the coupling development state of the cultural tourism industry competitiveness and tourism flow in different periods in Henan Province. On the other hand, measuring tourism destination competitiveness is very difficult due to its complex and multidimensional nature [1,17]. Based on existing research [1,22,23,49,50], this study attempted to address this difficulty by constructing a cultural tourism industry competitiveness evaluation index from the cultural resource competitiveness, economic development support competitiveness, ecological environment competitiveness and basic guarantee competitiveness, including 31 secondary evaluation indexes. This study is also important for sustainable development and the transformation of cultural tourism in practice. The cultural tourism industry has characteristics of diversity, complexity, relevance and sociality and its competitiveness and tourism flow present different characteristics of coupled and coordinated development in different periods in different cities. This study divides the coupling coordination development level of 17 cities into four types, and makes recommendations for their coupling and coordinated development, this ensures the healthy, sustainable and rapid development of cultural tourism industry in different cities. The conclusions of this study can also serve as a reference for coupling and coordinated development relationships between other industries and help accelerate economic structural reform and industrial upgrading.
5.3. Limitations and Future Work
This research has some limitations that can be mitigated in future work. For example, considering the complexity of cultural tourism industry competitiveness evaluation and the limitation of data sources, the selection of cultural tourism industry competitiveness evaluation may not be comprehensive enough. Furthermore, this study only uses tourist flow, consumption tourist flow and effect flow to measure tourism flow, omitting information flow, capital flow and material flow, which are also aspects of tourism flow. Future research should improve the evaluation index of cultural tourism industry competitiveness and the definition of tourism flow and further explore their coupling and coordination relationship.
Author Contributions
The contribution of S.L. is Formal analysis, Funding acquisition and Writing-original draft; The contribution of S.D. is Methodology, Investigation and Writing—review & editing. All authors have read and agreed to the published version of the manuscript.
Funding
This research was supported by the Social Science Fund of Henan Province (Grant No. 2020CJJ096).
Institutional Review Board Statement
This study did not require ethical approval.
Data Availability Statement
Publicly available datasets were analyzed in this study. This data can be found from Henan Provincial Statistical Yearbook (2010–2020) and Statistial Bulletin of National Economic and Social Development of Henan Province (2009–2019).
Conflicts of Interest
The authors declare no conflict of interest.
References
- Bazargani, R.H.Z.; Kiliç, H. Tourism competitiveness and tourism sector performance: Empirical insights from new data. J. Hosp. Tour. Manag. 2021, 46, 73–82. [Google Scholar] [CrossRef]
- Manzo, G.G. Travel & Tourism Economic Impact 2019; World Travel & Tourism Council: London, UK, 2019. [Google Scholar]
- Croes, R.; Ridderstaat, J.; Shapoval, V. Extending tourism competitiveness to human development. Ann. Tour. Res. 2020, 80, 102825. [Google Scholar] [CrossRef]
- Pike, S.; Page, S.J. Destination Marketing Organizations and destination marketing: A narrative analysis of the literature. Tour. Manag. 2014, 41, 202–227. [Google Scholar]
- Kubickova, M.; Martin, D. Exploring the relationship between government and destination competitiveness: The TALC model perspective. Tour. Manag. 2020, 78, 104040. [Google Scholar] [CrossRef]
- Chathoth, P.K.; Mak, B.; Sim, J.; Manaktola, K. Assessing dimensions of organizational trust across cultures: A comparative analysis of US and Indian full service hotels. Int. J. Hosp. Manag. 2011, 30, 233–242. [Google Scholar] [CrossRef]
- Nazarian, A.; Atkinson, P.; Foroudi, P. Influence of national culture and balanced organizational culture on the hotel industry’s performance. Int. J. Hosp. Manag. 2017, 63, 22–32. [Google Scholar] [CrossRef]
- Rodriguez-Lopez, N.; Dieguez-Castrillon, M.I.; Gueimonde-Canto, A. Sustainability and tourism competitiveness in protected areas: State of art and future lines of research. Sustainability 2019, 11, 6296. [Google Scholar] [CrossRef]
- Natalia, P.; Clara, R.A.; Simon, D.; Noelia, G.; Barbara, A. Critical elements in accessible tourism for destination competitiveness and comparison: Principal component analysis from Oceania and South America. Tour. Manag. 2019, 75, 169–185. [Google Scholar] [CrossRef]
- Li, Y.Q.; Liu, C.H.S. The role of problem identification and intellectual capital in the management of hotels’ competitive advantage-an integrated framework. Int. J. Hosp. Manag. 2018, 75, 160–170. [Google Scholar]
- Xia, H.; Vu, H.Q.; Law, R.; Li, G. Evaluation of hotel brand competitiveness based on hotel features ratings. Int. J. Hosp. Manag. 2020, 86, 102366. [Google Scholar]
- De Souza, J.; Mendes-Filho, L.; Buhalis, D. Evaluating the effectiveness of tourist advertising to improve the competitiveness of destinations. Tour. Econ. 2020, 26, 1001–1020. [Google Scholar] [CrossRef]
- Singjai, K.; Winata, L.; Kummer, T.F. Green initiatives and their competitive advantage for the hotel industry in developing countries. Int. J. Hosp. Manag. 2018, 75, 131–143. [Google Scholar] [CrossRef]
- Shoval, N.; Birenboim, A. Customization and augmentation of experiences through mobile technologies: A paradigm shift in the analysis of destination competitiveness. Tour. Econ. 2019, 25, 661–669. [Google Scholar] [CrossRef]
- Zhou, Z.; Yang, Q.; Kim, D.J. An Empirical Study on Coupling Coordination between the Cultural Industry and Tourism Industry in Ethnic Minority Areas. J. Open Innov. Technol. Mark. Complex. 2020, 6, 65. [Google Scholar] [CrossRef]
- Yu, H.; Liu, J. Coupling coordination development of tourism demand and supply of Heilongjiang Province at the background of supply-side reform. Sci. Geogr. Sin. 2017, 37, 1374–1381. [Google Scholar]
- Wang, X.; Liu, D. The Coupling Coordination Relationship between Tourism Competitiveness and Economic Growth of Developing Countries. Sustainability 2020, 12, 2350. [Google Scholar]
- Wu, L.; Jiao, H.; Ye, L. Spatio-temporal Characteristics of Coordinated Development Between Tourism Economy and Transportation: A Case of International Culture and Tourism Demonstration Area in South Anhui Province. Sci. Geogr. Sin. 2019, 39, 1822–1829. [Google Scholar]
- Guo, X.; Mu, X.; Ming, Q.; Ding, Z.; Hu, M. Spatial coupling between rapid traffic superiority degree and tourist flow intensity in tourist destinations. Geogr. Res. 2019, 38, 1119–1135. [Google Scholar]
- Richards, G. Cultural tourism: A review of recent research and trends. J. Hosp. Tour. Manag. 2018, 36, 12–21. [Google Scholar] [CrossRef]
- Jovicic, D. Cultural tourism in the context of relations between mass and alternative tourism. Curr. Issues Tour. 2016, 19, 605–612. [Google Scholar] [CrossRef]
- Zhao, S.; Bai, M. Coupling Coordination Characteristics and Its Influencing Factors of Brand Tourism Resources Competitiveness and Tourism Flow in Yunnan Province. Sci. Geogr. Sin. 2020, 40, 1878–1888. [Google Scholar]
- Cibinskiene, A.; Snieskiene, G. Evaluation of city tourism competitiveness. Procedia Soc. Behav. Sci. 2015, 213, 105–110. [Google Scholar] [CrossRef]
- Shi, Y.; Gao, Y.; Cao, R. Research on the Construction of Analytic Hierarchy Process of Cultural Tourism Competitiveness. In The 4th International Conference on Economy, Judicature, Administration and Humanitarian Projects (JAHP 2019); Atlantis Press: Paris, France, 2019; pp. 853–856. [Google Scholar]
- Zhang, H.; Pan, H.; Yang, Y. Correlation analysis between tourism resources competitiveness and tourism income—Taking 17 cities in Anhui Province as an example. Resour. Dev. Mark. 2012, 28, 1046–1049. [Google Scholar]
- Li, G.; Tian, Y. Validity analysis of tourism resources competitiveness and tourism development level in Pearl River Delta. Econ. Geogr. 2019, 39, 218–224, 239. [Google Scholar]
- Richards, G. Tourism attraction systems: Exploring cultural behavior. Ann. Tour. Res. 2002, 29, 1048–1064. [Google Scholar] [CrossRef]
- McKercher, B.; Wong, C.; Lau, G. How tourists consume a destination. J. Bus. Res. 2006, 59, 647–652. [Google Scholar] [CrossRef]
- Richards, G. Cultural Tourism: Global and Local Perspectives; Psychology Press: London, UK, 2007. [Google Scholar]
- Fernández, J.A.S.; Azevedo, P.S.; Martín, J.M.M.; Martín, J.A.R. Determinants of tourism destination competitiveness in the countries most visited by international tourists: Proposal of a synthetic index. Tour. Manag. Perspect. 2020, 33, 100582. [Google Scholar] [CrossRef]
- Kumar, S.; Baishya, K.; Sadarangani, P.; Samalia, H.V. Cultural influence on e-government development. Electron. J. Inf. Syst. Eval. 2020, 23, 17–33. [Google Scholar]
- Chen, C.; Ma, H.; Chen, N.; Chen, H. The evolution of network gravity center for rural residents tourist flow in China. Geogr. Res. 2014, 33, 1306–1314. [Google Scholar]
- Ma, Y.; Li, T.; Liu, X. Research on China’s Inbound Tourism; Science Press: Beijing, China, 1999; pp. 12–24. [Google Scholar]
- Qin, J.; Li, L.; Tang, M.; Song, X. Exploring the spatial characteristics of Beijing inbound tourist flow based on geotagged photos. Acta Geogr. Sin. 2018, 73, 1556–1570. [Google Scholar]
- Zheng, P.; Ma, Y.; Wang, J.; Li, J.Y.; Yang, M. A study of the influrncing factors of the inbound tourists from the U.S.A based on “push-pull” theory. Hum. Geogr. 2010, 25, 112–117. [Google Scholar]
- Xu, M.; Huang, Z.; Cao, F.; Zhu, H. The network structure features and influence factors of tourism flows based on online data analysis: Taking the Yangtze River Delta Region as an example. Econ. Geogr. 2018, 38, 193–202. [Google Scholar]
- Crouch, G.I.; Ritchie, J.R. Competitiveness and Tourism; Edward Elgar Publishing: Cheltenham, UK, 2012. [Google Scholar]
- Goffi, G.; Cucculelli, M.; Masiero, L. Fostering tourism destination competitiveness in developing countries: The role of sustainability. J. Clean. Prod. 2019, 209, 101–115. [Google Scholar] [CrossRef]
- Bengtsson, M.; Kock, S. Cooperation and competition in relationships between competitors in business networks. J. Bus. Ind. Mark. 1999, 14, 178–193. [Google Scholar] [CrossRef]
- Banker, R.D.; Chang, H.H.; Majumdar, S.K. Economies of scope in the US telecommunications industry. Inf. Econ. Policy 1998, 10, 253–272. [Google Scholar] [CrossRef]
- Liu, D.H.; Yang, Y.C. Study on the coordination degree of regional economy-tourism-ecological environment coupling—Taking Anhui province as an example. Resour. Environ. Yangtze Basin 2011, 20, 892–896. [Google Scholar]
- Liu, X.P.; Meng, M. Sustainable land use and the coupling relation of ecological economic harmonious development: A case study of Tarim River Basin. Arid Land Geogr. 2011, 34, 173–178. [Google Scholar]
- Richards, G. Gastronomy: An essential ingredient in tourism production and consumption. In Tourism and Gastronomy; Routledge: London, UK, 2003; pp. 17–34. [Google Scholar]
- Richards, G. European Cultural Tourism: Patterns and Prospects; Dodd, D., van Hemel, A.-M., Eds.; Boekman Foundation: Amsterdam, The Netherlands, 1999. [Google Scholar]
- He, B.; Zhu, L.; Cai, X.; Li, J.J.; Zhu, H. Examining the Impacts of Mega-Events on Urban Development Using Coupling Analysis: A Case Study of the Boao Forum for Asia. Sustainability 2020, 12, 730. [Google Scholar] [CrossRef]
- Liu, J.; Ma, Y. The evolution and driving mechanism of the supply and demand coupling about tourism flow and destination system based on the genesis and system theory: Taking Xi’an as an example. Geogr. Res. 2017, 36, 1583–1600. [Google Scholar]
- Yao, M.; Chen, Y.; Zhou, Z.; Manchun, L.I. The evolution of structural features and gravity enter for China-ASEAN Tourist Flow Network. Econ. Geogr. 2018, 38, 181–189. [Google Scholar]
- Pei, B.; Ma, Y.; Li, T.; Shi, Q.Y. The coupling coordination between tourism flow and tourism resource development in Shanxi Province. J. Northwest Univ. 2014, 44, 1001–1004. [Google Scholar]
- Li, B.; Qin, H.; Yu, J.; Liu, Q. Qianqian Evaluation and Pattern Evolution of Provincial Tourism Resources Competitiveness in China. Econ. Geogr. 2019, 39, 232–240. [Google Scholar]
- Lopes, A.P.F.; Muñoz, M.M.; Alarcón-Urbistondo, P. Regional tourism competitiveness using the PROMETHEE approach. Ann. Tour. Res. 2018, 73, 1–13. [Google Scholar] [CrossRef]
- Gao, N.; Ma, Y.; Li, T.; Bai, K. Study on the coordinative development between tourism industry and urbanization based on coupling model: A case study of Xi’an. Tour. Trib. 2013, 28, 62–68. [Google Scholar]
Publisher’s Note: MDPI stays neutral with regard to jurisdictional claims in published maps and institutional affiliations. |
© 2021 by the authors. Licensee MDPI, Basel, Switzerland. This article is an open access article distributed under the terms and conditions of the Creative Commons Attribution (CC BY) license (https://creativecommons.org/licenses/by/4.0/).