Abstract
Worldview-3 satellite imagery provides panchromatic images with a high spatial resolution and visible near infrared (VNIR) and shortwave infrared (SWIR) bands with a low spatial resolution. These images can be used for various applications such as environmental analysis, urban monitoring and surveying for sustainability. In this study, mineral detection was performed using Worldview-3 satellite imagery. A pansharpening technique was applied to the spatial resolution of the panchromatic image to effectively utilize the VNIR and SWIR bands of Worldview-3 satellite imagery. The following representative similarity analysis techniques were implemented for the mineral detection: the spectral angle mapper (SAM), spectral information divergence (SID) and the normalized spectral similarity score (NS3). In addition, pixels that could be estimated to indicate minerals were calculated by applying an empirical threshold to each similarity analysis result. A majority voting technique was applied to the results of each similarity analysis and pixels estimated to indicate minerals were finally selected. The results of each similarity analysis were compared to evaluate the accuracy of the proposed methods. From that comparison, it could be confirmed that false negative and false positive rates decreased when the methods proposed in the present study were applied.
1. Introduction
As satellite sensor technology advances, the spatial resolution of satellite images is being continuously improved and satellite sensors capable of acquiring diverse spectral wavelength bands have been recently developed. Satellite sensors are able to provide satellite images with diverse spatial and spectral resolutions. These can be utilized in the field, for example, in national environmental analyses, urban monitoring, change detection and surveying for sustainability [1]. In particular, Worldview-3 satellite images provide panchromatic images, eight visible near infrared (VNIR) bands and eight shortwave infrared (SWIR) bands with spatial resolutions of 0.3 m, 1.2 m and 3.7 m, respectively, and are known to be effective for the analysis of the properties of artificial structures, minerals and rocks as VNIR and SWIR bands between the spectral wavelength bands of 400 and 2,400 nm are provided [2,3]. However, as the spatial resolution of each band varies, the spatial resolution should be matched to utilize the satellite images for analysis [4]. Generally, images of a high spatial resolution are downsampled to match the image size of each band but this is disadvantageous because this reduces the utility of the images. Therefore, a pansharpening technique was developed to sharpen the VNIR and SWIR bands using the panchromatic band. Chavez et al. [5] developed the Brovey technique based on the ratio of the pixel value of the panchromatic band to the intensity of the image and Aiazzi et al. [6] proposed a sharpening technique using local coefficients to reduce the spatial distortion.
Target detection is a technique that analyzes the position of a pixel presumed to be a specific material by using the spectral properties of the pixels in remote sensing data [7,8,9]. A number of studies have recently been conducted related to target detection utilizing satellite images that provide wide wavelength bands such as Worldview-3 satellite images. Sun et al. [10] performed target detection for specific minerals using the band properties of Worldview-3 imagery and Le et al. [11] detected coal by applying an extreme learning machine to Landsat 8 OLI satellite images based on the spectral information of coal acquired using a spectroradiometer. Additionally, Kim [12] developed a processing technique to minimize the influence of background pixels on target detection using the matched filter (MF) and adaptive cosine estimator (ACE) techniques.
In this study, mineral detection was performed in areas that are difficult to access using satellite imagery. As the target area of this study is a region that cannot be accessed, the spectral data of minerals cannot be directly obtained. In this case, a method can be applied that uses the spectral data of pixels that are known to indicate the presence of minerals in the image. Mines and facilities near Pyeongsan (North Korea) were selected as the study area in this work. Worldview-3 satellite imagery, which provides VNIR and SWIR bands, was used for mineral detection and minerals were detected via a similarity analysis-based method using these VNIR and SWIR bands. To effectively utilize the VNIR and SWIR bands of Worldview-3, the VNIR and SWIR bands with a 0.3 m spatial resolution the same as that of a panchromatic image were produced by applying the pansharpening technique. Similarity analyses were conducted utilizing a spectral angle mapper (SAM), spectral information divergence (SID) and the normalized spectral similarity score (NS3). Mineral-related spectral data were extracted from the Worldview-3 satellite images that had undergone a radiometric correction. The pixels presumed to be minerals were selected by applying thresholds to the results of the SAM, SID and NS3 methods and the final designation of the pixels (as indicating minerals or not) were determined by applying a majority voting method to the results from the three techniques. The accuracy of the method proposed in the present study was evaluated by comparing this final result with the individual results of applying SAM, SID and NS3, respectively.
2. Methods
In this study, mineral detection was performed using the VNIR and SWIR bands of Worldview-3 satellites. Radiometric correction is essential when using satellite imagery for mineral detection. Therefore, radiometric correction was performed using the QUick Atmospheric Correction (QUAC) algorithm on the Worldview-3 satellite images. VNIR and SWIR bands with the same spatial resolution as the panchromatic image were produced by applying the GS2 (Gram–Schmidt 2) sharpening technique to the VNIR and SWIR bands. Similarity analyses were then conducted utilizing the spectral data of the minerals acquired from the Worldview-3 satellite images. The similarity analyses were conducted using SAM and SID and the pixels finally presumed to be minerals were determined by using a majority voting technique. The results obtained from this approach were comparatively evaluated with the respective results from the two similarity analyses to verify the performance of the method proposed in this study. Figure 1 shows the flowchart of the study.
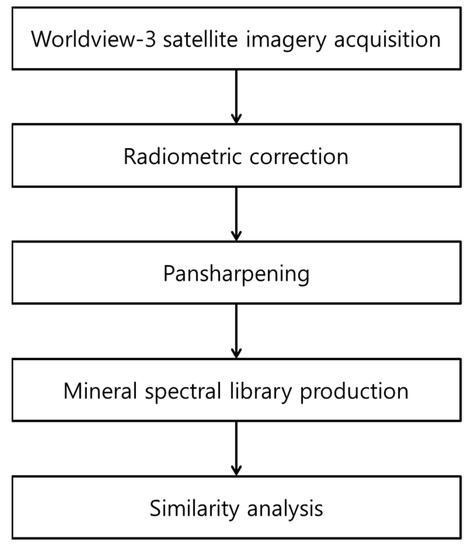
Figure 1.
Workflow of the proposed mineral detection.
2.1. Pansharpening
In general, a high-resolution satellite sensor provides high-resolution panchromatic images and low-resolution multispectral images. Panchromatic images and multispectral images are fused to produce high-resolution multispectral images, which increase the utility of the low-resolution images; this technique is called pansharpening. The pansharpening technique extracts high-frequency information from panchromatic images and injects this information into multispectral images [13,14,15] (see Equation (1)).
In Equation (1), is the sharpened high-resolution multispectral image, is the multispectral image interpolated using the scale of the image, is the injection gain, is the panchromatic image, is the low-resolution synthetic intensity image and represents the band number of the multispectral image.
The GS2 pansharpening technique was applied in this study. In the GS2 technique, the low-resolution images obtained by applying the image pyramid or image filtering technique to the panchromatic image are applied to (from Equation (1)). The variable is calculated using the relation of the covariance between and the variance of [16].
2.2. Spectral Angle Mapper
In this study, similarity indexes were utilized for mineral detection. SAM measures similarities using the spectral angle between pixels [17,18]; see Equation (2).
In Equation (2), and refer to the pixels or spectral reflectances of the object and the material of interest, respectively, is the inner product of the pixel values and represents the size of the vector when the first pixel is assumed to be a vector. The SAM indexes are in the range of 0 to π/2. The more similar the properties of pixels are to each other, the closer the value is to 0. As the SAM indexes measure the spectral angle of each pixel, materials that have different absolute values of spectral reflectance will have low values if they have the same spectral pattern.
2.3. Spectral Information Divergence
SID indexes are calculated assuming that each pixel of the object and the material of interest, and , could be represented by random vectors. SID indexes can be put in order using Equation (3). Hence, the larger the value of the SID index, the higher the similarity between pixels [19,20].
2.4. Normalized Spectral Similarity Score
NS3 is one of the representative similarity analysis techniques and is defined as Equation (4).
In Equation (4), is the spectral distance between two pixels and represents the spectral angle between two pixels. An NS3 index represents the average of the spectral angles and spectral distances and is a measure that quantifies the size difference, similarity and shape of the spectral reflectance [21,22]. NS3 indexes range from 0 to . Hence, the closer the value is to 0, the higher the similarity between the pixels, as in the case of SAM.
3. Result and Discussion
3.1. Study Area and Materials
The VNIR and SWIR bands of Worldview-3 satellite images acquired on 17 October 2016 were utilized for mineral detection. The selected study area was Pyeongsan-gun (Hwanghaebuk-do, North Korea), which has regions in which uranium plants and mines are presumed to be located. The Worldview-3 satellite images utilized for mineral detection provided panchromatic images with a spatial resolution of 0.31 m, eight VNIR bands with a spatial resolution of 1.24 m and eight SWIR bands with a spatial resolution of 3.7 m. The panchromatic images were converted to a spatial resolution of 0.3 m through a geometric correction for use in the sharpening technique and the VNIR and SWIR bands were converted to spatial resolutions of 1.2 m and 3.7 m, respectively, which were integer multiples of the 0.3 m spatial resolution. In addition, a radiometric correction was used to transform the spectral reflectance values. Table 1 shows the spectral information for each band of the Worldview-3 satellite images and specifies the Worldview-3 satellite images utilized for the experiment, as shown in Figure 2.

Table 1.
Worldview-3 data specifications.
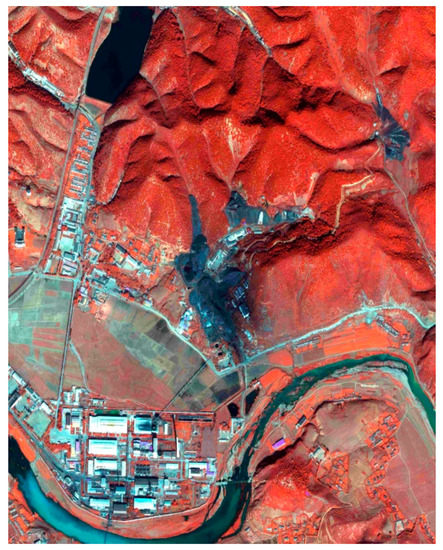
Figure 2.
Study area (Pyeongsan-gun, Hwanghaebuk-do, North Korea).
3.2. Experimental Results
As the target area of this study was an inaccessible region, mineral-related spectral data could not be directly obtained. In cases such as this, a method can be employed that uses the spectral data of pixels that are presumed to be pixels that solely indicate minerals in the image. Therefore, in this study, a spectral library was built using the spectral data of minerals acquired from Worldview-3 satellite images for mineral detection. The spectral data of the minerals were acquired from an area that was not included in Figure 2 and the average value of five pixels presumed to be pixels that only indicated minerals was ultimately designated as the spectral value of the mineral. The image of the region where the spectral data of the minerals were acquired is shown in Figure 3; this mine is known to produce the same mineral as the mine in Figure 2. Figure 4 is the spectral graph of the five pixels presumed to be the mineral.
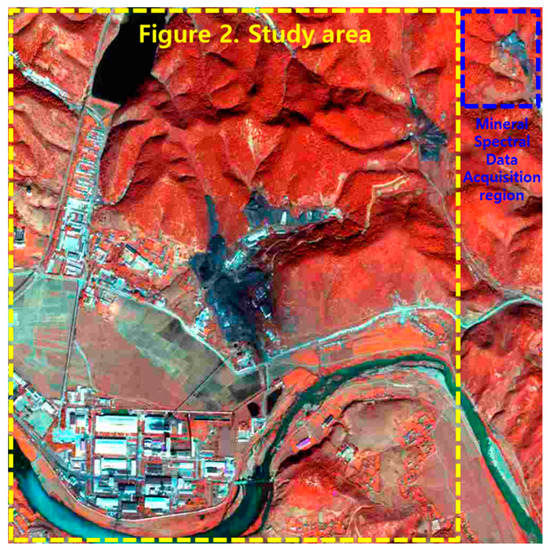
Figure 3.
Region for mineral spectral data acquisition (Pyeongsan-gun, Hwanghaebuk-do, North Korea).
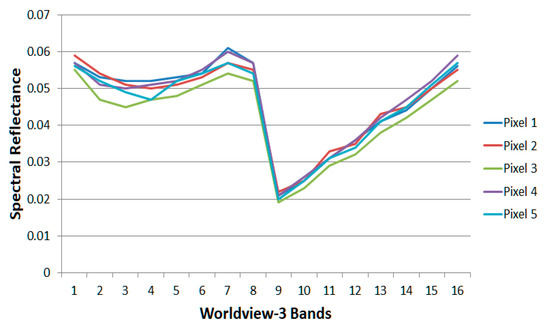
Figure 4.
Spectral graph of the mineral pixel.
A similarity analysis of the images of the study area was conducted using the previously built spectral library of the minerals. SAM, SID and NS3 were applied in the similarity analyses and binary images were produced by applying empirical thresholds. Figure 5 shows the images before and after applying these thresholds to the results from the SAM, SID and NS3 analyses.
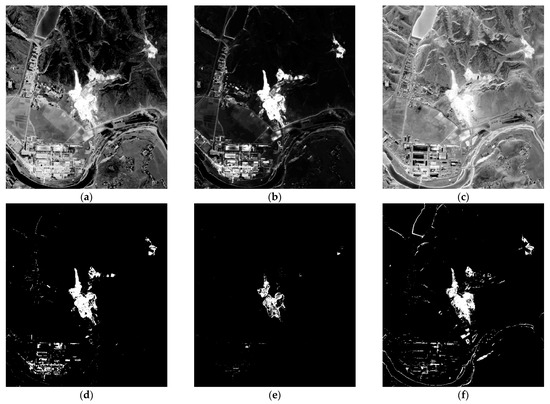
Figure 5.
Result of the similarity analysis: (a) SAM before the threshold application, (b) SID before the threshold application, (c) NS3 before the threshold application, (d) SAM after the threshold application, (e) SID after the threshold application, (f) NS3 after the threshold application.
A majority voting technique was applied to improve the accuracy of mineral detection. Majority voting was applied to pixels that were presumed to be minerals in each similarity analysis result. In majority voting, the pixels in which two or more results are estimated to be minerals as a result of applying three similarity techniques are finally determined to be mineral pixels.
The performance of the mineral detection method proposed in this study was both qualitatively and quantitatively evaluated and the object of comparison was the result of applying each similarity analysis. The qualitative evaluation involved a visual reading of the images and the quantitative evaluation entailed calculating the confusion matrix using ground truth data. Ground truth data were obtained from pixels known to indicate minerals in the image of the study area. Figure 6 shows the majority voting results and Table 2, Table 3, Table 4 and Table 5 show the results of the quantitative evaluation.
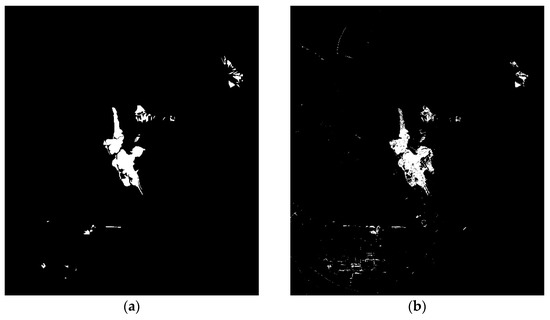
Figure 6.
Results of applying the majority voting method: (a) ground truth image and (b) final mineral detection result.
Table 2.
Result of mineral detection by applying SAM.
Table 3.
Result of mineral detection by applying SID.
Table 4.
Result of mineral detection by applying NS3.
Table 5.
Result of mineral detection by applying majority voting.
The qualitative evaluation confirmed that the proportion of undetected areas and the false alarm rate were lower than the results obtained by individually conducting each similarity analysis. In particular, the false alarm rate of water-covered areas and building shadows, which show a low spectral reflectance (like minerals) decreased. The results from the quantitative evaluation were similar to the qualitative evaluation results. The detection accuracy for the SAM and NS3 results were 0.882 and 0.813, respectively, showing high detection rates. However, the false alarm rates were also high at 0.011 and 0.019, respectively, indicating overdetection. The false alarm rate was low (0.002) for the SID result but the detection rate was also low (0.520). The detection rate of the method proposed in this study was 0.804, which was slightly lower than the SAM and NS3 detection rates but the false alarm rate was greatly reduced (0.004). This confirmed that the method proposed in this study produced high detection rates and low false detection rates.
4. Conclusions
The VNIR and SWIR bands from Worldview-3 satellite imagery were used for mineral detection in this study. As part of our approach, the low-resolution VNIR and SWIR bands were converted to high-resolution bands through the GS2 method. In addition, a spectral library of the target minerals was constructed for detection and the spectral data of the target minerals were computed as the average of five pixels in the images estimated to be purely composed of the target mineral. SAM, SID and NS3, which are representative similarity analysis techniques, were used for mineral detection and binary images of pixels presumed to be minerals were produced by applying an empirical threshold to the results of the similarity analyses. Majority voting was then used to determine the final mineral designation of a given pixel when the results of more than two of the three similarity analyses determined that the pixel indicated the presence of a mineral. The proposed method was evaluated by a comparison with the results of each similarity analysis and it was confirmed that the detection rate increased by 28% when compared with the SID results and false alarms decreased by 1.5% when compared with the NS3 results. Further mineral detection research is planned by acquiring verified spectral data for minerals.
Author Contributions
Conceptualization, H.P. and J.C.; methodology, H.P. and J.C.; software, H.P.; validation, J.C.; writing—review and editing, H.P. and J.C. All authors have read and agreed to the publish version of the manuscript.
Funding
This work was supported by the National Research Foundation of Korea (NRF) grant funded by the Korea government (MSIT) (No. 2020R1G1A1003573).
Institutional Review Board Statement
Not applicable.
Informed Consent Statement
Not applicable.
Data Availability Statement
Not applicable.
Conflicts of Interest
The authors declare no conflict of interest.
Abbreviations
| VNIR | Visible Near InfraRed |
| SWIR | Shortwave InfraRed |
| SAM | Spectral Angle Mapper |
| SID | Spectral Information Divergence |
| NS3 | Normalized Spectral Similarity Score |
| MF | Matched Filter |
| ACE | Adaptive Cosine Estimator |
| QUAC | QUick Atmospheric Correction |
| GS2 | Gram–Schmidt 2 |
References
- Han, Y.; Jung, S.; Park, H.; Choi, J. Effect analysis of Worldview-3 SWIR bands for wetland classification in Suncheon Bay, South Korea. J. Korean Soc. Surv. Geod. Photogramm. Cartogr. 2018, 36, 371–379. [Google Scholar]
- Samsudin, S.H.; Shafri, H.; Hamedianfar, A. Development of spectral indices for roofing material condition status detection using field spectroscopy and Worldview-3 data. J. Appl. Remote Sens. 2016, 10, 25021. [Google Scholar] [CrossRef]
- Kim, G.; Park, N.; Choi, S.; Choi, J. Performance evaluation of pansharpening algorithms for Worldview-3 satellite imagery. J. Korean Soc. Surv. Geod. Photogramm. Cartogr. 2016, 34, 413–429. [Google Scholar] [CrossRef]
- Park, H.; Choi, J.; Park, N.; Choi, S. Sharpening the VNIR and SWIR bands of Sentinel-2A imagery through modified selected and synthesized bands schemes. Remote Sens. 2017, 9, 1080–1099. [Google Scholar] [CrossRef]
- Chavez, P.; Sides, S.; Anderson, J. Comparison of three difference methods to merge multiresolution and multispectral data: Landsat TM and SPOT panchromatic. Photogramm. Eng. Remote Sens. 1991, 57, 295–303. [Google Scholar]
- Aiazzi, B.; Alparone, L.; Baronti, S.; Selva, M. Improving component substitution pansharpening through multivariate regression of MS+PAN data. IEEE Trans. Geosci. Remote Sens. 2007, 10, 3230–3239. [Google Scholar] [CrossRef]
- Huang, Z.; Shi, Z.; Yang, S. Nonlocal similarity regularized sparsity model for hyperspectral target detection. IEEE Geosci. Remote Sens. Lett. 2013, 10, 1532–1536. [Google Scholar] [CrossRef]
- Chang, C.; Heinz, D.C. Constrained subpixel target detection for remotely sensed imagery. IEEE Trans. Geosci. Remote Sens. 2000, 38, 1144–1159. [Google Scholar] [CrossRef]
- Manolakis, D.; Siracusa, C.; Shaw, G. Hyperspectral subpixel target detection using the linear mixing model. IEEE Trans. Geosci. Remote Sens. 2001, 39, 1392–1409. [Google Scholar] [CrossRef]
- Sun, Y.; Tian, S.; Di, B. Extracting mineral alteration information using Worldview-3 data. Geosci. Front. 2017, 8, 1051–1062. [Google Scholar] [CrossRef]
- Le, B.T.; Xiao, D.; Okello, D.; He, D.; Xu, J.; Doan, T.T. Coal exploration technology based on visible-infrared spectra and remote sensing data. Spectrosc. Lett. 2017, 50, 440–450. [Google Scholar] [CrossRef]
- Kim, K. Study on improving hyperspectral target detection by target signal exclusion in matched filtering. Korean J. Remote Sens. 2015, 31, 433–440. [Google Scholar] [CrossRef][Green Version]
- Rahmani, S.; Strait, M.; Merkurjev, D.; Moelloer, M.; Wittman, T. An adaptive IHS pan-sharpening method. IEEE Geosci. Remote Sens. Lett. 2010, 7, 746–750. [Google Scholar] [CrossRef]
- Park, S.; Choi, S.; Choi, J.; Lee, S. Accuracy assessment of sharpening algorithms of thermal infrared image based on UAV. J. Korean Soc. Surv. Geod. Photogramm. Cartogr. 2018, 36, 555–563. [Google Scholar]
- Li, S.; Yang, B. A new pan-sharpening method using a compressed sensing technique. IEEE Trans. Geosci. Remote Sens. 2010, 49, 738–746. [Google Scholar] [CrossRef]
- Garzelli, A. Pansharpening of multispectral images based on nonlocal parameter optimization. IEEE Trans. Geosci. Remote Sens. 2015, 53, 2096–2107. [Google Scholar] [CrossRef]
- Dennison, P.E.; Halligan, K.Q.; Roberts, D.A. A comparison of error metrics and constraints for multiple endmember spectral mixture analysis and spectral angle mapper. Remote Sens. Environ. 2004, 93, 359–367. [Google Scholar] [CrossRef]
- Hecker, C.; Meijde, M.; Werff, H.; Meer, F.D. Assessing the influence of reference spectra on synthetic SAM classification results. IEEE Trans. Geosci. Remote Sens. 2008, 46, 4162–4172. [Google Scholar] [CrossRef]
- Chang, C.I. An information-theoretic approach to spectral variability, similarity and discrimination for hyperspectral image analysis. IEEE Trans. Inf. Theory 2000, 46, 1927–1932. [Google Scholar] [CrossRef]
- Wang, K.; Yong, B. Application of the frequency spectrum to spectral similarity measures. Remote Sens. 2016, 8, 344–368. [Google Scholar] [CrossRef]
- Nidamanuri, R.R.; Zbell, B. Normalized spectral similarity score (NS3) as an efficient spectral library searching method for hyperspectral image classification. IEEE J. Sel. Top. Appl. Earth Obs. Remote Sens. 2010, 4, 226–240. [Google Scholar] [CrossRef]
- Nidamanuri, R.R. Spectral identification of materials by reflectance spectral library search. Geocarto Int. 2014, 29, 609–624. [Google Scholar] [CrossRef]
Publisher’s Note: MDPI stays neutral with regard to jurisdictional claims in published maps and institutional affiliations. |
© 2021 by the authors. Licensee MDPI, Basel, Switzerland. This article is an open access article distributed under the terms and conditions of the Creative Commons Attribution (CC BY) license (https://creativecommons.org/licenses/by/4.0/).