
Exploring Countermeasures from a Psychological Perspective to Create a Safe Driving Environment for Personal Mobility Devices

Abstract
1. Introduction
2. Literature Review
3. Data
3.1. Descriptive Statistics of Respondents
3.2. Psychological Perspectives of PM Device Driving
4. Analysis
4.1. Reliability Analysis
4.2. Model Estimation
- “Perception of PM device → Infrastructure” (B = 0.3, t = 5.973 **)
- “Perception of PM device → Easy to drive/handle” (B = 0.267, t = 5.441 **)
- Perception of PM device → Legal system” (B = 0.293, t = 6.479 **)
- “Perception of PM device → Intention to use in the future” (B = 0.561, t = 14.28 **)
- “Easy to drive/handle → Safety equipment” (B = 0.135, t = 2.161 *)
- “Easy to drive/handle→ Safety system” (B = 0.146, t = 2.436 *)
- “Perception of PM device → Safety equipment” (B = −0.15; t = −2.818 **)
- “Perception of PM device → Safety system” (B = −0.161, t = −3.335 **)
- “Legal system → Safety equipment” (B = −0.315, t = −5.071 **)
- “Legal system → Safety systems” (B = −0.27, t = −4.496 **)
5. Discussion
Author Contributions
Funding
Institutional Review Board Statement
Informed Consent Statement
Data Availability Statement
Acknowledgments
Conflicts of Interest
References
- Shin, H.; Jung, K.; Lee, J.; Park, S.; Kim, S.; Yang, S. Support Project for Micro Mobility Transport Policy; The Korea Transport Institute: Sejong, Korea, 2017. [Google Scholar]
- Ji, W.; Park, K.; Yoon, J. Bicycle Lane Enhancement Measures for Increasing Use of Personal Mobilities; Gyeonggi Research Institute: Suwon, Korea, 2018. [Google Scholar]
- Song, J.; Ryu, I.; Lee, S.; Choi, K. A Study on Personal Mobility User Characteristics and Cognitive Response Time. In Proceedings of the Korean Society of Transportation Academic Conference, Seoul, Korea, 10 November 2019. [Google Scholar]
- CEVEQ. Centre for Electric Vehicle Experimentation in Quebec. Pilot Project for Evaluating Motorized Personal Transportation Device: Segways and Electric Scooters; CEVEQ: Montreal, QC, Canada, 2004. [Google Scholar]
- Landis, B.W.; Theodore, A.P.; Herman, F.H. Characteristics of Emerging Road and Trail Users and Their Safety; The Federal Highway Administration (FHWA) Research, Development, and Technology Turner-Fairbank Highway Research Center: McLean, VA, USA, 2004. [Google Scholar]
- Darmochwal, A.; Topp, H.H. Segway in Public Spaces: Evaluation of the Saarland Pilot Trial with Regard to the Usage Compatibility and the Road Traffic Regulatory Handling of These Special Transport Devices; Institute for Mobility & Transport: Lisbon, Portugal, 2006; Available online: https://www.ft.dk/samling/20061/almdel/tru/bilag/560/392826.pdf (accessed on 20 February 2021).
- Kühn, G. Assessing the Safety Characteristics of the Segway; German Insurance Association: Berlin, Germany, 2009. [Google Scholar]
- Yu, H. Modeling pedestrians’ subjective danger perception toward personal mobility vehicles. Transp. Res. Part F Traffic Psychol. Behav. 2018, 56, 256–267. [Google Scholar]
- Sosik, J.J.; Kahai, S.S.; Piovoso, M.J. Silver bullet or voodoo statistics? A primer for using the partial least squares data analytic technique in Group and Organization Research. Group Organ. Manag. 2009, 34, 5–36. [Google Scholar] [CrossRef]
- Ringle, C.M.; Sarstedt, M.; Straub, D.W. A critical look at the use of PLS-SEM in MIS quarterly. MIS Q. 2012, 36, iii–xiv. [Google Scholar] [CrossRef]
- Peng, D.X.; Lai, F. Using partial least squares in operations management research: A practical guideline and summary of past research. J. Oper. Manag. 2012, 30, 467–480. [Google Scholar] [CrossRef]
- Hair, J.F.; Sarstedt, M.; Pieper, T.M.; Ringle, C.M. The use of partial least squares structural equation modeling in strategic management research: A review of past practices and recommendations for future applications. Long Range Plan. 2012, 45, 320–340. [Google Scholar] [CrossRef]
- Hair, J.F.; Sarstedt, M.; Ringle, C.M.; Mena, J.A. An assessment of the use of partial least squares structural equation modeling in marketing research. J. Acad. Mark. Sci. 2012, 40, 414–433. [Google Scholar] [CrossRef]
- Kaufmann, L.; Gaeckler, J. A structured review of partial least squares in supply chain management research. J. Purch. Supply Manag. 2015, 21, 259–272. [Google Scholar] [CrossRef]
- Richter, N.F.; Sinkovics, R.R.; Ringle, C.M.; Schlägel, C.M. A critical look at the use of SEM in international business research. Int. Mark. Rev. 2015, 33, 376–404. [Google Scholar] [CrossRef]
- Nitzl, C. The use of partial least squares structural equation modelling (PLS-SEM) in management accounting research: Directions for future theory development. J. Account. Lit. 2016, 37, 19–35. [Google Scholar] [CrossRef]
- Ali, F.; Rasoolimanesh, S.M.; Sarstedt, M.; Ringle, C.M.; Ryu, K. An assessment of the use of partial least squares structural equation modeling (PLS-SEM) in hospitality research. Int. J. Contemp. Hosp. Manag. 2018, 30, 514–538. [Google Scholar] [CrossRef]
- Ringle, C.M.; Sarstedt, M.; Mitchell, R.; Gudergan, S.P. Partial least squares structural equation modeling in HRM research. Int. J. Hum. Resour. Manag. Forthcom. 2019, 31, 1617–1643. [Google Scholar] [CrossRef]
- Hair, J.F.; Rosher, J.J.; Sarstedt, M.; Ring, C.M. When to use and how to report the results of PLS-SEM. Eur. Bus. Rev. 2019, 31, 2–24. [Google Scholar] [CrossRef]


| Item | Contents |
|---|---|
| Respondents | - Sex and Age, - Occupation, - Residence, - Possession of Vehicles |
| Psychological Perspectives for PM Device Driving | - Perception of personal mobility device - Satisfaction with the driving environment of personal mobility device (infrastructure, ease of use, relevant laws, and systems) - Necessity for the driving environment (Safety equipment and system) - Intention of using personal mobility device in the future |
| Category | Strongly Yes | Yes | Neutral | No | Strongly No | Total | |
|---|---|---|---|---|---|---|---|
| Well-known transport mode | N | 101 | 262 | 62 | 7 | 0 | 432 |
| % | 23.4 | 60.6 | 14.4 | 1.6 | 0 | 100.0 | |
| Useful as transport mode | N | 47 | 215 | 126 | 37 | 7 | 432 |
| % | 10.9 | 49.8 | 29.2 | 8.6 | 1.6 | 100.0 | |
| Eco-friendly transport mode | N | 56 | 211 | 140 | 23 | 2 | 432 |
| % | 13.0% | 48.8% | 32.4 | 5.3 | 0.5 | 100 | |
| Safe transport mode | N | 8 | 23 | 108 | 214 | 79 | 432 |
| % | 1.9 | 5.3 | 25.0 | 49.5 | 18.3 | 100.0 | |
| Easy to drive/handle | N | 29 | 211 | 162 | 28 | 2 | 432 |
| % | 6.7 | 48.8 | 37.5 | 6.5 | 0.5 | 100.0 | |
| Low-cost transport mode | N | 22 | 174 | 172 | 56 | 8 | 432 |
| % | 5.1 | 40.3 | 39.8 | 13.0 | 1.9 | 100.0 | |
| Category | Very Necessary | Necessary | Usually | Unnecessary | Very Unnecessary | Total | |
|---|---|---|---|---|---|---|---|
| Speed limiter | N | 172 | 191 | 53 | 15 | 1 | 432 |
| % | 39.8 | 44.2 | 12.3 | 3.5 | 0.2 | 100.0 | |
| Helmet | N | 220 | 141 | 50 | 19 | 2 | 432 |
| % | 50.9 | 32.6 | 11.6 | 4.4 | 0.5 | 100.0 | |
| Headlight | N | 225 | 166 | 35 | 6 | - | 432 |
| % | 52.1 | 38.4 | 8.1 | 1.4 | - | 100.0 | |
| Category | Very Necessary | Necessary | Usually | Unnecessary | Very Unnecessary | Total | |
|---|---|---|---|---|---|---|---|
| Operation of exclusive license system | N | 110 | 171 | 101 | 45 | 5 | 432 |
| % | 25.5 | 39.6 | 23.4 | 10.4 | 1.2 | 100.0 | |
| Mandatory completion of safety and driving training | N | 148 | 173 | 74 | 30 | 7 | 432 |
| % | 34.3 | 40.0 | 17.1 | 6.9 | 1.6 | 100.0 | |
| Mandatory wearing of safety devices | N | 193 | 159 | 59 | 17 | 4 | 432 |
| % | 44.7 | 36.8 | 13.7 | 3.9 | 0.9 | 100.0 | |
| Mandatory insurance subscription | N | 141 | 167 | 94 | 24 | 6 | 432 |
| % | 32.6 | 38.7 | 21.8 | 5.6 | 1.4 | 100.0 | |
| Age limit | N | 162 | 168 | 79 | 17 | 6 | 432 |
| % | 37.5 | 38.9 | 18.3 | 3.9 | 1.4 | 100.0 | |
| Factor | Category | PM Recog. | Infra | Conv. | Legal | Safety Device | System | Intent. to Use | |
|---|---|---|---|---|---|---|---|---|---|
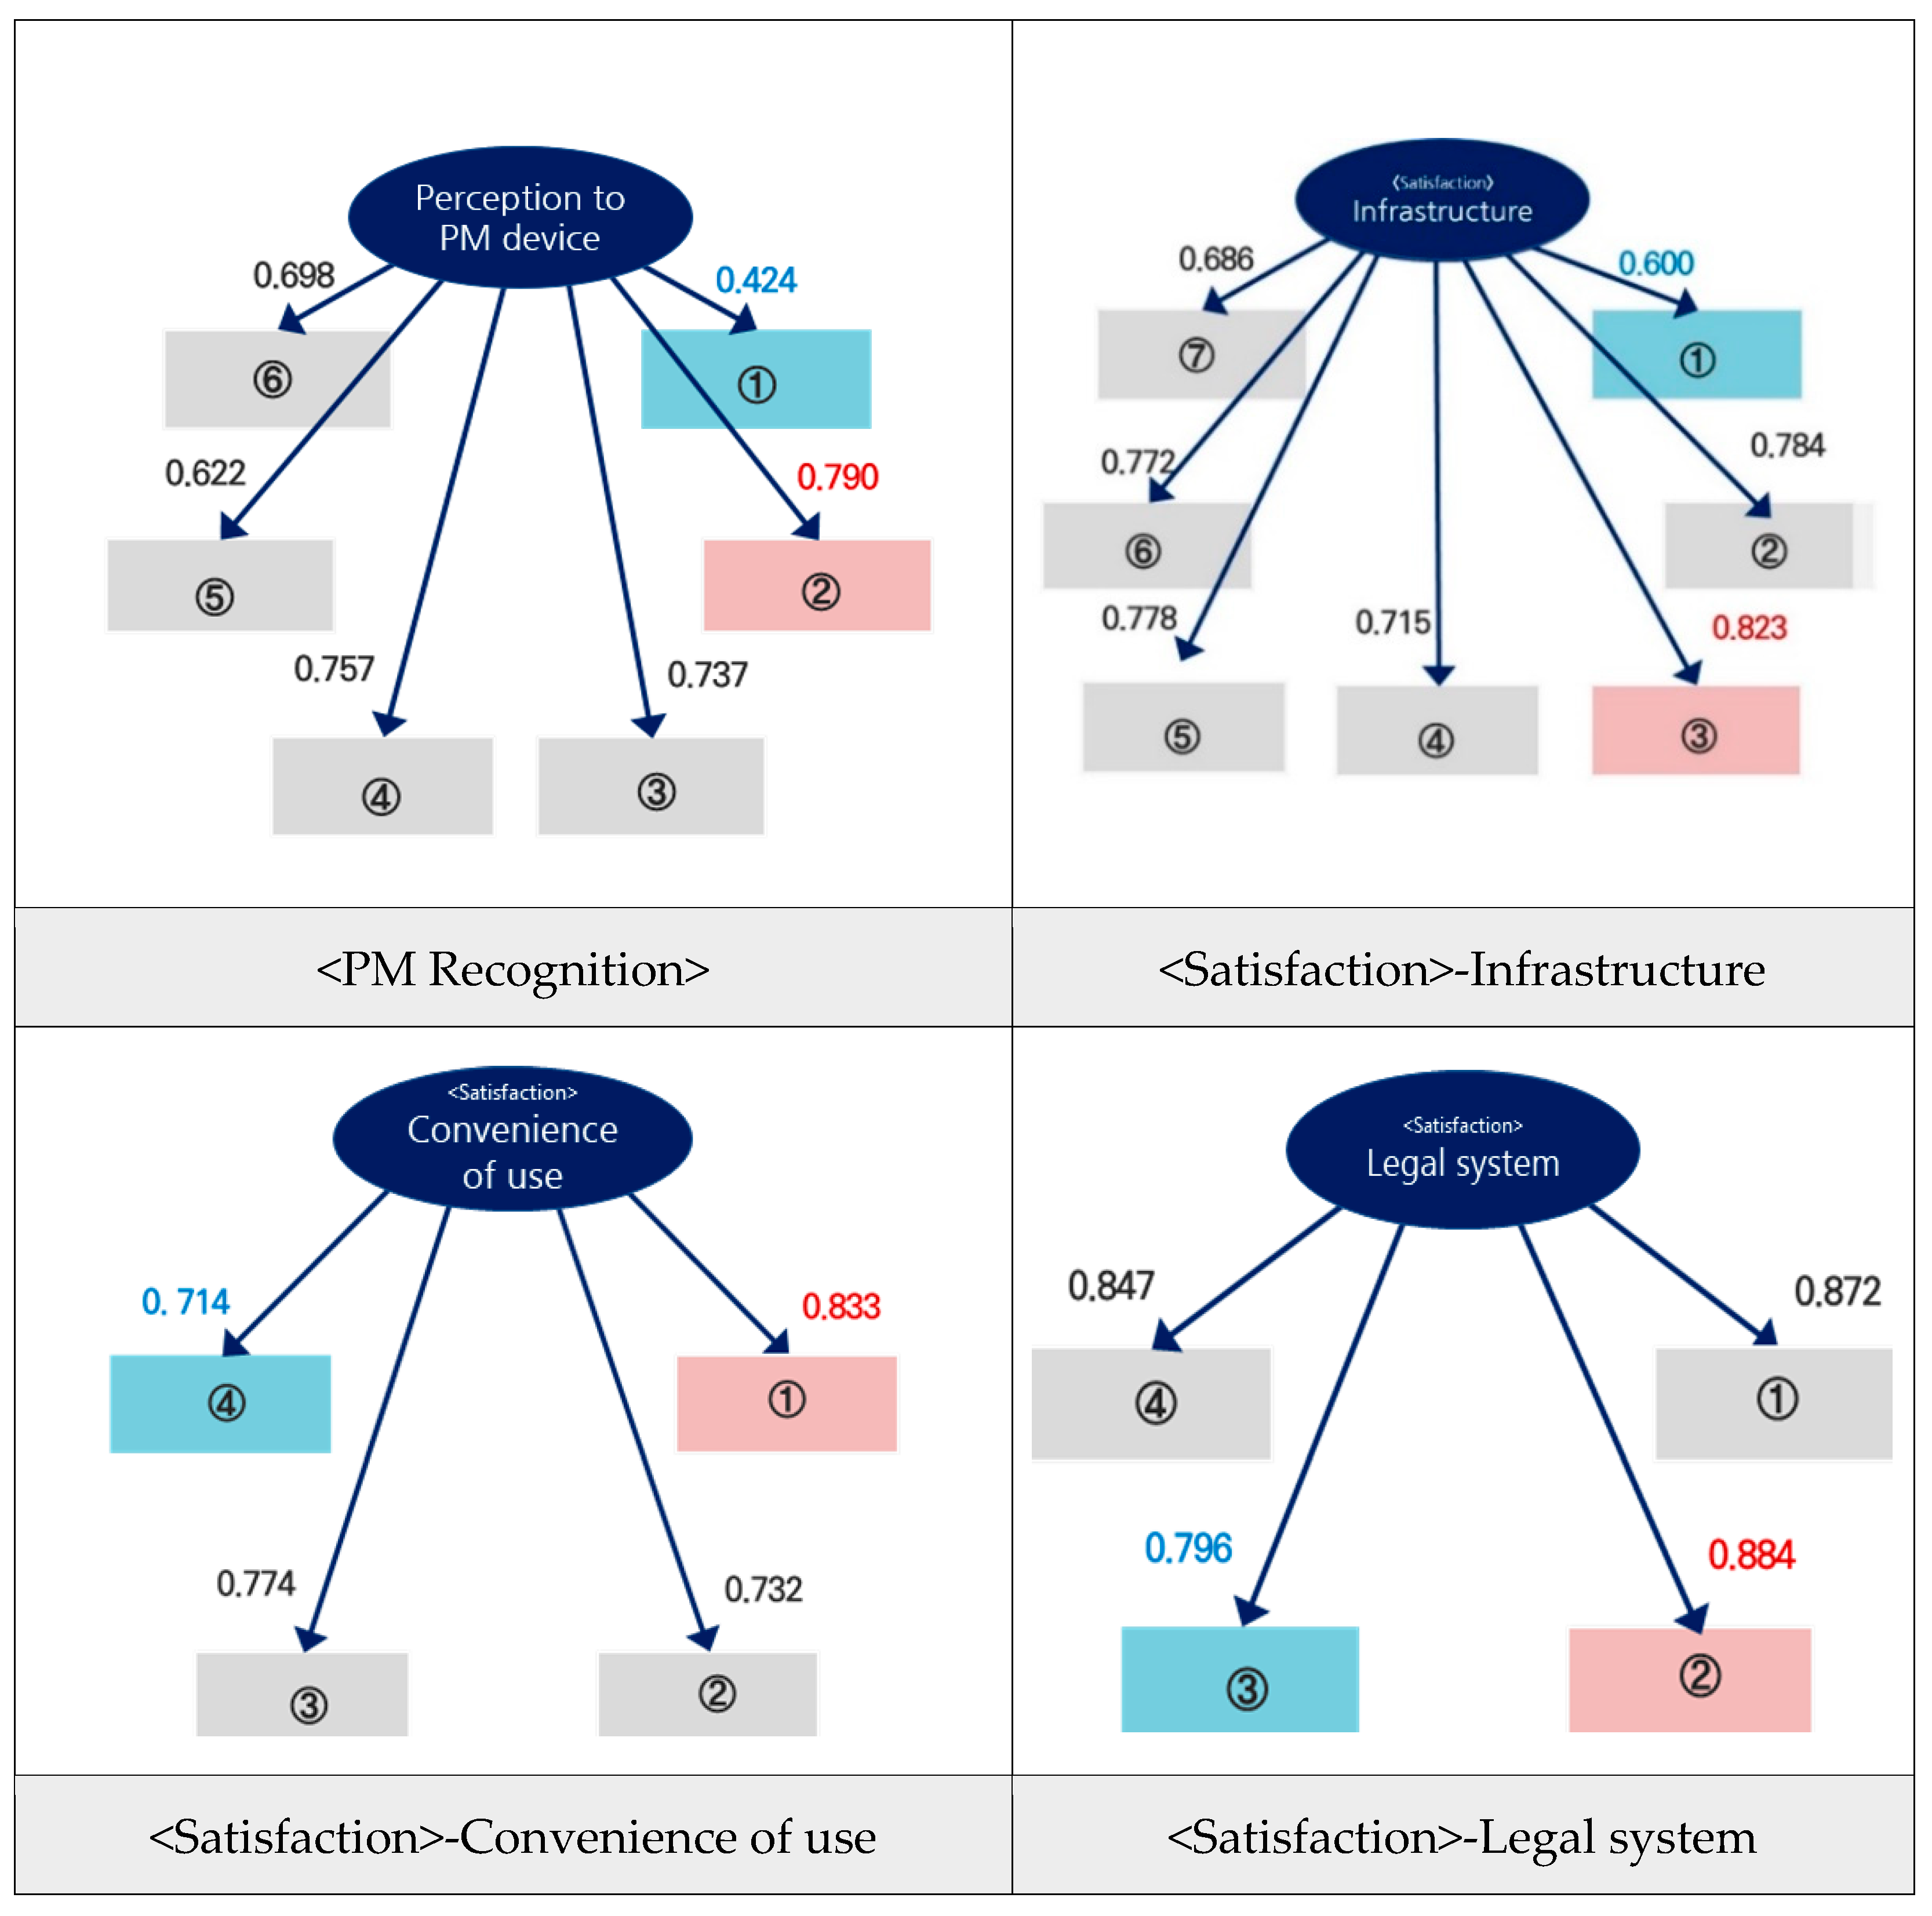
| Perception of PM device | ①Well-known transport mode | 0.424 | 0.061 | 0.138 | −0.065 | 0.140 | 0.083 | 0.339 | |
| ②Useful as transport mode | 0.790 | 0.168 | 0.189 | 0.175 | −0.168 | −0.174 | 0.536 | ||
| ③Eco-friendly transport mode | 0.737 | 0.186 | 0.213 | 0.173 | −0.095 | −0.095 | 0.480 | ||
| ④Safe transport mode | 0.757 | 0.326 | 0.141 | 0.366 | −0.340 | −0.350 | 0.376 | ||
| ⑤Easy to drive/handle | 0.622 | 0.196 | 0.213 | 0.124 | 0.036 | −0.019 | 0.336 | ||
| ⑥Low-cost transport mode | 0.698 | 0.171 | 0.268 | 0.157 | −0.035 | −0.024 | 0.316 | ||
| Satisfaction level of driving environment | Infrastructure | ①Gradient | 0.248 | 0.600 | 0.290 | 0.304 | −0.052 | −0.092 | 0.189 |
| ②Bicycle road sign | 0.250 | 0.784 | 0.386 | 0.447 | −0.147 | −0.173 | 0.103 | ||
| ③Bicycle road Design specification | 0.251 | 0.823 | 0.399 | 0.451 | −0.141 | −0.149 | 0.168 | ||
| ④Bicycle road pavement condition | 0.140 | 0.715 | 0.329 | 0.364 | −0.047 | −0.109 | 0.045 | ||
| ⑤Bicycle road connectivity | 0.193 | 0.778 | 0.433 | 0.444 | −0.132 | −0.160 | 0.110 | ||
| ⑥Drivable space | 0.243 | 0.772 | 0.470 | 0.503 | −0.109 | −0.139 | 0.195 | ||
| ⑦Personal mobility additional facilities | 0.186 | 0.686 | 0.564 | 0.570 | −0.105 | −0.146 | 0.075 | ||
| Convenience of use | ①PM Accessibility | 0.206 | 0.490 | 0.833 | 0.388 | −0.035 | −0.062 | 0.174 | |
| ②Connectivity with transportation | 0.140 | 0.400 | 0.732 | 0.353 | −0.032 | −0.014 | 0.062 | ||
| ③Carrying PM in public transportation | 0.157 | 0.457 | 0.774 | 0.446 | −0.118 | −0.088 | 0.049 | ||
| ④PM Economics | 0.294 | 0.338 | 0.714 | 0.297 | 0.027 | −0.011 | 0.124 | ||
| Legal system | ①Law | 0.294 | 0.519 | 0.478 | 0.872 | −0.247 | −0.262 | 0.136 | |
| ②Insurance | 0.269 | 0.497 | 0.371 | 0.884 | −0.274 | −0.269 | 0.174 | ||
| ③Incentive | 0.155 | 0.453 | 0.415 | 0.796 | −0.161 | −0.147 | 0.032 | ||
| ④Maintenance and enforcement | 0.239 | 0.556 | 0.404 | 0.847 | −0.262 | −0.244 | 0.172 | ||
| Necessity | Safety device | ①Speed limiter | −0.186 | −0.157 | −0.106 | −0.269 | 0.876 | 0.535 | −0.133 |
| ②Helmet | −0.195 | −0.114 | −0.007 | −0.226 | 0.874 | 0.666 | −0.188 | ||
| ③Headlight | −0.118 | −0.091 | 0.006 | −0.232 | 0.783 | 0.571 | −0.047 | ||
| System | ①Operation of exclusive license system | −0.185 | −0.142 | −0.062 | −0.208 | 0.497 | 0.791 | −0.195 | |
| ②Mandatory completion of safety and driving training | −0.237 | −0.203 | −0.077 | −0.217 | 0.608 | 0.895 | −0.229 | ||
| ③Mandatory wearing of safety devices | −0.184 | −0.147 | −0.039 | −0.237 | 0.706 | 0.861 | −0.124 | ||
| ④Mandatory insurance subscription | −0.156 | −0.120 | −0.041 | −0.229 | 0.511 | 0.789 | −0.176 | ||
| ⑤Age limit | −0.096 | −0.143 | −0.021 | −0.268 | 0.460 | 0.684 | −0.087 | ||
| Intention to use in the future | ①Willing to use after | 0.488 | 0.123 | 0.081 | 0.094 | −0.110 | −0.185 | 0.906 | |
| ②Willing to reuse | 0.524 | 0.154 | 0.128 | 0.132 | −0.103 | −0.172 | 0.926 | ||
| ③Recommended to others | 0.565 | 0.198 | 0.171 | 0.196 | −0.182 | −0.220 | 0.938 | ||
| ④Promotion possible | 0.519 | 0.177 | 0.127 | 0.165 | −0.159 | −0.180 | 0.901 | ||
| Cronbach’s alpha | 0.782 | 0.861 | 0.766 | 0.875 | 0.806 | 0.865 | 0.938 | ||
| DG.rho | 0.847 | 0.895 | 0.851 | 0.914 | 0.886 | 0.903 | 0.956 | ||
| AVE | 0.466 | 0.548 | 0.584 | 0.723 | 0.715 | 0.652 | 0.842 | ||
| Var. | 1 | 2(a) | 2(b) | 2(c) | 3(a) | 3(b) | 4 | √AVE | |
|---|---|---|---|---|---|---|---|---|---|
| Perception of PM device | 1 | 0.683 | |||||||
| Satisfaction of PM driving environment | (a) Infrastructure | 0.30 | 1 | 0.740 | |||||
| (b) Convenience of use | 0.27 | 0.56 | 1 | 0.765 | |||||
| (c) Legal system | 0.29 | 0.60 | 0.49 | 1 | 0.851 | ||||
| Necessity level for driving environment | (a) Safety equipment | −0.20 | −0.15 | −0.05 | −0.29 | 1 | 0.845 | ||
| (b) Safety system | −0.22 | −0.19 | −0.06 | −0.28 | 0.69 | 1 | |||
| Intention to use in the future | 0.57 | 0.18 | 0.14 | 0.17 | −0.16 | −0.21 | 1 | 0.918 | |
| Variables | R² | GoF | |
|---|---|---|---|
| Satisfaction level of driving environment | Infrastructure | 0.090 | 0.291 |
| Convenience of use | 0.071 | ||
| Legal system | 0.086 | ||
| Necessity level for driving environment | Safety equipment | 0.112 | |
| Safety system | 0.114 | ||
| Intention to use in the future | 0.338 | ||
| Category | B | s.e | t | p |
|---|---|---|---|---|
| Perception of PM device → Infrastructure | 0.300 | 0.050 | 5.973 | 0.000 *** |
| Perception of PM device → Convenience of use | 0.267 | 0.049 | 5.441 | 0.000 *** |
| Perception of PM device → Legal system | 0.293 | 0.045 | 6.479 | 0.000 *** |
| Perception of PM device → Safety equipment | −0.150 | 0.053 | −2.818 | 0.005 ** |
| Perception of PM device → Safety system | −0.161 | 0.048 | −3.335 | 0.001 ** |
| Perception of PM device → Intention to use in the future | 0.561 | 0.039 | 14.280 | 0.000 *** |
| Infrastructure → Safety equipment | 0.011 | 0.061 | 0.176 | 0.860 |
| Infrastructure → Safety system | −0.061 | 0.057 | −1.080 | −0.720 |
| Infrastructure → Intention to use in the future | 0.017 | 0.054 | 0.323 | 0.253 |
| Convenience of use → Safety equipment | 0.135 | 0.062 | 2.161 | 0.031 * |
| Convenience of use → Safety system | 0.146 | 0.060 | 2.436 | 0.015 * |
| Convenience of use → Intention to use in the future | −0.009 | 0.064 | −0.139 | −0.111 |
| Legal system → Safety equipment | −0.315 | 0.062 | −5.071 | 0.000 *** |
| Legal system → Safety system | −0.270 | 0.060 | −4.496 | 0.000 *** |
| Legal system → Intention to use in the future | −0.028 | 0.066 | −0.428 | −0.331 |
| Safety equipment → Intention to use in the future | 0.029 | 0.063 | 0.465 | 0.642 |
| Safety system → Intention to use in the future | −0.110 | 0.069 | −1.602 | −0.891 |
| Path | B | s.e | t | p |
|---|---|---|---|---|
| Perception to PM device → Safety equipment | −0.203 | 0.049 | −4.109 | 0.000 *** |
| Perception to PM device → Safety system | −0.219 | 0.049 | −4.494 | 0.000 *** |
| Perception to PM device → Intention to use in the future | 0.574 | 0.034 | 17.032 | 0.000 *** |
| Infrastructure → Intention to use in the future | 0.025 | 0.053 | 0.463 | 0.643 |
| Convenience of use → Intention to use in the future | −0.021 | 0.061 | −0.343 | −0.269 |
| Legal system → Intention to use in the future | −0.008 | 0.061 | −0.123 | −0.098 |
Publisher’s Note: MDPI stays neutral with regard to jurisdictional claims in published maps and institutional affiliations. |
© 2021 by the authors. Licensee MDPI, Basel, Switzerland. This article is an open access article distributed under the terms and conditions of the Creative Commons Attribution (CC BY) license (https://creativecommons.org/licenses/by/4.0/).
Share and Cite
Kim, S.-H.; Lim, H.; Kim, J. Exploring Countermeasures from a Psychological Perspective to Create a Safe Driving Environment for Personal Mobility Devices. Sustainability 2021, 13, 5450. https://doi.org/10.3390/su13105450
Kim S-H, Lim H, Kim J. Exploring Countermeasures from a Psychological Perspective to Create a Safe Driving Environment for Personal Mobility Devices. Sustainability. 2021; 13(10):5450. https://doi.org/10.3390/su13105450
Chicago/Turabian StyleKim, Suk-Hee, Hyejin Lim, and Junghwa Kim. 2021. "Exploring Countermeasures from a Psychological Perspective to Create a Safe Driving Environment for Personal Mobility Devices" Sustainability 13, no. 10: 5450. https://doi.org/10.3390/su13105450
APA StyleKim, S.-H., Lim, H., & Kim, J. (2021). Exploring Countermeasures from a Psychological Perspective to Create a Safe Driving Environment for Personal Mobility Devices. Sustainability, 13(10), 5450. https://doi.org/10.3390/su13105450