Article

The Impact of Water and Soil Scarcity and Pollution on Industrial Agglomeration: Evidence from China

1
Business School, Nanjing Xiaozhuang University, 3601 Hongjing Avenue, Nanjing 211171, China
2
Institute of International Studies and School of Northeast Asia Studies, Shandong University, 180 Wenhua West Road, Weihai 264209, China
3
School of Economics and Management, Nanjing University of Science and Technology, 200 Xiaolingwei, Nanjing 210094, China
*
Author to whom correspondence should be addressed.
Sustainability 2021, 13(10), 5428; https://doi.org/10.3390/su13105428
Submission received: 21 March 2021 / Revised: 20 April 2021 / Accepted: 7 May 2021 / Published: 12 May 2021

Abstract

:
Water and soil scarcity and pollution have become more severe problems in China in recent years. On one hand, rapid economic growth has led to increasing environmental problems. On the other hand, the environmental problems resulting from human economic activities can impose new constraints on industrial agglomeration, making economic development unsustainable. In the present study, an individual fixed-effect model was constructed based on the framework of the new economic geography and the provincial-level data of China. The model estimated its parameters with OLS in order to analyze how the mechanisms of industrial agglomeration are affected by resource security and environmental factors. In addition, this study also used Hausman statistical tests and Fisher–PP unit root tests to analyze the endogenous problems and robustness of the model, respectively. The results showed that water and soil scarcity and environmental pollution have negative effects on industrial agglomeration. The negative effects were observed to significantly increase with levels of local government competition, but did not vary with the regional market segmentation.

1. Introduction

Over the past 40 years, China’s regional development strategy has changed from central-planed to market-driven, and from a balanced regional development mode to a differentiated regional development mode. With the reform of the labor market, the Hukou System, and social welfare systems, essential resources and factors of production can now flow across different regions and sectors, pursuing higher levels of allocation efficiency. This process has led to unprecedented speed in spatial agglomerations across industries within China. Along with industrial agglomeration, urbanization has taken place in China at a speed and on a scale that has been faster and larger than any urbanization process in the modern history of industrialized countries in the world. Urbanization and industrial agglomerations together have become the key strategies for regional economic development in China. In 2014, the Central Committee of the Communist Party of China (CPC) and the State Council issued the “National Plan on New Urbanization (2014 to 2020)”, which aims to convert the rural population into urban residents in an orderly manner. In 2019, the urbanization rate of China’s resident population reached a milestone level of 60.6%, which was equivalent to the global upper-middle level [1]. The combined effects of urbanization and industrial agglomeration have contributed to China’s high economic growth over the past several decades.
However, the patterns of industrial agglomeration and urbanization in China have been characterized by high energy consumption and low eco-efficiency, resulting in China’s ecological environments facing severe challenges. The most severe problems include the dramatic increases in water and soil consumption and higher environmental pollution levels. For example, due to the rapid progress of industrial and population agglomeration, China has been facing increasingly severe water and soil scarcity, particularly in the northern regions of the country. In addition, the increasing air, water, and solid waste pollution has further reduced water and soil quality. The issues related to water and soil scarcity and environmental pollution have caused severe impacts on Chinese society [2].
Globally speaking, resource scarcity and environmental pollution are widespread phenomena that occur during industrialization and urbanization processes. However, when exceeding certain thresholds, the negative ecological changes resulting from human economic activities may lead to resource depletion and environmental degradation, making economic development unsustainable. Above all, such negative changes may in turn generate negative impacts on industrial agglomeration. However, the existing research in this field has focused more attention on how industrial agglomeration affects the environment but has seldom paid attention to how environmental damage affects industrial agglomeration. In the current study, the restraining effects of resource shortages and environmental damages on industrial agglomeration were analyzed. The results illustrated how valuable a healthy ecosystem can be to regional economic development. Therefore, from a theoretical standpoint, this study built an equilibrium model which included industrial agglomeration and variables regarding water, soil, and pollution, for the purpose of analyzing how resource and environmental factors affect industrial agglomeration. Then, from an empirical perspective, this study focused on exploring the impacts of resource scarcity and environmental pollution on industrial agglomerations in different provinces in China. To be more specific, this study adopted a “relative resource shortage index” (RRSI) to evaluate regional resource shortages, which contained the two resource variables of water and soil, and had the ability to indirectly measure resource security. A “relative environmental damage index” (REDI) was used to measure the regional environmental damages, and the Hirschman–Herfindahl Index was selected as the indicator of the regional industrial agglomeration levels.
China was chosen as the research subject since it is the world’s largest developing country with major problems regarding land and water usage. It was considered that by studying the situation in China, some light could be shed on the general roles of resources and the environment in industrialization for other developing countries. Furthermore, China’s industrial agglomerations have a few unique characteristics due to China’s particular political system, which plays an important role in shaping the incentives of various participants. First of all, the local governments in China compete for production factors, and also have the power to influence the mobility of production factors and the behaviors of market agents. Secondly, significant interregional trade barriers exist as a result of local protectionism in China. The above-mentioned aspects of China’s political system were incorporated into one unified framework for the purpose of analyzing their effects on China’s industrial agglomerations.
In addition, the previous studies regarding industrial agglomerations have mainly focused on neoclassical economic frameworks, which in many cases cannot even guarantee the production of industrial clusters. However, resources and environmental elements have strong spatial attributes. Therefore, without proper constraints, perfect competition will lead to geographically local distributions of the economy. In order to address these issues, this study directed its analysis process to the influencing mechanisms of resources and environments in regard to industrial agglomerations under the framework of the new economic geography (NEG) [3,4]. Additionally, this study incorporated such factors as the scale of demand, trade costs, economy of scale, and the cyclical cumulative effects included in the theory of new economic geography into the analysis framework. This approach was also one of the innovations of this study.
This research study is organized as follows: Section 2 offers a review of the available literature regarding industrial agglomerations and environmental factors; Section 3 briefly describes the current situations of the industrial agglomerations, resource shortages, and environmental damage degrees in China; Section 4 describes the theoretical and empirical models used in this study to analyze how soil and water scarcity and pollution affect industrial agglomerations; Section 5 details the corresponding econometric analysis results, and the conclusions and discussion of the study are presented in final section.

2. Review of the Related Research Literature

For a long period of time, the determinants of industrial agglomeration have received much interest and attention. However, the majority of researchers do not regard natural endowments (such as superior endowments with natural resources or transportation facilities) as the key factors influencing industrial agglomeration. Such areas have only been used as control variables in empirical research studies [5]. Only a small number of research studies have taken natural endowments as essential factors influencing industrial agglomerations. For example, Kim argued that superior factor endowments can be used explain a major extent of the geographic variations in United States manufacturing trends between 1880 and 1987 [6]. Ellison and Glaeser found that industry locations are closely related to superior factor endowments, with approximately a quarter of the geographical concentrations in production in the United States manufacturing sector potentially attributed to endowment advantages [7]. Therefore, based on the previous evidence, it has been conjectured that at least half of the observed geographic agglomerations may be due to the advantages in natural endowments identified in previous research [8].
Ecosystems are environmental areas where natural resources are embedded. Ecosystems receive pollutants from the utilization of natural resources. However, ecosystems have limited abilities for self-purification. The net effects will determine the changes in ecosystems as a result of regional industrial agglomerations. China’s industrial agglomerations are characterized by extensive consumption of resources and high pollution levels. This has resulted in China facing severe environmental problems [9]. Existing studies have shown that China has already crossed the tipping point of industry over-concentrations, where the damaging effects on the environment now dominate the processes of industrial agglomeration, and potentially generate adverse effects on regional welfare [10,11].
However, differing from the aforementioned opinions, Yang and Li observed that both the Marshallian externalities caused by specialized agglomerations and the Jacob’s externalities caused by diversified agglomerations displayed a reversed U-curve with environmental technology efficiency [12]. Yan et al. explored the relationship between industrial agglomeration development and environmental pollution using China’s manufacturing industry data for the period ranging from 2003 to 2008 [13]. The results revealed that in the short term, industrial agglomerations were beneficial for reducing environmental pollution levels. However, in the long term, industrial agglomerations and environmental pollution levels will not have strong causal relationships.
The majority of the previous analyses regarding manufacturing agglomerations have evaluated the relative merits of clustered and dispersed spatial allocations of firms in terms of their effects on the efficiency of individual enterprises. However, the determination of the optimal levels of the agglomerations become more critical when the costs and benefits to society as a whole are considered. Researchers began to consider the influencing effects on social welfare of industrial agglomerations in the 1970s and 1980s. There was evidence of a growing awareness in economic geographical reports for the need to seek socially optimal solutions to resource allocation problems. In that light, there was also increasing awareness of the relevance of insights from welfare economic studies when searching for a location theory of resources [14]. This increased awareness inspired subsequent researchers to adopt welfare approaches when studying human geography [15].
The relationships between those methods and industrial location analysis methods are closely related to the influencing effects of manufacturing facilities on their surrounding areas. Industrial enterprises have favorable and unfavorable influences on their surrounding areas, and those positive and negative externalities will produce different spatial patterns of agglomeration or dispersion [16]. Therefore, the current focus on the negative externalities of air and water pollution is a response to the need to consider social costs in the analyses of industrial agglomerations [17].
Geographical spaces are important subjects in environmental economic research. However, there have been few environmental economic studies completed regarding the geographical dimensions of pollution, especially the interactions between the geographical dimensions of pollution and the spatial patterns of economic activities. A seminar paper in this field was submitted by Siebert, which was written before the emergence of New Economic Geography (NEG) and based on a traditional foreign trade model [18]. In addition, Rauscher, Hoel, and Markusen et al. examined the cross-regional competition between polluting firms and found that since this competition was dependent on the severity of the environmental damages, the outcomes of the competition were either a “race to the bottom” or “not in my backyard” scenarios [19,20,21]. Similar results were obtained by Pflüger, who examined the issue using a trade model incorporating Dixit–Stiglitz monopolistic competition and “iceberg” transportation costs [22]. Although the model contained the main building blocks of the NEG theory, it was essentially still a trade model in the sense that the factors of production did not flow and the agglomerations were excluded.
Previous studies that explicitly put forward economic geography theories included those conducted by Rauscher, Elbers and Withagen, Van Marrewijk, and Lange and Quaas. Rauscher investigated at a variety of NEG models and derived optimal environmental policies only for a world in which factors could not flow, while the residents had the ability to change their locations [23,24]. In the studies conducted by Elbers and Withagen and Van Marrewijk, core-periphery NEG models were utilized, in which centrifugal and centripetal forces existed and the derived results showed that the agglomeration forces were mitigated by environmental externalities [25,26]. Similar results were also reported by Lange and Quaas, who derived a wide range of economic geography patterns, including full agglomeration, partial agglomeration, and dispersion of economic activities [27]. In another related study, Zhu et al. incorporated both resource shortages and environmental damages into one unified framework for the purpose of analyzing their effects on industrial agglomerations [28]. However, in contrast to that research investigation, this study not only extended the data sampling to the most recent years, but also studied the influencing effects of government policies, including local government competition and market segmentation. The key focus in this study was to determine whether or not environmental damages and resource constraints were more influential in regions where local government competition and market segmentation were more severe.

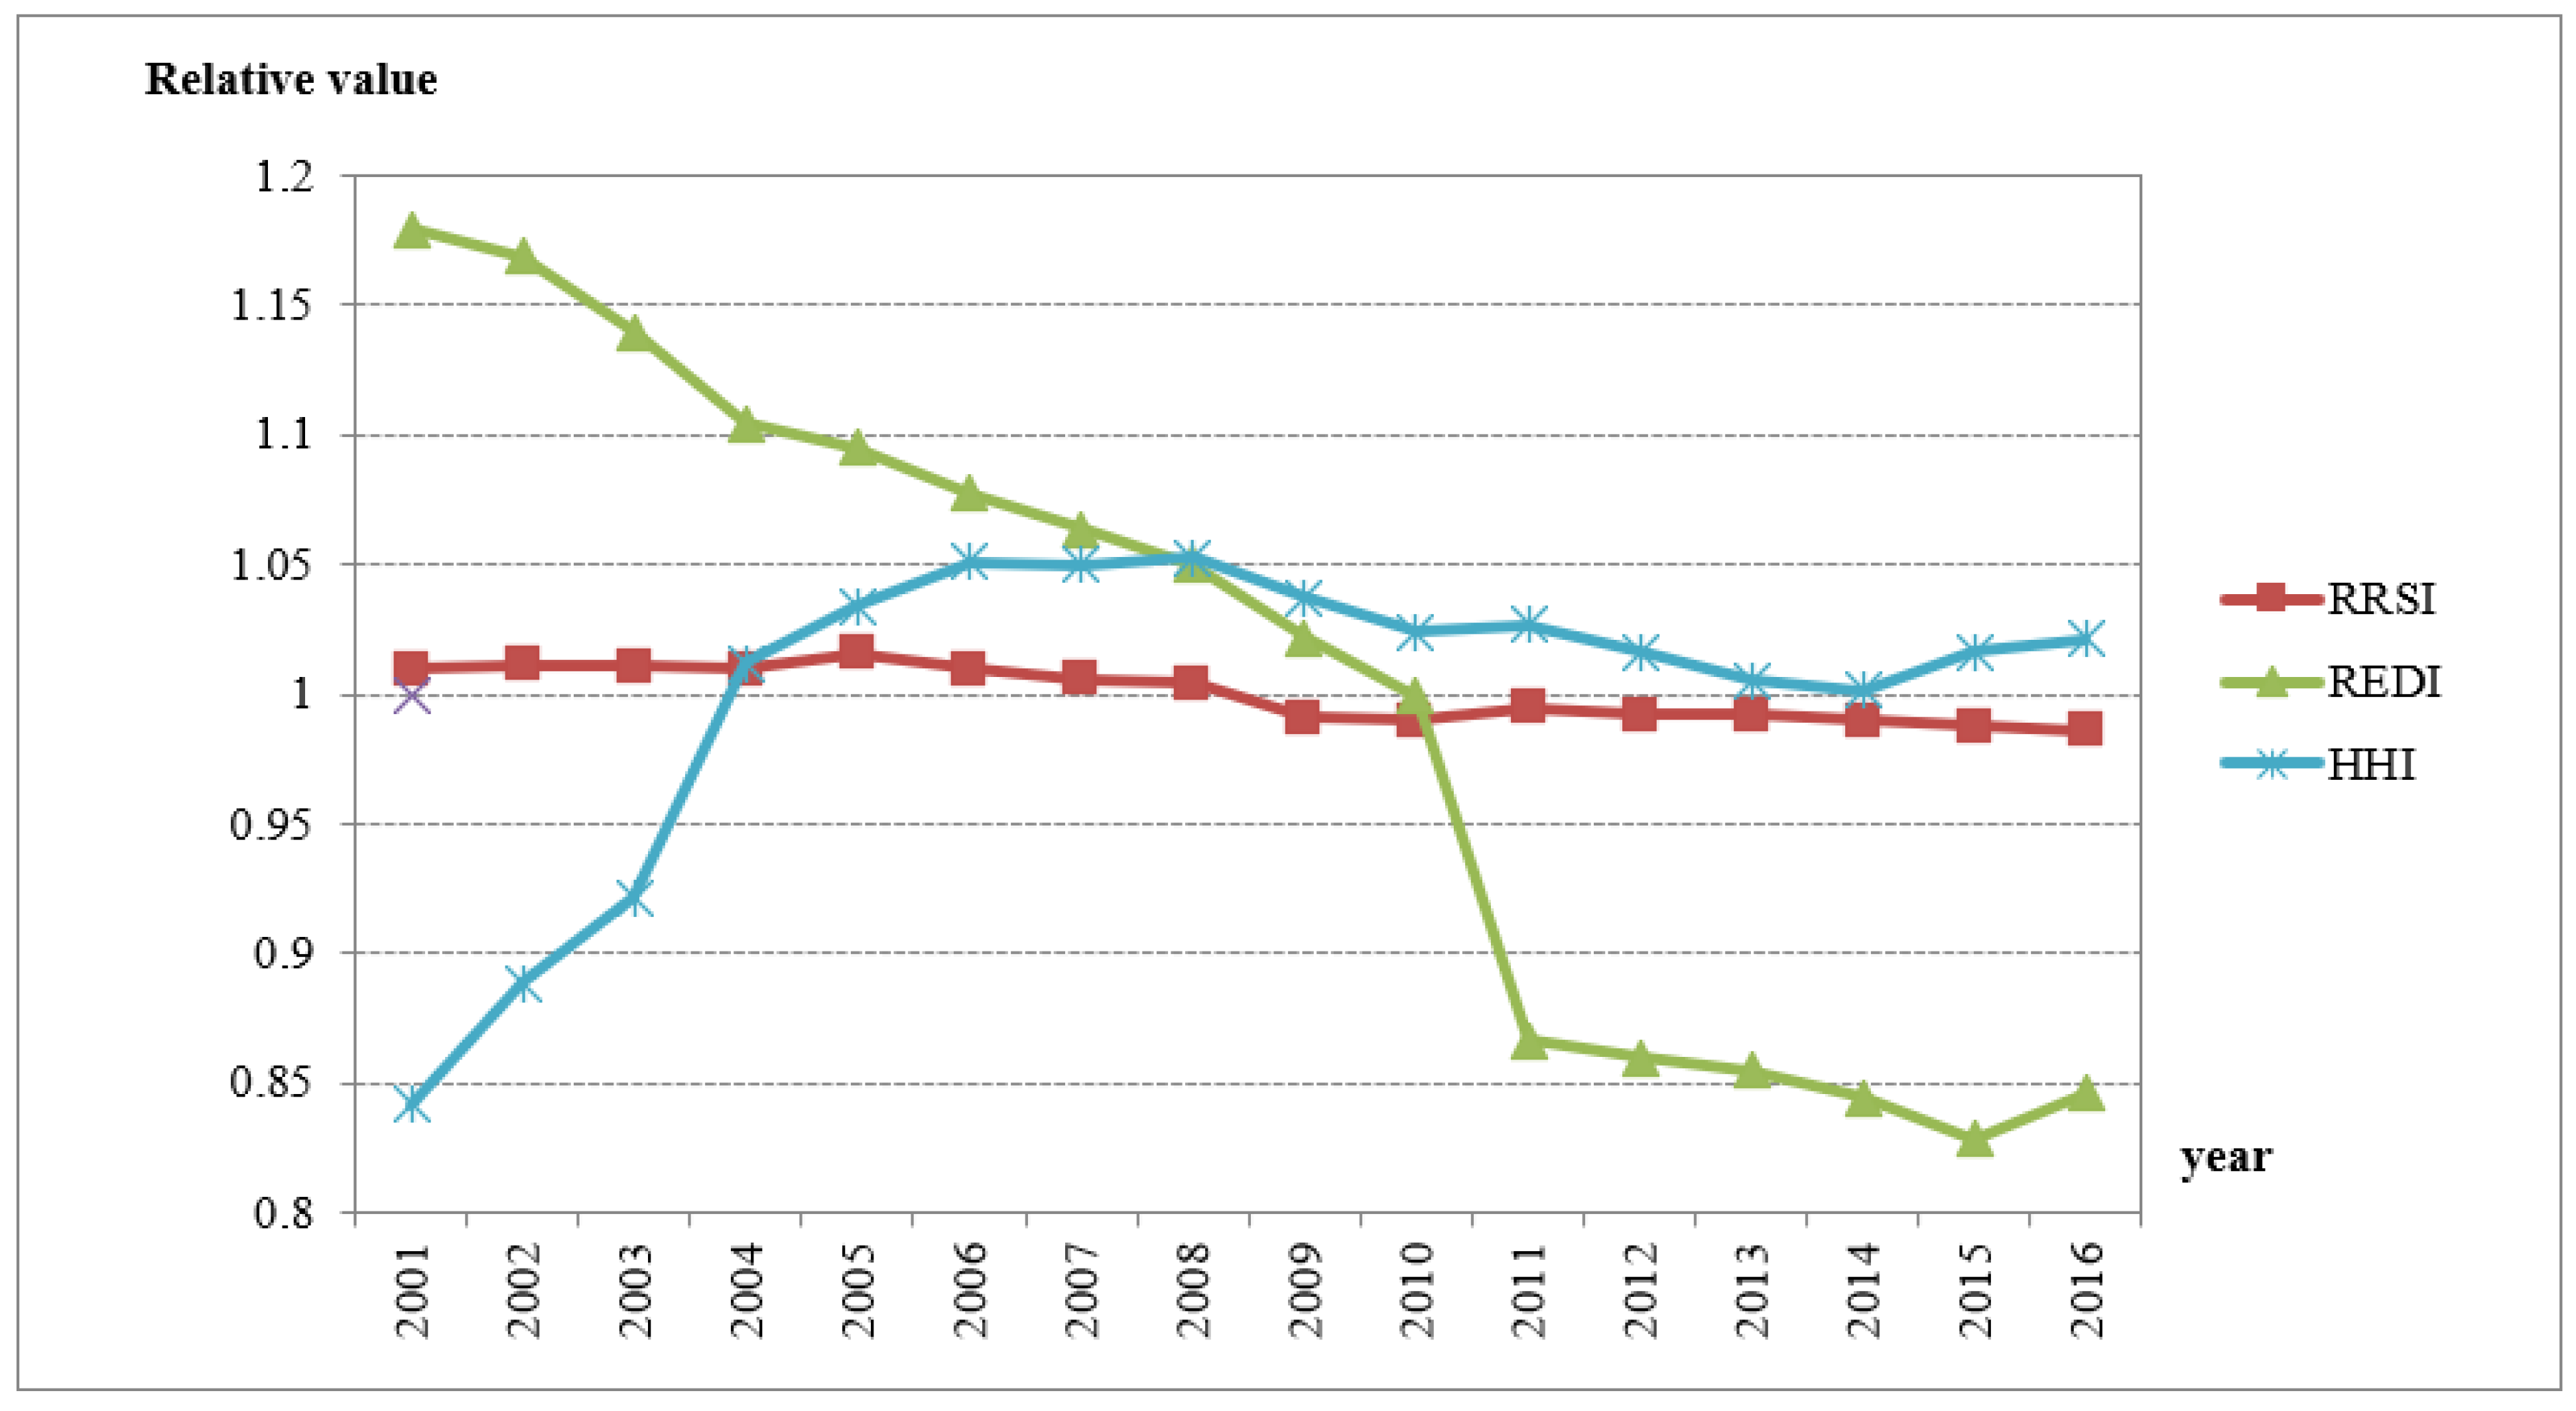
3. Changes in Industrial Agglomeration, Resource Shortages, and Environmental Damage Degrees in China over Time

In the present study, building on the research conducted by Fan and Scott [29], the Hirschman–Herfindahl Index (HHI)was used as the indicator of the regional industrial agglomeration levels. Then, by denoting xij as the quantity of enterprise (or quantity of employment) of industry i in region j, and denoting xi as the quantity of the enterprise (or quantity of employment) of industry i (Equation (1)) the HHI in region j could be expressed as follows:
x i = j = 1 m x i j
H H I j = i = 1 n ( x i j / x i ) 2
when all of the economic activities of n industries were concentrated in one area, HHI = 1; when all the economic activities of n industries were scattered over m regions, HHI = 0. This study adopted a mathematical mean of the HHI of the number of enterprises and the HHI of the number of employed people for the purpose of evaluating the overall conditions of the regional industrial agglomerations [30].
In addition, this study adopted the “relative resource shortage index” (RRSI) to evaluate regional resource shortages. The RRSI was calculated as follows:
  R R S I = ( R R ÷ C R ) / ( R C ÷ C C )
where RR represents the quantity of the regional resources, CR is the quantity of the national resources, RC indicates the consumption of the regional resources, and CC is the consumption of the national resources. Although the total amounts of land and water resources in China are very large, these resources are regionally unevenly distributed. Therefore, the actual supply and per capita occupancy of the regional land and water resources are very low. In order to calculate the degrees of relative shortage, it was assumed that the regional per capita consumption of land and water resources was equal to the national average. Then, the regional population could be used as the proxy for the land and water resource consumption. Subsequently, the RRSI formula was rewritten as follows:
R R S I = ( R R ÷ C R ) / ( R C ÷ C C ) = ( R R ÷ C R ) / ( R P ÷ C P ) = R R P / C R P
where RP represents the regional population, CP denotes the national population, RRP indicates the regional per capita usage of land and water resources, and CRP is the national per capita usage of land and water resources. The smaller the RRSI was, the more severe the regional resource shortage would be.
This study adopted the “relative environmental damage index” (REDI) to evaluate the regional environmental damage levels. The RDI was calculated using the following formula:
R E D I = ( R D ÷ C D ) / ( R C ÷ C C )
where RD indicates the regional pollutant emission, CD is the national pollutant emission, RC represents the regional environmental carrying capacity, and CC is the national environmental carrying capacity. The REDI is the ratio of the proportion of pollutant emissions to the proportion of the environmental carrying capacity. However, due to limited data availability of the environmental carrying capacities, this study assumed that the regional environmental carrying capacity per area unit was consistent with the national average. The land area of each region was then used as a proxy for its environmental carrying capacity. The RDI formula was subsequently rewritten as follows:
R E D I = ( R D ÷ C D ) / ( R C ÷ C C ) = ( R D ÷ C D ) / ( R A ÷ C A ) = R D A / C D A
where RA indicates the regional land area, CA is the national land area, RDA represents the regional pollutant emissions per area unit, and CDA denotes the national pollutant emissions per area unit. Then, using the formula of the RDI, the RDIs of three types of pollutants (industrial solid waste, COD emissions, and sulfur-dioxide emissions) were calculated in each region. This study then calculated the totals in order to obtain the REDI of each province. The smaller REDI was, the lighter the regional environmental damages would be.
The relative values of the HHI, RSI, and RDI of China from 2001 to 2016 were calculated, and a map of the relative changes over time (relative values of the HHI, RRSI, and REDI were defined as the values of the HHI, RRSI, and REDI for each year divided by its mean value from 2001 to 2016) was formulated, as shown in Figure 1. A detailed explanation on this study’s selection of the industries used to construct the HHI indices can be found in the Appendix A section. As detailed in Figure 1, the RRSI had a relatively small range of change and showed a slight downward trend, which was basically maintained at approximately 1. This indicated that the situation of land and water resource shortages had been deteriorating for a long period of time. The REDI had been showing a downward trend, which suggested that the environmental damage levels had improved. In terms of the HHI, its dynamic trend could be divided into two stages. First of all, from 2001 to 2008, the HHI rose rapidly, reflecting the obvious upward trend of the industrial agglomeration. During the second stage, from 2009 to 2016, the index showed a slight downward trend, which indicated that the level of industrial agglomeration in China had declined slightly.
The trends of the HHI, RRSI, and REDI in China were found to have complex relationships which were embedded in a special institutional arrangement following China’s economic transition and market transformation. As a result of the reforms, local officials were evaluated based on local economic performances, which created fierce competition among local governments and presented incentives for local protectionism. Local protectionism resulted in market segmentation across regions in China. Under the dual backgrounds of local government competition and market segmentation, regions introduced more stringent policies for environmental regulation and emission reduction than previously. The resources shortages became demand-led market shortages rather than resource exhaustion, which led to increasing levels of industrial agglomeration instead of reductions in industrial agglomeration. These local government competition and market segmentation factors were endogenous of the industrial agglomerations China’s unique institutional background. These factors are the primary focus of this research investigation.

4. Theoretical Framework and Empirical Model

4.1. Theoretical Model

China’s resource and environmental markets have been categorized as a typical monopolistic competition market structure [31,32,33]. The Dixit–Stiglitz (D–S) monopolistic competition framework is commonly used as an analytical framework for analyzing issues related to the monopolistic competition market structure [34,35]. Therefore, under the framework of a new economic geography, this study adopted Cobb–Douglas (C–D) technology to construct a theoretical model according to the monopolistic competition in the D–S model. The impact mechanisms of resource shortages and environmental damages related to the agglomeration of industrial enterprises were then analyzed.
In order to highlight the resource and environmental constraints, this study assumed that a representative firm used only two types of input for production: land resources and water resources. The total cost function of the firm was calculated as follows:
T C = ω 1 δ n δ ( α + β q )
(where TC is the total cost, w indicates the price of water resources, n denotes the price of land resources, q represents the production of the enterprise, δ and 1-δ are the shares of land and water resources used as input), respectively, and α and β are the fixed and marginal costs of production, respectively.
Regional land resources cannot be transferred and are the scarcest resource in regional industrial agglomerations. The scarcity of regional water resources is due to the non-renewability of the resources. In addition, due to increasing demands for water resources for regional economic development, various degrees of water resource shortages emerge in different regions. The prices of land and water resources as a function of industrial agglomeration and resource shortages were determined as follows:
ω = h η / ( 1 η ) ω o
n = h μ / ( 1 μ ) n 0
(where h represents the level of industrial agglomeration, η and μ measure the shortages of water and land resources (0 < η < 1; 0 < μ < 1), respectively, and w0 and n0 are the initial prices of water and land resources, respectively. The price functions indicated two relationships: (1) a higher level of regional industrial agglomeration results in higher prices for land and water resources, and (2) a higher shortage degree of resources of a region results in higher prices of land and water resources.
According to the characteristics of the D–S monopolistic competition, each industrial enterprise in a region produces products that are substitutes for each other. In addition, industrial enterprises are taken to be similar in size, making their production symmetric. It has been determined that when the demand in a region remains constant, the output of a single industrial enterprise decreases with the number of regional industrial enterprises and the levels of regional industrial agglomeration. Therefore, if the initial output of an industrial enterprise is q0, the price elasticity of demand for the product is e, and e > 1, then the output of an industrial enterprise will be as follows:
q = ( h q 0 ( 1 e ) ) 1 / ( 1 e )
As a result of high agglomeration levels, due to the relatively concentrated pollutant emissions and large total emissions caused by regional industrial enterprises, against the background of stricter environmental protection policies, industrial enterprises will need to pay more congestion fees in order to offset environmental damages. Therefore, by assuming these fees will be charged as a fraction (φ, out of the product price P), then the sale price of the product becomes P (1 + φ).
Industrial enterprises sell their products to target markets. The “iceberg trade costs” in the NEG framework refers to the fact that if an enterprise transports one unit of product to a target market, it must transport at least 1 + τ units of the product. In this study, τ indicates the trade costs in a broad sense and includes not only the tangible transportation costs caused by the visible transportation networks, but also the intangible transportation costs caused by invisible regional trade barriers, such as local protectionism and market segmentation. Therefore, if the “free on board” (FOB) price of enterprises in production sites is P (1 + φ), then the sale price in target markets will be P (1 + φ)(1 + τ). The larger the value of τ is, the higher the prices will be in the target markets. This will reduce product demand and thereby the profits of the enterprises.
According to the NEG theory, important sources of increasing returns to scale are the diverse preferences of the consumers. The stronger the variances in consumer preferences was, the greater the degree of increasing returns to scale will be. Moreover, following the NEG framework, the degrees of differentiation in the products produced by the industrial enterprises can be represented by σ, which indicates the elasticity of substitution between the products. For example, the smaller the σ is, the greater the differences between products will be. Higher final product differentiation levels will increase the monopoly of each enterprise, which will then lead to more industrial agglomeration. Therefore, the demands for diversity by consumers can be considered to be related to the levels of industrial agglomeration, and together they decide the demand scale of a region. This study used the constant elasticity of substitution (CES) function to represent the demands for industrial products in the target market as follows:
d = ( h i = 1 n c i σ 1 σ ) σ σ 1
where d represents the demand scale in the target market, ci indicates the consumption level of each available product, and σ > 1 and n denote the number of varieties of industrial products. The above-mentioned analysis indicated that the demand levels in the target markets were related to the levels of the regional industrial agglomerations.
The revenue of a representative firm was calculated in this study as follows:
T R = k P ( 1 + ϕ ) ( 1 + τ ) d T R = k P ( 1 + ϕ ) ( 1 + τ ) d
where TR represents the revenue, and k is a constant.
As rational firms, the goal of enterprises is to maximize their profits, which can be expressed as follows:
M a x { π = T R T C = k P ( 1 + ϕ ) ( 1 + τ ) ( h i = 1 n c i σ 1 σ ) σ σ 1 ( h η / ( 1 η ) ω o ) 1 σ ( h η / ( 1 η ) n o ) σ [ α + β ( h q 0 ( 1 e ) ) 1 / ( 1 e ) ] }
The first order condition determining the optimal level of industrial agglomeration can be written as follows:
d ( π ) d h = 0 d ( π ) d h = 0
Then, by reshaping the above formula, the optimal level of industrial agglomeration, h, as an implicit function can be obtained:
h = h ( ω , n , ϕ , τ , σ ) h = h ( ω , n , ϕ , τ , σ )
Local government competition and market segmentation are two other factors affecting industrial agglomeration in China. They are considered to be common phenomena. Since the goal of enterprises is to pursue the maximization of the benefits of the agglomeration economies, this study incorporated local government competition (c) and market segmentation (s) into Formula (9), which was then rewritten as follows:
h = h ( w , n , φ , τ , σ , c , s ) h = h ( w , n , φ , τ , σ , c , s )
The formula revealed that the levels of industrial agglomeration in China are mainly determined by the following seven factors: the costs of water resources, costs of land resources, environmental damage levels, interregional trade costs (including transaction and transportation costs), demand scales, local government competition, and market segmentation.

4.2. Empirical Model

The aforementioned theoretical analysis results clarified that the agglomeration levels of industrial enterprises are mainly affected by seven factors under the conditions of monopolistic competition. In the present study, a corresponding general theoretical model was constructed. However, the above-mentioned theoretical model had not clarified the proxy indicators of each factor, nor did it provide a specific measurement model for the empirical analysis. Therefore, based on the aforementioned theoretical model, this study further proposed an empirical model for the purpose of analyzing the impact mechanisms of the resource shortages and environmental damage degrees on the agglomeration behavior of a single industrial enterprise. The specific measurement methods of each factor and its descriptive statistical results were also illustrated.
In recent years, faced with a dual background of fiscal decentralization (vertical competition) and inter-region competition (horizontal competition), Chinese local governments have come to play crucial roles in regional industrial agglomerations. Market segmentation and local government competition are both known to directly impact regional industrial agglomeration through their respective interactions with resource shortages and environmental damages. Therefore, in order to empirically estimate the effects of land and water resource shortages and environmental damage degrees on industrial agglomerations under the presence of government influence, an econometric analysis was performed in this study using the following formula:
H i t = α + β E n i t + γ R e i t + δ G o i t + φ G o i t E n i t + θ G o i t R e i t + η X i t + ε i t H i t = α + β E n i t + γ R e i t + δ G o i t + φ G o i t E n i t + θ G o i t R e i t + η X i t + ε i t
where i represents the region; t denotes time; En indicates the measured environmental damages; Re represents the measured resource constraints; G o G o denotes the governmental influences, including local government competition ( C o C o ) and market segmentation ( F r F r ); X X represents the control variables, including demand scale ( D s D s ), trade costs ( T c T c ), scale economies (Se), and so on; and φ and θ indicate whether the effects of the environmental damages and resource constraints are more severe in the regions where local government competition and market segmentation are more intense.
Since this study utilized provincial-level data instead of corporate-level data, it was necessary that the data of the individual industrial enterprises be aggregated to that of a province. Table 1 provides the definition, measurements, and descriptions of the variables used in this study’s empirical model.
Since China began its reform and opening up processes, the implementation of economic reforms and initiatives to attract more capital investments have been the priorities of local governments. Therefore, local government competition processes tend to concentrate on obtaining more investments in order to enhance their competitive advantages [36]. This study used the degree of openness defined by FDI/GDP to measure the local government competition levels. The higher the degree of openness in a region is, the stronger the local government competition will be. In addition, with a stronger local government competition level, it becomes easier to attract industrial production factors to concentrate in a region, and this effect could potentially raise the level of industrial agglomeration in the region.
Regional market segmentation is another variable known to be influenced by government behaviors. Fragmentary and segmented markets across regions are serious problem in China. The existing research reports have revealed that market segmentation now has an inverted U-shaped effect on local economic growth. In other words, when market segmentation degrees are low, local economic growth can be improved. However, if the degrees of market segmentation exceed a certain critical value, economic growth will be negatively affected [37]. Therefore, it can be concluded that regional market segmentation obviously affects regional industrial agglomeration levels. This study adopted the method introduced by Fu and Qiao (2011) to measure the inter-provincial market segmentation [38]. The retail price indices of each area listed in the China Statistical Yearbook were utilized to construct the variances of the relative prices of a region compared to all other Chinese regional prices, in order to represent the degrees of market segmentation for example, V a r ( P i t / P j t ) .
In addition, the ratio of the total regional consumption to national consumption was used to measure the regional demand scale. In accordance with the NEG theory, industrial enterprises usually tend to be located in areas of major market potential [39]. Krugman argued that the locations of demand determine the locations of production, and in turn the locations of production also determine the locations of demand [40]. This type of positive feedback mechanism and circular causality tend to make the production and demand highly concentrated. Therefore, it was considered that the regional demand scales will determine the levels of regional industrial agglomeration. Considering that the total local consumption of a region (including residents’ consumption, government consumption, and gross capital formation) sufficiently reflect its demand scale, this study adopted the ratio of the total regional consumption to the national consumption as a reflection of the regional demand scale.
In addition, the following variables were used in this study to measure the regional environmental damage costs. Environmental damage costs are expenses paid by industrial enterprises as a part of their environmental protection responsibility. It has been found that environmental damage costs are positively correlated with the volume of pollutant emissions. In this research investigation, the ratio between the volume of industrial solid waste, COD emissions, and sulfur-dioxide emissions at the regional level and that of the national level was used as the proxy variable of the environmental damage costs of land, water, and atmosphere, respectively. The final environmental damage costs were then assumed to be the sum of the environmental damage costs of land, water, and atmosphere.
The following variables were adopted in this study to measure the costs of the land and water resources for a region. In order to measure the input costs of water resources, the water consumption per unit of industrial added value in a region were used. Furthermore, in order to measure the input costs of land resources, this study used the areas of land delegated for habitation, mining, and manufacturing per unit of industrial added value in a region. The sum of these two measurements were the input costs of the land and water resources.
Finally, since it was very difficult to directly measure the transaction and transportation costs for each region, this study used the proportion of cities owned by the regions within the entire country as a proxy variable for the regional transaction costs [41]. The proxy variable for the regional transportation costs was the average of the sum of shares of the overall highway mileage and railway operating mileage in a region. The trade costs were the sum of the transaction costs and transportation costs.
In the current study, in order to reduce the potential bias caused by the omission of other influencing factors, a control variable was added into the estimation model, representing the scale economies in the NEG framework. In essence, the forces that could potentially result in the unbalanced distributions of industries and industrial agglomerations were considered to be the economies of scale, transport costs, market sizes, and correlation effects [40]. Since the economies of scale played a very important role, this factor was compulsorily included in the empirical analysis. The proxy variable of the economies of scale was calculated as the ratio of the share of the industrial output (current prices) of the regional industrial enterprises in the total national industrial output to the share of the number of regional industrial enterprises in the total national number. The definitions and descriptive statistics of the variables used in this study’s estimation model are presented in Table 1.

5. Econometric Analysis Results

5.1. Empirical Results

Based on the balanced panel data at the provincial level, the impact of China’s land and water resource shortage and environmental damage on industrial agglomeration were analyzed using an OLS model. During the construction of the static panel model, the choices of the fixed effects or random effects were dependent on the results of the Hausman statistical data. The Hausman tests of regression models (1), (3), and (5) rejected the null hypothesis at a 1% significance level, and a fixed effect model was suggested.
As can be seen in Table 2, the results of the empirical estimations indicated that the scales of the regional demands had significant impacts on the levels of industrial agglomeration. The majority of those impacts were observed to be positive across the different regression models, even though the impacts were relatively small. The results also revealed that when the demand scale increased by 1%, the level of industrial agglomeration increased by between 0.0012 and 0.0323%. This suggested that, as emphasized by the NEG theory, the scales of the regional demands in China also played major roles in promoting the levels of industrial agglomeration. However, when compared with the results obtained several years ago [28], the impacts of the regional demands on industrial agglomeration were observed to have weakened.
In the current study, with the exception of Regression Models (2) and (3), the effects of the economies of scale on the industrial agglomeration levels were not found to be significant. One possible reason for these findings was that with the increases in the levels of regional industrial agglomeration, the motivation of the industrial enterprises to further agglomerate to the existing industrial clusters in order to obtain economies of scale had been greatly weakened. Meanwhile, the motivation of the industrial enterprises to obtain other types of agglomeration economic benefits had gradually increased. In addition, the results obtained in this study indicated that the effects of the economies of scale on the industrial agglomeration levels were significant and negative in Models (2) and (3). This suggested that, contrary to the predictions of NEG theory, the regional economies of scale had inhibitory effects on China’s industrial agglomeration levels. A possible reason for this was that since the expansion of the economies of scale may have led to a surge in regional enterprise production costs, companies may have fled the agglomerations, which in turn would have led to a decrease in the levels of industrial agglomeration in the regions.
The goal of this study was mainly to examine the impacts of water and soil resource shortages and environmental damage degrees on the industrial agglomeration levels. Therefore, the focus was placed on analyzing those effects. In terms of the relationships between the resource costs and the levels of industrial agglomeration, it could be determined from all the regression models that the costs of land and water resources had slightly significant negative impacts on the industrial agglomeration levels. However, their effects were generally rather small, with coefficients ranging from −0.0038 to −0.0003. These findings indicated that while China’s regional industrial agglomerations still faced some constraints on land and water resources, those constraints were not as serious as previously thought. However, the effects of environmental damage costs on the levels of industrial agglomeration were significant in all of the regression models, with the exception of Regression Model (6), and the effects were all negative. It was observed that when the environmental damage costs increased by 1%, the level of regional industrial agglomeration decreased by between 0.2031% and 0.0087%. Therefore, it was concluded that the effective constraints of the environmental damages on the regional industrial agglomerations were far more pronounced than those of the resource shortages.
In order to examine whether or not conditional effects existed, this study applied the interaction terms En*Co and Re*Co in Regression Model (5) for the purpose of determining if environmental damages and resource shortages were more relevant in regions where local government competition and market segmentation were more severe. The results showed that the effects of resource costs and environmental damage costs on the levels of industrial agglomeration were significantly reduced by increases in local government competition. Therefore, considering that the coefficient of En*Co was significantly negative, it was indicated that the effects of environmental damages were greater at higher levels of government competition, resulting in decreases in industrial agglomeration levels. The coefficient of Re*Co was also significantly negative, but the results were relatively small. Consequently, the effects of the local government competition were also observed to intensify the impacts of resource shortages resulting in decreases in the levels of industrial agglomeration. Another focus of interest in this study was the local government competition levels. Although the effects were not significant in Models (3) and (4), the local government competition had a significant and negative effect on the regional levels of industrial agglomeration considering the interaction term of En*Co. In contrast, as far as the regional market segmentation was concerned, its effects on the regional levels of industrial agglomeration in the other four regression models were not found to be significant.
It was observed in this study that, unlike the local government competition, the coefficients of En*Fr and Re*Fr were both positive and insignificant. This indicated that the effects of the resource costs and environmental damage costs on the levels of industrial agglomeration had not changed significantly with changes in regional market segmentation. Generally speaking, the regional market segmentation had affected neither the levels of the regional industry agglomeration through direct channels nor the levels of regional industry agglomeration through the indirect channels of resource shortages and environmental damages. This may have been associated with the significant progress which had been made with regard to China’s market-oriented reforms. It also reflected China’s diminished regional market segmentation when compared to that of the 1980s and 1990s.

5.2. Robustness Check

Considering the interactive impacts between the industrial agglomerations and the resource shortages and environmental damage levels, this study employed the Hausman test to check the endogeneity of the explanatory variables. Table 2 shows that the P-values of En and Re were 0.00, which indicated that the variables representing the resources and the environment were endogenous. The method proposed by Ciccone and Hall (1996) was applied, which included using one-period lagged variables as the instrumental variables [42].
Then, in order to test the robustness of the regression results, a unit root test of the residuals was carried out. It was found that if the residuals were a unit root process, rather than a steady process, the parameter estimators could be the spurious regression results. In this study, the LLC unit root test was chosen in the cases of the same root, and the Fisher–PP unit root test was applied in the cases of different roots. As detailed in Table 2, it was indicated that all of the unit root tests had rejected the null hypothesis of the presence of a residual unit root at a 1% significant level. These findings indicated that the panel residual was smooth and the specifications of all the models were appropriate. Therefore, the estimation results were considered to be robust.
Moreover, there is a strong correlation observed between the interaction term and its constituents, which had led to a multicollinearity problem. To that end, this study selected the explanatory variables from the interaction term minus the sample mean in order to obtain new explanatory variables, and then constructed new interactive terms. Following the transformation, the correlation between the new explanatory variables and the new interactive terms was eliminated [43].

6. Conclusions and Discussion

Forty years have passed since China began its economic reforms and opened up its economy to the world. However, at the present time, China’s industrial economy features various prominent obstacles which increase the uncertainties of the development of industrial agglomerations. Among those obstacles, land and water resource shortages and environmental damages are considered to be the greatest problems. Resource shortages and environmental damages are common phenomena during the process of economic development in developing countries and regions. During the course of rapid industrialization and urbanization, problems related to land and water resource shortages and environmental damages tend to become increasingly evident. These issues have developed into major constraining factors for regional industrial agglomeration in China.
Using the New Economic Geography framework and the provincial-level data from China during the period ranging from 2001 to 2016, this study empirically examined the issue of whether resource shortages and environmental damages impose constraints on industrial agglomeration in the presence of local government competition and regional market segmentation.
The results obtained in this study indicated the following:
(1) The costs of land and water resources have significantly negative impacts on industrial agglomeration. However, their effects are rather minor. Meanwhile, the effects of environmental damage costs on the levels of industrial agglomeration are significant and negative, and their effects are rather large;
(2) The negative effects of resource costs and environmental damage costs on the levels of industrial agglomeration were observed to increase significantly with increases in local government competition. Therefore, local government competition levels can potentially intensify the respective effects of environmental damages and resource shortages resulting in decreases in the levels of industrial agglomeration;
(3) The effects of the resource costs and environmental damage costs on the levels of industrial agglomeration did not change significantly with changes in the regional market segmentation. Therefore, market segmentation can neither directly affect the levels of regional industrial agglomeration nor indirectly affect the levels of regional industrial agglomeration through impacting resource shortages and environmental damage levels.
Based on the results obtained in this research investigation, it is considered that the following aspects are worthy of further deepening and improvement:
In terms of the theoretical framework, this study focused on the identification of the main factors which affect industrial agglomeration levels. However, it did not identify the specific influence mechanisms of the various factors on the industrial agglomeration levels. The latter will be one of the future research directions. In regard to the research scale, the current research was based on the provincial scale, which was somewhat large. In the future, the impacts of resource shortages and environmental damages on industrial agglomeration levels should be investigated from the scale of prefecture-level cities, which have smaller spatial scales and more available sampling data. In addition, this study was restricted by the availability of data. Therefore, many of the variables in the study were measured by proxy indicators, such as En1it, En2it, and so on. This may have affected the accuracy of the evaluation results. However, the obtained results are considered to also be the best results that could be achieved under the existing conditions. In the future, as the availability of data improves, all of these deficiencies will be addressed.

Author Contributions

Conceptualization, Y.Z. and Y.L.; methodology, Y.L. and Y.Z.; software, Y.W. and L.L.; validation, Y.W. and L.L.; formal Analysis, Y.L.; resources, Y.W. and L.L.; data curation, Y.W. and L.L.; writing—original draft preparation, Y.Z. and Y.L.; writing—review & editing, Y.L.; supervision, Y.Z. and Y.L.; project administration, Y.Z. and Y.L. All authors have read and agreed to the published version of the manuscript.

Funding

This research was supported by Cultural Experts and “Four batch” Talents Independently Selected Topic Project [ZXGZ[2018]86], the National Social Science Foundation of China [20BJL106], and the Natural Science Foundation of China [No. 41901205].

Institutional Review Board Statement

Not applicable.

Informed Consent Statement

Not applicable.

Data Availability Statement

The data presented in this study are available on request from the corresponding author. The data are not publicly available due to restrictions of privacy.

Conflicts of Interest

The authors declare no conflict of interest.

Appendix A. Industries Used in the Construction of HHI

GB/T 4754-2002 Industrial Classification for National Economic ActivitiesChina Industrial Statistics YearbookIndustries Used in the Construction of HHI
06 Mining and washing of coalMining and washing of coalMining and washing of coal
07 Extraction of petroleum and natural gasExtraction of petroleum and natural gasExtraction of petroleum and natural gas
08 Mining and processing of ferrous metal oresMining and processing of ferrous metal oresMining and processing of ferrous metal ores
09 Mining and processing of non-ferrous metal oresMining and processing of non-ferrous metal oresMining and processing of non-ferrous metal ores
10 Mining and processing of nonmetal oresMining and processing of nonmetal ores
11 Mining of other ores
13 Processing of food from agricultural productsProcessing of food from agricultural productsProcessing of food from agricultural products
14 Manufacture of foodsManufacture of foodsManufacture of foods
15 Manufacture of beveragesManufacture of beveragesManufacture of beverages
16 Manufacture of tobaccoManufacture of tobaccoManufacture of tobacco
17 Manufacture of textilesManufacture of textilesManufacture of textiles
18 Manufacture of textile, apparel, footwear, and capsManufacture of textile, apparel, footwear, and caps
19 Manufacture of leather, fur, feather, and related products
20 Processing of timber, manufacture of wood, bamboo, rattan, palm, and straw products
21 Manufacture of furniture
22 Manufacture of paper and paper productsManufacture of paper and paper productsManufacture of paper and paper products
23 Printing and recorded media
24 Manufacture of articles for culture, education, and sport activity
25 Processing of petroleum, coking, processing of nuclear fuelProcessing of petroleum, coking, processing of nuclear fuelProcessing of petroleum, coking, processing of nuclear fuel
26 Manufacture of chemical raw materials and chemical productsManufacture of chemical raw materials and chemical productsManufacture of chemical raw materials and chemical products
27 Manufacture of medicinesManufacture of medicinesManufacture of medicines
28 Manufacture of chemical fibersManufacture of chemical fibersManufacture of chemical fibers
29 Manufacture of rubber
30 Manufacture of plastics
31 Manufacture of non-metallic mineral productsManufacture of non-metallic mineral productsManufacture of non-metallic mineral products
32 Smelting and processing of ferrous metalsSmelting and pressing of ferrous metalsSmelting and pressing of ferrous metals
33 Smelting and pressing of non-ferrous metalsSmelting and processing of ferrous metalsSmelting and processing of ferrous metals
34 Manufacture of metal productsManufacture of metal productsManufacture of metal products
35 Manufacture of general purpose machineryManufacture of general purpose machineryManufacture of general purpose machinery
36 Manufacture of special purpose machineryManufacture of special purpose machineryManufacture of special purpose machinery
37 Manufacture of transport equipmentManufacture of transport equipmentManufacture of transport equipment
38 Manufacture of railway, ship, aerospace, and other transport equipment
39 Manufacture of electrical machinery and equipmentManufacture of electrical machinery and equipmentManufacture of electrical machinery and equipment
40 Manufacture of communication equipment, computers, and other electronic equipmentManufacture of communication equipment, computers, and other electronic equipmentManufacture of communication equipment, computers, and other electronic equipment
41 Manufacture of measuring instruments and machinery for cultural activity and office workManufacture of measuring instruments and machinery for cultural activity and office workManufacture of measuring instruments and machinery for cultural activity and office work
42 Manufacture of artwork and othermanufacturing
43 Recycling and disposal of waste
44 Production and distribution of electric power and heat powerProduction and distribution of electric power and heat powerProduction and distribution of electric power and heat power
45 Production and distribution of gas
46 Production and distribution of tap water

References

  1. National Bureau of Statistics. China Statistical Yearbook; Statistics Press: Beijing, China, 2020. [Google Scholar]
  2. Jiang, Y. China’s water scarcity. J. Environ. Manag. 2009, 90, 3185–3196. [Google Scholar] [CrossRef]
  3. Krugman, P. Increasing Returns and Economic Geography. J. Political Econ. 1991, 99, 483–499. [Google Scholar]
  4. Fujita, M.; Krugman, P. When is the economy monocentric: Von Thiinen and Chamberlin unified? Reg. Sci. Urban Econ. 1995, 25, 505–528. [Google Scholar] [CrossRef]
  5. Rosenthal, S.S.; Strange, W.C. The determinants of agglomeration. J. Urban Econ. 2001, 50, 191–229. [Google Scholar] [CrossRef] [Green Version]
  6. Kim, S. Regions, resources, and economic geography: Sources of U.S. regional comparative advantage, 1880-1987. Reg. Sci. Urban Econ. 1999, 29, 1–32. [Google Scholar] [CrossRef] [Green Version]
  7. Ellison, G.; Glaeser, E.L. The geographic concentration of industry: Does natural advantage explain agglomeration? Am. Econ. Rev. 1999, 89, 311–316. [Google Scholar] [CrossRef] [Green Version]
  8. Ellison, G.; Glaeser, E.L. Geographic Concentration in U.S. Manufacturing Industries: A Dartboard Approach. J. Political Econ. 1997, 105, 889–927. [Google Scholar] [CrossRef] [Green Version]
  9. Wang, Y.; Jin, C.; Lu, M.Q.; Lu, Y.Q. Assessing the suitability of regional human settlements environment from a different preferences perspective: A case study of Zhejiang Province, China. Habitat Int. 2017, 70, 1–12. [Google Scholar] [CrossRef]
  10. Wu, Y.; Pu, Y.J. Studies of welfare effects and countermeasures of negative externalities of regional excessive agglomeration: The simulation analysis based on the method of Spatial Economics. J. Financ. Econ. 2008, 34, 106–115. [Google Scholar]
  11. Qiu, Z.Y. The effect of agglomeration of international vertical specializations on China’s environment. Acad. Forum. 2012, 35, 121–124. [Google Scholar]
  12. Yang, L.Q.; Li, W.N. Agglomeration externalities, environment technical efficiencies and energy saving. Soft Sci. 2011, 25, 14–19. [Google Scholar]
  13. Yan, P.Z.; Su, L.; Qiao, J. Investigation of the relationship of industrial agglomeration development and environmental pollutions: Evidence from Chinese manufacturing. Stud. Sci. Sci. 2011, 29, 79–83. [Google Scholar]
  14. Chisholm, M. In Search of a Basis for Location Theory: Microeconomics or Welfare Economics? Prog. Geogr. 1997, 3, 111–133. [Google Scholar]
  15. Smith, D.M. Human Geography: A Welfare Approach; Edward Arnold: London, UK, 1997. [Google Scholar]
  16. Bale, J. Externality Gradients. Area 1978, 10, 334–336. [Google Scholar]
  17. Murata, K. The Limits of Regional Agglomeration and Social Cost. In Contemporary Industrialization; Hamilton, F.E.I., Ed.; Longman: London, UK, 1978. [Google Scholar]
  18. Siebert, H. Spatial Aspects of Environmental Economics. In Handbook of Natural Resource and Energy Economics; Kneese, A.V., Sweeney, J.L., Eds.; Elsevier: Amsterdam, The Netherlands, 1985; Volume 1. [Google Scholar]
  19. Markusen, J.R.; Morey, E.R.; Olewiler, N. Non-cooperative equilibria in regional environmental policies when plant locations are endogenous. J. Public Econ. 1995, 56, 55–77. [Google Scholar] [CrossRef]
  20. Rauscher, M. Environmental regulation and the location of polluting industries. Int. Tax Public Financ. 1995, 2, 229–244. [Google Scholar] [CrossRef] [Green Version]
  21. Hoel, M. Environmental policy with endogenous plant locations. Scand. J. Econ. 1997, 99, 241–259. [Google Scholar] [CrossRef]
  22. Pflüger, M. Ecological dumping under monopolistic competition. Scand. J. Econ. 2001, 103, 689–706. [Google Scholar] [CrossRef]
  23. Rauscher, M. Hot Spots, High Smokestacks, and the Geography of Pollution. Paper Presented at the World Congress of Environmental and Resource Economists in Venice, 1998. Available online: http://www.feem-web.it/worldcongress/abs2/rausch2.html (accessed on 15 April 2021).
  24. Rauscher, M. Concentration, separation, and dispersion: Economic geography and the environment. Thünen-Series of Applied Economic Theory. Working Paper No. 109, 2009. Available online: https://www.econstor.eu/bitstream/10419/39752/1/610730487.pdf (accessed on 15 April 2021).
  25. Elbers, C.; Withagen, C. Environmental policy, population dynamics and agglomeration. Contrib. Econ. Anal. Policy 2004, 3. [Google Scholar] [CrossRef]
  26. Van Marrewijk, C. Geographical economics and the role of pollution on location. ICFAI J. Environ. Econ. 2005, 3, 28–48. [Google Scholar] [CrossRef] [Green Version]
  27. Lange, A.; Quaas, M.F. Economic geography and the effect of environmental pollution on agglomeration. B.E. J. Econ. Anal. Policy 2007, 7, 52. [Google Scholar]
  28. Zhu, Y.M.; Yang, L.S.; Lü, H.J.; Shen, X. Study of resource shortage, environmental damage and effect on industrial agglomeration: Based on empirical analysis of provincial level industries of China in 21st century. Manag. World 2012, 11, 28–44. [Google Scholar]
  29. Fan, C.C.; Scott, A.J. Industrial agglomeration and development: A survey of spatial economic issues in East Asia and a statistical analysis of Chinese regions. Econ. Geogr. 2003, 79, 295–319. [Google Scholar] [CrossRef]
  30. Zhu, Y.M. Scale economy, technical changes and total factor productivity in regional manufacturing industry: Effect analysis of industrial clusters. J. Quant. Tech. Econ. 2009, 29, 3–18. [Google Scholar]
  31. Zhang, B.; Lu, D.; He, Y.; Chiu, Y. The efficiencies of resource-saving and environment: A case study based on Chinese cities. Energy 2018, 150, 493–507. [Google Scholar] [CrossRef]
  32. Wu, W.; Niu, S. Evolutional analysis of coupling between population and resource-environment in China. Procedia Environ. Sci. 2012, 12, 793–801. [Google Scholar] [CrossRef] [Green Version]
  33. Chen, Q.; Ai, H.; Zhang, Y.; Hou, J. Marketization and water resource utilization efficiency in China. Sustain. Comput. Inform. Syst. 2019, 22, 32–43. [Google Scholar] [CrossRef]
  34. Tabata, M.; Eshima, N. A population explosion in an evolutionary game in spatial economics: Blow up radial solutions to the initial value problem for the replicator equation whose growth rate is determined by the continuous Dixit–Stiglitz–Krugman model in an urban setting. Nonlinear Anal. Real World Appl. 2015, 23, 26–46. [Google Scholar] [CrossRef]
  35. Aspremont, D.C.; Dos Santos Ferreira, R. The Dixit–Stiglitz economy with a ‘small group’ of firms: A simple and robust equilibrium markup formula. Res. Econ. 2017, 71, 729–739. [Google Scholar] [CrossRef] [Green Version]
  36. Zhou, Y.A.; Feng, X.Y.; Zhao, J.Y. Local government competitions and the reconstruction of market orders. Soc. Sci. China 2004, 1, 56–65. [Google Scholar]
  37. Lu, M.; Chen, Z. The economic growth of segmentation markets: Why economic opening may aggravate local protection? Econ. Res. J. 2009, 3, 42–52. [Google Scholar]
  38. Fu, Q.; Qiao, Y. How government competitions promote China’s rapid economic growth: Further discussion of market segmentation and economic growth. J. World Econ. 2011, 7, 43–63. [Google Scholar]
  39. Krugman, P.; Venables, A.J. Globalization and the Inequality of Nations. Q. J. Econ. 1995, 110, 857–880. [Google Scholar] [CrossRef]
  40. Krugman, P. Geography and Trade; MIT Press: Cambridge, UK, 1991. [Google Scholar]
  41. Wen, M. Regional repositioning and agglomeration of China’s industries. Econ. Res. J. 2004, 3, 84–94. [Google Scholar]
  42. Ciccone, A.; Hall, R. Productivity and the density of economic activity. Am. Econ. Rev. 1996, 86, 54–70. [Google Scholar]
  43. Xie, Y. Regression Analysis; Social Sciences Academic Press: Beijing, China, 2010. [Google Scholar]
Figure 1. Changes over time in China’s HHI, RRSI, and REDI for the period ranging from 2001 to 2016.
Sustainability 13 05428 g001
Table 1. Definition and Descriptive Statistic of Variables.
VariableVariable DefinitionData SourceMean Standard Deviation
Level of industrial agglomeration(Hit)Hirschman-Herfindahl index(HHI)China Industry Economy Statistical Yearbook, 2002 to 20170.72310.6368
Demand scale(Dsit)The proportion of regional domestic consumption in ChinaChina Statistical Yearbook, 2002–20171.01770.7580
Environmental damage costs(Enit)The sum of environmental damage costs of land, water and atmosphere China Statistical Yearbook, 2002–20170.96770.0584
Resource input costs(Reit)The sum of input costs of land and water resourcesChina Statistical Yearbook, 2002–2009, 2011–2017; China Land and Resources Statistical Yearbook, 20172.93772.2130
Trade costs(Tcit)The sum of transaction costs and transport costsChina City Statistical Yearbook, 2002–20170.09680.0487
Local government competition(Coit)FDI/GDPChina Statistical Yearbook, 2002–20170.05760.0714
Regional market segmentation(Frit)Relative price variance V a r ( P i t / P j t ) V a r ( P i t / P j t ) China Statistical Yearbook, 2002–2017 and other data0.00010.0012
Economies of scale(Seit)The ratio of the total industrial output value to the national share and the number of industrial enterprises to the national shareChina Industry Economy Statistical Yearbook, 2002–20171.09110.3371
Table 2. Empirical estimation of the effects of China’s land and water resource shortage and environmental damage on industrial agglomeration.
Explanatory VariablesExplained Variables H
(1)(2)(3)(4)(5)(6)
C0.1351 ***
(0.0226)
0.0641 ***
(0.0114)
0.0778 ***
(0.0052)
0.0604 ***
(0.0141)
0.1405 ***
(0.0237)
0.0543
(0.0364)
En−0.1746 **
(0.0864)
−0.0993 **
(0.0450)
−0.0087 *
(0.0174)
−0.0843 **
(0.0475)
−0.2031 **
(0.0909)
0.0886
(0.0856)
Re−0.0017 *
(0.0016)
−0.0003 *
(0.0004)
−0.0004 *
(0.0003)
−0.0003 *
(0.0004)
−0.0038 *
(−0.0038)
−0.0028 *
(0.0046)
Tc−0.4206 **
(0.1928)
−0.1064
(0.1078)
−0.0133
(0.0449)
−0.0804
(0.1259)
−0.2936
(0.1958)
−0.1953
(0.1217)
Se−0.0026
(0.0057)
−0.0026 **
(0.0013)
−0.0030 ***
(0.0009)
−0.0021
(0.0021)
0.1957
(0.0058)
0.0003
(0.0054)
Ds0.0028 *
(0.0026)
0.0323 ***
(0.0084)
0.0012 *
(0.0009)
0.0304 ***
(0.0080)
0.0039 **
(0.0038)
0.0303 **
(0.0223)
Co 0.0016
(0.0033)
−0.0026
(0.0128)
−0.2061 ***
(0.0660)
0.1735
(0.1413)
Fr 0.0573
(0.1332)
9.6795
(29.0268)
−0.7812
(16.9062)
0.1413
(50.0465)
En*Co −3.1225 ***
(0.9755)
−2.3268
(0.01658)
Re*Co −0.0256 ***
(0.0228)
−0.0166
(0.01658)
En*Fr 320.3710
(372.5401)
134.2451
(940.3537)
Re*Fr 372.5401
(12.0955)
23.7200
(38.9044)
The number of samples496465496465496465
Regression methodLSTSLSLSTSLSLSTSLS
Adjusted R-squared0.95820.96400.95970.95960.95930.9643
Hausman statistics
(H0: Random effects)
23.1209 *** 28.2763 *** 49.1567 ***
Hausman P-value
(H0: Exogenous resource environment variables)
0.000 0.000 0.000
LLC statistics
Fisher-PP statistic
(H0: Unit root)
−9.7085 ***
155.290 ***
−3.5582 ***
225.405 ***
−9.0254 ***
166.873 ***
−4.6606 ***
228.492 ***
−7.1665 ***
193.825 ***
−5.4219 ***
223.825 ***
Note: *, ** and *** are respectively significant at the level of p < 0.05, p < 0.01 and p < 0.001. The numbers in parentheses are standard errors.
Publisher’s Note: MDPI stays neutral with regard to jurisdictional claims in published maps and institutional affiliations.

